
M-SKSNet: Multi-Scale Spatial Kernel Selection for Image Segmentation of Damaged Road Markings
by
 , ,
, ,
Junwei Wang
1,2,
Xiaohan Liao
1,*,
Yong Wang
1,
Xiangqiang Zeng
1,2,
Xiang Ren
1,
Huanyin Yue
1 and
Wenqiu Qu
1,2 1
State Key Laboratory of Resources and Environmental Information System, Institute of Geographic Sciences and Natural Resources Research, Chinese Academy of Sciences, Beijing 100101, China
2
University of Chinese Academy of Sciences, Beijing 100049, China
*
Author to whom correspondence should be addressed.
Remote Sens. 2024, 16(9), 1476; https://doi.org/10.3390/rs16091476
Submission received: 25 January 2024
/
Revised: 6 April 2024
/
Accepted: 15 April 2024
/
Published: 23 April 2024
(This article belongs to the Special Issue Advanced Application of Artificial Intelligence and Machine Vision in Remote Sensing III)
Abstract
:It is a challenging task to accurately segment damaged road markings from images, mainly due to their fragmented, dense, small-scale, and blurry nature. This study proposes a multi-scale spatial kernel selection net named M-SKSNet, a novel model that integrates a transformer and a multi-dilated large kernel convolutional neural network (MLKC) block to address these issues. Through integrating multiple scales of information, the model can extract high-quality and semantically rich features while generating damage-specific representations. This is achieved by leveraging both the local and global contexts, as well as self-attention mechanisms. The performance of M-SKSNet is evaluated both quantitatively and qualitatively, and the results show that M-SKSNet achieved the highest improvement in F1 by 3.77% and in IOU by 4.6%, when compared to existing models. Additionally, the effectiveness of M-SKSNet in accurately extracting damaged road markings from images in various complex scenarios (including city roads and highways) is demonstrated. Furthermore, M-SKSNet is found to outperform existing alternatives in terms of both robustness and accuracy.
1. Introduction
Road markings play a crucial role in road traffic, conveying information about the road structure, direction, restrictions, and warnings to drivers and pedestrians. However, they are prone to damage over time, resulting in reduced visibility and recognizability, which can adversely affect road safety and smoothness [1,2]. Therefore, promptly detecting and repairing damaged road markings is essential. Although manual inspection and comprehensive detection vehicles are currently the primary methods used for detecting road marking damage [3], they suffer from drawbacks, such as low efficiency, high cost, and the need for road closures [4,5,6].
Recent advancements in remote sensing technologies, such as vehicle-mounted scanning and drones, have provided new opportunities for road marking detection [7]. These technologies offer advantages, such as rich spatial information and flexibility [8,9], making them promising for detecting damaged road markings from high-resolution optical images. However, this task faces challenges, such as target fracture, dense and small-scale markings, and blurred boundaries. Hence, developing an efficient, accurate, and automatic road marking damage detection method is of great theoretical significance and practical value. With the rapid progress in deep learning technology, various efficient image segmentation methods have emerged, including U-Net [8], PSPNet [9], LinkNet [10], ResNeSt [11], ConvNeXt [12], SegFormer [13], and others [12,13,14,15,16,17,18]. These methods are designed for typical application scenarios, such as vehicle recognition, medical imaging, lane line detection, and so on; however, none of these methods adequately address the challenges posed by damaged road markings. Existing approaches to pavement damage detection, such as those utilizing GPR investigation and direct classification frameworks, are not directly applicable due to the distinct characteristics of damaged road markings [14,15].
To address the limitations of existing methods, it is crucial to obtain strong semantic representation at both local and global levels and to consider the dynamic context information acquisition required for different damage types. Transformer-based methods have shown promising results in the effective modeling of remote dependencies [15,16]. However, they have limitations in dense prediction tasks due to their inability to model the local visual structure and scale-invariant representation. In contrast, convolutional neural networks (CNNs) excel at extracting local features and possess scale invariance [14,17,18]. We propose a novel method that integrates CNN and transformer models to leverage their strengths and overcome their weaknesses, thus enhancing the detection of damaged road markings. By adopting a multi-scale spatial selection mechanism, our method can effectively handle the challenges of fragmented, small-scale, and blurry markings in road images.
The performance of deep learning segmentation models heavily depends on the quality and diversity of the training data set. While existing road damage data sets, such as ISTD-PDS7 [19], provide valuable resources, data sets are scarcely specifically focused on damaged road marking detection, particularly for Chinese roads. Hence, we introduce the Chinese Damaged Road Marking data set (CDM data set), which enhances research in this area.
In summary, this study makes the following contributions:
- M-SKSNet (multi-scale spatial kernel selection net): a new image segmentation network that effectively processes various object sizes through combining CNN and transformer architectures with a dynamic kernel.
- CDM data set (Chinese Damaged Road Marking data set): The first extensive data set for Chinese road scenes, enhancing research on road damage detection.
- Detection performance: our approach successfully identifies challenging road markings, showing improved accuracy and robustness on the CDM data set.
The remainder of this study is organized as follows. Section 2 reviews related work on road extraction methods based on deep learning. Section 3 introduces the details of the CDM data set. Section 4 presents the proposed method based on M-SKSNet. Experimental results and analysis are provided in Section 5. Finally, conclusions are drawn in Section 6.
2. Related Work
Deep learning, as a data-driven technology, relies heavily on both the data set and the model. Thus, this section will begin with a discussion of the current state of research on data sets in the field of traffic. It will then introduce road marking segmentation methods based on traditional image processing, as well as those based on deep learning. Finally, a novel method proposed as a result of this research will be presented.
2.1. Damaged Road Marking Data Set
Existing public data sets, such as Cityscape [20], KITTI [21], Toronto City [22], Mapillary [23], ApolloScape [24], Ceymo [25], and so on, contain rich traffic scenes and objects, as well as diverse data types (RGB optical images, lidar point clouds [26], and thermal images), covering multiple pixel-level semantic segmentation [27], road segmentation [28], and instance segmentation of various traffic participants [29], among other tasks, which have promoted deep learning research in the context of road segmentation.
However, these data sets lack focus on road marking damage scenarios and annotations, hindering the progress of research in this field. Therefore, there is an urgent need to construct a new data set specifically targeting road marking damage scenarios to facilitate effective detection and segmentation of damaged markings.
2.2. Road Marking Image Segmentation
Road marking image segmentation methods can be categorized into traditional image-processing-based methods and deep-learning-based methods.
2.2.1. Methods Based on Traditional Image Processing
Traditional methods rely on low-level features of images, such as intensity, texture, edge, and geometry; techniques such as edge detection [30], template matching [31], Hough transform [32], and threshold segmentation [20] offer advantages in terms of simplicity, speed, and ease of implementation. However, they have several drawbacks, including sensitivity to parameter selection, vulnerability to noise and interference, and limited adaptability to complex scenes and diverse types of damage.
2.2.2. Deep-Learning-Based Methods
Deep learning methods leverage neural networks to extract high-level features from images, including semantics, context, relationships, and others, for accurate segmentation of road markings.
- FCN-Based Methods
The fully convolutional network (FCN) is an end-to-end image segmentation model that replaces the last fully connected layer of the convolutional neural network with an upsampling layer, achieving pixel-level classification. FCN-8s [33] and FCN-DenseNet [34] are typical methods based on FCN that can effectively capture local and global information of images, but their disadvantages include that the segmentation accuracy of small-scale objects and weak boundary objects is limited, and they cannot solve the long-range dependency problem.
- 2.
- R-CNN-Based Methods
The region-based convolutional neural network (R-CNN) first extracts regions of interest in the image using a candidate region generation algorithm, such as Selective Search, and then performs feature extraction and classification for each region. Mask R-CNN [35] and mask R-CNNs [36,37,38] are some of the methods that can detect road markings in complex traffic scenes. An advantage of these methods is that they can handle objects of different scales and shapes; disadvantages include the dependence on the candidate region generation algorithm and the difficulty of segmenting small objects and overlapping objects.
- 3.
- Transformer-Based Methods
Transformer-based methods rely solely on the self-attention mechanism to effectively capture long-range relationships. The vision transformer (ViT) [39] has shown excellent features in extracting global context, making it suitable for sparse damage markings. These methods inherit the flexibility of transformers in modeling long-range dependencies and can maintain long-distance spatial information and dependencies of different feature channels. Large receptive fields are crucial for the success of transformer-based models [40,41,42], especially for fractured and fallen markings. This study proposes a new dynamic multi-scale large selection kernel network (LSKNet), which dynamically adjusts the receptive field of the feature extraction backbone to improve segmentation accuracy and robustness.
In summary, this study’s method combines a CNN, transformer, and dynamic multi-scale selection kernel to achieve accurate segmentation of fragmented, dense, small-scale, and blurred boundary targets. Compared to traditional methods, this approach eliminates the need for a candidate region generation algorithm and directly segments the image, improving segmentation efficiency and accuracy. Integrating the strengths of CNNs and transformers, this method simultaneously extracts both local and global information, improving the segmentation performance and robustness. Overall, this study’s method offers a novel and effective approach to image segmentation, leveraging the combined power of a CNN, transformer, and dynamic multi-scale selection kernel.
3. Public Damaged Road Marking Data Sets
Data sets are pivotal to deep learning techniques, as their volume and integrity shape the success and stability of these methods. This research presents the China Damaged Road Marking data set (CDM), crafted to tackle the specific challenges of segmenting damaged road markings. The CDM encompasses three distinct subsets, each from varied environments: CDM-H for highways, CDM-C for city roads, and CDM-P, which is derived from Apollo scope’s public data.
3.1. Data Processing
The data processing involves three main stages: acquisition, manual curation, and image refinement.
3.1.1. Data Acquisition
The CDM-H and CDM-C data sets were gathered by our team using the LiMobile M1 system, capturing images with a high-definition resolution of 3520 × 1080 pixels. On the other hand, the CDM-P data set was compiled from the Apollo Scape public repository. The CDM-H data set encompasses data from Fuzhou, Chongqing, and Wuhan, producing a total of 35,565 images. Collection activities were conducted in each city, lasting around an hour per session and spanning 70 km. The night-time collection was opted for to minimize visual distractions and improve the visibility of road markings. As for the CDM-C data set, it focuses on the urban streets of Wuhan and Shanghai. Data collection was a one-time event in each city, lasting roughly 30 min per session and covering 40 km, resulting in 6838 images. The CDM-P data set, sourced from Apollo Scape and captured using the VMX-1HA device, showcases the urban landscape of Beijing, with 4274 images, each boasting a resolution of 1920 × 1080 pixels.
3.1.2. Manual Curation
The manual curation process involves meticulous selection to identify damaged road markings. From the initial pool of 35,565 images, the CDM-H subset was distilled to 1420, focusing on wear-prone areas like entrances and exits. Similarly, the CDM-C subset was narrowed from 6838 to 768 images, highlighting notable road damage. The CDM-P subset, reflecting Beijing’s well-maintained urban areas, comprised 461 images.
3.1.3. Image Refinement
The refinement process includes detailed annotation of damaged markings and cropping to enhance clarity. Images were annotated to identify instances of damaged road markings, followed by cropping to mitigate blurriness and remove extraneous elements. Images were partitioned into regions of interest (ROIs), focusing on the central near-field view to refine the data set. The final data set sizes were 3080 for CDM-H, 1673 for CDM-C, and 980 for CDM-P, each offering insights into road markings across varied environments. Figure 1, Figure 2 and Figure 3 provide visual examples from the CDM_H, CDM_C, and CDM_P data sets, illustrating their diverse sample images.
3.2. Data Set Characteristics
The CDM data set has the following characteristics:
- Consideration of geographical distribution heterogeneity, covering roads from various regions of China, including Chongqing, Wuhan, Shanghai, Beijing, and Fuzhou, reflecting the diversity and complexity of Chinese roads.
- Inclusion of various road types, such as ramp entrances, main roads, ramp exits, branches, intersections, etc., covering a wide range of complex road scenes.
- Consideration of sample time differences, including data collection during daytime, evening, and night-time under different lighting conditions.
- Use of the public data set for supplementation and comparison, increasing the scale and quality of the data set.
3.3. Data Set Contributions
The CDM data set’s contributions include:
- A relatively large-scale road marking damage data set in China: deep learning relies on data, and the generalization performance of models is influenced by the diversity of training data. Considering the low coverage of public road data sets in China and the complexity and diversity of Chinese roads, models trained on existing public data sets perform well in training but poorly in China. Therefore, the application of the CDM data set can supplement the insufficient coverage of Chinese public road data sets and provide important support for the evaluation of deep learning models.
- Higher heterogeneity: the diversity of the data set is key to improving model generalization performance. The CDM data set covers various road types and scenes, providing highly heterogeneous and diverse images. This reflects the characteristics of Chinese roads and provides a benchmark for evaluating the usability and generalization of models.
- Stronger geographical robustness: intra-class diversity helps models recognize more road scenes. The CDM data set covers cities in different geographical regions of China, providing images from various geographical and road backgrounds. This helps improve the robustness and portability of models.
4. Methods
4.1. Model Architecture
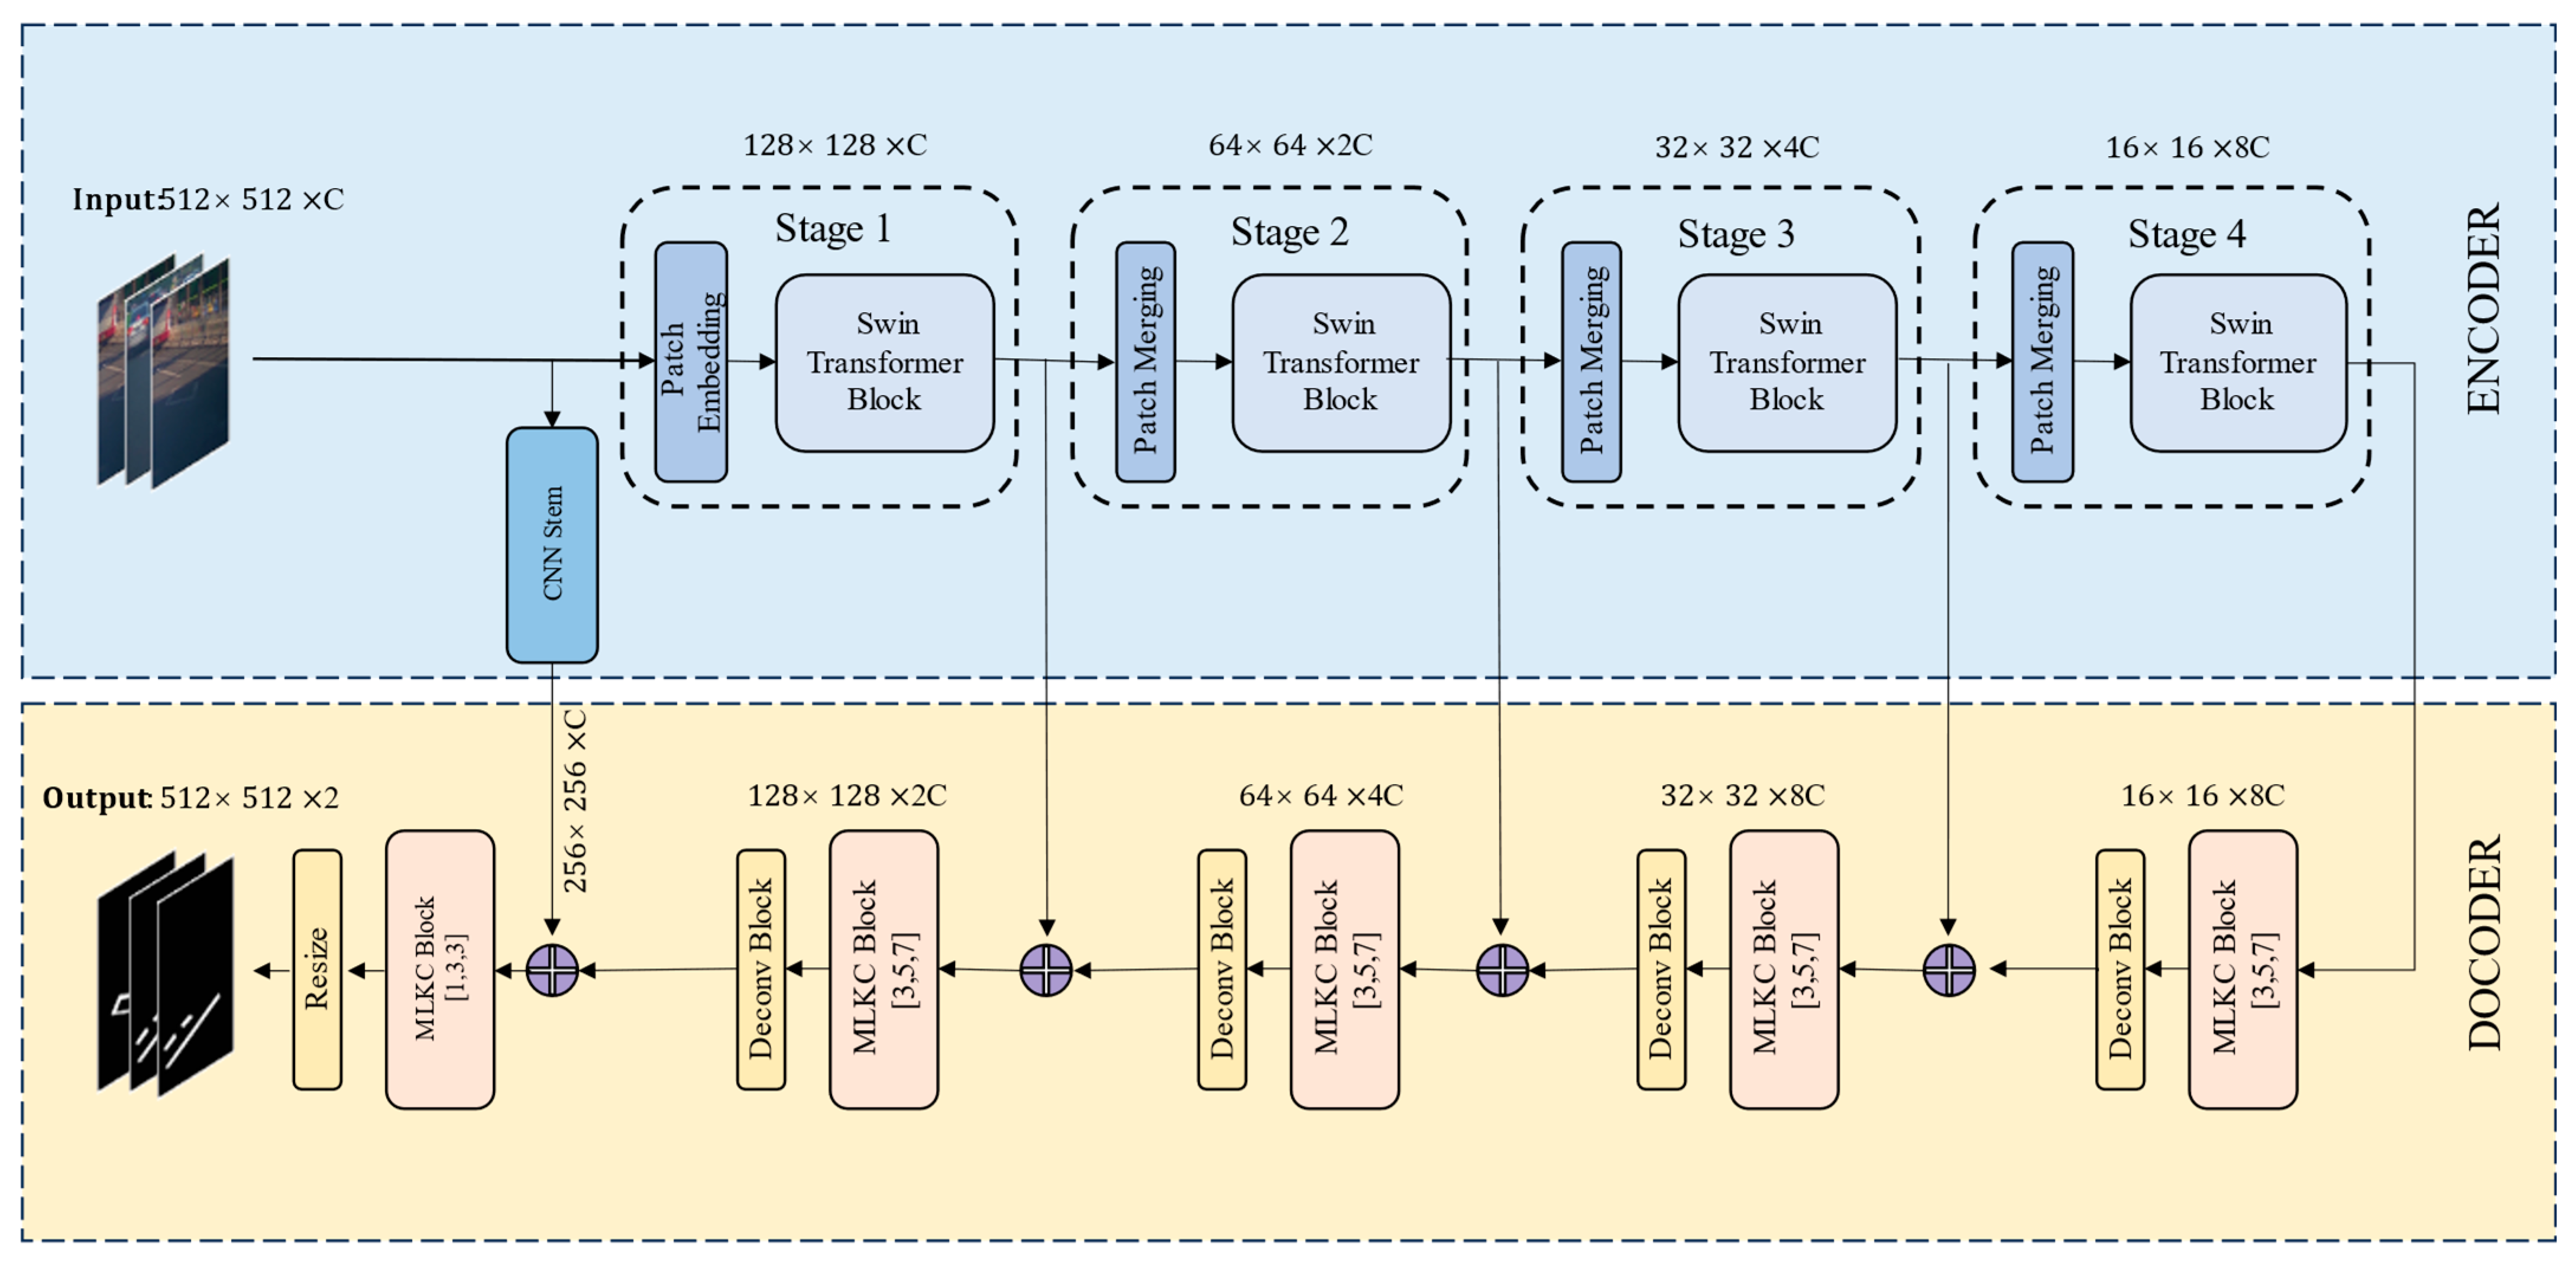
Figure 4 provides an overview of the M-SKSNet architecture examined in this study. The architecture adopts a UNet-like structure, which is characterized by its encoder–decoder network using skip connections between matching blocks with the exact spatial resolution at both ends of the encoder and decoder. It consists of three parts: a transformer encoder, a CNN stem, and a multi-scale CNN decoder. The transformer encoder is designed as an s-level sequence of transformer encoder blocks [15], which aims to extract long-range context information. The CNN stem aims to preserve spatial detail information at a high resolution. The multi-scale CNN decoder consists of 5 + 1 MLKC blocks, which obtain multi-scale, global context information through skip connections.
4.2. The Transformer (Encoder)
The transformer encoder uses sliding windows and a hierarchical structure, paying attention to both global and local information, and is mainly used to obtain the long-range context information of the damage markings in this study.
- Patch Embedding: taking the damage marking image with dimensions of H × W × 3 as input, the Swin transformer uses smaller 4 × 4 patches to better capture the details of small-scale objects in image segmentation.
- Transformer Encoder Block: introduces window-based self-attention (WSA) stacked in the proposed model. Notably, the window position is replaced with half the window size, allowing for the gradual construction of global context through effectively integrating information from various windows. This approach enhances the model’s ability to capture broader contextual information for improved performance in various tasks.
- Patch Merging: merges adjacent patches into a larger patch, thereby reducing the resolution of the feature map and increasing the receptive field.
4.3. The CNN Stem
The CNN stem is mainly used to obtain the local fine-grained spatial detail information of the damage markings, and it consists of four convolutional layers, each followed by a BatchNorm and GELU activation layer (Figure 5). The first 3 × 3 convolutional layer, with a stride of 2 × 2, reduces the input spatial size by half and obtains the local features of small-scale and dense objects through the following three convolutional layers.
4.4. Multi-Dilated Large Kernel CNN (DECODER)
This study recognizes the importance of local fine-grained features in accurately segmenting small-scale objects. However, it also aims to incorporate global context information into the segmentation process for improved performance.
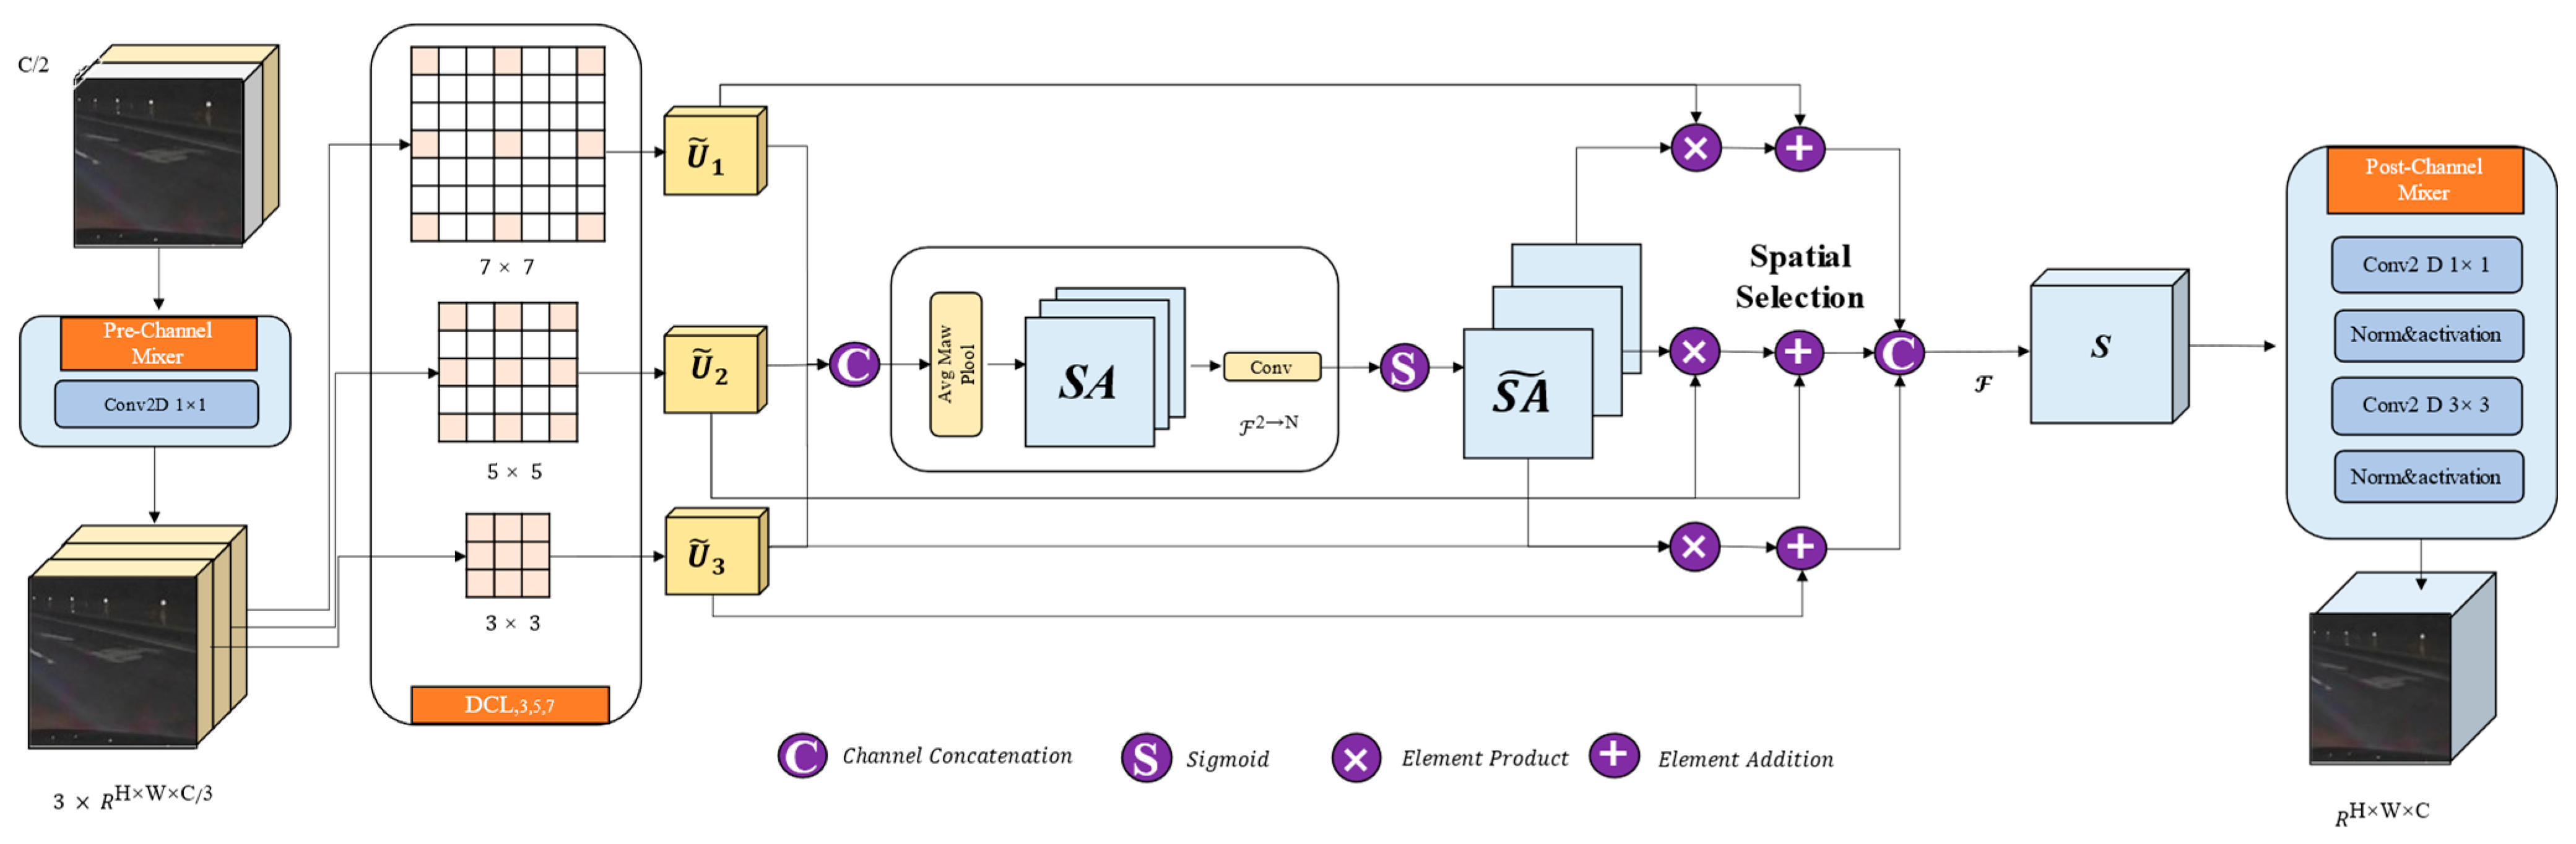
A broader decoding context rate is, thus, obtained without any extra parameters. It consists of a series of multi-dilated large kernel CNN (MLKC) blocks and deconvolution (Deconv) blocks, which are composed of four parts (Figure 6): a pre-channel mixer, dilated convolutional layer (DCL), spatial kernel selection (SKS), and a post-channel mixer.
4.4.1. Pre-Channel Mixer
A pre-channel mixer is applied to the input, which is the concatenation of the output of the previous multi-dilated CNN block and the skip connection of the mirrored encoder, to exchange information in the channel dimension. The channel mixing operation can be achieved using any operator that facilitates the exchange of channel dimension information. In this study, a pre-channel mixer is implemented as a pointwise convolution layer without any normalization or activation layer.
4.4.2. Dilated Convolutional Layer (DCL)
DCL uses three convolution kernels, each with different dilation rates of , and , to obtain multi-scale receptive fields.
Given the kernel size and the dilation rate d, the one-side length of the receptive field of the dilated convolution can be calculated as: , where, for receptive fields larger than 3 × 3, the kernel size is set to 3, and for smaller receptive fields, the kernel size is set to 1.
4.4.3. Spatial Kernel Selection (SKS)
This study uses a spatial selection mechanism to perform spatial selection on the feature maps from different scales of large convolution kernels. Firstly, this study connects the features obtained from different kernels with different receptive field ranges:
and then uses channel-based average and max pooling, denoted as ,
is the average pooling feature descriptor factor and is the max pooling feature descriptor factor. This study connects the spatial pool features and uses the convolution layer to transform the pooled features (two channels) into N spatial attention maps to allow information interaction between different spatial descriptors.
For each spatial attention map , the sigmoid activation function is applied to obtain the individual spatial selection mask =(), where is the sigmoid function. Then, the features in the sequence of decomposed large kernels are weighted by the corresponding spatial selection template and fused by the convolution layer to obtain the attention feature S:
The Deconv block utilizes a transposed convolutional layer to upsample the feature map, doubling the spatial dimension while halving the channel dimension. In this study, BatchNorm and ReLU activation layers are incorporated after the transposed convolutional operation to enhance the effectiveness of the upscaling process.
4.4.4. Post-Channel Mixer
When the features are split into three different spatial resolutions, using DCL to process them, the post-channel mixer is applied to exchange information from the three convolution layers. This study implements the post-channel mixer using a sequence of pointwise and 3 × 3 convolution layers, each followed by BatchNorm and ReLU activation layers.
4.5. Loss Function
Assuming the existence of an optimal distribution that accurately represents the probability of a sample belonging to each category, this study aims to train the model in such a way that its output approximates this optimal distribution as closely as possible. The cross-entropy function can reasonably measure the similarity of the distribution and is also a standard loss function. This study uses OHEM cross-entropy as the loss function. The formula is as follows:
is the loss value calculated according to binary cross-entropy, is the maximum probability of the i-th class.
5. Experiment
5.1. Experiment Setting
In this study, the Python 3.7 programming language and Pytorch 1.7 DL framework were used to build the model, and all experiments were completed using the Centos 7 system. We conducted 100 training sessions for the model, setting the batch size to 8. The Adam optimizer with a learning rate of 0.0001 was used for parameter iterative optimization, and two NVIDIA RTX 2080Ti GPUs were used to speed up the model training.
In this study, the training set and test set were randomly divided according to a ratio of 8:1. The division of data sets into an 8:1 ratio was based on standard practices to ensure a balanced distribution of training and testing data. This ratio allows for comprehensive model training while maintaining enough data for evaluation. The highway data set, CDM-H, comprises a total of 3080 images, with 2730 images allocated for training purposes and 350 images reserved for testing. Similarly, the urban road data set, CDM-C, contains 1673 images, out of which 1483 images are designated for training and 190 images are set aside for testing. Lastly, the public data set, CDM-P, encompasses 980 images, among which 870 images are utilized for training and 110 images are allocated for testing. These subsets provide distinct data sets for training and evaluating deep learning models in specific road scenarios, ensuring comprehensive coverage and accuracy.
5.2. Evaluation Metrics
In this study, five evaluation metrics were used to comprehensively evaluate the road extraction performance of the network model: overall accuracy (OA), precision (P), recall (R), F1 score (F1), and intersection over union (IOU). For image segmentation, the prediction result and the actual label can form four situations: TP (predicted as true, labeled as true), TN (predicted as false, labeled as false), FP (predicted as true, labeled as false), and FN (predicted as false, labeled as true). The specific calculations of different evaluation metrics are as follows:
OA reflects the accuracy of the model prediction result; however, as the image contains a large amount of background area, F1 and IOU are generally used for comprehensive evaluation. The higher the F1 score, the better the model classification prediction result. IOU is the degree of overlap between the damaged road marking prediction area and the real damaged road marking area. The higher the degree of overlap, the better the model performance.
5.3. Experimental Results Analysis
To gain a thorough understanding of how well M-SKSNet performs, it was evaluated against standard road marking segmentation networks, such as BiSeNet [43], EaNet [44], LANet [45], MAResUNet [46], and LinkNet [10], all utilizing ResNet18 as their backbone. Furthermore, M-SKSNet was compared with the most recent advancements in road damage detection models: ResNeSt [11], ConvNeXt [12], and SegFormer [13]. Additionally, various segmentation experiments were carried out across the CDM-P, CDM-H, and CDM-C data sets, followed by a detailed analysis of both quantitative and qualitative outcomes.
5.3.1. Quantitative Results and Analysis
To quantitatively analyze the extraction results of the segmentation model, this study used the OA, P, R, F1, and IOU indicators to evaluate the test set results on CDM-P, CDM-H, CDM-C, and the real labels. F1 score and IOU reflect the model classification prediction result and the accuracy and completeness of the segmentation; therefore, this study focuses on comparing these two indicators.
- Quantitative Analysis of Experimental Results on Different Data Sets
- (1)
- Results of the network performance test on the CDM-P data set
Table 1 presents the results of the network performance test on the CDM-P data set. Among the models tested, M-SKSNet emerges as the best performer across all metrics, particularly in F1 and IOU, where it surpasses the second best, BiSeNet, by 2.18% and 3.3%, respectively. These findings suggest that M-SKSNet efficiently preserves both local details and global context, enabling precise delineation of damaged marking boundaries and yielding more comprehensive segmentation results. While BiSeNet achieves a fine balance between speed and accuracy through its architectural choices, it necessitates additional complexity with a feature fusion module. In contrast, M-SKSNet streamlines feature extraction and fusion using a CNN stem, 4 × 4 patch, and dynamic large kernel convolution. Despite EaNet’s slightly higher p value compared to M-SKSNet’s 91.53, its lower scores in other metrics indicate an overemphasis on positive samples during segmentation, leading to reduced F1 and IOU scores.
LANet and SegFormer models may have simpler structures, limiting their ability to capture the intricate features of road damage markings, which is particularly evident in SegFormer’s poor performance due to a possible mismatch with the semantic segmentation task. MAResUNet and ConvNeXt may struggle with feature extraction, hindering their ability to capture crucial road marking features. Furthermore, ResNeSt and EaNet may suffer from over- or underfitting during training, resulting in unstable or declining performance.
- (2)
- Results of the network performance test on the CDM-H data set
The results of the network performance test on the CDM-H data set are shown in Table 2. M-SKSNet also outperforms other models on all indicators, especially on F1 and IOU, which are 1.94% and 2.86% higher, respectively, than the second best, LinkNet. These results underscore M-SKSNet’s remarkable segmentation prowess in highway scenarios, adeptly adjusting to diverse damage and lighting conditions. While LinkNet, originating from road-use cases, demonstrates relatively good generalization in extracting highway damage markings, its performance on the CDM-H data set still lags behind M-SKSNet. LinkNet employs deconvolution and element-wise addition operations for feature upsampling and fusion. Despite enhancing spatial resolution, its semantic information remains relatively limited. In contrast, M-SKSNet utilizes the transformer to enhance semantic feature representation and addresses weak boundary object segmentation through positional encoding and multi-scale feature fusion.
BiSeNet, LinkNet, EaNet, and MAResUNet exhibit similar overall performance but display slight variations in specific metrics. While they may prioritize balancing speed and accuracy, they may not be as comprehensive as M-SKSNet in the complex task of semantic segmentation of damaged markings. Although they show good generalization, they lack a thorough understanding and treatment of complex semantics. Conversely, LANet, ResNeSt, ConvNeXt, and SegFormer demonstrate relatively poorer performance. LANet achieves the highest p-value on the CDM-H data set, possibly due to its more precise identification of positive samples during segmentation, facilitating easier recognition and segmentation of actual damaged markings. LANet may also have better adaptability to specific data set scenarios, leading to high performance. However, LANet’s simplistic structure may limit its ability to capture complex features of damaged markings, while ResNeSt, ConvNeXt, and SegFormer may lack robustness in feature extraction and fusion, resulting in performance decline. Although LANet excels in certain aspects, its straightforward structure may restrict its performance in more intricate scenarios. ResNeSt, based on ResNet architecture, primarily employs residual connections to construct deep networks. While it introduces branch structures and attention mechanisms, its feature extraction process is still constrained by residual block design, potentially causing performance bottlenecks, especially in handling detail-rich markings. Despite ConvNeXt adopting grouped convolutions and multi-scale fusion, insufficient inter-group information exchange may lead to inadequately extracted features, affecting model performance. SegFormer adopts transformer architecture, introducing attention mechanisms to enhance inter-feature connections in semantic segmentation tasks. However, despite the outstanding performance of transformers in processing sequential data, they may face challenges in handling image data, for instance, high computational complexity and large parameter volumes, potentially limiting SegFormer’s performance on large-scale data sets.
- (3)
- Results of the network performance test on the CDM-C data set
The network performance results on the CDM-C data set are presented in Table 3. M-SKSNet demonstrates superior performance across all metrics, particularly in F1 and IOU, surpassing BiSeNet by 3.77% and 4.6%, respectively. These results indicate M-SKSNet’s effective segmentation capabilities in urban road scenarios. However, the performances of the six models on the CDM-H highway data set and CDM-P public road data set are less than ideal. Possible reasons include night-time data collection with insufficient illumination, leading to recognition challenges; diverse sample locations (Chongqing, Wuhan, Shanghai), resulting in spatial heterogeneity and spectral differences; and various road types and damage scenarios, indicating insufficient data set samples for generalization. These findings underscore the importance of constructing a comprehensive CDM data set, providing valuable resources for road damage research in China.
BiSeNet, ResNeSt, and EaNet likely perform similarly and outperform other models because they employ effective feature extraction and fusion strategies in their model architectures. BiSeNet’s dual-branch design enhances its ability to process both global and local information, improving semantic understanding. ResNeSt, an upgraded ResNet version, incorporates branch structures and attention mechanisms to enhance feature representation, facilitating better feature correlation capture and performance enhancement. EaNet may employ an attention-like mechanism to focus on crucial image areas adaptively, while also integrating effective feature extraction and fusion strategies for improved semantic comprehension and expression. Compared with other models, the M-SKSNet model still achieves the best results. This underpins that the model has good robustness and generalization ability.
- 2.
- Overall Analysis of Quantitative Experimental Results
In this study, how effectively the M-SKSNet model and other models perform across three distinct data sets was evaluated. M-SKSNet consistently outperforms its counterparts in these metrics, underscoring its superior accuracy in identifying damaged markings and generating reliable segmentation results.
The results indicate that M-SKSNet excels on all data sets, demonstrating its robustness and generalization capabilities. The CDM-P data set is a public damaged road marking detection data set with most of the data collection times being in the daytime, and some of them being in the evening, under good illumination conditions. Therefore, the test results of different models on the CDM-P data set are generally better than those on the CDM-H and CDM-C data sets. The CDM-H data set is a highway damage marking detection data set with relatively single damage types but unstable illumination conditions. Therefore, the test results of different models on the CDM-H data set are generally better than those on the CDM-C data set but lower than those on the CDM-P data set. The CDM-C data set is an urban damaged road marking detection data set, including different types of scenarios, such as lanes, intersections, trunk roads, and auxiliary roads, with diverse damage types. The data collection times were mainly at night, with insufficient illumination conditions, resulting in generally worse test results for different models on the CDM-C data set.
Additionally, the CDM-H data set comprises 3113 images, with 2783 used for training, while the CDM-C data set contains 1718 images, with 1528 utilized for training. The significantly larger image count in the CDM-H data set allows for more comprehensive learning and enhanced feature recognition compared to the CDM-C data set. This experiment further demonstrates the need for constructing a damage marking detection data set that provides a sample library and reference for the research of damaged road marking in China.
5.3.2. Qualitative Results and Analysis
In this study, the CDM-P data set was utilized as a case study to comprehensively demonstrate the performance of the M-SKSNet model and provide a more representative analysis. The M-SKSNet model was compared with the classic BiSeNet, EaNet, MAResUNet, LinkNet, and LANet models based on the same loss function and learning rate and the advantages of the M-SKSNet model in dealing with the challenging features of damaged marking images were identified.
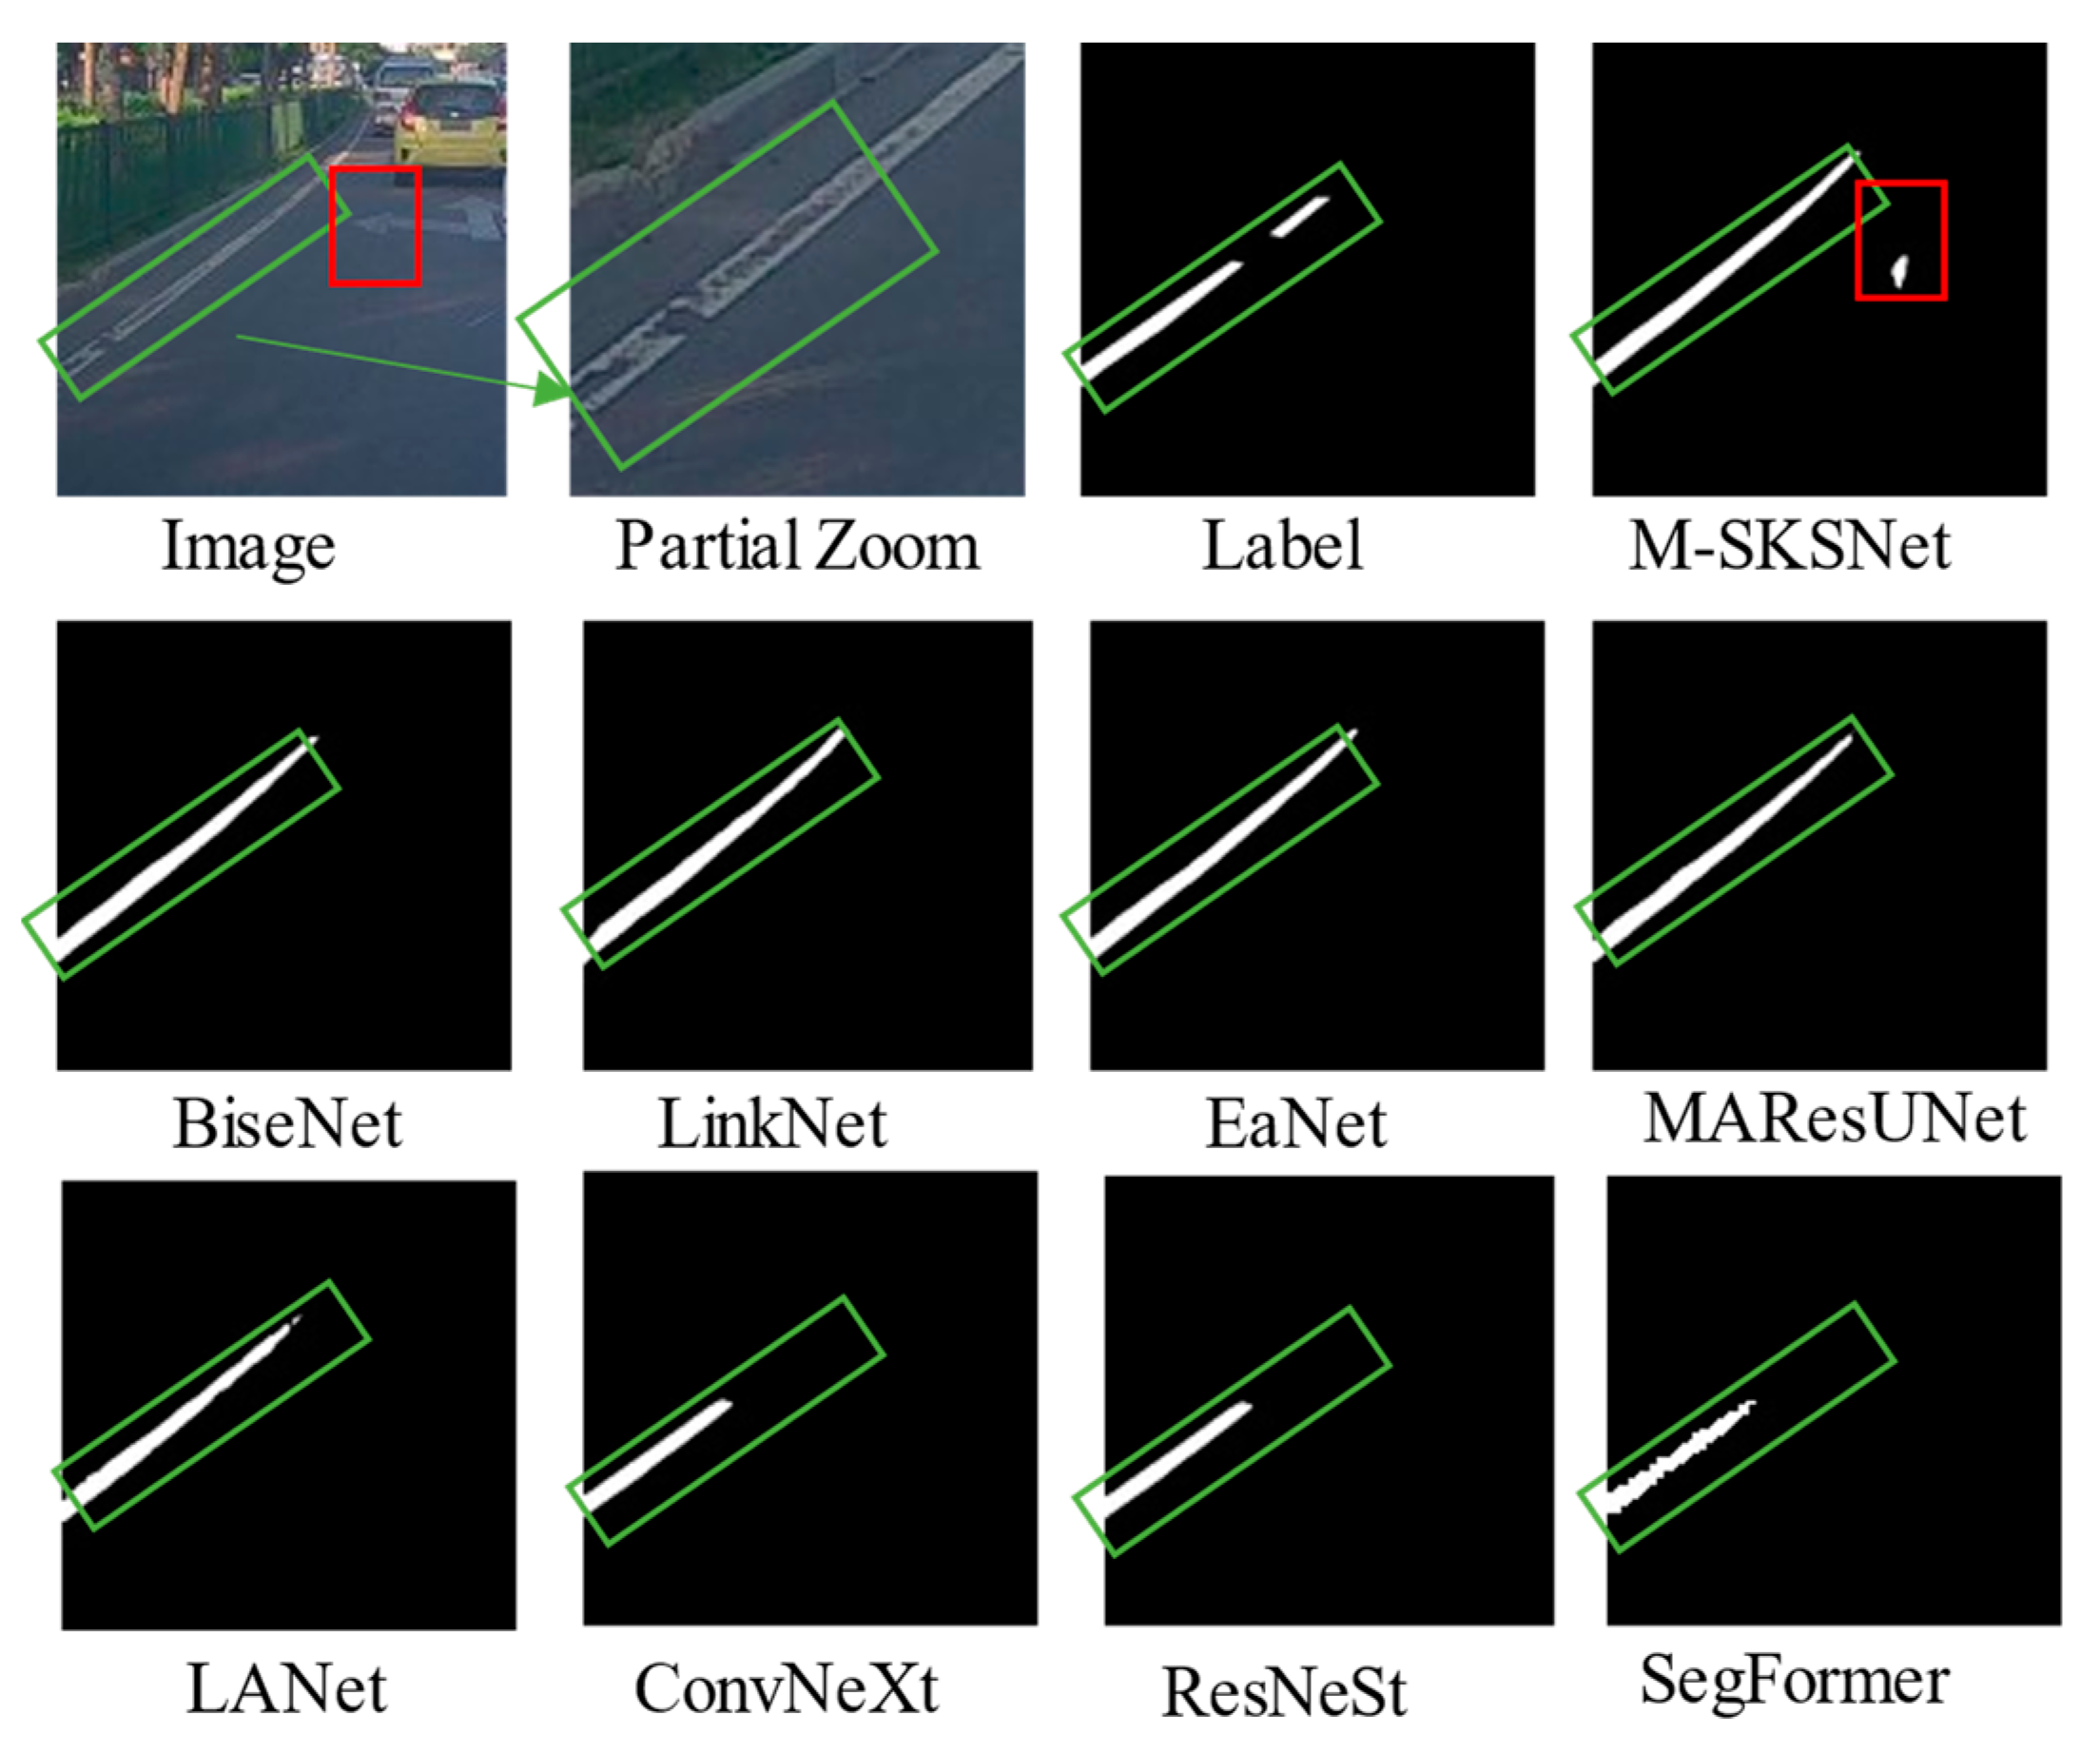
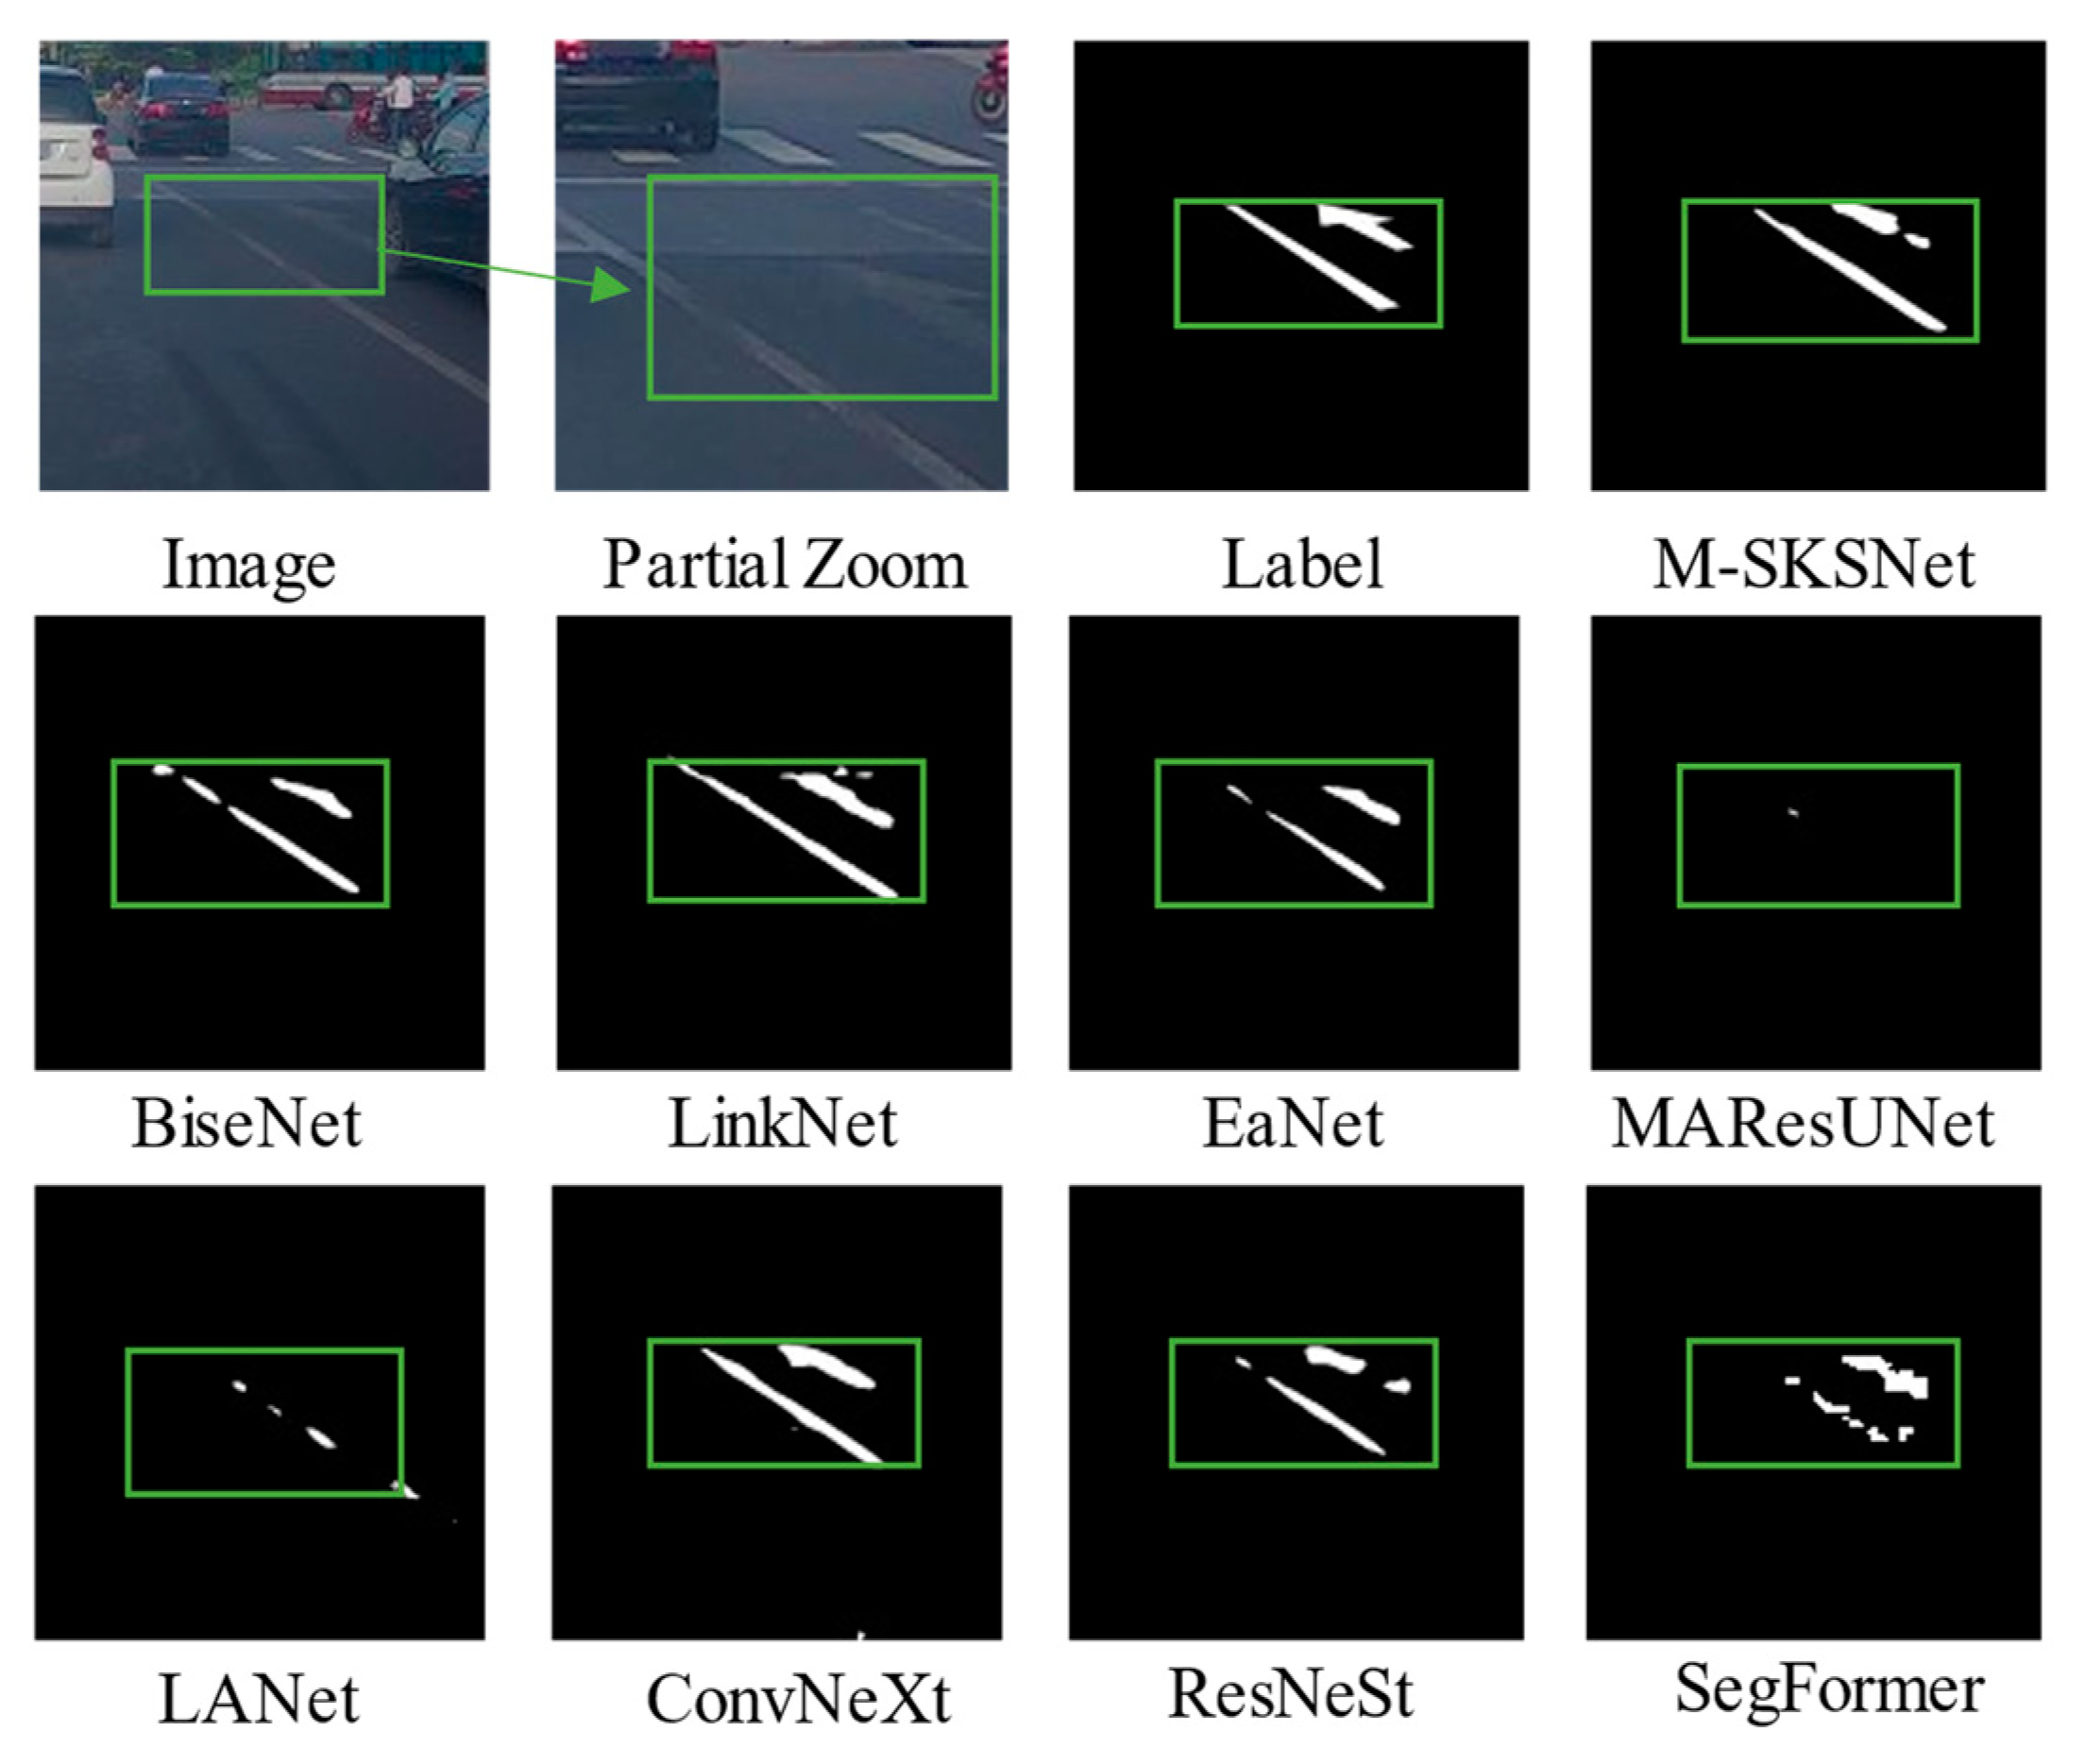
Figure 7, Figure 8 and Figure 9 show the qualitative comparison results of different models in extracting fractured objects (Figure 7), dense and small-scale damage (Figure 8), and blurred edge lines (Figure 9), respectively. The green box in the image signifies road damage markings, while the red box highlights a missed damaged marking during annotation. However, the model accurately predicts the area of damaged marking.
Fractured objects: Out of the six models studied, only the M-SKSNet model is capable of identifying fractured objects. Additionally, even when given incomplete annotations, this model can still make accurate judgments. Its exceptional performance can be attributed to its adoption of a spatial selection mechanism that selects feature maps from different scales of large convolution kernels. This enhances the network’s ability to concentrate on the most significant spatial context areas for detecting objects.
Dense and small-scale damage: The M-SKSNet model excels in detecting densely packed and small-scale damage, presenting complete recognition results without any missed or false detections. This impressive performance can be attributed to the model’s utilization of CNN stem, which captures local details of small-scale objects through its multi-scale feature selection process while also considering global context information.
Blurred edges: The M-SKSNet model exhibits notable advantages in extracting blurred edge lines, and its extracted contours are more precise and more regular, without any blurring or fracture. This ability is attributed to the fact that the M-SKSNet model uses a transformer to obtain powerful semantic representation at both the local level (such as the boundary) and global context level (such as the relationship between objects/classes) and uses positional encoding and multi-scale feature fusion to deal with the segmentation problem of weak boundary objects.
The figures clearly demonstrate that the M-SKSNet model shows a strong segmentation ability for all types of marking damage, and the segmentation extraction results are more accurate and complete than other models. This model can not only accurately segment the objects of interest but can also adapt to different types of damage and illumination conditions. Even in the case of complex or erroneous human judgment, it still ensures correct segmentation, fully demonstrating its robustness of segmentation.
5.4. Feature Map Visualization
This section utilizes the CDM-H road data set as an illustrative example to visualize the feature extraction results of the M-SKSNet model. In doing so, it delves into the internal mechanisms and characteristics of the model, providing valuable insights into its performance.
As shown in Figure 10, different brightness levels represent the size of activation values, and it can be seen that the M-SKSNet model can achieve an accurate interpretation of different damage marking scenarios through modelling global context relationships. In addition, Figure 10 shows the feature representations of four different stages, which can be used to better understand how the M-SKSNet model extracts damage annotations. In the figure, (a) is the original input image, (b) is the image after the first encoding, (c) is the image after the second encoding, (d) is the image after the third encoding, (e) is the image after the fourth encoding (as the feature level increases, the semantic information becomes more and more abstract, and the damage marking boundary becomes more and more blurred), (f) is the image after the first decoding, (g) is the image after the second decoding, (h) is the image after the third decoding, and (i) is the image after the fourth decoding. After adding the MLKC block, the learned damage marking feature boundary becomes more apparent, and redundant information is reduced. Further, (j) is the high-resolution shallow feature information extracted with CNN stem. Final, (k) shows the extracted outcomes following the semantic division. When the dilation factor is substantial, there may be significant gaps between the elements of the convolution kernel, resulting in a checkerboard phenomenon. To alleviate this phenomenon, multi-scale dilated convolution can be employed to mitigate the hole effect.
5.5. Ablation Study
This section presents an ablation study to verify the effectiveness of each key component designed in the proposed model. The ablation analysis was performed on the CDM-P data set, using Transformer-T as the baseline model, and then each module was gradually added. Table 4 illustrates the results of different ablation experiments. Compared with the baseline model, the addition of CNN stem leads to an increase of 0.79% in F1 and 1.21% in IOU, respectively, which proves the effectiveness of CNN stem layer design in damaged road marking extraction. From the table, it can be seen that in terms of IOU, the addition of the MSKC module increases the baseline from 73.88% to 74.86%, and, in terms of F1, it increases the baseline from 84.98% to 85.62%. Finally, the combination of the MLKC and CNN stem modules outperforms the baseline model, with F1 and IOU increasing by 1.19% and 1.81%, respectively. This increase validates the necessity of each component in the proposed model for obtaining the best segmentation results. In summary, the CNN stem, MSKC, and MLKC modules in the proposed model all have significant contributions to the model performance, and they work collaboratively to achieve accurate segmentation of damaged markings.
5.6. Model Complexity Analysis
In this section, we provide a comprehensive overview of the model parameters, including the number of parameters (params), computation amount (GFLOPs), and throughput. To calculate the inference time, we used a 512 × 512 input and a batch size of 1. We also averaged the results of running the model 1000 times to ensure accuracy. The calculation results are presented in Table 5.
Table 5 reveals that M-SKSNet operates relatively slowly at 28.40 FPS compared to other models, likely due to its higher GFLOPS and parameters. In contrast, BiSeNet and EaNet achieve faster speeds of 72.72 FPS and 78.50 FPS, respectively, thanks to their lower GFLOPS and parameters. LANet stands out as the fastest, with a speed of 198.78 FPS, possibly due to its simpler network structure. Models with higher GFLOPS and parameters, such as ConvNeXt and M-SKSNet, tend to have slower speeds.
To enhance M-SKSNet’s speed, the optimization of the model structure, utilization of specialized hardware, and adoption of lightweight techniques such as quantization, pruning, and distillation can be explored. While M-SKSNet may lag behind in terms of parameter count, computational load, and throughput, it offers significant advantages in segmentation accuracy. Future research should aim to strike a better balance between model lightweightness and segmentation performance.
6. Conclusions
In response to the challenges associated with detecting damaged road markings, this study introduced M-SKSNet, a novel segmentation method combining transformer and CNN architectures. M-SKSNet effectively addresses these challenges through leveraging both global semantic representation and the local visual structure. Extensive experiments on the CDM data set demonstrate that M-SKSNet outperforms existing techniques, achieving significant improvements in both F1 and IOU metrics. Compared to other mentioned models, M-SKSNet presented a 3.77% increase in F1 and a 4.6% increase in IOU. This underscores its outstanding damaged road marking segmentation performance and innovation.
Despite its innovation, the CDM data set faces challenges related to its spatial heterogeneity and potential spectral variations due to the diversity of collection sites (e.g., Chongqing, Wuhan, and Shanghai), reflecting different road conditions. To enhance model generalization, a more comprehensive sample set is needed, particularly in urban road environments. The current models focus on pixel-level segmentation, providing only location and shape information on damaged road markings. Future research should integrate additional knowledge and post-processing techniques to enrich semantic interpretation and analytical capabilities. To ensure model robustness, further testing in various scenarios, including road cracks, will be carried out to evaluate the adaptability of the model across different environments.
Author Contributions
Conceptualization, J.W. and X.L.; methodology, J.W.; software, X.Z. and X.R.; validation, J.W.; formal analysis, J.W.; investigation, J.W.; writing—original draft preparation, J.W.; writing—review and editing, J.W., X.Z., Y.W. and W.Q.; visualization, J.W.; supervision, X.R.; project administration, J.W.; funding acquisition, X.L. and H.Y. All authors have read and agreed to the published version of the manuscript.
Funding
This research was partly supported by the National Key Research and Development Program of China (2023YFB3905705), Fujian Province Highway Science and Technology Project: Key Technology of Intelligent Inspection of Highway UAV Network by Remote Sensing (Grant No. GS 202101).
Data Availability Statement
Data are available in a publicly accessible repository. The data presented in this study are openly available at https://www.scidb.cn/, accessed on 28 March 2024.
Acknowledgments
Thanks to Chengbin Wu for their assistance in the data processing. The authors thank the anonymous reviewers for their careful reading of our manuscript and their many insightful comments and suggestions.
Conflicts of Interest
The authors declare no conflicts of interest.
References
- Morrissett, A.; Abdelwahed, S. A Review of Non-Lane Road Marking Detection and Recognition. In Proceedings of the 2020 IEEE 23rd International Conference on Intelligent Transportation Systems (ITSC), Rhodes, Greece, 20–23 September 2020. [Google Scholar] [CrossRef]
- Xu, S.; Wang, J.; Wu, P.; Shou, W.; Wang, X.; Chen, M. Vision-Based Pavement Marking Detection and Condition Assessment-A Case Study. Appl. Sci. 2021, 11, 3152. [Google Scholar] [CrossRef]
- Feng, M.Q.; Leung, R.Y. Application of Computer Vision for Estimation of Moving Vehicle Weight. IEEE Sens. J. 2021, 21, 11588–11597. [Google Scholar] [CrossRef]
- Kumar, P.; McElhinney, C.P.; Lewis, P.; McCarthy, T. Automated Road Markings Extraction from Mobile Laser Scanning Data. Int. J. Appl. Earth Obs. Geoinf. 2014, 32, 125–137. [Google Scholar] [CrossRef]
- Chou, C.P.; Hsu, H.H.; Chen, A.C. Automatic Recognition of Worded and Diagrammatic Road Markings Based on Laser Reflectance Information. J. Transp. Eng. Part B Pavements 2020, 146, 04020051. [Google Scholar] [CrossRef]
- Lyu, X.; Li, X.; Dang, D.; Dou, H.; Wang, K.; Lou, A. Unmanned Aerial Vehicle (UAV) Remote Sensing in Grassland Ecosystem Monitoring: A Systematic Review. Remote Sens. 2022, 14, 1096. [Google Scholar] [CrossRef]
- Liu, J.; Liao, X.; Ye, H.; Yue, H.; Wang, Y.; Tan, X.; Wang, D. UAV Swarm Scheduling Method for Remote Sensing Observations during Emergency Scenarios. Remote Sens. 2022, 14, 1406. [Google Scholar] [CrossRef]
- Ronneberger, O.; Fischer, P.; Brox, T. U-Net: Convolutional Networks for Biomedical Image Segmentation. In International Conference on Medical Image Computing and Computer-Assisted Intervention; Springer: Berlin/Heidelberg, Germany, 2015. [Google Scholar] [CrossRef]
- Yang, C.; Guo, H. A Method of Image Semantic Segmentation Based on PSPNet. Math. Probl. Eng. 2022. [Google Scholar] [CrossRef]
- Chaurasia, A.; Culurciello, E. LinkNet: Exploiting Encoder Representations for Efficient Semantic Segmentation. In Proceedings of the 2017 IEEE Visual Communications and Image Processing (VCIP), St. Petersburg, FL, USA, 10–13 December 2017; pp. 1–4. [Google Scholar]
- Zhang, H.; Wu, C.; Zhang, Z.; Zhu, Y.; Lin, H.; Zhang, Z.; Sun, Y.; He, T.; Mueller, J.; Manmatha, R.; et al. ResNeSt: Split-Attention Networks. In Proceedings of the IEEE/CVF Conference on Computer Vision and Pattern Recognition (CVPR) Workshops, New Orleans, LA, USA, 18–24 June 2022; pp. 2736–2746. [Google Scholar]
- Zhuang, L.; Mao, H.; Wu, C.-Y.; Feichtenhofer, C.; Darrell, T.; Xie, S. A ConvNet for the 2020s. In Proceedings of the 2022 IEEE/CVF Conference on Computer Vision and Pattern Recognition (CVPR), New Orleans, LA, USA, 18–24 June 2022. [Google Scholar] [CrossRef]
- Xie, E.; Wang, W.; Yu, Z.; Anandkumar, A.; Alvarez, J.M.; Luo, P. SegFormer: Simple and Efficient Design for Semantic Segmentation with Transformers. Adv. Neural Inf. Process. Syst. 2021, 34, 12077–12090. [Google Scholar]
- Liu, Z.; Yeoh, J.K.W.; Gu, X.; Dong, Q.; Chen, Y.; Wu, W.; Wang, L.; Wang, D. Automatic Pixel-Level Detection of Vertical Cracks in Asphalt Pavement Based on GPR Investigation and Improved Mask R-CNN. Autom. Constr. 2023, 146, 104689. [Google Scholar] [CrossRef]
- Liu, Z.; Lin, Y.; Cao, Y.; Hu, H.; Wei, Y.; Zhang, Z.; Lin, S.; Guo, B. Swin Transformer: Hierarchical Vision Transformer Using Shifted Windows. In Proceedings of the IEEE/CVF International Conference on Computer Vision, Montreal, QC, Canada, 10–17 October 2021; pp. 10012–10022. [Google Scholar]
- Feng, D.; Haase-Schütz, C.; Rosenbaum, L.; Hertlein, H.; Gläser, C.; Timm, F.; Wiesbeck, W.; Dietmayer, K. Deep Multi-Modal Object Detection and Semantic Segmentation for Autonomous Driving: Datasets, Methods, and Challenges. IEEE Trans. Intell. Transp. Syst. 2021, 22, 1341–1360. [Google Scholar] [CrossRef]
- Gupta, A.; Welburn, E.; Watson, S.; Yin, H. CNN-Based Semantic Change Detection in Satellite Imagery. In Artificial Neural Networks and Machine Learning—Icann 2019: Workshop and Special Sessions; Tetko, I.V., Kurkova, V., Karpov, P., Theis, F., Eds.; Springer International Publishing Ag: Cham, Switzerland, 2019; Volume 11731, pp. 669–684. [Google Scholar]
- Bhatt, D.; Patel, C.; Talsania, H.; Patel, J.; Vaghela, R.; Pandya, S.; Modi, K.; Ghayvat, H. CNN Variants for Computer Vision: History, Architecture, Application, Challenges and Future Scope. Electronics 2021, 10, 2470. [Google Scholar] [CrossRef]
- Remote Sensing|Free Full-Text|ISTD-PDS7: A Benchmark Dataset for Multi-Type Pavement Distress Segmentation from CCD Images in Complex Scenarios. Available online: https://www.mdpi.com/2072-4292/15/7/1750 (accessed on 20 March 2024).
- Cordts, M.; Omran, M.; Ramos, S.; Rehfeld, T.; Enzweiler, M.; Benenson, R.; Franke, U.; Roth, S.; Schiele, B. The Cityscapes Dataset for Semantic Urban Scene Understanding. In Proceedings of the 2016 IEEE Conference on Computer Vision and Pattern Recognition (CVPR), Las Vegas, NV, USA, 27–30 June 2016. [Google Scholar] [CrossRef]
- Geiger, A.; Lenz, P.; Urtasun, R. Are We Ready for Autonomous Driving? The KITTI Vision Benchmark Suite. In Proceedings of the 2012 IEEE Conference on Computer Vision and Pattern Recognition, Providence, RI, USA, 16–21 June 2012. [Google Scholar] [CrossRef]
- Wang, S.; Bai, M.; Mattyus, G.; Chu, H.; Luo, W.; Yang, B.; Liang, J.; Cheverie, J.; Fidler, S.; Urtasun, R. TorontoCity: Seeing the World with a Million Eyes. In Proceedings of the IEEE International Conference on Computer Vision (ICCV), Venice, Italy, 22–29 October 2017; pp. 3028–3036. [Google Scholar] [CrossRef]
- Neuhold, G.; Ollmann, T.; Bulò, S.R.; Kontschieder, P. The Mapillary Vistas Dataset for Semantic Understanding of Street Scenes. In Proceedings of the IEEE International Conference on Computer Vision (ICCV), Venice, Italy, 22–29 October 2017; pp. 5000–5009. [Google Scholar] [CrossRef]
- Huang, X.; Wang, P.; Cheng, X.; Zhou, D.; Geng, Q.; Yang, R. The ApolloScape Open Dataset for Autonomous Driving and Its Application. IEEE Trans. Pattern Anal. Mach. Intell. 2020, 42, 2702–2719. [Google Scholar] [CrossRef] [PubMed]
- Jayasinghe, O.; Hemachandra, S.; Anhettigama, D.; Kariyawasam, S.; Rodrigo, R.; Jayasekara, P. CeyMo: See More on Roads—A Novel Benchmark Dataset for Road Marking Detection. In Proceedings of the IEEE/CVF International Conference on Computer Vision, Montreal, QC, Canada, 10–17 October 2021. [Google Scholar] [CrossRef]
- Choi, Y.; Choi, Y.; Kim, N.; Hwang, S.; Park, K.; Yoon, J.S.; An, K.; Kweon, I.S. KAIST Multi-Spectral Day/Night Data Set for Autonomous and Assisted Driving. IEEE Trans. Intell. Transp. Syst. 2018, 19, 934–948. [Google Scholar] [CrossRef]
- Caesar, H.; Bankiti, V.; Lang, A.H.; Vora, S.; Liong, V.E.; Xu, Q.; Krishnan, A.; Pan, Y.; Baldan, G.; Beijbom, O. nuScenes: A Multimodal Dataset for Autonomous Driving. In Proceedings of the 2020 IEEE/CVF Conference on Computer Vision and Pattern Recognition (CVPR), Seattle, WA, USA, 13–19 June 2020; pp. 11621–11631. [Google Scholar] [CrossRef]
- Takumi, K.; Watanabe, K.; Ha, Q.; Tejero-De-Pablos, A.; Ushiku, Y.; Harada, T. Multispectral Object Detection for Autonomous Vehicles. In Proceedings of the on Thematic Workshops of ACM Multimedia, New York, NY, USA, 23–27 October 2017; pp. 35–43. [Google Scholar] [CrossRef]
- Ha, Q.; Watanabe, K.; Karasawa, T.; Ushiku, Y.; Harada, T. MFNet: Towards Real-Time Semantic Segmentation for Autonomous Vehicles with Multi-Spectral Scenes. In Proceedings of the 2017 IEEE/RSJ International Conference on Intelligent Robots and Systems (IROS), Vancouver, BC, Canada, 24–28 September 2017; pp. 5108–5115. [Google Scholar] [CrossRef]
- Schneider, L.; Jasch, M.; Fröhlich, B.; Weber, T.; Franke, U.; Pollefeys, M.; Rätsch, M. Multimodal Neural Networks: RGB-D for Semantic Segmentation and Object Detection. In Scandinavian Conference on Image Analysis; Springer: Berlin/Heidelberg, Germany, 2017; pp. 98–109. [Google Scholar] [CrossRef]
- Teichmann, M.; Weber, M.; Zoellner, M.; Cipolla, R.; Urtasun, R. MultiNet: Real-Time Joint Semantic Reasoning for Autonomous Driving. In Proceedings of the 2018 IEEE Intelligent Vehicles Symposium (IV), Changshu, China, 26–30 June 2018. [Google Scholar] [CrossRef]
- Uhrig, J.; Rehder, E.; Fröhlich, B.; Franke, U.; Brox, T. Box2Pix: Single-Shot Instance Segmentation by Assigning Pixels to Object Boxes. In Proceedings of the 2018 IEEE Intelligent Vehicles Symposium (IV), Changshu, China, 26–30 June 2018; pp. 292–299. [Google Scholar] [CrossRef]
- Tian, J.; Yuan, J.; Liu, H. Road Marking Detection Based on Mask R-CNN Instance Segmentation Model. In Proceedings of the 2020 International Conference on Computer Vision, Image and Deep Learning (CVIDL), Chongqing, China, 10–12 July 2020. [Google Scholar] [CrossRef]
- Han, K.; Wang, Y.; Chen, H.; Chen, X.; Guo, J.; Liu, Z.; Tang, Y.; Xiao, A.; Xu, C.; Xu, Y.; et al. A Survey on Vision Transformer. IEEE Trans. PATTERN Anal. Mach. Intell. 2023, 45, 87–110. [Google Scholar] [CrossRef] [PubMed]
- Lian, R.; Wang, W.; Mustafa, N.; Huang, L. Road Extraction Methods in High-Resolution Remote Sensing Images: A Comprehensive Review. IEEE J. Sel. Top. Appl. Earth Obs. Remote Sens. 2020, 13, 5489–5507. [Google Scholar] [CrossRef]
- Dong, J.; Liu, J.; Wang, N.; Fang, H.; Zhang, J.; Hu, H.; Ma, D. Intelligent Segmentation and Measurement Model for Asphalt Road Cracks Based on Modified Mask R-CNN Algorithm. Cmes-Comput. Model. Eng. Sci. 2021, 128, 541–564. [Google Scholar] [CrossRef]
- He, K.; Gkioxari, G.; Dollar, P.; Girshick, R. Mask R-CNN. In Proceedings of the IEEE International Conference on Computer Vision (ICCV), Venice, Italy, 22–29 October 2017; pp. 2961–2969. [Google Scholar]
- Huang, Z.; Huang, L.; Gong, Y.; Huang, C.; Wang, X. Mask Scoring R-CNN. In Proceedings of the IEEE/CVF Conference on Computer Vision and Pattern Recognition, Long Beach, CA, USA, 15–20 June 2019; pp. 6409–6418. [Google Scholar]
- Belal, M.M.; Sundaram, D.M. Global-Local Attention-Based Butterfly Vision Transformer for Visualization-Based Malware Classification. IEEE Access 2023, 11, 69337–69355. [Google Scholar] [CrossRef]
- Geng, S.; Zhu, Z.; Wang, Z.; Dan, Y.; Li, H. LW-ViT: The Lightweight Vision Transformer Model Applied in Offline Handwritten Chinese Character Recognition. Electronics 2023, 12, 1693. [Google Scholar] [CrossRef]
- Aim, D.; Kim, H.J.; Kim, S.; Ko, B.C. IEEE Shift-ViT: Siamese Vision Transformer Using Shifted Branches. In Proceedings of the 2022 37th International Technical Conference on Circuits/Systems, Computers and Communications (ITC-CSCC), Phuket, Thailand, 5–8 July 2022; pp. 259–261. [Google Scholar]
- Brandizzi, N.; Fanti, A.; Gallotta, R.; Russo, S.; Iocchi, L.; Nardi, D.; Napoli, C. Unsupervised Pose Estimation by Means of an Innovative Vision Transformer. In Artificial Intelligence and Soft Computing; ICAISC 2022. Lecture Notes in Computer Science; Springer: Cham, Switzerland, 2023; Volume 13589, pp. 3–20. [Google Scholar] [CrossRef]
- Yu, C.; Wang, J.; Peng, C.; Gao, C.; Yu, G.; Sang, N. BiSeNet: Bilateral Segmentation Network for Real-Time Semantic Segmentation. In Proceedings of the European Conference on Computer Vision (ECCV), Munich, Germany, 8–14 September 2018; pp. 325–341. [Google Scholar]
- Yang, G.; Zhang, Q.; Zhang, G. EANet: Edge-Aware Network for the Extraction of Buildings from Aerial Images. Remote Sens. 2020, 12, 2161. [Google Scholar] [CrossRef]
- Ding, L.; Tang, H.; Bruzzone, L. LANet: Local Attention Embedding to Improve the Semantic Segmentation of Remote Sensing Images. IEEE Trans. Geosci. Remote Sens. 2021, 59, 426–435. [Google Scholar] [CrossRef]
- Remote Sensing|Free Full-Text|MARE: Self-Supervised Multi-Attention REsu-Net for Semantic Segmentation in Remote Sensing. Available online: https://www.mdpi.com/2072-4292/13/16/3275 (accessed on 4 January 2024).
Figure 1.
Sample images from the CDM_H data set.

Figure 2.
Sample images from the CDM_C data set.

Figure 3.
Sample images from the CDM_P data set.

Figure 4.
M-SKSNet architecture.

Figure 5.
CNN stem structure.

Figure 6.
Schematic diagram of MLKC block.

Figure 7.
Qualitative comparison of extraction results of different models for fractured objects.

Figure 8.
Qualitative comparison of extraction results of different models for dense and small-scale damage.
Figure 8.
Qualitative comparison of extraction results of different models for dense and small-scale damage.

Figure 9.
Qualitative comparison of extraction results of different models for blurred edge lines.

Figure 10.
Feature map visualization.


Table 1.
Extraction results from the CDM-P data set (%).
| Model | OA | R | P | F1 | IOU |
|---|---|---|---|---|---|
| M-SKSNet | 99.60 | 84.39 | 90.73 | 86.17 | 75.69 |
| BiSeNet | 99.55 | 79.54 | 88.96 | 83.99 | 72.39 |
| LinkNet | 99.5 | 78.19 | 89.80 | 83.60 | 71.82 |
| EaNet | 99.54 | 76.29 | 91.53 | 83.22 | 71.27 |
| MAResUNet | 99.47 | 73.10 | 89.51 | 80.48 | 67.34 |
| LANet | 99.28 | 65.60 | 82.19 | 72.96 | 57.43 |
| ResNeSt | 99.53 | 77.39 | 89.30 | 82.92 | 70.82 |
| ConvNeXt | 99.45 | 76.02 | 85.36 | 80.42 | 67.25 |
| SegFormer | 99.22 | 57.96 | 84.93 | 68.90 | 52.56 |
Note: bold font indicates the best results in each column.
Table 2.
Extraction results from the CDM-H data set (%).
| Model | OA | R | P | F1 | IOU |
|---|---|---|---|---|---|
| M-SKSNet | 99.59 | 83.37 | 85.64 | 84.49 | 73.15 |
| BiSeNet | 99.55 | 78.82 | 86.67 | 82.55 | 70.29 |
| LinkNet | 99.56 | 78.47 | 87.85 | 82.90 | 70.79 |
| EaNet | 99.54 | 76.44 | 88.23 | 81.91 | 69.36 |
| MAResUNet | 99.56 | 75.99 | 89.53 | 82.21 | 69.79 |
| LANet | 99.37 | 59.02 | 90.96 | 71.59 | 55.75 |
| ResNeSt | 99.49 | 77.03 | 84.26 | 80.48 | 67.34 |
| ConvNeXt | 99.50 | 74.46 | 86.38 | 79.98 | 66.64 |
| SegFormer | 99.42 | 75.86 | 80.01 | 77.88 | 63.78 |
Note: bold font indicates the best results in each column.
Table 3.
Extraction results from the CDM-C data set (%).
| Model | OA | R | P | F1 | IOU |
|---|---|---|---|---|---|
| M-SKSNet | 99.08 | 68.35 | 79.98 | 73.71 | 58.37 |
| BiSeNet | 98.99 | 62.66 | 79.13 | 69.94 | 53.77 |
| LinkNet | 98.77 | 55.40 | 72.58 | 62.84 | 45.81 |
| EaNet | 98.88 | 65.90 | 71.91 | 68.77 | 52.41 |
| MAResUNet | 98.76 | 57.43 | 70.96 | 63.48 | 46.50 |
| LANet | 98.59 | 38.39 | 74.42 | 50.65 | 33.91 |
| ResNeSt | 98.99 | 62.51 | 79.11 | 69.84 | 53.65 |
| ConvNeXt | 98.62 | 57.34 | 64.95 | 60.91 | 43.79 |
| SegFormer | 98.63 | 51.27 | 68.15 | 58.52 | 41.36 |
Note: the bold font indicates the best results in each column.
Table 4.
Different method ablation experiment results (%).
| Method | Baseline | CNN Stem | MLKC | F1 | IOU |
|---|---|---|---|---|---|
| Baseline | √ | 84.98 | 73.88 | ||
| CNN stem | √ | √ | 85.77 | 75.09 | |
| MDC | √ | √ | 85.62 | 74.86 | |
| M-SKSNet | √ | √ | √ | 86.17 | 75.69 |
Table 5.
Model parameter details.
| Model Name | GFLOPS | Params (MB) | Throughput (FPS) |
|---|---|---|---|
| M-SKSNet | 64.14 | 37.48 | 28.40 |
| BiSeNet | 33.55 | 24.27 | 72.72 |
| EaNet | 18.76 | 34.23 | 78.50 |
| LANet | 9.62 | 11.25 | 198.78 |
| MAResUNet | 25.42 | 16.17 | 61.66 |
| LinkNet | 17.86 | 11.53 | 135.34 |
| ResNeSt | 37.24 | 18.24 | 61.32 |
| ConvNeXt | 71.62 | 46.42 | 30.93 |
| SegFormer | 13.10 | 7.71 | 78.98 |
Disclaimer/Publisher’s Note: The statements, opinions and data contained in all publications are solely those of the individual author(s) and contributor(s) and not of MDPI and/or the editor(s). MDPI and/or the editor(s) disclaim responsibility for any injury to people or property resulting from any ideas, methods, instructions or products referred to in the content. |
© 2024 by the authors. Licensee MDPI, Basel, Switzerland. This article is an open access article distributed under the terms and conditions of the Creative Commons Attribution (CC BY) license (https://creativecommons.org/licenses/by/4.0/).
Share and Cite
MDPI and ACS Style
Wang, J.; Liao, X.; Wang, Y.; Zeng, X.; Ren, X.; Yue, H.; Qu, W. M-SKSNet: Multi-Scale Spatial Kernel Selection for Image Segmentation of Damaged Road Markings. Remote Sens. 2024, 16, 1476. https://doi.org/10.3390/rs16091476
AMA Style
Wang J, Liao X, Wang Y, Zeng X, Ren X, Yue H, Qu W. M-SKSNet: Multi-Scale Spatial Kernel Selection for Image Segmentation of Damaged Road Markings. Remote Sensing. 2024; 16(9):1476. https://doi.org/10.3390/rs16091476
Chicago/Turabian StyleWang, Junwei, Xiaohan Liao, Yong Wang, Xiangqiang Zeng, Xiang Ren, Huanyin Yue, and Wenqiu Qu. 2024. "M-SKSNet: Multi-Scale Spatial Kernel Selection for Image Segmentation of Damaged Road Markings" Remote Sensing 16, no. 9: 1476. https://doi.org/10.3390/rs16091476
Note that from the first issue of 2016, this journal uses article numbers instead of page numbers. See further details here.