1. Introduction
Cotton is one of the most important row crops in the United States and is the third largest global producer and exporter of cotton [
1]. Cotton cultivation in the US extends from Virginia in the east to California in the west under a wide range of water levels in irrigated and rainfed systems. Of the cotton-producing states, Texas is number one, producing approximately 40% of US cotton annually [
1]. Cotton cultivation in Texas alone provides more than 125,000 jobs and contributes more than USD 21 billion annually to the national economy [
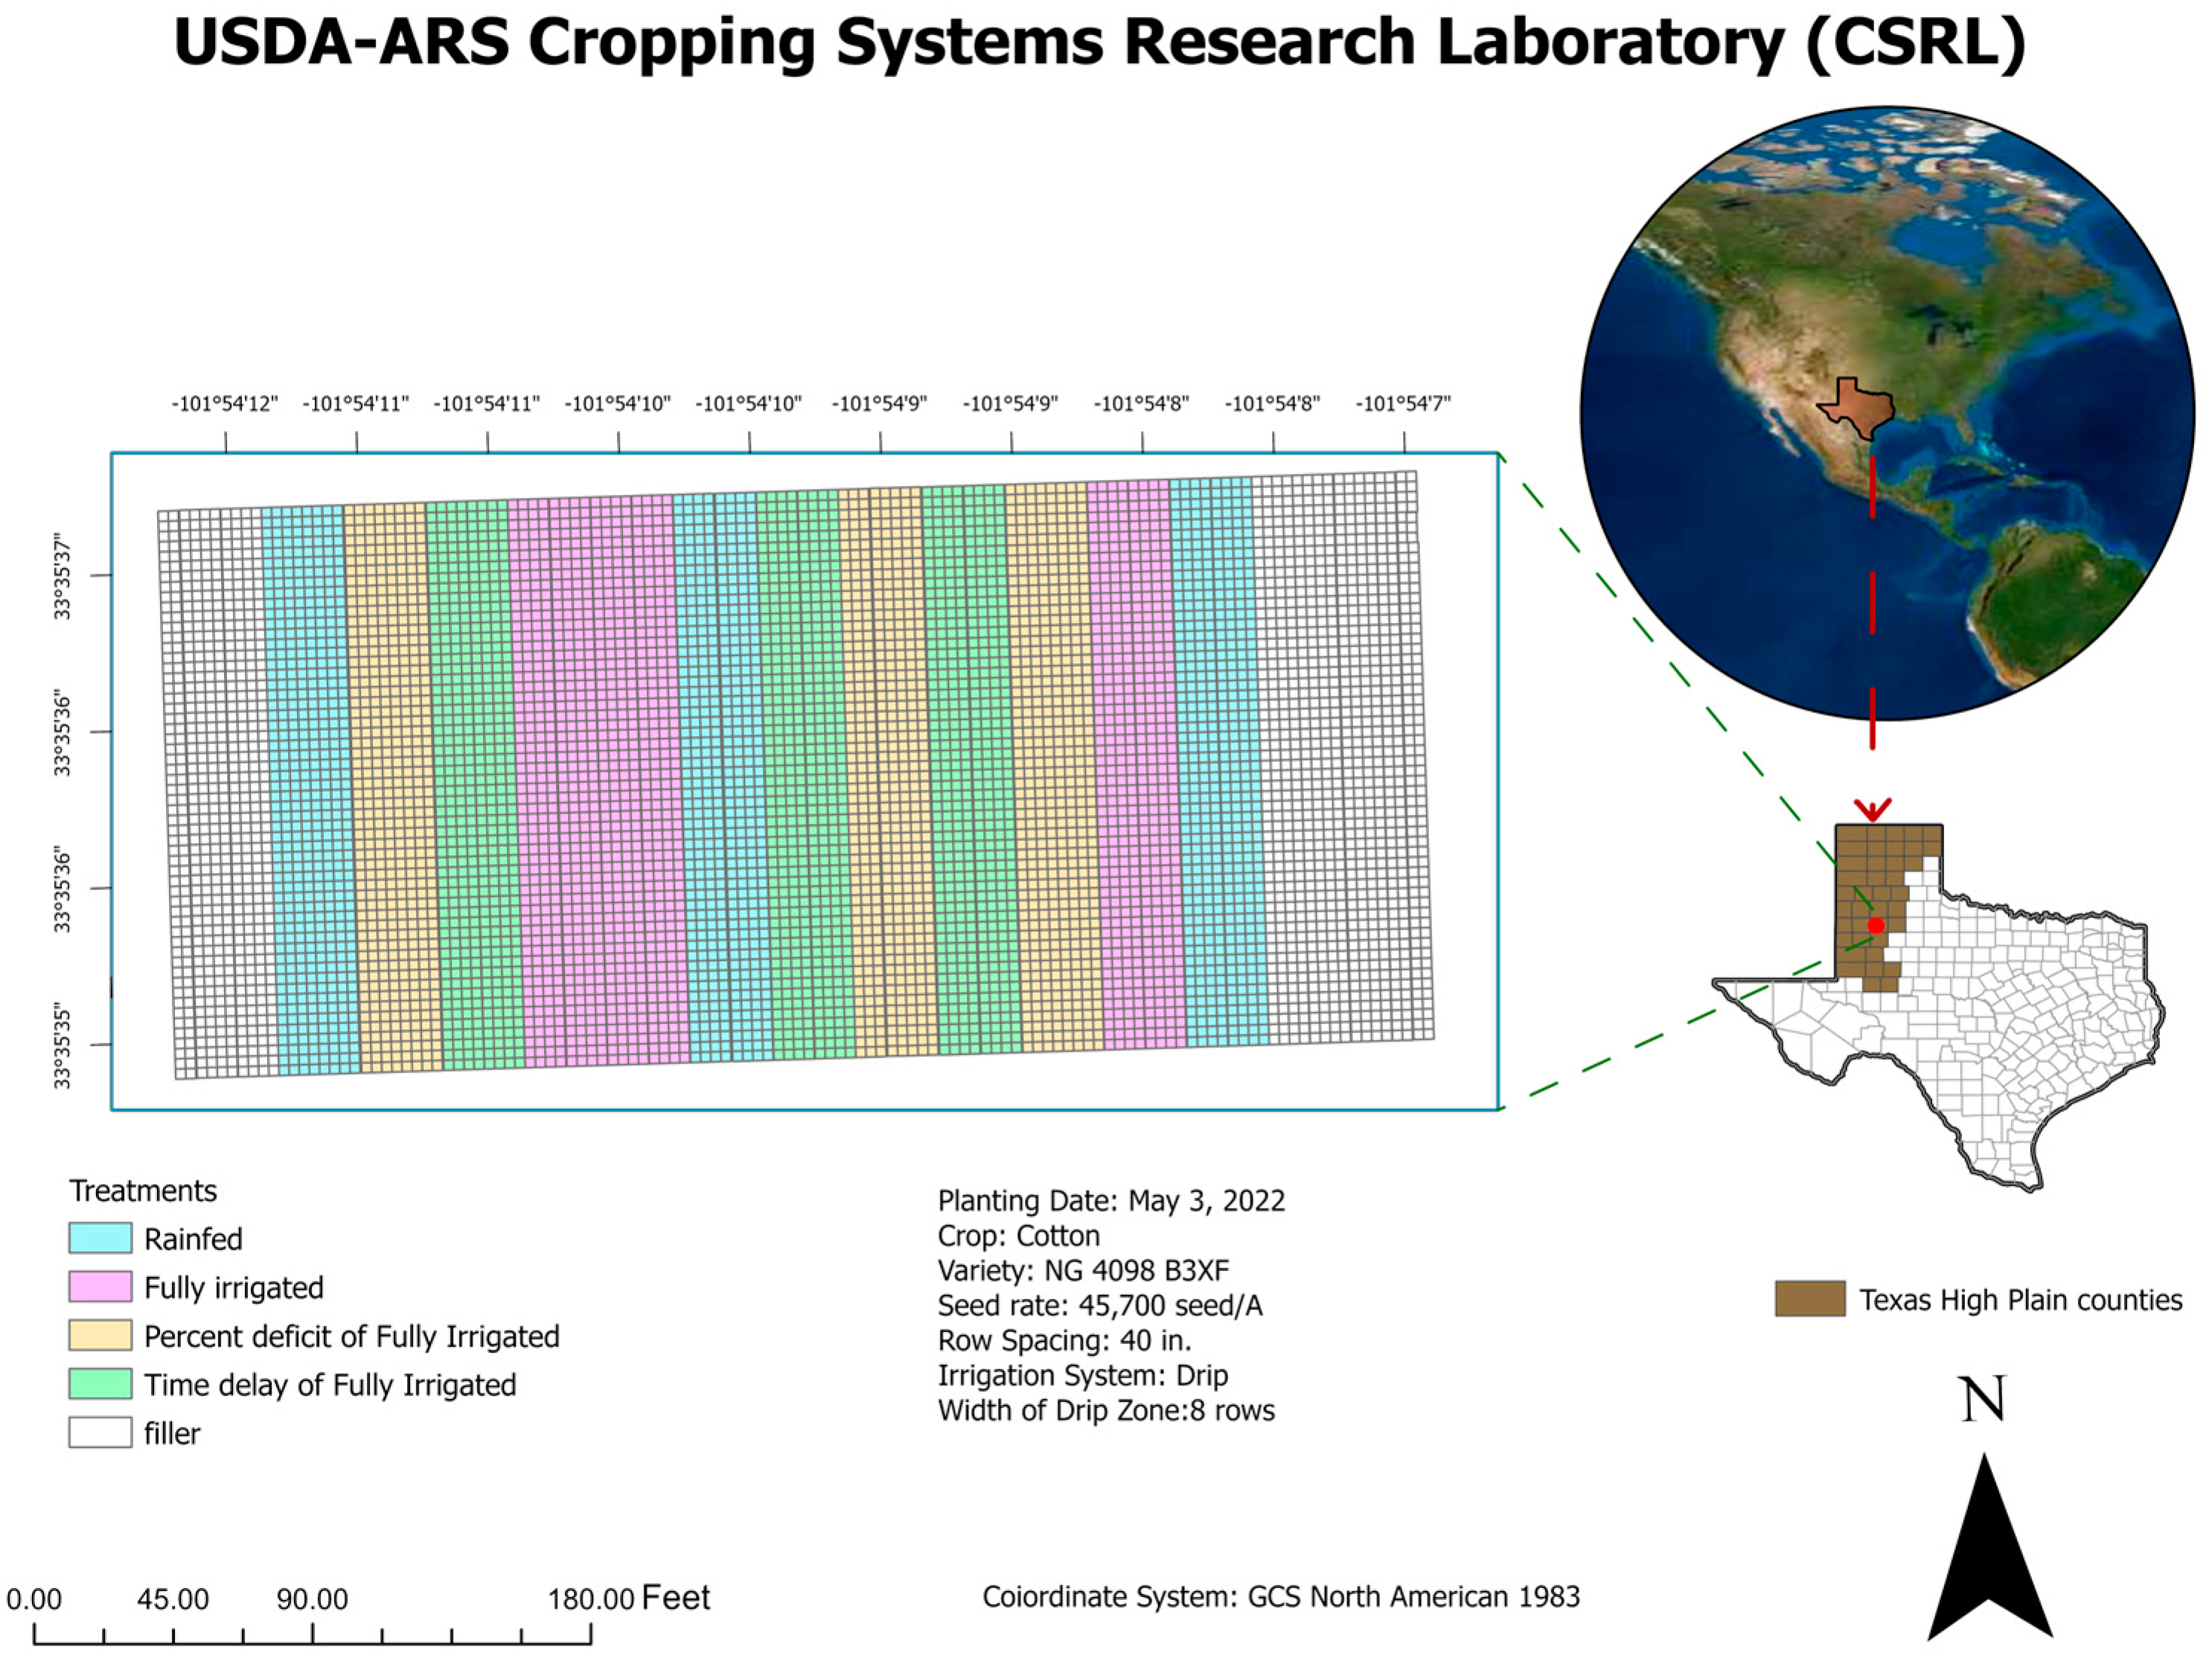
1]. The northwest plains region of Texas, also known as the Texas High Plains (THP) (
Figure 1), is the largest continuous cotton-producing region in the US [
2,
3]. Cotton production on THP is conducted under both rainfed and irrigated systems, with irrigated yields significantly higher and more stable than rainfed systems [
4]. Cotton is produced on approximately 4 million acres on the THP, with roughly 1.8 million acres of irrigated production. However, the irrigation capacity in the region has declined precipitously over the past two decades due to the depletion of the Ogallala aquifer [
5]. To preserve the long-term sustainability of the region and the profitability of cotton production, irrigation resources must be used efficiently to maximize yields and minimize production costs. Previous methods of irrigation scheduling relying on outdated evapotranspiration (ET) models, grower experience, or historic data may not provide accurate water need calculations under current climate demands and declining capacities. Based on a survey conducted by the United States Department of Agriculture (USDA) in 2018, 75% of people in the THP consider crop water demand and 40% of them consider soil water content to schedule irrigation [
6]. Irrigation schedules based on crop water demand use more water due to increased subsurface evaporation, while irrigation schedules based on soil water content were observed to have higher irrigation efficiency due to a decrease in subsurface evaporation [
7].
Current ET-based irrigation estimations are limited due to a lack of reliable and readily available in-field weather data. Actual crop evapotranspiration (
ETc) for each crop at various growth stages is obtained by multiplying reference evapotranspiration (ETO) with a crop coefficient (
Kc):
The reference
ET is an estimate of water used by a well-watered, fully covered, 15 cm tall grass surface based on meteorological data and various equations such as Penman–Monteith [
8] and Priestly–Taylor [
9]. The crop coefficient (
Kc) is a correction factor used to adjust ETo for a specific crop type [
10]. Errors in
Kc may arise from the underestimation of field variability in canopy size. Previous studies have also found that actual crop water use was not accurately represented by estimated irrigation requirements using empirical crop coefficients [
11]. Accurate irrigation requirement estimation is in fact a challenging task as crop water use is driven by several factors, both biological and physical, that cannot be accurately estimated by traditional methods [
12]. These errors commonly result in the overestimation of water use by the crop, thus resulting in over-irrigation. Unmanned aerial vehicles (UAVs) have become increasingly popular in recent years for crop monitoring as they provide a cost-effective and efficient means of collecting data on crop growth and development. The UAV platform, equipped with lightweight sensors, can capture high temporal and spatial resolution images of crops, which are analyzed using image processing techniques to map crop growth and development, assess plant health, and identify areas of water stress. The higher temporal and spatial resolution images and low operational costs make UAVs an ideal platform for field mapping and the monitoring of crop growth and water needs [
13,
14,
15].
UAV-derived products can provide high-resolution data on vegetation cover, height, and structure, which can be used to estimate ET more accurately than traditional methods. For example, studies have shown that UAV-derived canopy cover and height data can be used to estimate ET with high accuracy [
16]. UAVs can provide multi-temporal data, which can be useful in monitoring changes in vegetation and ET over time. This is important for understanding how land use changes and climate variability affect ET, and for identifying areas of water deficit or high water use. Furthermore, some relationships have been established between UAV-derived products and crop coefficients. Several linear and curvilinear relationships between Kc and canopy cover at various scales have been identified in past studies [
10,
17,
18]. ETo was calculated from weather data and Kc was derived from UAV data. An empirical relationship between UAV parameters and Kc was established and used to derive a variable water use map and forecast irrigation requirements along with canopy growth.
The objectives of this study were to (1) obtain crop phenotypic parameters such as canopy cover (CC) from a UAV, (2) assess the response of varying irrigation treatments on CC cotton yield and lint quality, and (3) compare ETC calculated from CC, proposed Kc, and Kc derived from previous studies.
2. Materials and Methods
2.1. Study Site
This study was conducted at the USDA-ARS Cropping Systems Research Laboratory (CSRL) in Lubbock, Texas (33.593° N, 101.89° W) (
Figure 1). Cotton (Nexgen 4098 B3XF) was planted on 4 May 2022, using standard planting practices at a rate of 18,500 seeds per ha. Irrigation was supplied by a sub-surface drip spaced on 1 m rows at a depth of approximately 35 cm. Four irrigation treatments were established in 8 row × 65 m long rows to create variability in plant growth and yield: (1) high pulse control—irrigation treatment triggered by CT-based stress time accumulation and soil moisture probe data; (2) time delay of control—irrigation was triggered by every other control irrigation signal (i.e., every other irrigation was skipped) to apply approximately 50% of the total control irrigation volume with extended water deficit intervals; (3) 25% of control—irrigation was applied at the same interval as the control at 25% of the control volume; (4) rainfed—no irrigation was applied after sowing. Each treatment was replicated 4 times randomly across the field for a total of 120 experimental rows. The crop was harvested on 4 October 2022.
GoField Plus systems (Goanna Ag. Pvt. Ltd., Goondiwindi, QLD, Australia) were placed in 2 replicate plots for each irrigation treatment. The GoField Plus system consists of a 1 m deep capacitance probe that provides soil moisture and temperature data in 10 cm increments and a single-pixel infrared canopy temperature sensor. Soil moisture data were collected every hour and canopy temperature data were collected every 15 min for the duration of the season. Data were reported every hour through a web application along with continuous weather data, growing day degrees, and modeled ET. Based on these measurements, irrigation events as well as the amount to apply were determined (
Figure 2). Irrigation was initiated on 24 June (51 DAP) and ceased on 11 August (99 DAP). Treatment zone irrigation volumes were (1) high pulse control—400 mm; (2) time delay of control—165 mm; (3) 25% of control—100 mm; and (4) rainfed—no irrigation. The intended irrigation volume on 76 DAP was 25%, but full irrigation was mistakenly applied. However, this error did not impact the research outcome and, thus, it might be considered an inconsequential error.
Weather data were collected at the site with a weather station that included a radiation sensor and silicon pyranometer (model LI-200S, LI-COR Biosciences, Lincoln, NE, USA), a temperature and relative humidity probe (model HMP45, Vaisala, Woburn, MA, USA), a 3-cup pulse anemometer (model 12102, R. M. Young, Traverse City, MI, USA), and a tipping-bucket rain gauge (model TR-525USW, Texas Electronics Inc., Dallas, TX, USA). The data obtained from the sensors were controlled by a data logger (model CR1000, Campbell Scientific, Logan, UT, USA) and are archived at
https://www.ars.usda.gov/plains-area/lubbock-tx/cropping-systems-research-laboratory/wind-erosion-and-water-conservation-research/docs/pswc-met-tower-data/ (accessed on 15 December 2023). In-season rainfall was 201 mm and the seasonal growing degree days were 1420 (
Figure 3).
2.2. UAV Data Collection and Processing
A DJI Phantom 4 equipped with a 20-megapixel red–green–blue (RGB) camera, a mechanical shutter, and a real-time kinematic (RTK) positioning module was used to acquire imagery data on 6 May (2 DAP), 26 May (22 DAP), 16 June (43 DAP), 7 July (64 DAP), 20 July (77 DAP), 4 August (92 DAP), 18 August (106 DAP), 2 September (121 DAP), and 3 October (152 DAP). The RTK module, using a fixed base station, was used to send correctional data to the UAV to increase the accuracy of the Global Navigation Satellite System (GNSS). Agisoft Metashape 2.1.1 [
19] software was used for image processing to generate spatially georeferenced orthomosaics, digital terrain models (DTMs), and digital surface models (DSMs) from the raw UAV imagery. The overall image processing pipeline followed in this study is presented in
Figure 4. CC was quantified by applying a binary classification algorithm to the orthomosaic images based on the RGB parameters to separate canopy from non-canopy objects [
20,
21].
The determination of canopy cover utilized a binary image generated through an analysis of color values in the red–green–blue (RGB) system using Canopeo Version 2.0, an ACT image analysis tool [
20]. This method produced binary images: white pixels signified regions adhering to the selection criteria (green canopy), while black pixels denoted areas not meeting the criteria (no green canopy). The fractional green canopy cover was quantified on a scale ranging from 0 (indicating no green canopy cover) to 1 (representing 100% green canopy cover). The classification of the green canopy was established based on the following criteria:
where R, G, and B are the pixel actual values in the red, green, and blue bands. Each color band could have a maximum pixel value of 255 (representing maximum intensity) and a minimum pixel value of 0 (representing no intensity). The parameters p1, p2, and p3 were used to classify pixels that were predominantly in the green band. The default values for the Canopeo algorithm were p1 = 0.95, p2 = 0.95, and p3 = 20 [
20].
2.3. Reference Evapotranspiration (Eto)
Daily ETo (mm/day) was calculated from the daily weather data (minimum and maximum temperature, solar radiation, wind speed, and relative humidity) using the Penman–Monteith evapotranspiration method, as shown in Equation (3) [
10,
22,
23,
24]:
where
is the daily total of net radiation (MJ m
−2 day
−1),
is the daily total of soil heat flux (MJ m
−2 day
−1),
is the average daily air temperature at a height of 2 m (°C),
is the average daily wind speed at a height of 2 m (m s
−1),
is average daily saturation vapor pressure (kPa),
is average daily actual vapor pressure (kPa),
is the slope of the saturation vapor pressure–air temperature curve (kPa °C
−1) at
, and
is the psychrometric constant (kPa °C
−1). Multiplication by 0.408 converted MJ m
−2 day
−1 to mm day
−1.
2.4. Cotton Lint Yield and Quality Data
Cotton fiber was mechanically harvested as single rows for each plot. Rows 1 and 8 adjacent to neighboring irrigation treatment plots were discarded and rows 2–7 were used for yield and quality analysis. Samples were collected and weighed to obtain seed cotton weights. Subsequently, each sample was ginned to collect the fiber and seed weight. Sub-samples of the fiber were collected for fiber quality analysis by a high-volume instrument (HVI). The parameters that were considered to evaluate lint quality in this study were fiber length, fiber strength, micronaire value, and uniformity index. Fiber length and fiber strength are the critical parameters for cotton lint quality. Longer fibers with higher strength are preferred because they produce stronger and better yarns for higher-quality textiles. HVI samples were collected for each row in every treatment and comprised 3 technical replicates per row.
3. Results
3.1. Effect of Irrigation Treatment on Canopy Cover
Since the canopy cover is an important indicator of plant growth, and irrigation is a crucial factor in plant growth, varying effects on canopy cover were observed according to the amount, frequency, and timing of water application. Canopy cover development was identical for all treatment rows from sowing until the initiation of irrigation on 24 June (51 DAP,
Figure 5). The control treatment rows showed a rapid increase in CC and stabilization from mid-July through September. CC in deficit treatments separated from the control CC according to irrigation amount, with higher irrigation amounts (time delay) showing higher CC than a 25% deficit, which was higher than the rainfed treatment.
3.2. Daily estimates of canopy cover
To address the issues of temporal irregularity in UAS data collection, we used three parameters’ log-normal functions (Equation (4)) and generated daily estimates of CC. This function had a strong fit (R
2 ranging from 0.91 to 0.98) on CC measurements obtained across all irrigation treatments (
Figure 6).
3.3. Effect of Irrigation Treatment on Cotton Yield and Lint Quality
Analysis of variance (ANOVA) was performed on the cotton yield dataset to assess the significant effect (
p < 0.001) of irrigation treatments on yield (
Table 1). The results indicate that there was a significant effect of irrigation treatments on yield. After performing an ANOVA, the Tukey HSD (honestly significant difference) test was also used to identify which treatment groups were statistically distinguishable from one another. The distinct letters (
Figure 6) indicate that all the irrigation treatment groups were statistically different from each other. The fully irrigated treatment produced a maximum yield of around 1.8 tons per hectare, whereas the rainfed treatment had a minimum yield of around 0.6 tons per hectare (
Figure 7). Cotton was irrigated through a subsurface drip method that delivered water directly to the plant root zone through buried drip lines, reducing water loss due to evaporation and runoff. The fully irrigated treatment provided crops with the full amount of water they needed to maximize the lint and seed cotton yield by promoting healthy plant growth and development.
3.4. Relationship between CC and Cotton Lint Yield
The relationship between canopy cover and lint yield was strongly supported by R-square values ranging from 0.68 to 0.88 across different growth stages. Notably, this correlation was most evident during mid-growth stages, with lower R-square values observed in later stages.
Figure 8 illustrates a clear trend, where rainfed plots (shown with purple dots) had lower yields linked to reduced canopy cover, while fully irrigated plots (depicted with black dots) with higher canopy cover displayed higher yields. Additionally, the steeper slope of the trendline in the scatter plot for 152 DAP suggests a heightened relationship between canopy cover and lint yield at this later stage of crop development. A steeper slope indicates that changes in canopy cover during this period had a much stronger relationship with lint yield.
3.5. Effect of Irrigation Treatment on Fiber Quality
Table 2 suggests that the fiber length for all four treatments were similar, but the fiber strength of cotton harvested from the fully irrigated plot was higher than that from other irrigation treatments. Similarly, micronaire, a measure of fiber fineness or thickness, was highest for fully irrigated plots, while that for a percent deficit of fully irrigated and rainfed plots was lowest. This suggested that the irrigated plots produced more mature and uniform fibers compared to rainfed plots. Likewise, fiber uniformity refers to the consistency of fiber length across a sample of cotton. A high level of uniformity ensures even yarns and fabrics, leading to better performance during manufacturing processes. The uniformity index was also higher for the fully irrigated plots compared to rainfed and partially irrigated plots.
3.6. Comparision of Actual Evapotranspiration (ETc) Estimates Utilizing Crop Coefficients and Canopy Cover
ETc was assessed in three scenarios: Case I, utilizing site-specific Kc values, representing the published values for cotton at various growth stages [
24]; Case II, substituting Kc with UAV-based fractional canopy cover (CC) measurements; and Case III, determining Kc using the empirical method developed by R. Hutmacher (
Figure 9) [
25].
As mentioned in Equation (1), the Kc method relies on specific crop coefficients that account for crop type, growth stage, and local conditions, providing a detailed and crop-specific estimation of ETc. In-season calculations of CC provide insights into the spatial and temporal variations of cotton’s canopy development, offering a more dynamic and precise estimate of water needs. A linear regression model was developed based on the relationship between CC and Kc, as established by R. Hutmacher (Kc = 0.013CC − 0.148) [
26].
Case I: (Kc values published for cotton growth and development)
Case II: (Kc was replaced by daily estimates of fractional CC)
Case III:
Overall, the
ETc obtained by using site-specific
Kc values was higher throughout the growing season compared to the
ETc calculated using
CC measurements. The established model (linear model between
Kc and
CC) and a direct replacement of Kc using
CC showed similar trends in all water treatments (
Figure 10). Additionally, as expected, the ETc value increased at the beginning of the growing season and peaked in the middle of the growing season. Then, the
ETc decreased slowly.
The implementation of site-specific CC methods resulted in a significant reduction in estimated crop water requirements compared to the traditional empirical Kc method. Across the entire growing season and at the field level, this new approach notably decreased the estimated crop evapotranspiration (ETc). This reduction in ETc signifies a substantial departure from previous estimations and highlights the potential for more efficient water management strategies. Importantly, this shift in methodology has direct implications for irrigation practices, particularly when utilizing actual ET as a basis for irrigation management. With this new approach, there is a corresponding reduction in water usage, indicating considerable potential for the conservation and optimization of water resources. By aligning irrigation practices with the spatial–temporal estimates of CC, there is a significant opportunity to save water without compromising crop health and yield.
Furthermore, regression models were established between canopy cover and evapotranspiration (ET) for four distinct irrigation treatments. These regression equations served as valuable tools for predicting the quantity of evapotranspiration, considering the extent of vegetation cover within each area for the specific irrigation treatment applied. As shown in
Figure 11, the regression analysis yielded the following R
2 values for each irrigation treatment: The rainfed treatment had an R
2 value of 0.68, indicating a relatively strong relationship between canopy cover and evapotranspiration. The full irrigation treatment had an R
2 value of 0.49, suggesting a moderate relationship. The percent deficit treatment showed an R
2 value of 0.65, indicating a relatively strong relationship. Lastly, the time delay treatment had an R
2 value of 0.59, indicating a moderate relationship.
4. Discussion
The findings of the present study align with those of previous research on the effect of irrigation treatments on canopy cover, evapotranspiration, cotton yield, and lint quality. Several studies have explored the relationship between water availability and cotton parameters, providing valuable context for interpreting the current results. Researchers investigated the impact of irrigation technology on the evapotranspiration and water footprint of cotton in Northern Greece and found that ETC was higher for full irrigation compared to deficit irrigation and was at least 20 mm higher for sprinkler irrigation systems compared to drip irrigation, under the same irrigation management [
27]). This observation is consistent with our current findings, where plants exposed to regulated deficit irrigation (RDI) demonstrated reduced canopy development and, thus, reduced ETc compared to optimally irrigated plants. Furthermore, a study conducted on the effect of irrigation on cotton showed that the cotton yields were significantly higher where the subsurface irrigation system was used, and the irrigation applications met 60–80% of crop water needs [
28]. This indicated that cotton yield is improved through proper irrigation techniques, such as subsurface drip irrigation, also adopted in our study, which was observed to improve the water use efficiency compared to the surface drip irrigation technique.
Rainfed treatment led to reduced canopy cover as crops conserved water by reducing their leaf area or closing their stomata to prevent water loss. A previous study on the drip irrigation of blueberries also showed that reduced irrigation led to decreased canopy cover and leaf area and reduced fruit yield. Rainfed treatment under greater water conditions led to a rapid decrease in canopy cover growth rate from July 20th to Aug 4th when conditions were too dry and there was no rainfall. This was because crops allocated more water resources to water conservation and the maintenance of existing leaves rather than producing new ones, which resulted in reduced photosynthesis and overall plant growth [
26]. Water stress reduced the canopy development rate and the time of maximum value and caused premature senesce of the crop. The regrowth of the canopy was observed after the rainfall event. Fully irrigated treatment, on the other hand, led to greater canopy cover as crops produced more leaves in response to the surplus water supply. Excessive growth of canopy cover may also lead to decreased efficiency in water use, increased disease pressure, and reduced fruit quality [
29]. Thus, applying water at the appropriate amount and timing based on plant water needs can lead to optimal canopy cover and plant growth. All treatments showed an abrupt increase in CC following the late-season rainfall in late August and moderate temperatures in early September, which induced the re-growth of the canopy.
Furthermore, the findings of this study are also consistent with those of previous research on the effect of irrigation treatments on cotton quality. Several studies have investigated the impact of varying water regimes on cotton fiber attributes, providing valuable context for interpreting the present results. In one study, researchers explored the influence of deficit irrigation on cotton fiber quality [
30]. They investigated the interaction between deficit irrigation and plant density on the growth, yield, and fiber quality of irrigated cotton and found that deficit irrigation reduced fiber length but increased fiber micronaire value. They thus concluded that the use of high plant density under deficit irrigation can be a promising alternative for water saving without compromising cotton yield. These findings align with those of our current study, where cotton subjected to deficit irrigation likely exhibited similar negative impacts on fiber length and strength.
The ANOVA results suggested that there were significant differences between the irrigation treatment groups in terms of the dependent variable (Sum Sq), as indicated by the low p-value very close to zero (1.08–32). Furthermore, the F-statistic (81.7) was high enough to support the significance of these differences.
Moreover, the R
2 values of the regression models, established between canopy cover and evapotranspiration (ET), for four distinct irrigation treatments provided valuable insight into the goodness of fit of the regression models for each irrigation treatment. Such information proved highly beneficial in estimating water requirements for crops based on their canopy cover. These findings broadly support the work of other studies in this area linking canopy cover with ETc. For example, de Medeiros, Gerson A. et al. conducted experiments to investigate the influence of crop canopy on ET [
31]. The crop coefficient was successfully related to ground cover, demonstrating their strong dependence on canopy size [
31]. Similarly, it was concluded that the percentage of canopy cover would determine the rate of ET [
32]. For annual crops, during the crop’s germination and establishment, most of the ET occurs as evaporation from the soil surface. As the foliage develops, evaporation from the soil surface decreases and transpiration increases [
32].
5. Conclusions
Reducing the overestimation of irrigation water required for dry and water-scarce regions such as the THP requires a comprehensive approach that combines accurate data collection, efficient irrigation practices, and sustainable water management. Data collection using higher temporal and spatial resolution UAV platforms is perfectly accurate and precise. In this paper, a UAV system was utilized to measure the cotton water stress response with four different irrigation treatments. This research concluded that water stress in cotton resulted in the reduction of canopy cover growth and crop yield, showing that irrigation is critical for agricultural production. When the high spatial resolution UAV-derived data were combined with higher temporal resolution weather data obtained from an installed weather station and the published value of crop coefficient (Kc), cotton water requirement, according to the spatial location of the field, could be calculated with higher accuracy. A regression model was developed to estimate the actual ET for the cotton field, with an R2 as high as 0.68. Thus, this shows great potential to develop an efficient irrigation scheduling method in the future. Optimized crop water management by using efficient irrigation scheduling can minimize water loss and improve crop yield, profitability, and sustainability. In the future, the authors will collect multi-year data from the same cotton field with a UAV system. Ground truth data for actual ET will also be collected from the lysimeter and eddy covariance system in the same field, which will help to derive more accurate ET estimation models.
The data presented in this manuscript suggests a correlation between irrigation water applied, cotton yield, and crop quality. However, optimizing irrigation practices involves considering various factors beyond just maximizing yield and quality, such as cost, environmental impact, and trade-offs between different irrigation strategies. The introduction of a UAV-derived canopy cover coefficient presents an opportunity to further refine and optimize irrigation strategies. By leveraging this technology, farmers can gain real-time insights into crop health and water stress, allowing for more precise and timely irrigation decisions. This can help mitigate the negative effects of both over-irrigation and under-irrigation, leading to improved water use efficiency, yield, and crop quality.
The applicability of UAV technology to the average cotton farmer on the THP can indeed be significant, but it may not necessarily involve every farmer owning drones and sophisticated image classification software, considering the cost of high-quality drones and specialized software for image analysis. Instead of owning drones, farmers may rely on service providers who offer UAV-based services for crop monitoring, including capturing aerial imagery and analyzing it for various purposes such as estimating evapotranspiration rates, identifying areas of stress, or assessing crop health. These service providers may offer more cost-effective solutions for farmers who do not want to invest in their own equipment and software. Moreover, even without sophisticated image classification and analysis, UAV imagery can still provide valuable insights to inform irrigation practices. For example, a simple visual inspection of aerial imagery captured by drones can help farmers identify areas of uneven crop growth or areas experiencing water stress. This visual information can guide farmers in adjusting their irrigation practices accordingly. Likewise, providing farmers with education and training on how to interpret UAV imagery and integrate it into their decision-making processes can be highly beneficial. This does not necessarily require advanced software skills but rather a basic understanding of how to observe and interpret aerial imagery in the context of crop management. Also, there are emerging platforms and services that aim to simplify the process of analyzing UAV imagery for agricultural purposes. These platforms often offer user-friendly interfaces and automated analysis tools, making it easier for farmers to extract useful information from aerial imagery without needing advanced technical skills. In summary, access to service providers, education and training, and user-friendly data platforms can help make UAV technology more accessible and practical for average farmers on the THP.
Author Contributions
A.R. collected data, analyzed the data, and wrote the original draft manuscript. J.L.-B., C.W.B., M.B., M.M.M. and N.D. conceptualized the project, acquired funding, and guided the overall research work. H.N. and M.B. contributed to the methodology and helped in reviewing and editing the manuscript. P.P. (Paxton Peyton), R.J.L. and T.G. helped with data curation. J.L.L.-S. and P.P. (Pankaj Pal) processed the datasets. All authors have read and agreed to the published version of the manuscript.
Funding
This research received funding from the Texas Water Research Institute (TWRI).
Data Availability Statement
The data presented in this study are available on request from the corresponding author due to privacy.
Acknowledgments
The authors would like to acknowledge Allen A. Berthold for his overall administrative support of this project.
Conflicts of Interest
The authors declare no conflicts of interest.
References
- Meyer, L.; Dew, T. Global 2023/24 Cotton Ending Stocks Increase; Prices Weaken Global Cotton Stocks and Prices Ending Stocks (Million Bales) A-Index (cents/lb.) Economic Research Service|Situation and Outlook Report. Available online: https://www.ers.usda.gov/webdocs/outlooks/107397/cws-23i.pdf?v=6522 (accessed on 14 October 2023).
- Adhikari, P.; Ale, S.; Bordovsky, J.P.; Thorp, K.R.; Modala, N.R.; Rajan, N.; Barnes, E.M. Simulating future climate change impacts on seed cotton yield in the Texas High Plains using the CSM-CROPGRO-Cotton model. Agric. Water Manag. 2016, 164, 317–330. [Google Scholar] [CrossRef]
- Kothari, K.; Ale, S.; Bordovsky, J.P.; Munster, C.L.; Singh, V.P.; Nielsen-Gammon, J.; Hoogenboom, G. Potential genotype-based climate change adaptation strategies for sustaining cotton production in the Texas High Plains: A simulation study. Field Crops Res. 2021, 271, 108261. [Google Scholar] [CrossRef]
- Ale, S.H. Simulated Dryland Cotton Yield Response to Selected Scenario Factors Associated with Soil Health. Front. Sustain. Food Syst. 2021, 4, 9. [Google Scholar] [CrossRef]
- Bordovsky, J.P. Cotton irrigation timing with variable seasonal irrigation capacities in the Texas South Plains. Appl. Eng. Agric. 2015, 31, 883–897. [Google Scholar]
- Ajaz, A.; Datta, S.; Stoodley, S. High plains aquifer–state of affairs of irrigated agriculture and role of irrigation in the sustainability paradigm. Sustainability 2020, 12, 3714. [Google Scholar] [CrossRef]
- Zhang, G.; Li, X. Estimate Cotton Water Consumption from Shallow Groundwater under Different Irrigation Schedules. Agronomy 2022, 12, 213. [Google Scholar] [CrossRef]
- Monteith, J.L. Evaporation and environment. Symp. Soc. Exp. Biol. 1965, 19, 205–234. [Google Scholar]
- Priestley, C.H.B.; Taylor, R.J. On the assessment of surface heat flux and evaporation using large-scale parameters. Mon. Weather Rev. 1972, 100, 81–92. [Google Scholar] [CrossRef]
- Allen, R.G.; Pereira, L.S. Crop Evapotranspiration: Guidelines for Computing Crop Water Requirements; Food and Agriculture Organization of the United Nations: Rome, Italy, 1998; Available online: https://www.researchgate.net/publication/235704197_Crop_evapotranspiration-Guidelines_for_computing_crop_water_requirements-FAO_Irrigation_and_drainage_paper_56 (accessed on 17 October 2023).
- Hunsaker, D.J.; Pinter, P.J.; Barnes, E.M.; Kimball, B.A. Estimating cotton evapotranspiration crop coefficients with a multispectral vegetation index. Irrig. Sci. 2003, 22, 95–104. [Google Scholar] [CrossRef]
- Koudahe, K.S. Irrigation-water management and productivity of cotton: A review. Sustainability 2021, 13, 10070. [Google Scholar] [CrossRef]
- Niu, H.; Hollenbeck, D.; Zhao, T.; Wang, D.; Chen, Y. Evapotranspiration estimation with small uavs in precision agriculture. Sensors 2020, 20, 6427. [Google Scholar] [CrossRef] [PubMed]
- Jung, J.; Maeda, M.; Chang, A.; Bhandari, M.; Ashapure, A.; Landivar-Bowles, J. The potential of remote sensing and artificial intelligence as tools to improve the resilience of agriculture production systems. Curr. Opin. Biotechnol. 2021, 70, 15–22. [Google Scholar] [CrossRef]
- Zhang, Y.; Han, W.; Zhang, H.; Niu, X.; Shao, G. Evaluating maize evapotranspiration using high-resolution UAV-based imagery and FAO-56 dual crop coefficient approach. Agric. Water Manag. 2023, 275, 108004. [Google Scholar] [CrossRef]
- Masek, J.G. North American forest disturbance mapped from a decadal Landsat record. Remote Sens. Environ. 2008, 112, 2914–2926. [Google Scholar] [CrossRef]
- Bodner, G.; Loiskandl, W.; Kaul, H.P. Cover crop evapotranspiration under semi-arid conditions using FAO dual crop coefficient method with water stress compensation. Agric. Water Manag. 2007, 93, 85–98. [Google Scholar] [CrossRef]
- Greenwood, K.L.; Lawson, A.R.; Kelly, K.B. The water balance of irrigated forages in northern Victoria, Australia. Agric. Water Manag. 2009, 96, 847–858. [Google Scholar] [CrossRef]
- Metashape. Agisoft Metashape. 2022. Available online: https://www.agisoft.com/ (accessed on 19 December 2022).
- Patrignani, A.; Ochsner, T.E. Canopeo: A powerful new tool for measuring fractional green canopy cover. Agron. J. 2015, 107, 2312–2320. [Google Scholar] [CrossRef]
- Bhandari, M.; Chang, A.; Jung, J.; Ibrahim, A.M.H.; Rudd, J.C.; Baker, S.; Landivar, J.; Liu, S.; Landivar, J. Unmanned aerial system-based high-throughput phenotyping for plant breeding. Plant Phenome J. 2023, 6, e20058. [Google Scholar] [CrossRef]
- Monteith, J.L. Climate and the efficiency of crop production in Britain. Philos. Trans. R. Soc. Lond. B Biol. Sci. 1977, 281, 277–294. [Google Scholar]
- Zotarelli, L.; Dukes, M.D.; Romero, C.C.; Migliaccio, K.W.; Morgan, K.T. Step by Step Calculation of the Penman-Monteith Evapotranspiration (FAO-56 Method). 2013. Available online: https://www.agraria.unirc.it/documentazione/materiale_didattico/1462_2016_412_24509.pdf (accessed on 12 December 2023).
- Fipps, G. GROWER’S GUIDE: Using PET for Determining Crop Water Requirements and Irrigation Scheduling Contents. Available online: http://texaset.tamu.edu (accessed on 15 December 2023).
- Hanson, B. Crop Coefficients. Available online: https://ucanr.edu/sites/Irrigation_and_Soils_/files/93370.pdf (accessed on 20 February 2024).
- Tarara, J.M.; Perez Peñ, J.E. Moderate Water Stress from Regulated Deficit Irrigation Decreases Transpiration Similarly to Net Carbon Exchange in Grapevine Canopies. J. Am. Soc. Hortic. Sci. 2015, 140, 413–426. [Google Scholar] [CrossRef]
- Tsakmakis, I.D.; Zoidou, M.; Gikas, G.D.; Sylaios, G.K. Impact of Irrigation Technologies and Strategies on Cotton Water Footprint Using AquaCrop and CROPWAT Models. Environ. Process. 2018, 5, 181–199. [Google Scholar] [CrossRef]
- Kalfountzos, D.; Alexiou, I.; Kotsopoulos, S.; Zavakos, G.; Vyrlas, P. Effect of subsurface drip irrigation on cotton plantations. Water Resour. Manag. 2007, 21, 1341–1351. [Google Scholar] [CrossRef]
- Zhang, D.; Liu, Y.; Li, Y.; Qin, L.; Li, J.; Xu, F. Reducing the excessive evaporative demand improved the water-use efficiency of greenhouse cucumber by regulating the trade-off between irrigation demand and plant productivity. HortScience 2018, 53, 1784–1790. [Google Scholar] [CrossRef]
- Zhang, D.; Luo, Z.; Liu, S.; Li, W.; Dong, H. Effects of deficit irrigation and plant density on the growth, yield and fiber quality of irrigated cotton. Field Crops Res. 2016, 197, 1–9. [Google Scholar] [CrossRef]
- de Medeiros, G.A. The influence of crop canopy on evapotranspiration and crop coefficient of beans (Phaseolus vulgaris L.). Agric. Water Manag. 2001, 49, 211–224. [Google Scholar] [CrossRef]
- Van der Gulik, T.; Nyvall, J. Crop Coefficients For Use In Irrigation Scheduling; Agdex 561; Ministry of Agriculture, Food and Fisheries: Abbotsford, BC, Canada, 2001. Available online: https://www.google.com/url?sa=t&source=web&rct=j&opi=89978449&url=https://irrigationtoolbox.com/ReferenceDocuments/Extension/BCExtension/577100-5.pdf&ved=2ahUKEwiPjt6ug-6FAxWRia8BHciLCcEQFnoECBUQAQ&usg=AOvVaw2wPEDg5KMfLKZYelWvR9Bn (accessed on 23 December 2023).
| Disclaimer/Publisher’s Note: The statements, opinions and data contained in all publications are solely those of the individual author(s) and contributor(s) and not of MDPI and/or the editor(s). MDPI and/or the editor(s) disclaim responsibility for any injury to people or property resulting from any ideas, methods, instructions or products referred to in the content. |
© 2024 by the authors. Licensee MDPI, Basel, Switzerland. This article is an open access article distributed under the terms and conditions of the Creative Commons Attribution (CC BY) license (https://creativecommons.org/licenses/by/4.0/).


 ,
, 


