
Estimation of Groundwater Recharge in the Lobo Catchment (Central-Western Region of Côte d’Ivoire)

 ,
,
Abstract
:1. Introduction
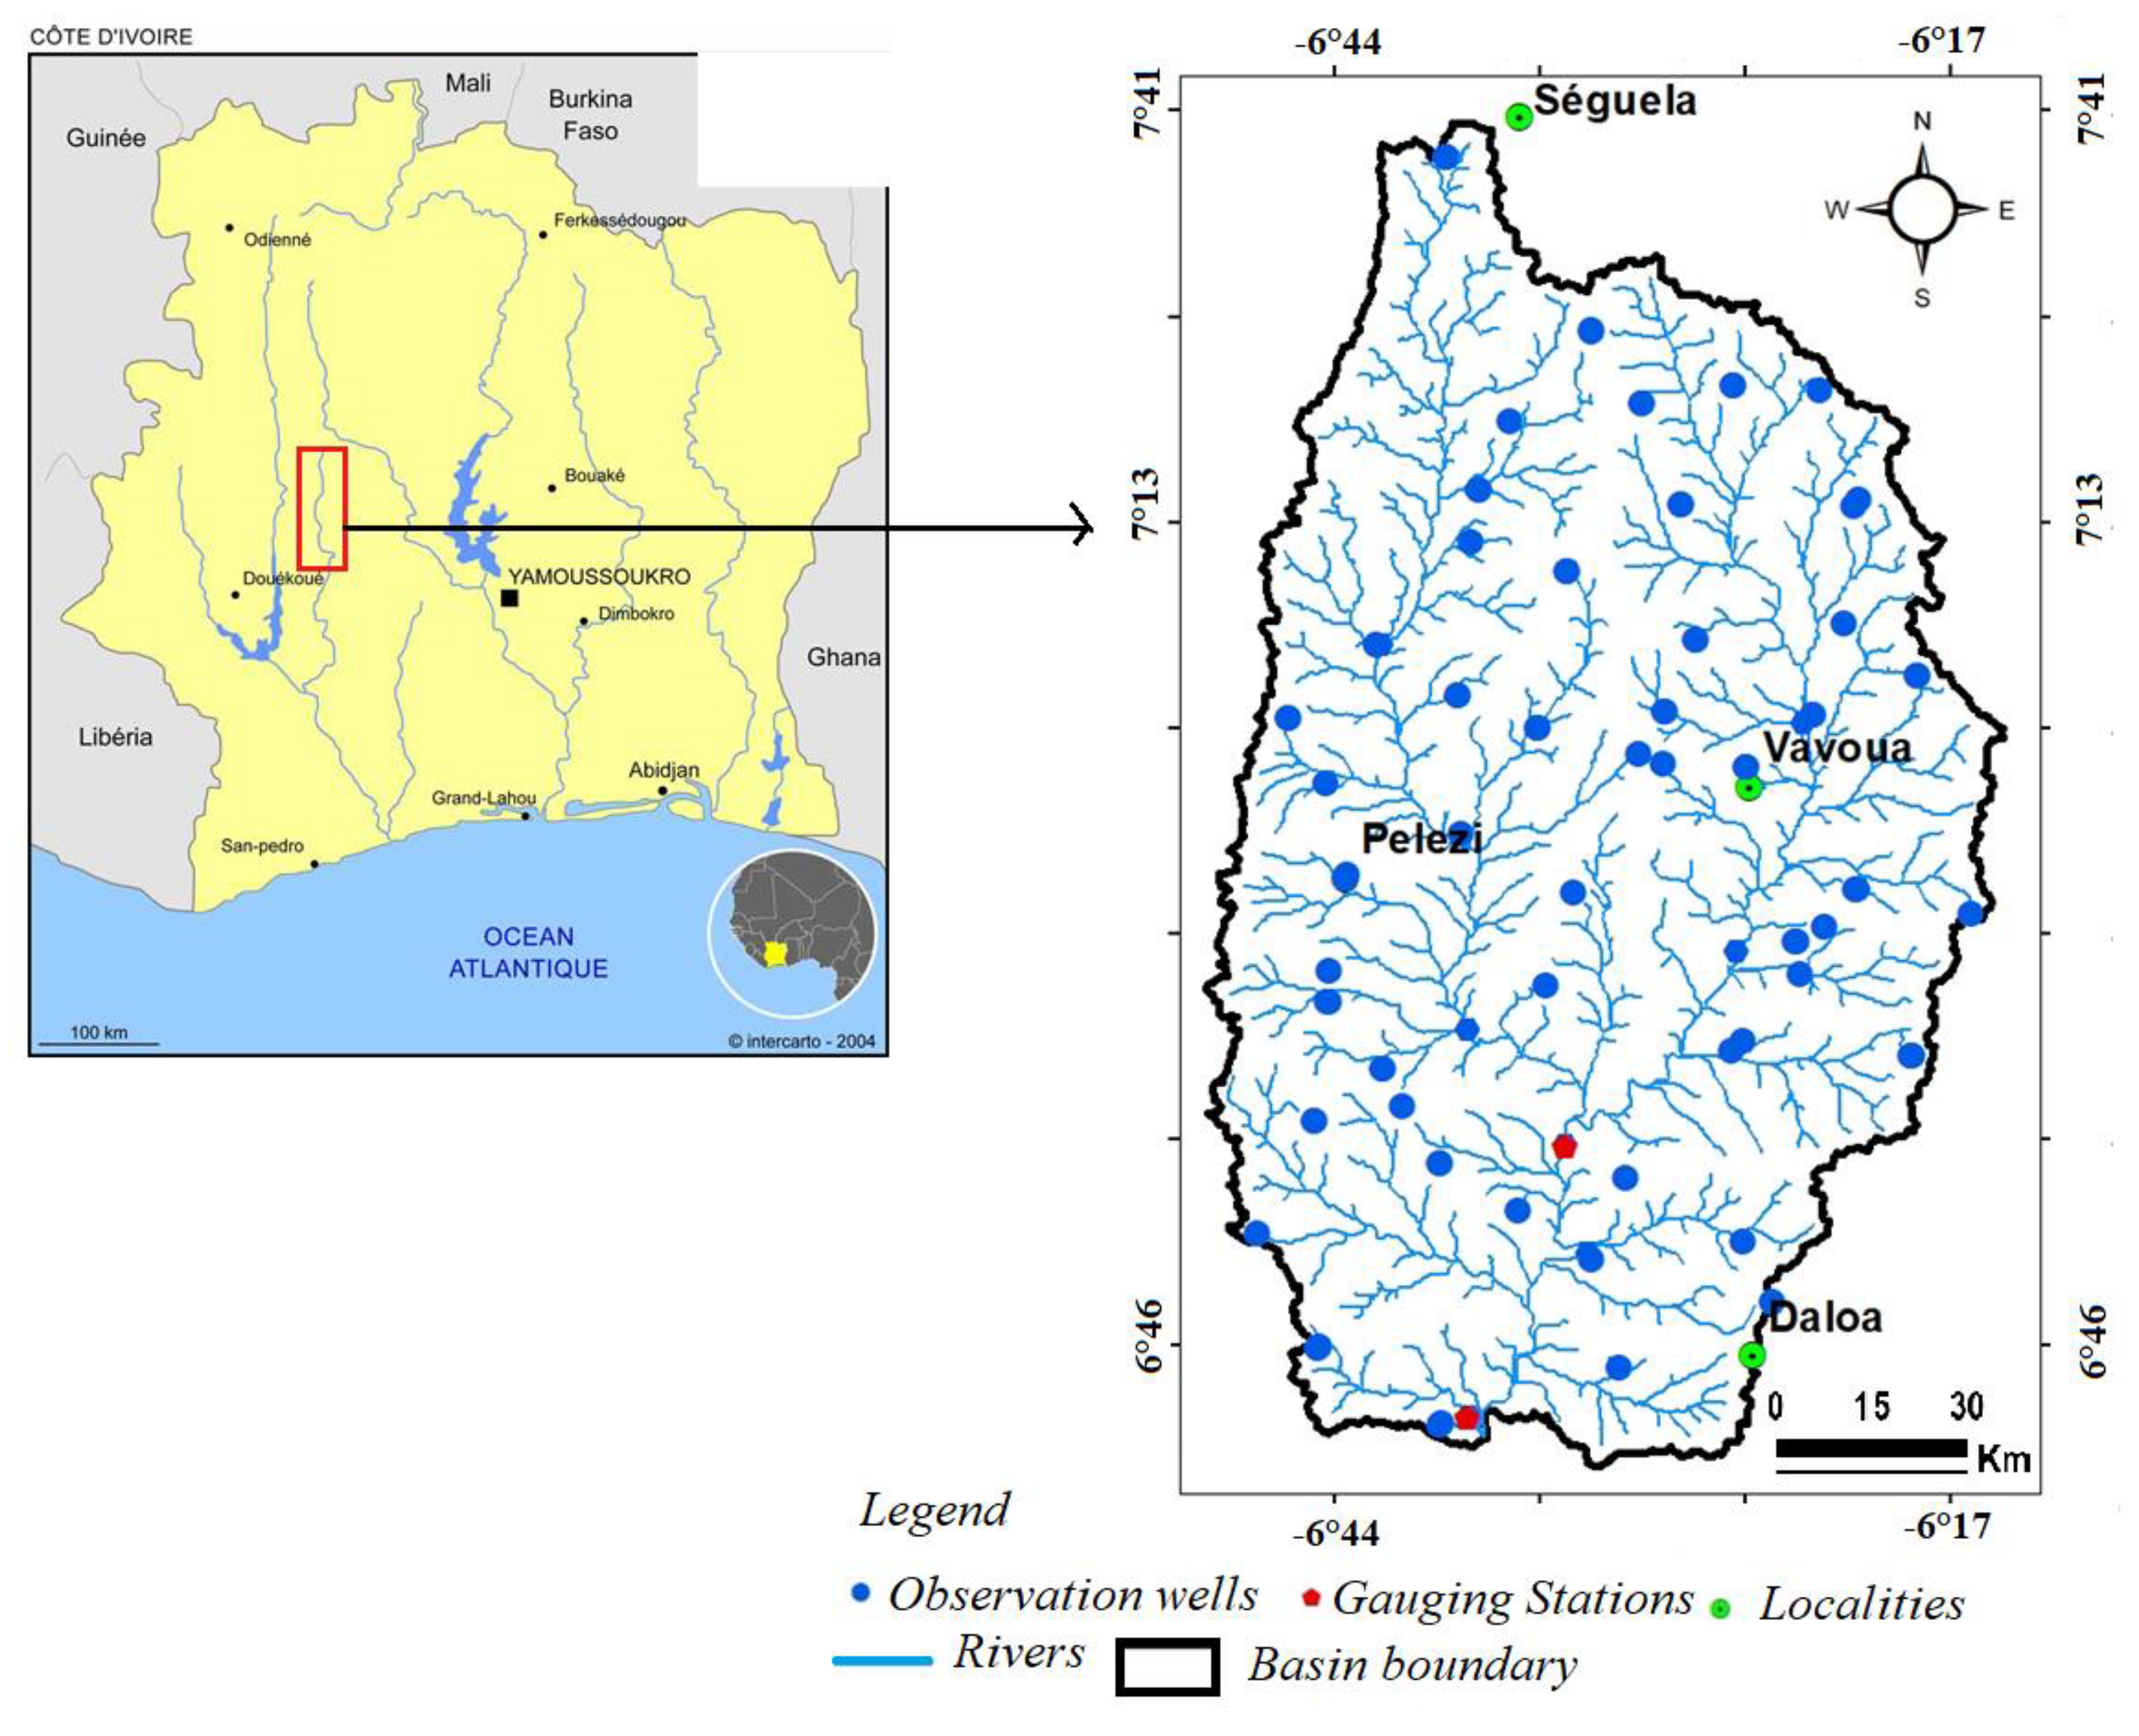
2. Study Area
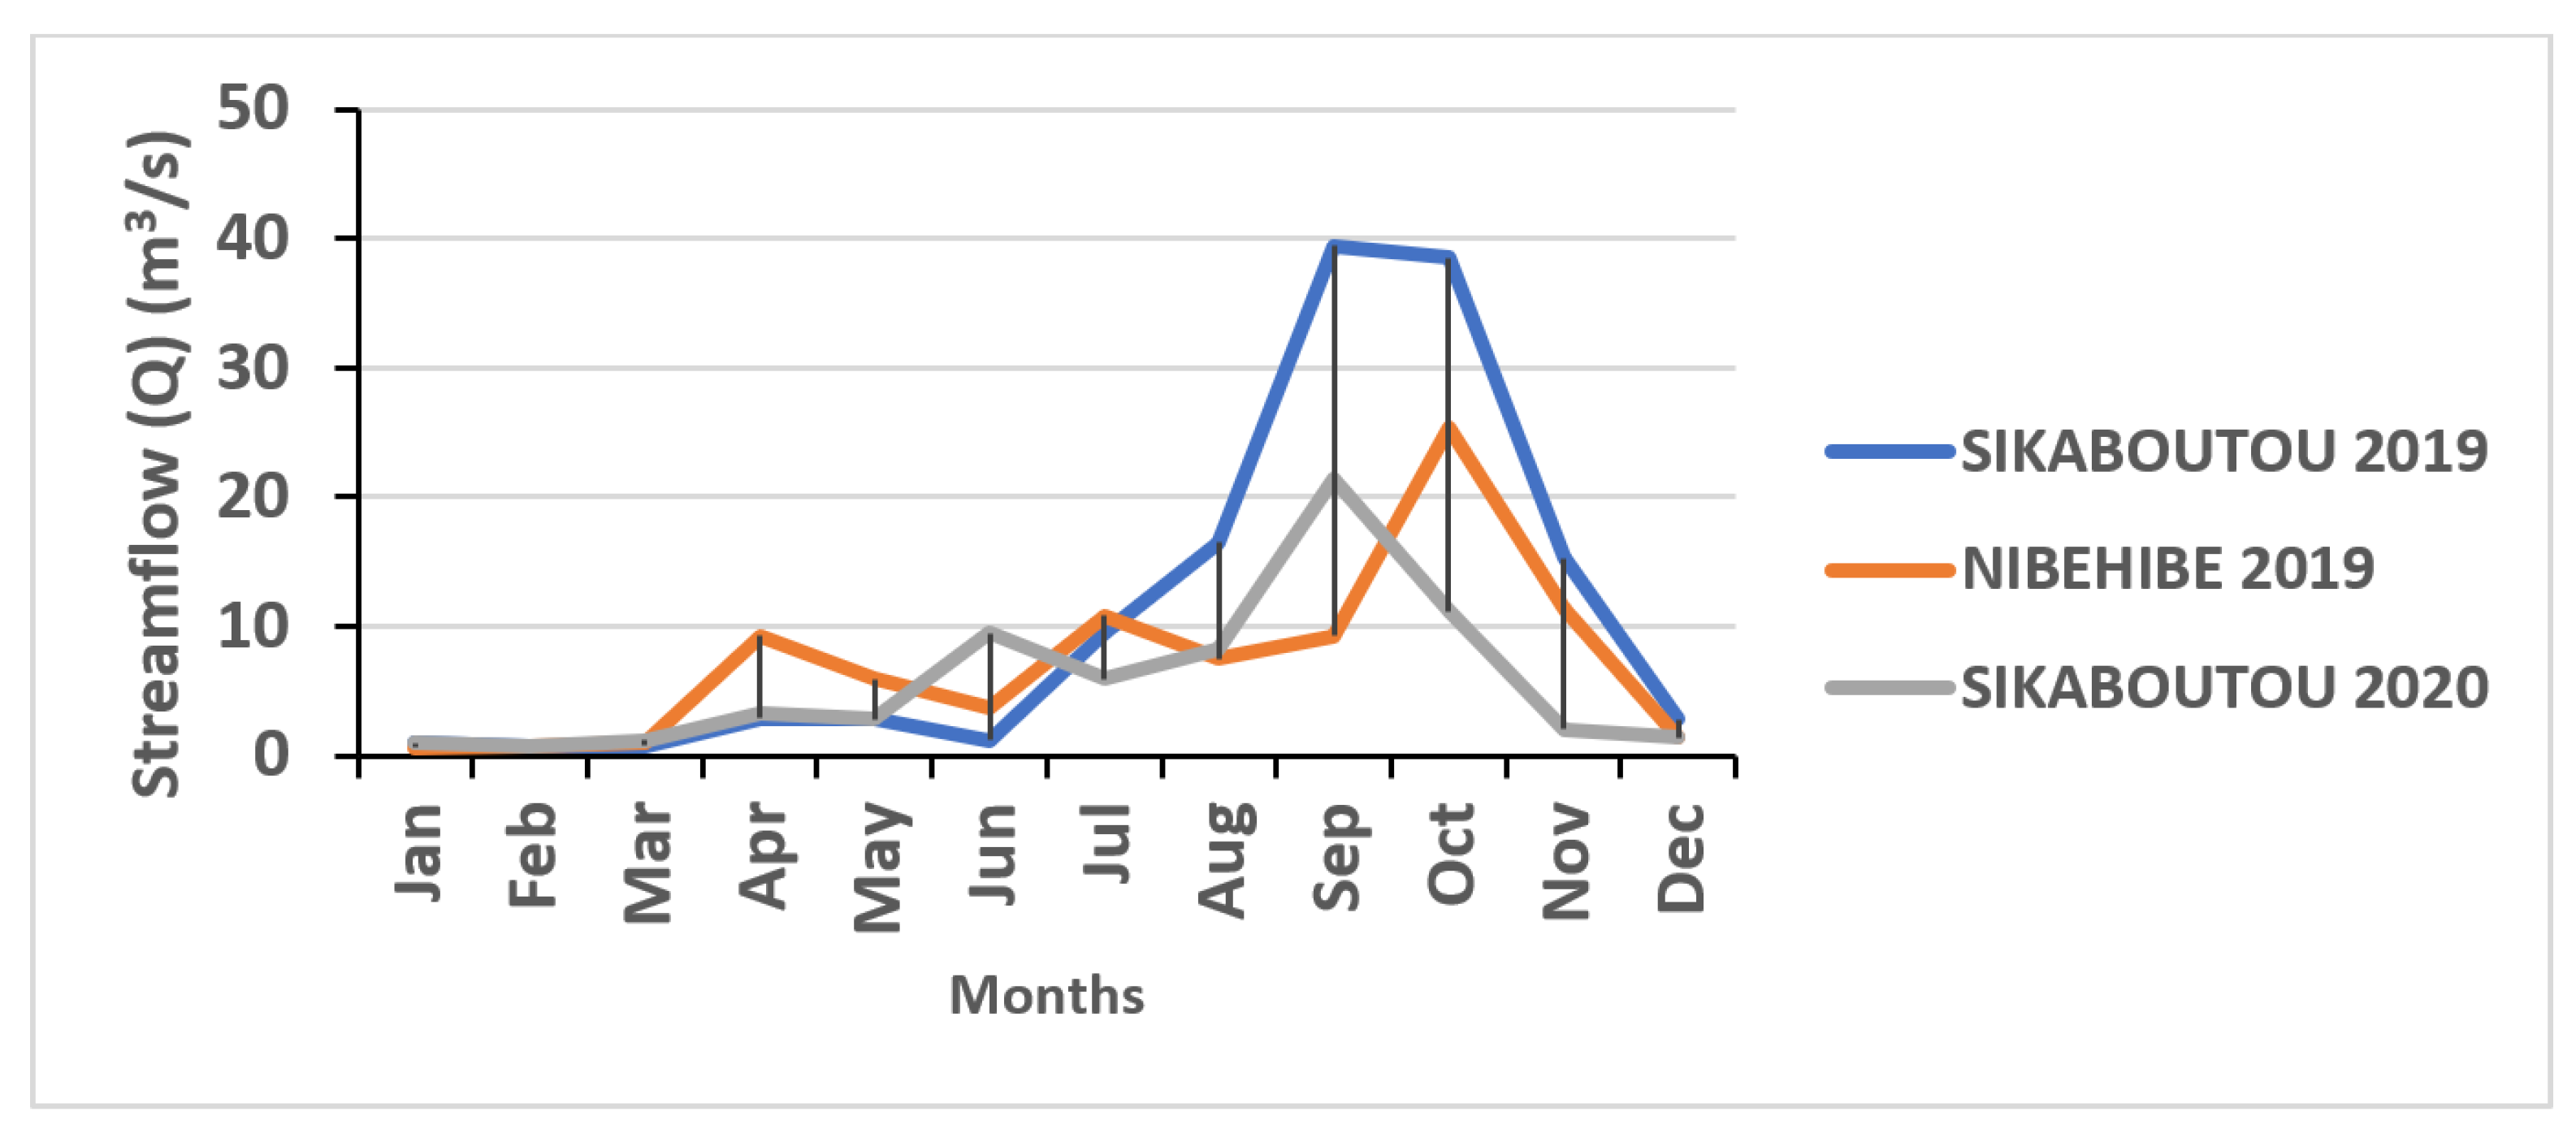
2.1. Stream Runoff
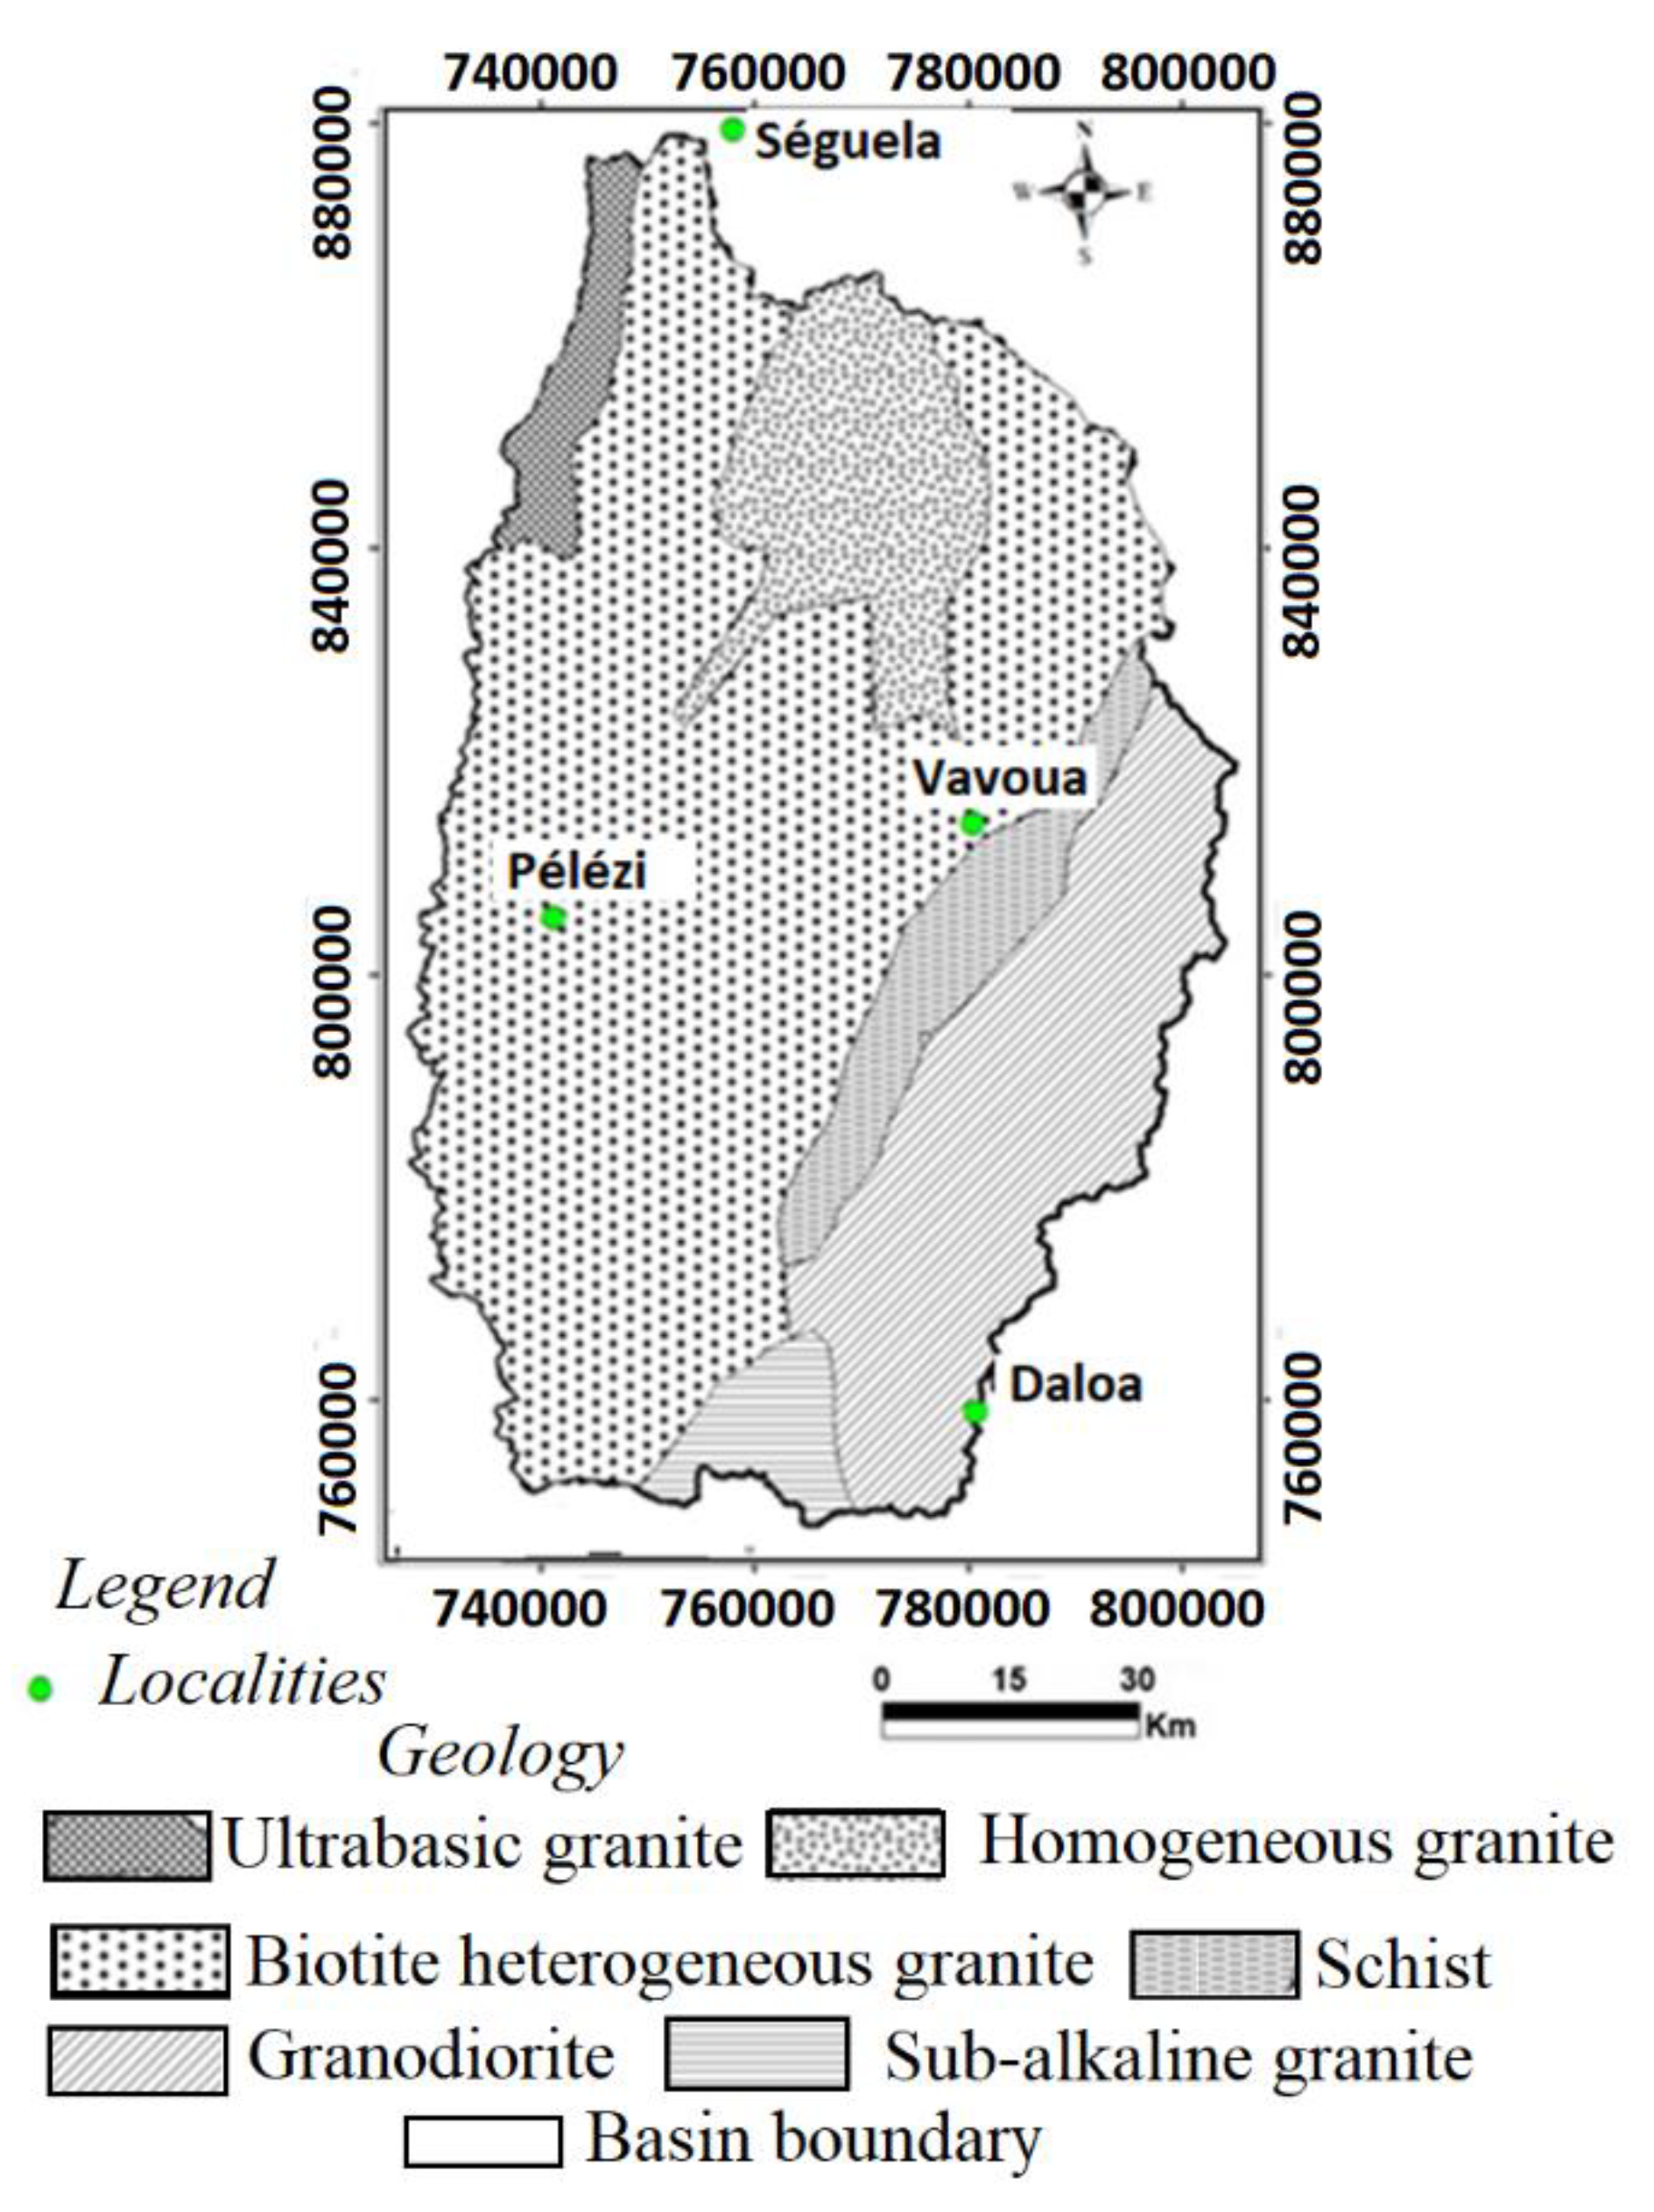
2.2. Geological and Hydrogeological Overview of the Study Area
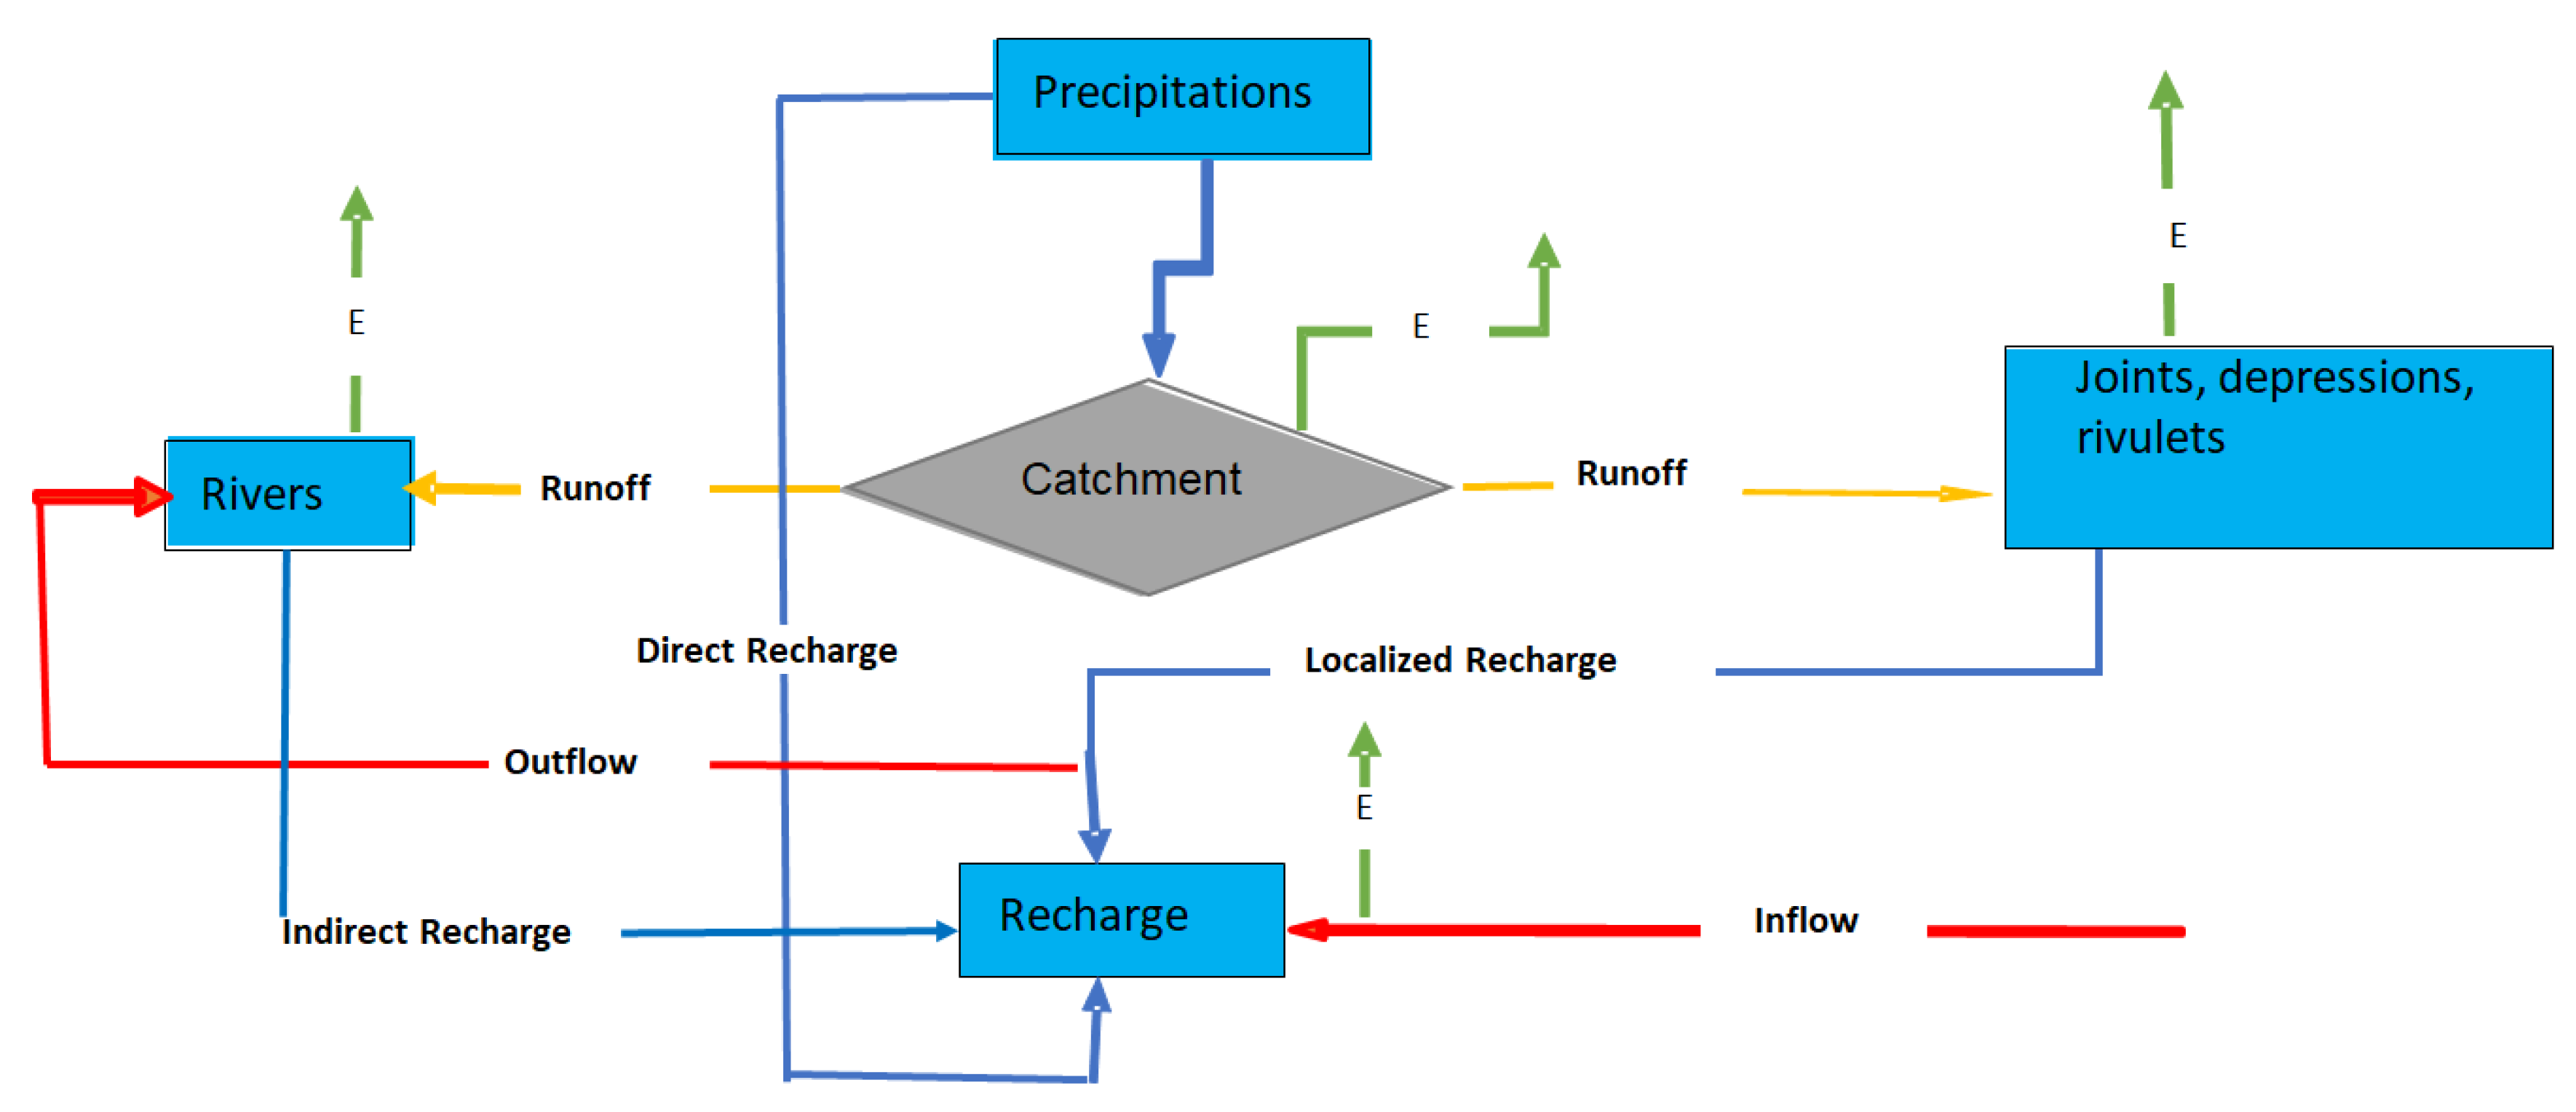
2.3. Groundwater Recharge Processes
3. Materials and Methods
3.1. Data
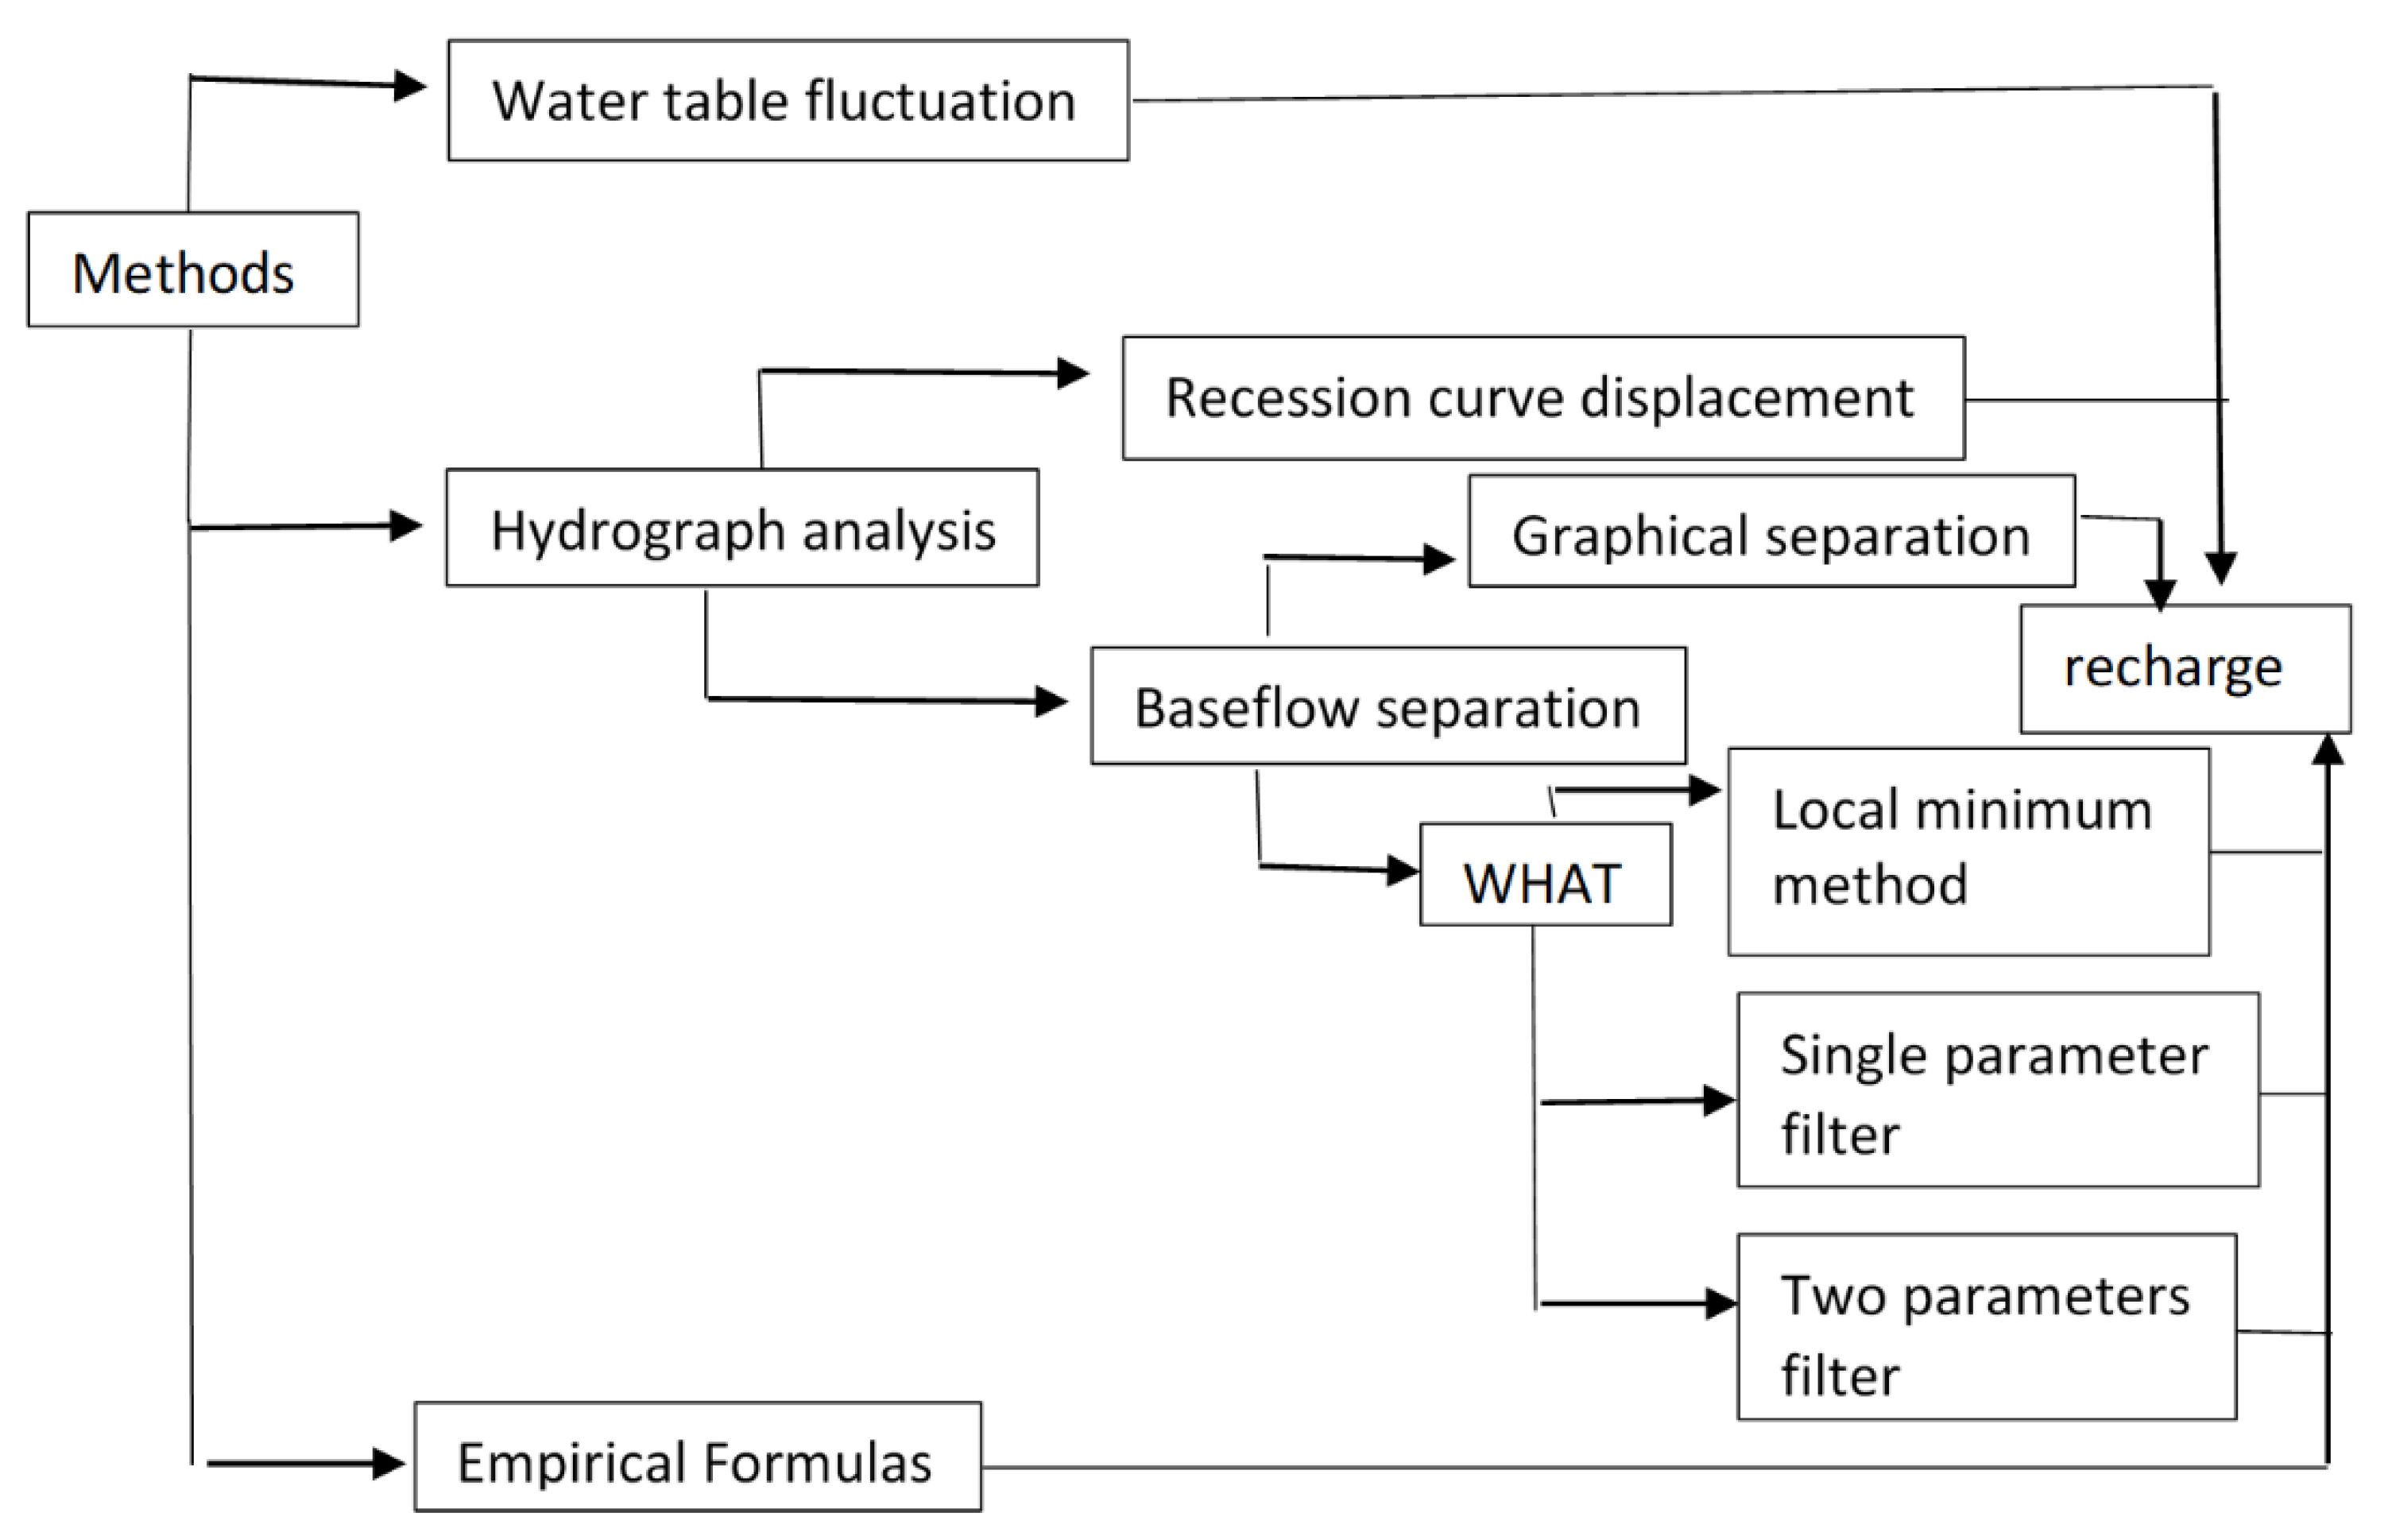
3.2. Methods
3.2.1. Hydrograph Analysis
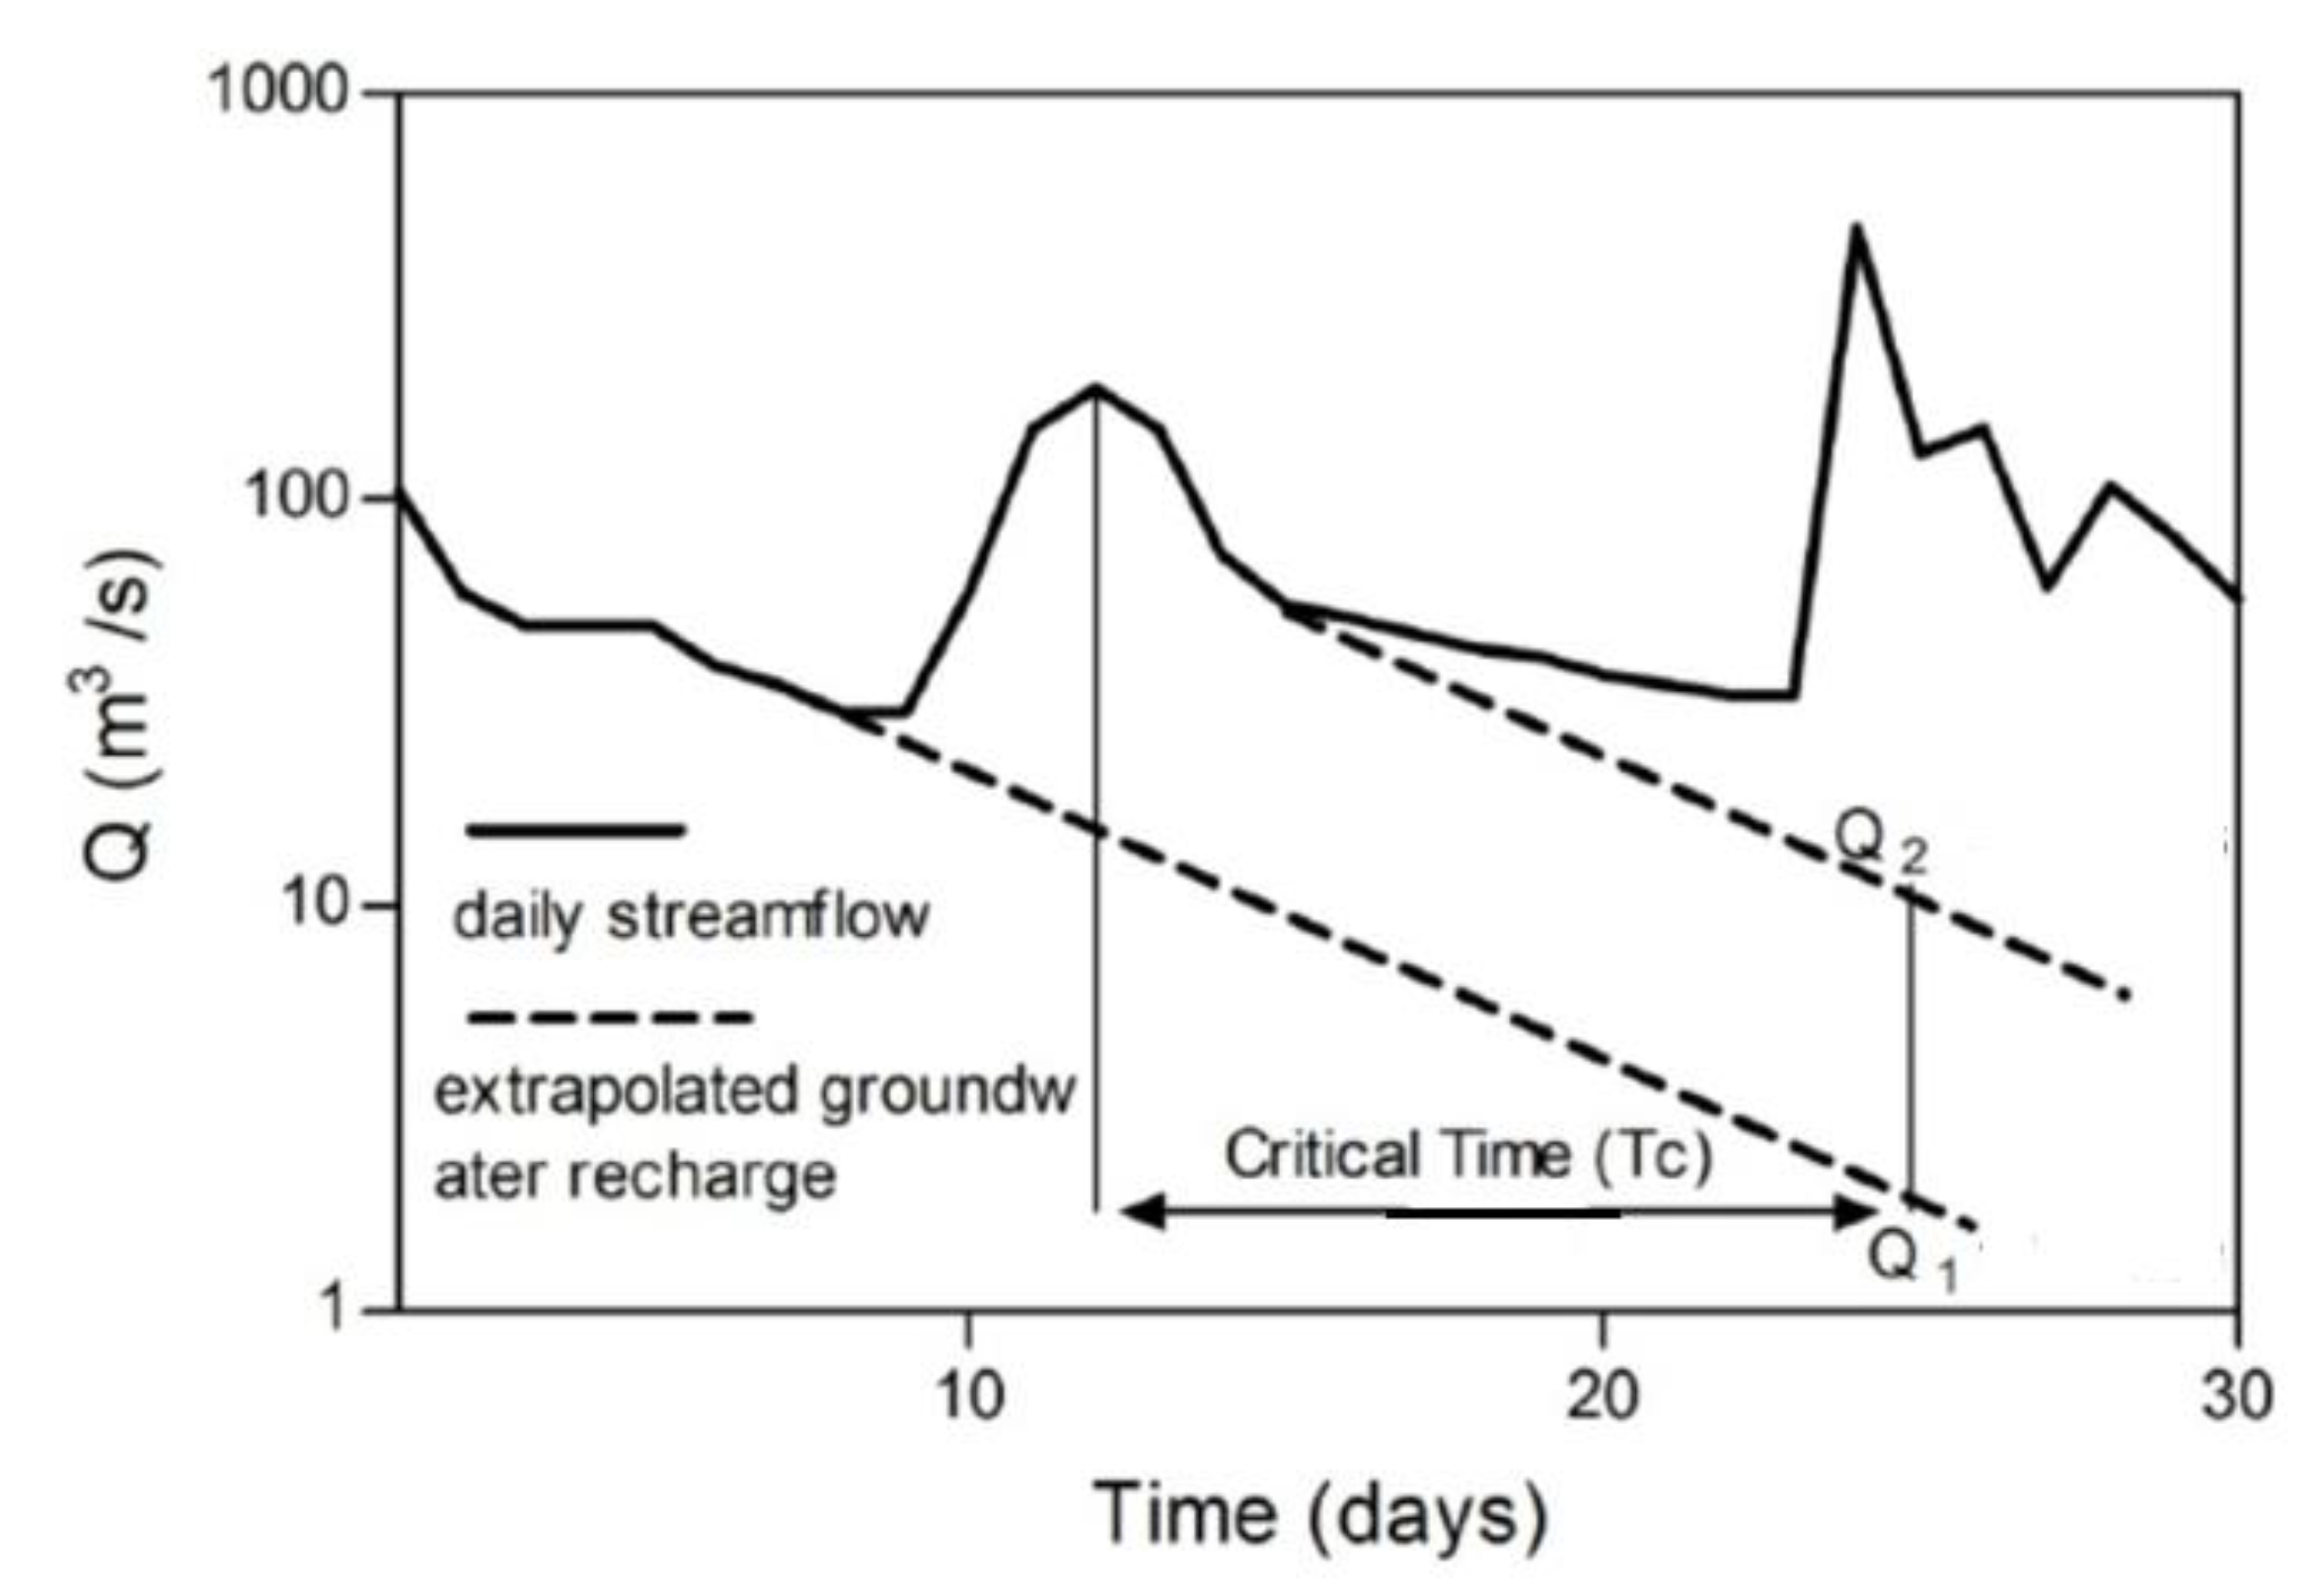
Recession Curve Displacement
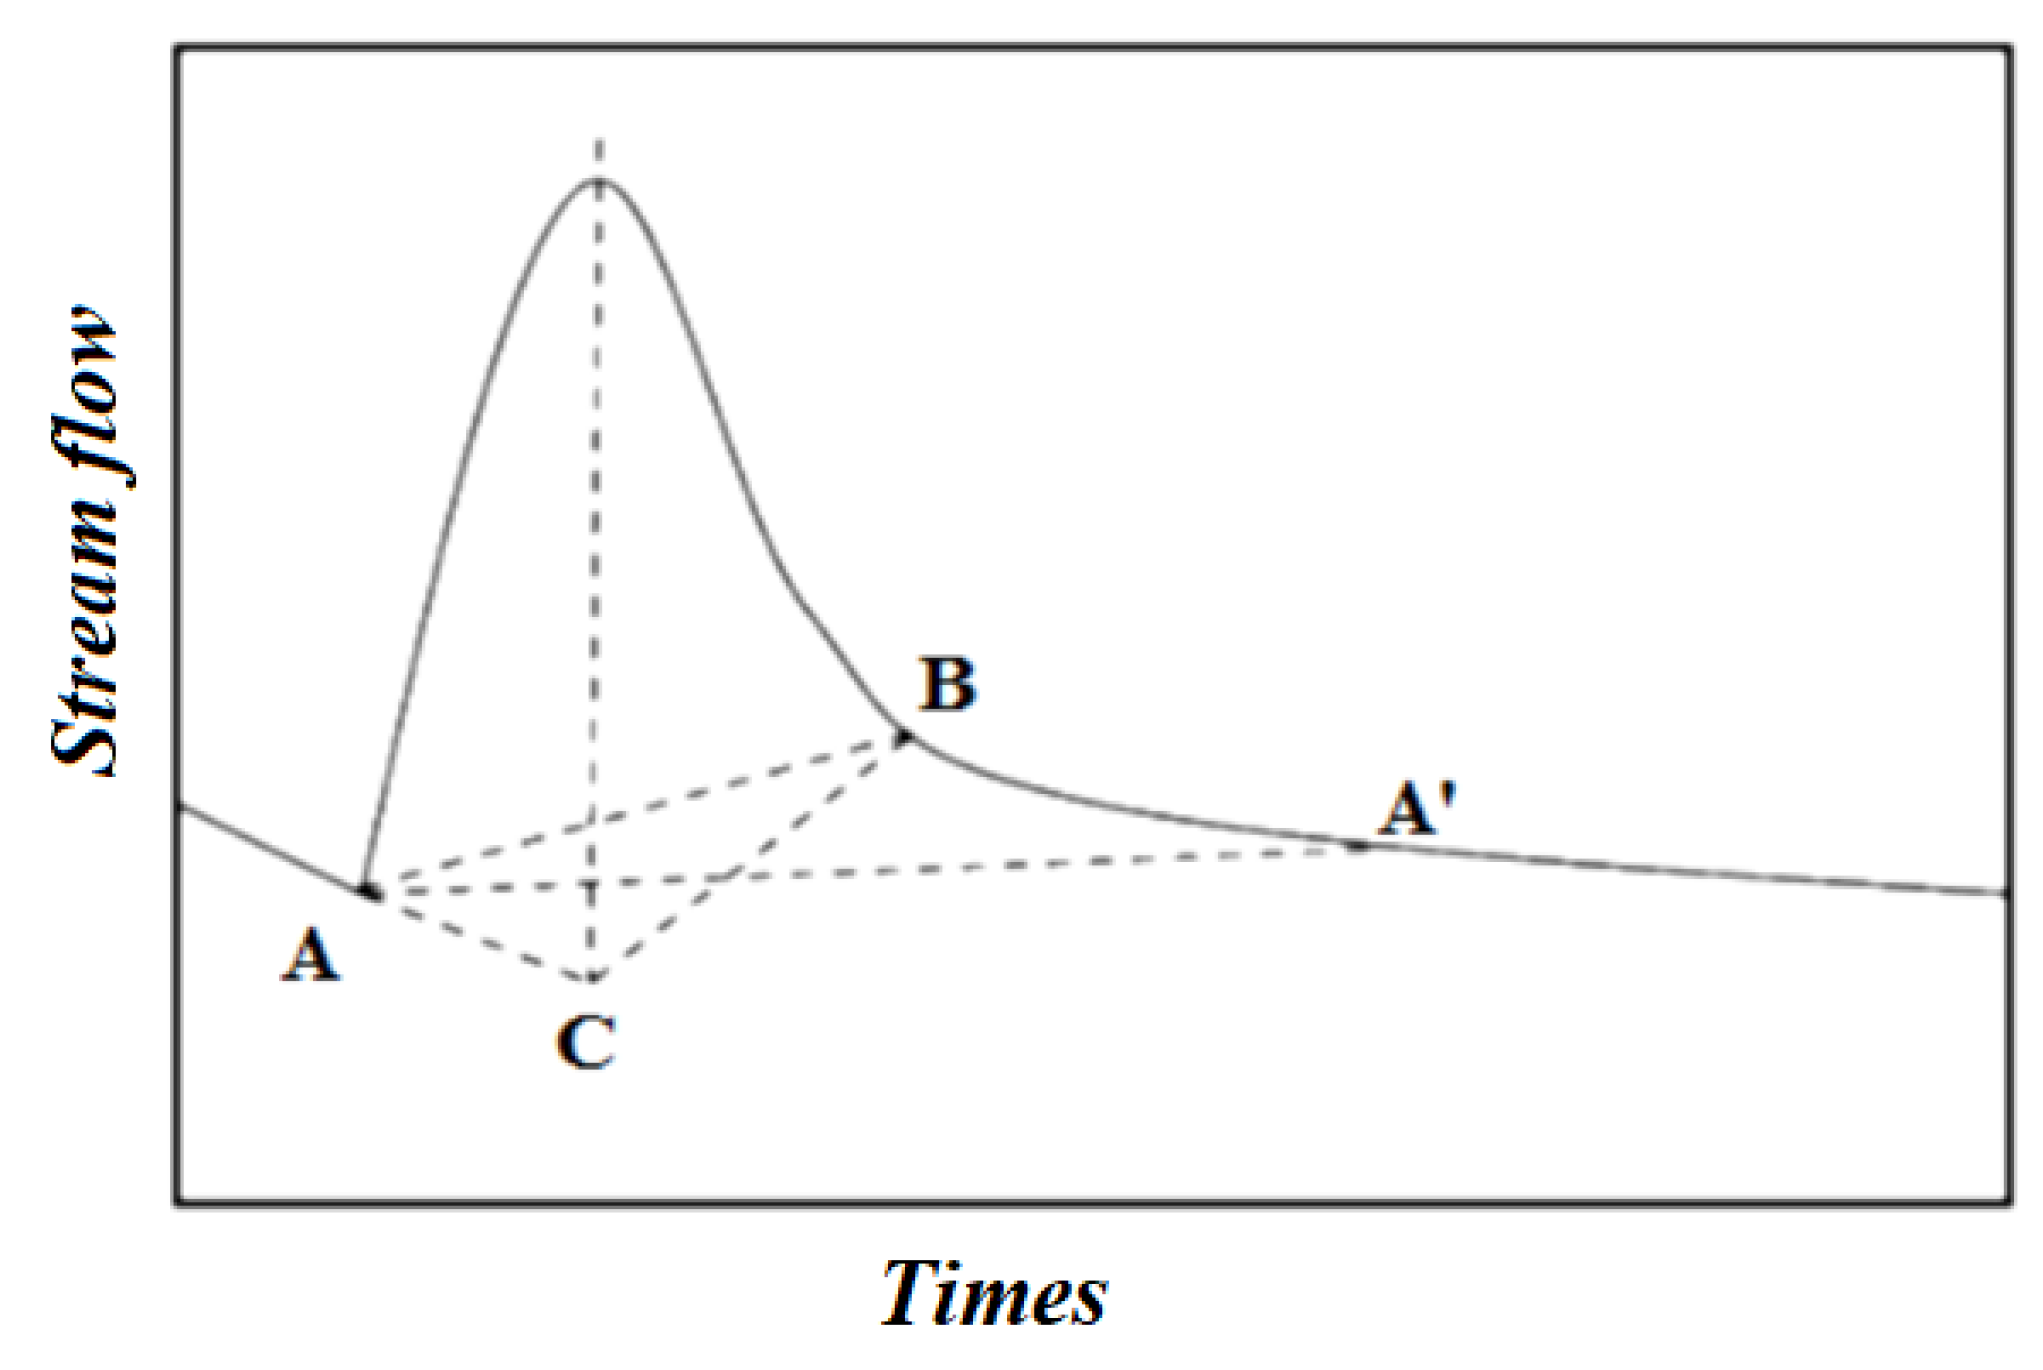
Graphical Separation (Constant Slope Method)
Automated Web GIS-Based Hydrograph Analysis Tool (WHAT)
- ✔
- Single parameter digital filter [26]
- ✔
- Two-parameter digital filters or Eckhardt method [27]
- ✔
- Local minimum method
- Use the methods of graphical separation, local minimum, and one- and two-parameter numerical filters to calculate the monthly base-flow.
- Calculate the average monthly base-flow over a long period.
- Sort and accumulate the long-term average monthly base-flow to obtain the cumulative long-term average monthly base-flow.
- Select the most stable (nearly linear) segment to obtain the slope of the stable base-flow.
- Using linear interpolation over the remaining months, the annual average base-flow is finally obtained.
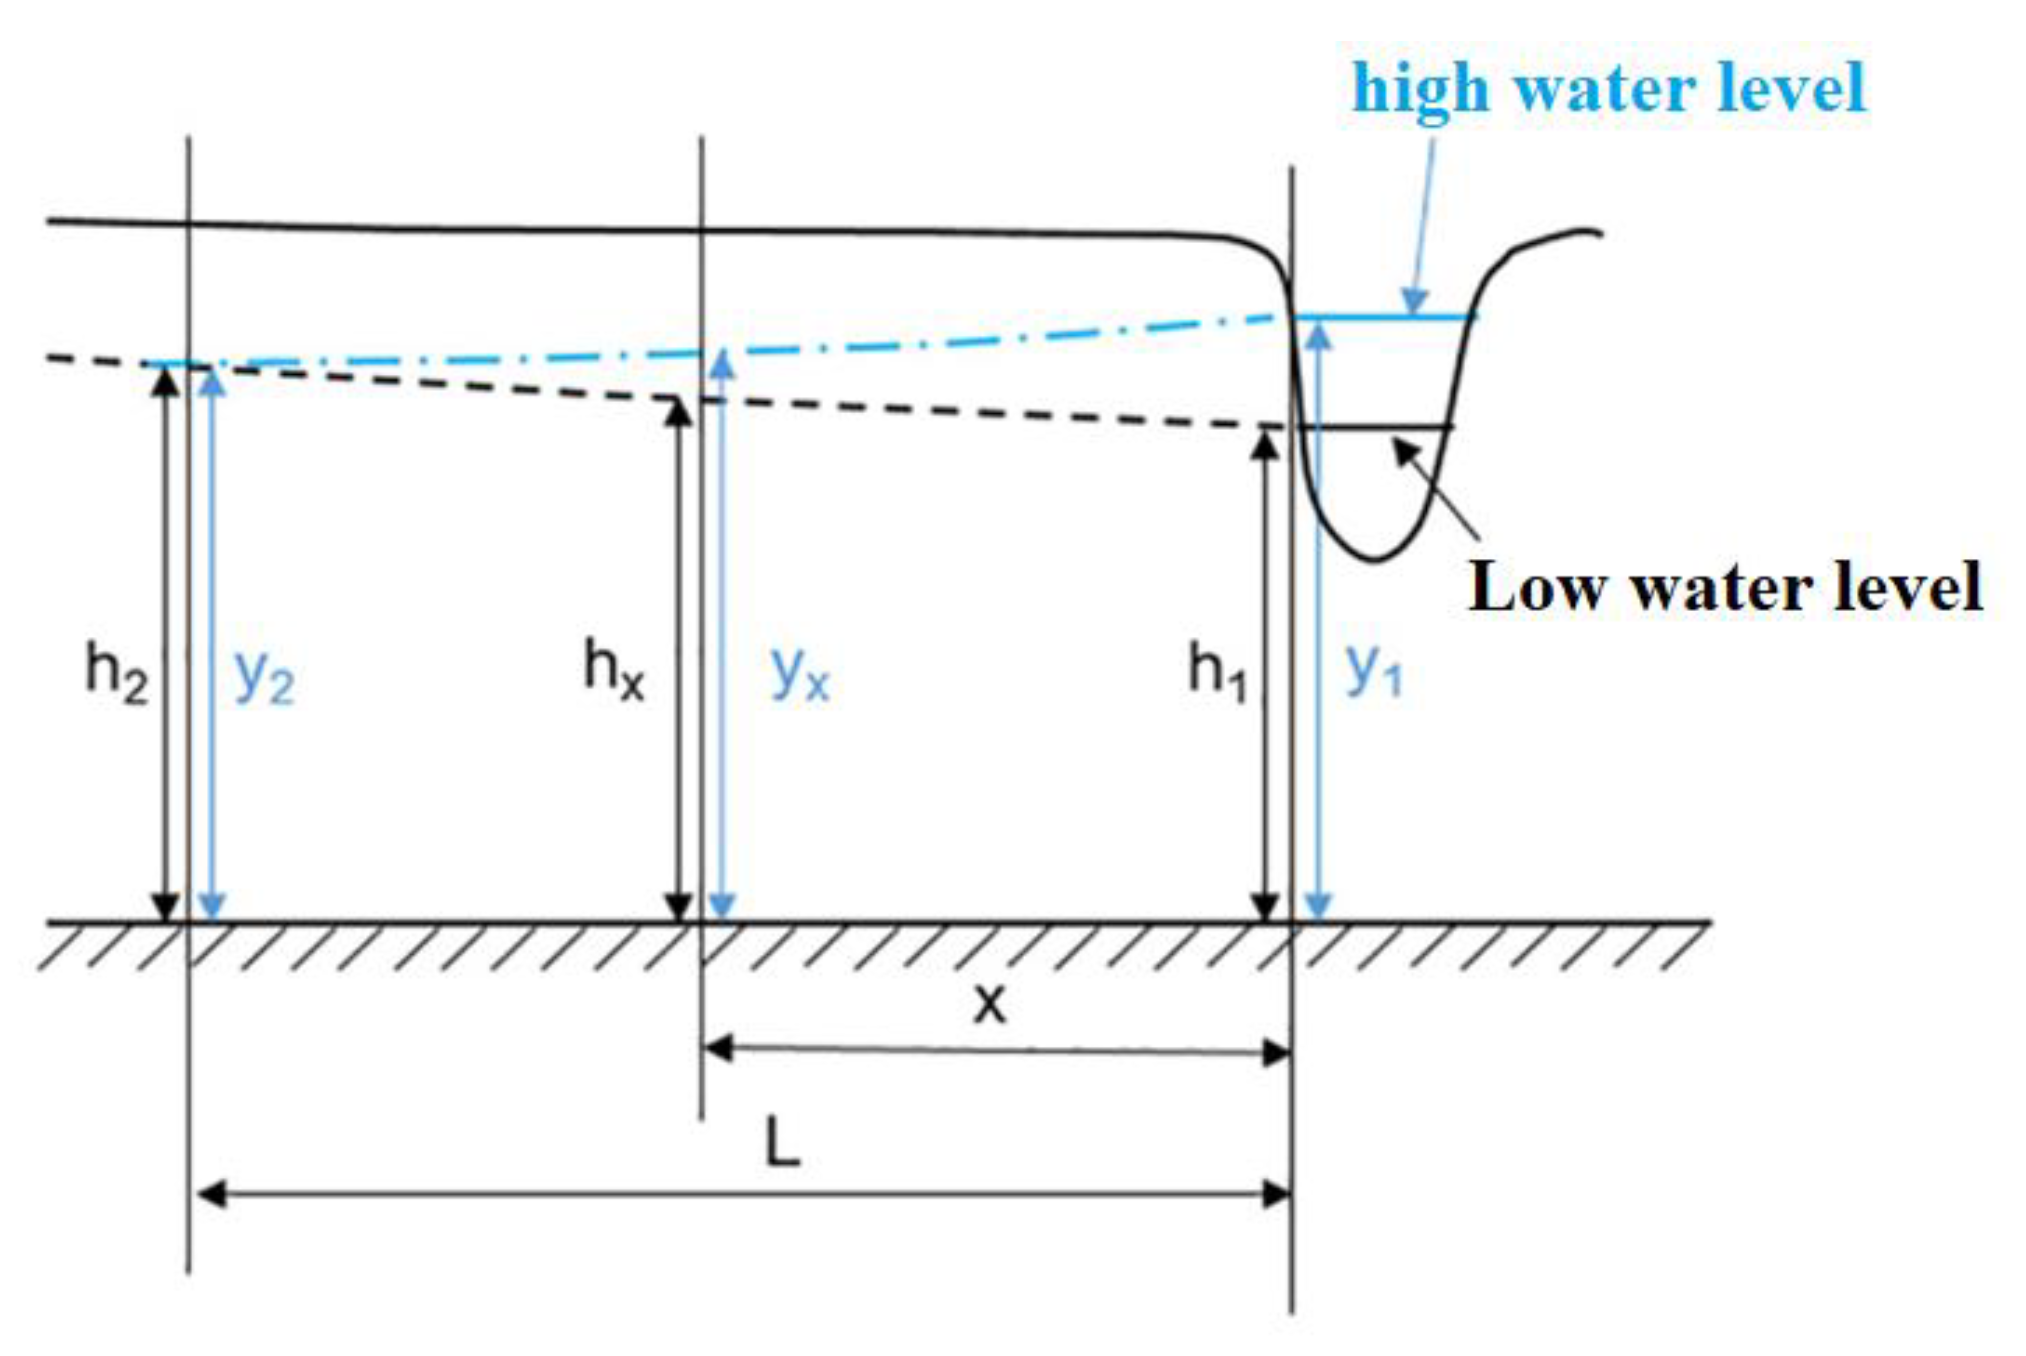
3.2.2. WTF Method
Specific Yield
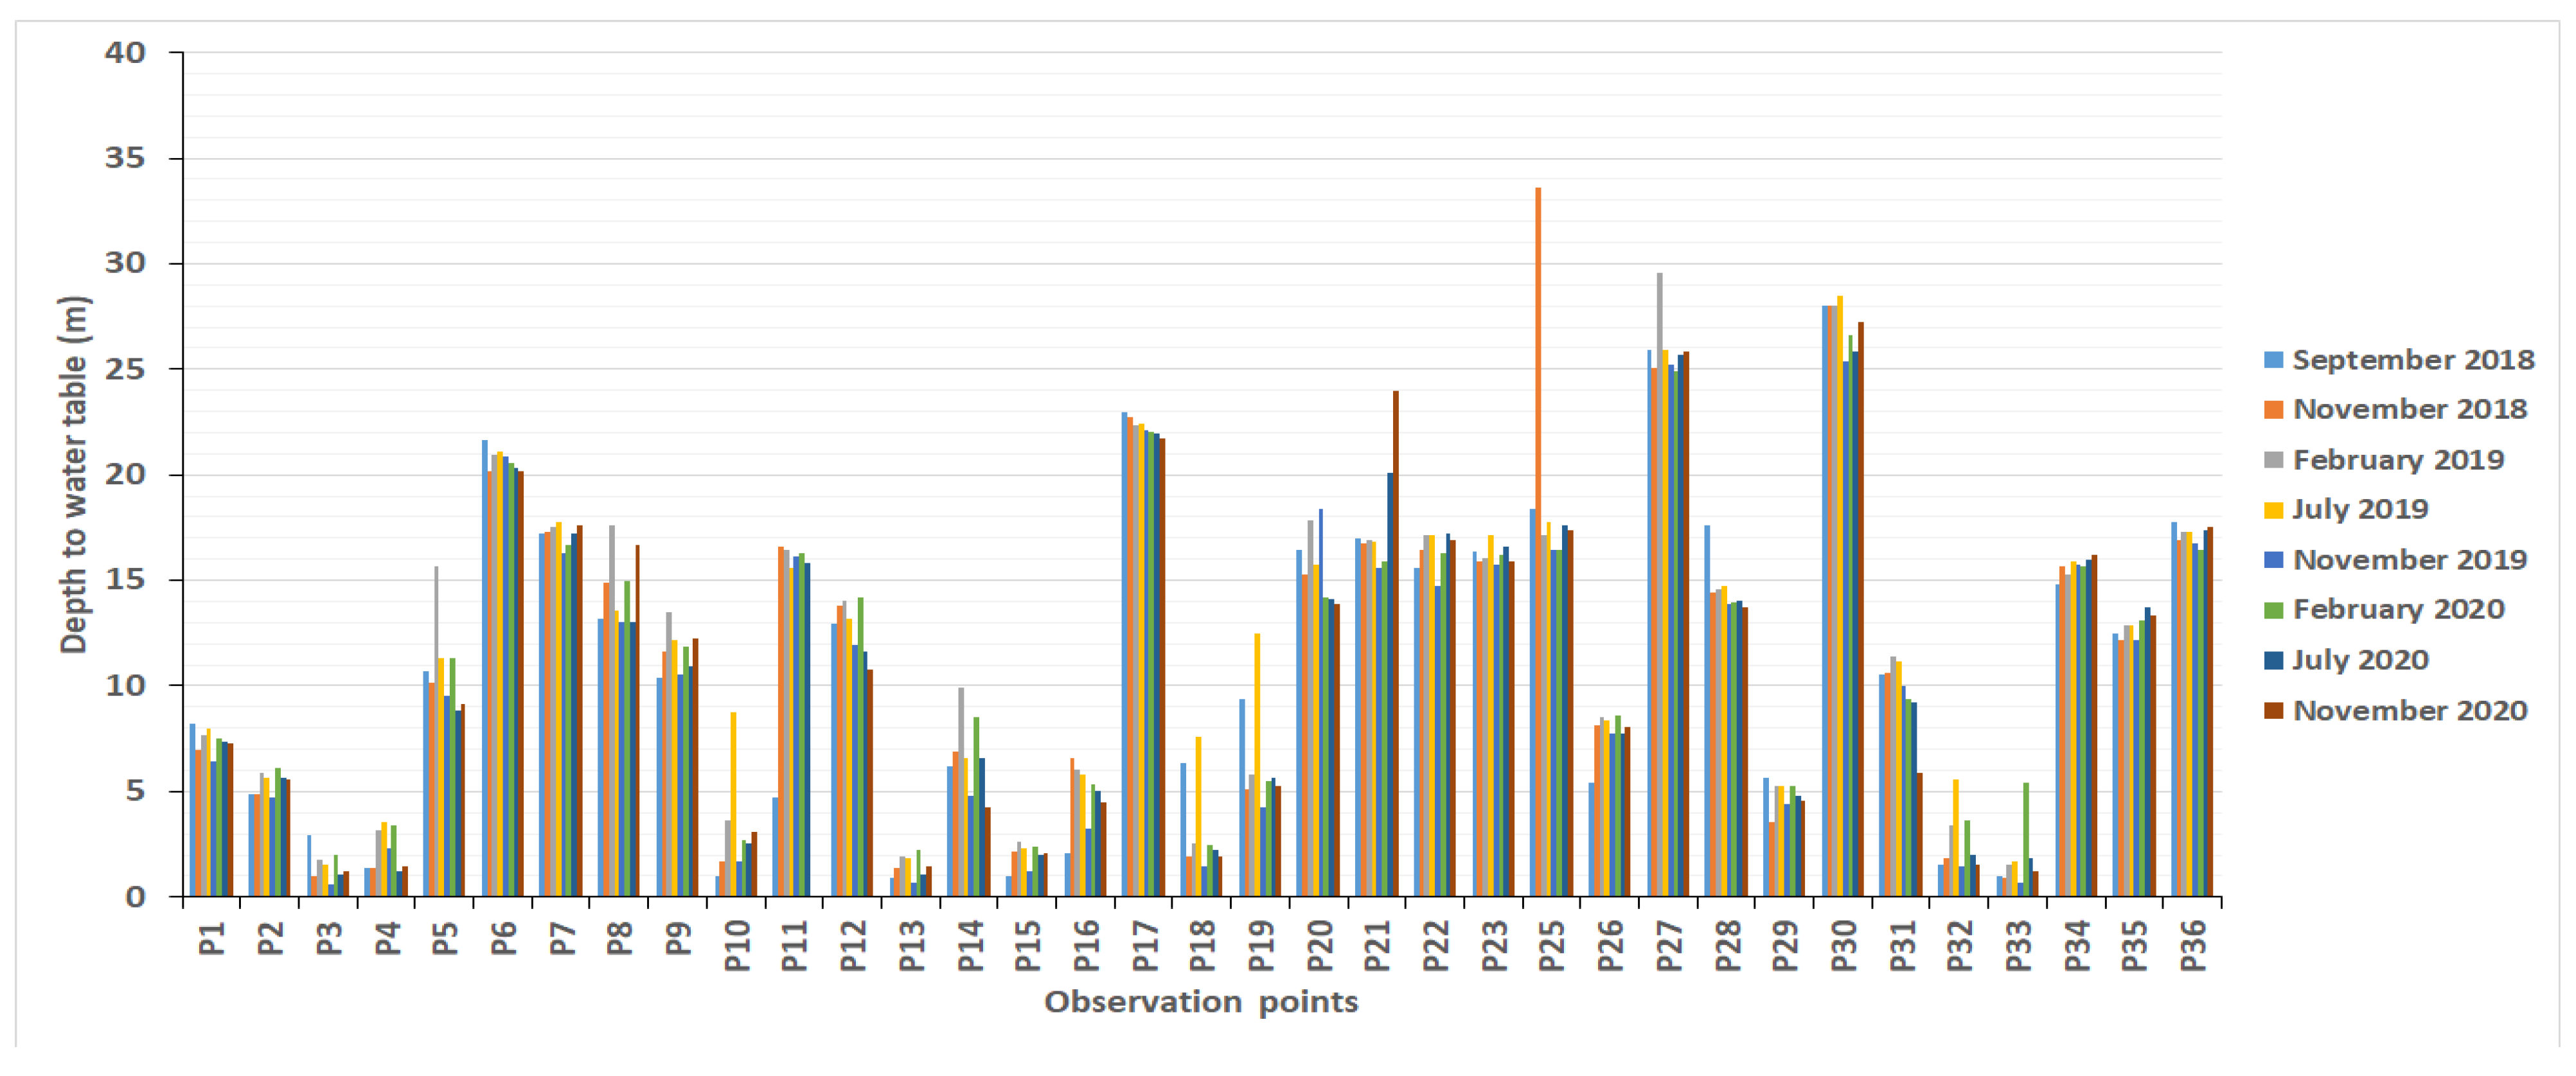
Determination of ΔH: Water Level Rise
3.2.3. Empirical Formulas
3.2.4. Estimation of Annual Recharge
4. Results and Discussion
4.1. Recession Curve Displacement
4.2. Base-Flow Analyses
4.3. Direct Recharge Estimated by the WTF Method
4.4. Empirical Formulas
4.5. Annual Recharge in the Lobo Catchment
5. Conclusions
Author Contributions
Funding
Institutional Review Board Statement
Informed Consent Statement
Data Availability Statement
Acknowledgments
Conflicts of Interest
References
- Koffi, B.; Sanchez, M.; Kouassi, K.L.; Kouadio, Z.A.; Kouassi, K.H.; Yao, A.B. Evaluation of the Impacts of Climate Change and Land-Use Dynamics on Water Resources: The Case of the Lobo River Watershed: Central-Western Côte d’Ivoire. In EGU General Assembly Conference Abstracts; EGU General Assembly 2021 Author(s) 2021, EGU21: Gather Online; EGU: France, 2021; pp. 21–506. Available online: https://www.researchgate.net/publication/351225184 (accessed on 15 November 2021).
- Silveira, L.; Usunoff, E.J. Groundwater; EOLSS Publications Co. Lid.: Oxford, UK, 2009; p. 3. Available online: https://books.google.de/booksid=1UqNCwAAQBAJ (accessed on 20 February 2009).
- Alley, W.M.R.; Thomas, E.; Franke, O.L. Sustainability of Ground-Water Resources; Denver, C.O., Ed.; USA Geological Survey Branch of Information Services [Distributor], USA Dept. of the Interior USA Geological Survey, USA GPO: Washington, DC, USA, 1999.
- Margat, J. The Over Exploitation of Aquifers. Selected Paper on Aquifer Over Exploitation from the 23rd International Congress of the IAH. In Puerto de la Cruz, Tenerife; Simmers, I., Villarroya, F., Rebollo, L.F., Eds.; Verlag H. Heise: Hannover, Germany, 1992; pp. 366–371. [Google Scholar]
- Lerner, D.N.; Issar, A.; Simmers, I. Groundwater Recharge. A Guide to Understanding and Estimating Natural Recharge. Verlag Heinz Heise, Hannover, West Germany International Contributions to Hydrogeology. IAH Publ. 1990, 8, 345. [Google Scholar]
- De, V.; Jacobus, J.; Simmers, I. Groundwater Recharge: An Overview of Processes and Challenges. Hydrogeol. J. 2002, 1, 5–17. [Google Scholar]
- Healy, R.W.; Cook, P.G. Using Groundwater Levels to Estimate Recharge. Hydrogeol. J. 2002, 1, 91–109. [Google Scholar] [CrossRef]
- Healy, R.W.; Scanlon, B.R. Estimating Groundwater Recharge; Cambridge University Press: Cambridge, UK; New York, NY, USA, 2010. [Google Scholar]
- Hussein, J.; Broder, J.M. Estimating Groundwater Recharge in the Semiarid Al-Khazir. Water 2014, 6, 2467–2481. [Google Scholar]
- Hung, V.V.; Broder, J.M. Estimating Groundwater Recharge for Hanoi, Vietnam. Sci. Total Environ. 2019, 651, 1047–1057. [Google Scholar] [CrossRef]
- Lim, K.J.; Engel, B.A.; Tang, Z.; Choi, J.; Kim, K.; Muthukrishnan, S.; Tripathy, D. Automated Web GIS-Based Hydrograph Analysis Tool, WHAT. JAWRA J. Am. Water Resour. Assoc. 2005, 41, 1407–1416. [Google Scholar] [CrossRef]
- Manna, F.; Cherry, J.A.; McWhorter, D.B.; Parker, B.L. Groundwater Recharge Assessment in an Upland Sandstone Aquifer of Southern California. J. Hydrol. 2016, 541, 787–799. [Google Scholar] [CrossRef] [Green Version]
- Adeleke, O.O.; Makinde, V.; Eruola, O.A.; Dada, O.F.; Ojo, A.O.; Aluko, T.J. Estimation of Groundwater Recharge in Odeda Local Government Area, Ogun State, Nigeria Using Empirical Formulae. Challenges 2015, 2, 271–281. [Google Scholar] [CrossRef] [Green Version]
- Varade, S.R.; Patel, J.N. Development of Empirical Formula for Recharge Estimation for Basaltic Areas. J. Hydraul. Eng. 2017, 68–73. [Google Scholar] [CrossRef]
- Ali, M.; Mubarak, S.; Islam, A.; Biswas, P. Comparative Evaluation of Various Empirical Methods for Estimating Groundwater Recharge. Arch. Curr. Res. Int. 2017, 11, 1–10. [Google Scholar] [CrossRef]
- INS. Recensement Général De La Population Et De l’Habitation (RGPH) 1998. Données Sociodémographiques Et Économiques Des Localités, Résultats Définitifs Par Localités, Région Des Lagunes; INS: Montrouge and Metz, France, 2014; p. 26. [Google Scholar]
- Tagini, B. Esquisse Structurale De La Côte d’Ivoire. Essai De Géotectonique Régionale. Ph.D. Thesis, Université De Lausanne (Suisse), Lausanne, Switzerland, 1971. [Google Scholar]
- Lachassagne, P.; Dewandel, B.; Wyns, R. Review: Hydrogeology of Weathered Crystalline/Hard-Rock Aquifers—Guidelines for the Operational Survey and Management of Their Groundwater Resources. Hydrogeol. J. 2021, 29, 1–34. [Google Scholar] [CrossRef]
- Yao, A.B. Evaluation Des Potentialités En Eau Du Bassin Versant De La Lobo En Vue D’une Gestion Rationnelle (Centre-Ouest De La Côte d’Ivoire). Ph.D. Thesis, Université Nangui Abrogoua, Abidjan, Côte d’Ivoire, 2015. [Google Scholar]
- Ali, R.S.E.; Chibane, B.; Boucefiène, A. Sensitive Analysis of Ground Recharge Estimation Model, for Semiarid Areas. Appl. Water Sci. 2018, 193, 1–10. [Google Scholar]
- Rutledge, A.T. Program User Guide for RORA; USA Geological Survey: Reston, VA, USA, 2007.
- Rorabaugh, M.I. Estimating Changes in Bank Storage and Ground-Water Contribution to Streamflow. Int. Assoc. Sci. Hydro. Publ. 1964, 63, 432–441. [Google Scholar]
- Bevans, H.E. Estimating Stream–Aquifer Interactions in Coal Areas of Eastern Kansas by Using Streamflow Records. In Selected Papers in the Hydrologic Sciences; Subitzky, S., Ed.; Geological Survey Water-Supply Paper; U.S. Government Printing Office: Atlanta, GA, USA, 1986; Volume 2290, pp. 51–64. [Google Scholar]
- McCuen, R.H. Hydrologic Analysis and Design, 3rd ed Pearson/Prentice-Hall, Upper Saddle River New Jersey. J. Am. Water Resour. Assoc. 2005, 40, 838. [Google Scholar]
- Blavoux, B. Étude Du Cycle De L’eau Au Moyen De L’oxygène 18 Et Du Tritium: Possibilités Et Limites De La Méthode Des Isotopes Du Milieu En Hydrologie De La Zone Tempérée. Ph.D. Thesis, Université Pierre et Marie Curie, Paris, France, 1978. [Google Scholar]
- Nathan, R.J.; McMahon, T.A. Evaluation of Automated Techniques for Base Flow and Recession Analyses. Water Resour. Res. 1990, 7, 1465–1473. [Google Scholar] [CrossRef]
- Eckhardt, K. How to Construct Recursive Digital Filters for Baseflow Separation. Hydrol. Process. 2005, 2, 507–515. [Google Scholar] [CrossRef]
- Sloto, R.A.; Crouse, M.Y. HYSEP: A Computer Program for Streamflow Hydrograph Separation and Analysis. Water Resour. Invest. Rep. 1996, 96–4040. [Google Scholar]
- Rutledge, A.T. Computer Programs for Describing the Recession of Ground-Water Discharge and for Estimating Mean Ground-Water Recharge and Discharge from Streamflow Records-Update; US Department of the Interior, US Geological Survey: Washington, DC, USA, 1998; pp. 98–4148.
- Zektser, I.S. Principles of Regional Assessment and Mapping of Natural Groundwater Resources. Environ. Geol. 2002, 3, 270–274. [Google Scholar] [CrossRef]
- Chen, W.P.; Lee, C.H. Estimating Ground-Water Recharge from Streamflow Records. Environ. Geol. 2003, 3, 257–265. [Google Scholar] [CrossRef]
- Delin, G. Comparison of Local- to Regional-Scale Estimates of Ground-Water Recharge in Minnesota, USA. Hydrol. J. 2007, 334, 231–249. [Google Scholar] [CrossRef] [Green Version]
- Phan, N.C.; Ton, S.K. Hydraulic Groundwater; Vietnam Education Publishing House: Hanoi, Vietnam, 1981. [Google Scholar]
- Chaturvedi, R.S. A Note on the Investigation of Groundwater Resources in Western Districts of Uttar Pradesh. Annu. Rep. 1973, 86–122. [Google Scholar]
- Baweja, B.K.; Karanth, K.R. Groundwater Recharge Estimations in India; Central Groundwater Board: New Delhi, India, 1980.
- Krishna, R. Hydrometeorological Aspects of Estimating Groundwater Potential. Seminar on Groundwater Potential in Hard Rock Areas, Bangalore. Geol. Soc. India 1970, 1, 18–99. [Google Scholar]
- Maxey, G.B.; Eakin, T.E. Ground Water in Groundwater in White River Valley, White Pine, Nye, and Lincoln Counties, Nevada. Nevada Department of Conservation and Natural Resources. Water Resour. 1949, 8, 1–64. [Google Scholar]
- Kirchner, J.; Van, T.G.J.; Lukas, E. Exploitation Potential of Karoo Aquifers. Research Report. Ph.D. Thesis, University of the Orange Free State, Bloemfontein, South Africa, 1991. [Google Scholar]
- Bredenkamp, D.B. Manual on Quantitative Estimation of Groundwater Recharge and Aquifer Storativity: Based on Practical Hydro-Logical Methods; Water Research Commission: Pretoria, South Africa, 1995. [Google Scholar]
- Makridakis, S. Accuracy Measures. Theoretical and Practical Concerns. Int. J. Forecast. 1993, 4, 527–529. [Google Scholar] [CrossRef]
- Schicht, R.; Walton, W. Hydrologic Budgets for Three Small Watersheds in Illinois; Illinois State Water Survey: Champaign, IL, USA, 1961. [Google Scholar]
- Abiye, T.A.; Tshipala, D.; Leketa, K.; Villholth, K.G.; Ebrahim, G.Y.; Magombeyi, M.; Butler, M. Hydrogeological Characterization of Crystalline Aquifer in the Hout River Catchment, Limpopo Province, South Africa. Groundw. Sust. Develop. 2020, 11, 100–406. [Google Scholar] [CrossRef]
- Kamenan, Y.M. Elaboration d’un Modèle De Protection Des Eaux Souterraines En Zone De Socle: Cas Des Aquifères Du Bassin Versant De La Lobo à Nibéhibé (Centre-Ouest De La Côte d’Ivoire). Ph.D. Thesis, Université Jean Lorougnon Guédé, Daloa, Côte d’Ivoire, 2021. [Google Scholar]


| Drillings | Water Level Fluctuation (m) | ||
|---|---|---|---|
| 2018 | 2019 | 2020 | |
| Tiahouo | 0.78 | 1.2 | 0.2 |
| Bazra-Nattis | 1.3 | 1.1 | 0.5 |
| Teneforo | 0.5 | 1.2 | 0.7 |
| Sokoura | 0.2 | 0.1 | 0.4 |
| Dananon | 0.3 | 0.6 | 0.5 |
| Vaafla | 0.8 | 1.4 | 0.3 |
| Seitifla | 1.2 | 2.8 | 0.8 |
| Diafla | 0.2 | 0.2 | 0.3 |
| Pelezi | 0.4 | 1.1 | 0.6 |
| Zoukouboue | 2.5 | 3 | 0.3 |
| Monoko-Zohi | 0.6 | 0.4 | 0.3 |
| Bohinou | 0.2 | 1.6 | 0.3 |
| Yacouba | 0.1 | 0.7 | −0.9 |
| Banoufla (Bediala) | 0.3 | 0.8 | 0.6 |
| Gnamienkro2 | 0.3 | 0.7 | 0.2 |
| Bonoufla (vavoua) | 1 | 0.9 | 0.6 |
| Ketro-Bassam | 2.3 | 1.9 | 2.1 |
| Broukro | 1.8 | 2.1 | 3.2 |
| Zouzoukro | 1.2 | 0.9 | 2.2 |
| Gbena | 1.4 | 0.9 | 1.9 |
| Dediafla2 | 2.4 | 1.4 | 3.5 |
| Vrouo1 | 0.4 | 1.3 | 0.8 |
| Bouhitafla | 0.8 | 1.2 | −1 |
| Modified Formula | Equation No. | |
|---|---|---|
| Chaturvedi [34] | R = 3(P − 15)0.4 | (11) |
| Irrigation Research Institute, Roorkee [35] | R = 2(P − 14)0.5 | (12) |
| Sehgal [36] | 1.8(P − 0.6)0.5 | (13) |
| Krishna Rao [37] | 0.37(P − 600) | (14) |
| Maxey-Eakin [38] | 0.22 × P | (15) |
| Kirchner [39] | 0.26(MAP − 200) | (16) |
| Bredenkamp [40] | 0.29(MAP − 360) | (17) |
| Gauging Stations | |||
|---|---|---|---|
| Sikaboutou | Nibéhibé | ||
| 2019 | 2020 | 2019 | |
| Methods | |||
| Graphical method (mm) | 24.6 | 18.7 | 7.6 |
| Local minimum method (mm) | 62.4 | 25.8 | 13.2 |
| Single parameter filter (mm) | 56.5 | 21.9 | 13.8 |
| Eckhardt method (mm) | 26.9 | 27 | 8.7 |
| Mean base-flow (mm) | 42.6 | 23.4 | 10.8 |
| Methods | Graphical Method | Local Minimum Method | Single-Parameter Filter | Eckhardt Method |
|---|---|---|---|---|
| Sikaboutou station | ||||
| Graphical method | 1 | |||
| Local minimum method | 0.97 | 1 | ||
| Single-parameter filter | 0.98 | 0.99 | 1 | |
| Eckhardt method | 0.96 | 0.97 | 0.98 | 1 |
| Nibéhibé station | ||||
| Graphical method | 1 | |||
| Local minimum method | 0.99 | 1 | ||
| Single-parameter filter | 0.94 | 0.99 | 1 | |
| Eckhardt method | 0.98 | 0.99 | 0.99 | 1 |
| Drillings | Direct Recharge (mm) | ||
|---|---|---|---|
| 2018 | 2019 | 2020 | |
| Tiahouo | 37.9 | 58.3 | 12.4 |
| Bazra-Nattis | 65 | 55 | 25.3 |
| Teneforo | 23.9 | 57.4 | 36 |
| Sokoura | 12.4 | 6.2 | 21 |
| Dananon | 14.1 | 28.2 | 23.4 |
| Vaafla | 38.3 | 67 | 15.3 |
| Seitifla | 58 | 135 | 40 |
| Diafla | 10 | 10 | 14 |
| Pelezi | 19.3 | 53 | 27.2 |
| Zoukouboue | 119.5 | 143.4 | 15.3 |
| Monoko-Zohi | 25.5 | 17 | 15 |
| Bohinou | 9.5 | 76 | 13 |
| Yacouba | 4.8 | 33.5 | 0 |
| Banoufla (Bediala) | 14 | 37.3 | 28.2 |
| Gnamienkro2 | 14.7 | 34.4 | 11 |
| Bonoufla (vavoua) | 45.6 | 41 | 31 |
| Ketro-Bassam | 111.7 | 92.3 | 100.4 |
| Broukro | 87.7 | 102.3 | 155 |
| Zouzoukro | 55 | 41 | 106.1 |
| Gbena | 65.5 | 42.1 | 93 |
| Dediafla2 | 117.3 | 68.4 | 167 |
| Vrouo1 | 18.5 | 60 | 36 |
| Bouhitafla | 38.9 | 58.4 | 0 |
| Mean groundwater recharge | 44 | 57.3 | 43 |
| Maximum | 119.5 | 143.4 | 167 |
| Minimum | 4.8 | 6.2 | 0 |
| 75% Quartile | 65 | 68 | 38 |
| 25% Quartile | 14.1 | 36 | 14.3 |
| Original Authors | Recharge 2019 | Recharge 2020 | MAP (%) 2019 | MAP (%) 2020 |
|---|---|---|---|---|
| Chaturvedi | 51.5 | 41.8 | 9.9 | 26.8 |
| Irrigation Research Institute, Roorkee | 69.9 | 53.9 | 22.3 | 5.64 |
| Sehgal | 63.2 | 49 | 10.70 | 14.3 |
| Krishna Rao | 235.7 | 52.4 | 312.7 | 8.3 |
| Maxey-Eakin | 272.1 | 163.1 | 376 | 185.4 |
| Kirchner | 0 | 0 | 100 | 100 |
| Bredenkamp | 0 | 0 | 100 | 100 |
| Original Authors | Modified Formulas | Recharge 2019 | Recharge 2020 | MAP (%) 2019 | MAP (%) 2020 |
|---|---|---|---|---|---|
| Chaturvedi | 1.21 (P − 15)0.4 | 61.6 | 50.2 | 7.8 | 17.5 |
| Irrigation Research Institute, Roorkee | 1.8 (P − 14)0.5 | 62.9 | 48.5 | 10.1 | 13.5 |
| Sehgal | 1.7 (P − 0.6)0.5 | 59.7 | 46.2 | 4.5 | 8.2 |
| Krishna Rao | 0.055 (P − 55) | 65 | 37.7 | 13.7 | 11.6 |
| Maxey-Eakin | 0.051 × P | 63.1 | 37.8 | 10.3 | 11.5 |
| Kirchner | 0.69 (MAP − 10) | 64.2 | 35.7 | 12.3 | 16.3 |
| Bredenkamp | 0.73 (MAP − 10) | 67.9 | 37.8 | 18.8 | 11.5 |
Publisher’s Note: MDPI stays neutral with regard to jurisdictional claims in published maps and institutional affiliations. |
© 2022 by the authors. Licensee MDPI, Basel, Switzerland. This article is an open access article distributed under the terms and conditions of the Creative Commons Attribution (CC BY) license (https://creativecommons.org/licenses/by/4.0/).
Share and Cite
Jean Olivier, K.K.; Brou, D.; Jules, M.o.M.; Georges, E.S.; Frédéric, P.; Didier, G. Estimation of Groundwater Recharge in the Lobo Catchment (Central-Western Region of Côte d’Ivoire). Hydrology 2022, 9, 23. https://doi.org/10.3390/hydrology9020023
Jean Olivier KK, Brou D, Jules MoM, Georges ES, Frédéric P, Didier G. Estimation of Groundwater Recharge in the Lobo Catchment (Central-Western Region of Côte d’Ivoire). Hydrology. 2022; 9(2):23. https://doi.org/10.3390/hydrology9020023
Chicago/Turabian StyleJean Olivier, Kouadio Kouamé, Dibi Brou, Mangoua oi Mangoua Jules, Eblin Sampah Georges, Paran Frédéric, and Graillot Didier. 2022. "Estimation of Groundwater Recharge in the Lobo Catchment (Central-Western Region of Côte d’Ivoire)" Hydrology 9, no. 2: 23. https://doi.org/10.3390/hydrology9020023