1. Introduction
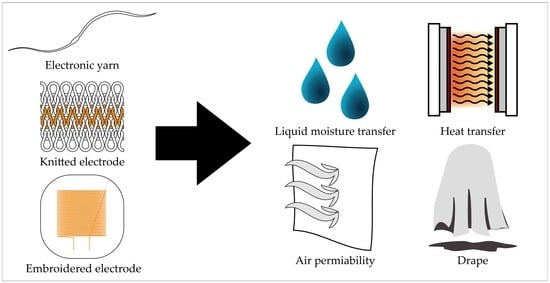
This work will characterize four key properties of electronic textiles (E-textiles) that influence user comfort; breathability, drape, heat transfer, and moisture transfer. Understanding the textile properties of a material is critical when correctly designing a garment. Certain physical properties of a worn garment will affect the user experience; this is particularly true when the garment is worn close to the skin.
The role that the physical textile properties play in the comfort of sports clothing is typically well understood, with layers sitting close to the skin imposing a significant barrier to heat transfer. Further complexity is added with different exercise intensities, environmental conditions, and the fitness and acclimation status of the athlete, alongside synergistic heat transfer effects that can occur with different combinations of textile properties. A garment’s capacity to transfer heat away from the body directly impacts thermoregulation and the comfort of athletes. More specifically, the breathability and moisture transport abilities of the textile to conduct and wick sweat away from the body will provide the most efficient cooling effect, especially in hot environments. The subject is discussed in depth in a review by Domenico et al. [
1].
Sports applications have been a key focus for the development of electronic textiles both in academia [
2] and by industry, with a key example being bands or bras for the monitoring of heart rate. Despite the importance of breathability, moisture transfer, and thermal properties on the comfort of these garments, there have been very few attempts to quantify these properties for E-textiles, with a greater focus being placed on stretching, bending, and twisting [
3]
Within the E-textiles field, more recent innovations have begun to address these critical properties, particularly those that have sought to engineer new innovative materials. An example of moisture transfer being characterized is provided by Guan et al. [
4] who investigated the moisture management of textiles with Graphene Oxide Coatings using a commercial Moisture Management Tester (MMT) (SDL Atlas Limited, SC, USA) and a testing procedure informed by a standard (ASTM D1776) [
5]. An MMT was also employed by Zhao et al. [
6] who explored the thermal properties of their fabric; here, they applied heat and observed the spread of the heat with a thermal camera. Work by Dong et al. [
7] showed both the moisture and air permeability taken using commercially available testing equipment; these measurements were compared to standard commercial textiles (however, full details of these textiles were not provided). It should be noted that the water vapor transmission rate was measured, not moisture absorbency. Gong et al. [
8] also presented the water vapor transmission rate and air permeability for their textile using commercial testers. In addition, others have used water vapor transmission to demonstrate breathability [
9]. Work by Yang et al. [
10] has shown the air permeability using a commercial tester and following a standard (GB/T 24218.15-2018) [
11] alongside moisture evaporation rate tests, and vapor transmission rates (both measured using commercial equipment to a recognized standard). Peng et al. [
12] used a commercial air permeability tester and ASTM D737 [
13] to assess breathability. Gidek et al. [
14] characterized the thermal resistance of a textile heat flux sensor to understand thermos-physiological comfort using ISO 11092 [
15]. Their study also illustrated the water vapor permeability of the textile.
Beyond these three key properties, drape testing for completed E-textiles appears to be completely absent in the literature. Drape, describing how a fabric hangs, will alter the user experience, with a good drape offering a better perception of comfort [
16]. In the case of E-textiles, textiles will sometimes be shown to possess drape behavior [
17], but actual quantified values appear to be absent.
Despite recent work making strides to address this literature gap, testing of this type is still limited. Further, the testing performed is normally on the presented innovation, providing a limited comparison with how the electronics integration influences the base textile material. Critically, a characterization of these key parameters is absent for well-established electronics integration methods.
Here, quantification of breathability, drape, heat transfer, and moisture transfer using established testing methods developed for textiles will be adopted to evaluate three types of electronic textiles; an embroidered electrode, a knitted electrode, and an embedded electronic yarn (E-yarn). All of the E-textiles use an all needles interlock knitted fabric as the base fabric due to its durability, being less likely to curl and restricted stretch.
Multiple techniques for integrating electronic functionality with textiles have been explored over the years including attaching electronics, printing electronics, weaving conducting elements, and incorporating functional yarns. These methods have generally been developed to improve the level of integration into the textile or enhance one of its properties (such as durability). The three example E-textiles chosen for this work were used as they cover an array of E-textile construction techniques that are believed to result in fairly normal textile properties and represent examples of construction techniques previously employed by the research group [
18,
19,
20]. In terms of design, the textile electrodes are similar in size and shape for both the embroidered and knitted samples to allow for a better comparison. Within a sportswear context, electrodes are commonly used for heart rate monitoring. E-yarns were employed for measuring the skin temperature of athletes in a previous study [
20].
This work will act as a useful reference to those working in the field, particularly those designing E-textiles using well-established methods (such as embroidery and knitting of conductive materials), and those hoping to develop high-performance sports garments with monitoring capabilities. The work also provides a case study for using existing textile standards for evaluating E-textile materials.
2. Materials and Methods
2.1. Textile Fabrication
Four different types of fabric samples were created for this study. All of the samples used the same base plain knitted structure, which was prepared using four-end polyester yarn (1/167/48, J. H. Ashworth & Son Ltd., Hyde, United Kingdom) with a plain interlock (all needles) structure on a flat-bed knitting machine (Stoll CMS ADF 32 W E7.2, Reutlingen, Germany). The first sample type, group A, was a plain knitted structure without any embedded electronics (average thickness 1.7 ± 0.1 mm). In group B, the knitted fabrics included an embroidered electrode and its conductive paths were created using a Barudan embroidery machine (BEDYHE-ZQ-C02/450 × 520/520; Barudan Ltd., Ichinomiya, Japan) with the satin stitch type and 0.6 mm spacing (triple Run Stitch) using a Silver-Plated Nylon 66 Yarn (235 f36 dtex 2 PLY HC+ B, Shieldex, Bremen, Germany). The electrode area was 70 × 30 mm with an average thickness of 1.4 ± 0.1 mm. The conductive tracks running to the electrode were 10 mm wide. Group C had a knitted electrode and conductive path. This was created using a tubular interlock intarsia with four polyester yarns and one end of silver yarn (Silver-Plated Nylon 66 Yarn 235 f36 dtex 2 PLY HC+ B, Shieldex, Bremen, Germany). The conductive electrodes had an area of approximately 70 × 40 mm, and a thickness of 1.3 ± 0.1 mm. The conductive tracks were 10 mm wide. Group D was created using the same structure as the other samples (interlock all needles) but with a tubular interlock structure (4× polyester yarn 1/167/48) to create a channel (approximately 4 mm wide) for the integration of an electronic yarn (E-yarn). The channel extended to the center of the samples. The E-yarn itself contained a thermistor for these experiments. The E-yarn was produced by first soldering the thermistor (NTC Thermistor AEC-Q200, 100k, 0402; TDK Corporation, Tokyo, Japan) onto two thin Litz wires in parallel (BXL2001, OSCO Ltd. Milton Keynes, UK). The component was then encapsulated into a polymer resin micro-pod (Dymax 9001-E-V3.5; Dymax, Corporation, Torrington, CT, USA), along with four supporting polyester yarns, before the structure was consolidated using a Herzog Braiding Machine (Herzog, GmbH, Oldenburg, Germany) and twenty-four polyester yarns. Once the E-yarn was inserted, the channel had a thickness of 2.2 ± 0.2 mm over the interconnections (i.e., where the connecting Litz wires ran), and 2.8 ± 0.2 mm at the component.
In this work, the samples are categorized into four main groups, denoted as A, B, C, and D. This represents individual types of samples. These four groups are only examined during the drape analysis. For all other experiments (air permeability, thermal properties, and moisture transfer), sub-groups representing testing on a part of the samples are described, as depicted in
Figure 1.
All of the physical samples started as 400 × 400 mm and were cut down according to what was required for a particular test. Further details on the samples and their constituents are available in
Appendix A.
2.2. Air Permeability
Air permeability measures how easily air can pass through a fabric. It is essential for fabrics used in various applications and the permeability will directly affect user comfort in many cases. Therefore, understanding the air permeability of a textile is essential to correctly design a garment in many cases. When a fabric is permeable to air, it is usually also permeable to water in liquid or vapor form. Therefore, air permeability is closely related to moisture vapor permeability and moisture transmission.
Air permeability tests were conducted on fabric swatches to evaluate the porosity and breathability of the prepared samples (Group A-D). The experimentation followed the approach outlined in ASTM D737 (Standard Test Method for Air Permeability of Textile Fabrics [
13]. The AirPro (James H. Heal & Co., Ltd., Halifax, UK) air permeability tester was used to conduct the investigation. The tests were carried out on a 20 cm
2 circular area (as specified in the standard) targeting a 100 Pa pressure, similar to tests conducted by others in the literature for conventional textiles [
21,
22,
23].
After positioning the sample with the clamp mechanism, it was checked for any sign of deformations or wrinkles. Subsequently, the airflow was automatically increased for the test until it reached the target of 100 Pa. At this point, the machine stopped and recorded the airflow rate through the sample in millimeters per second. This process was repeated five times for each sample at the same location, with the results presented in this work being an average measurement. Seven locations on the collective samples were explored: Group A—the center of the knitted samples (
Figure 2a); Group B—the center of the sample including the embroidered electrode (
Figure 2b) and the embroidered conductive paths (
Figure 2c); Group C—the center sample including the knitted electrode (
Figure 2d), and also on the knitted conductive path (
Figure 2e); and Group D—the center of the sample, which includes the E-yarn component (
Figure 2f), as well as the knitted channel holding the E-yarn and the interconnections running to the component (
Figure 2g).
2.3. Drape
Textile fabrics stand out from other materials due to their exceptional ability to drape and fold as a result of their ability to shear. The ten fabric samples for each group had their drape characteristics quantified using an SDL Atlas Model 213 Fabric Drape Tester (SDL Atlas Limited, SC, USA) and the method described in British Standard BS5058:1973 (Method for the assessment of drape of fabrics [
24]). Samples were prepared and cut using a circular template with a diameter of 300 mm. For groups B and C, the electrodes were positioned at the center of the sample; similarly, for group D, the E-yarn’s component was positioned at the sample’s center. Samples were conditioned for 24 h at 20 °C +/− 2 °C and 65% +/− 2% relative humidity prior to testing, in line with procedures used by others [
25,
26,
27].
After conditioning, samples were mounted onto the drape tester with the tester’s pin passing through the center on the supporting disc (
Figure 3a). The supporting platform was released with the tester lamp turned on (
Figure 3d), and the drape’s shape was recorded on a light-sensitive paper ring. The paper ring was then weighed (weight = M1). The sample casts a shadow on a piece of paper below and the portion of the paper ring that was shaded was cut away; the remaining portion of the paper was subsequently weighed (weight = M2) (see drape diagram in
Figure 3f). This process was repeated for each of the ten samples in each group.
The drape coefficient of each sample was calculated as follows:
2.4. Thermal Conductivity
The thermal properties of a textile are critical to the comfort of a wearer. Hence, the thermal conductivity of the samples was investigated, which represents the rate of heat transfer through the textile.
Measurements were taken using a C-Therm Thermal Effusivity Touch Tester (Tx Thermal Effusivity Touch Tester, C-Therm Technologies Ltd., Fredericton, NB, Canada), which employs the modified transient plane source (MTPS) method to measure thermal conductivity (W/mK). The device uses a heat reflectance sensor that sends a heat pulse through the fabric, measuring its response. It comprises a small spiral heating element and 500 g weight.
When an electrical current is passed through the spiral heating element, it heats up and raises the interface temperature between the sensor and the mounted fabric, as well as the face of the fabric. This rise in temperature causes the resistance to increase, leading to a voltage drop in the spiral element. The device monitors the rate and magnitude of both temperature and voltage changes to establish thermal conductivity values (
k) which are calculated through the C-Therm software (TCi 4.2.1.9) as shown below [
28,
29,
30,
31].
where
Q = amount of heat transferred,
d = distance between the two isothermal planes,
A = surface area, and Δ
T = difference in temperature.
The test method used in this experiment complies with ASTM D7984 (Standard Test Method for Measurement of Thermal Effusivity of Fabrics Using a Modified Transient Plane Source (MTPS) Instrument [
29]). Seven locations on the collective samples were explored as described previously in
Section 2.2. The locations tested with the C-Therm are also shown in
Figure 4. The samples were placed on top of the C-Therm heating element, and a 500 g weight was placed directly on top of each sample to prevent any significant movement and ensure continuous contact between the fabric sample and the heating element. The primary protocol consisted of four heating—cooling cycles, each composed of a heat cycle of 1.2 s, a sampling time of 2 s, and a cooling period of 80 s. Three of the four heating—cooling cycles with the most consistent readings were used to calculate the mean and standard deviation for each material’s thermal conductivity, as directed by the manufacturer [
30].
2.5. Moisture Transfer
To measure the moisture transfer characteristics of the samples, a Gravimetric Absorbency Testing System (GATS) was used: This measures porous structure absorbency using a transverse wicking test and enables dynamic observation of liquid absorption across multiple planes, providing real-time data on absorption rate, capacity, and saturation [
32]. In principle, it is very similar to the demand wettability test, except that the GATS uses a porous plate method, while the other method uses a point source plate [
33]. Both methods quantify the absorption rate by determining the mass flow rate and absorption capacity, which refers to the amount of fluid absorbed by a given sample weight. In this method, the liquid (ionized water in this study) was supplied beneath the sample through the porous plate, which was in direct contact with the sample. The water container was connected to this plate and positioned on an analytical balance with ±1 mg sensitivity. Typically, the height of the porous plate, or point source, is set at a hydrostatic tension of 10 mm above the water container. This ensures that the sample can absorb the required amount of fluid without becoming flooded. The amount of water absorbed in the sample depends on the substrate’s pore structure [
34,
35,
36]. The test in this study adhered to the ISO 9073-12:2002 standard (Test methods for nonwovens Part 12: Demand absorbency [
34]).
Tests were carried out on the circular porous plate with samples cut to a diameter of 80 mm. For this test, the sub-groups depicted in
Figure 1 were used. Each sample was cut to the required size for evaluation using the M/K251 GATS System (USA M/K GATS, MK Systems Inc., Williamstown, MA, USA).
Following cutting, samples were conditioned at approximately 23 °C for 24 h. The test procedure consisted of weighing the sample in the dry state and during the wetting process. The sample was placed on the porous plate and a mesh structure weighing 7 g was placed on top of it to achieve better contact (shown in
Figure 5c for the plain knitted sample; each of the positioned samples is shown in
Figure 5a,b,d–h to show the exact area of the samples tested).
As water passed through the porous plate, the water loss in grams was recorded using the balance. The test is automatically terminated when the sample can no longer absorb or desorb more than 1 mg of fluid within five seconds. In other words, when sample saturation was reached, the data acquisition was stopped. The reservoir was subsequently refilled with water for the next test. The absorption rate recorded by the GATS was determined by analyzing the slope of the absorption curve. It is expressed as the amount of fluid in grams that the sample absorbs per unit weight of the sample (in grams) per second [
37].
2.6. Microscopy and Dimension Measurements
All microscope images presented in this work were produced using a digital microscope (VHX-5000; Keyence, Milton Keynes, UK). All sample size and dimension measurements were taken after allowing the fabric to relax for 24 h. Dimension measurements were taken using either a metal ruler or a digital caliper.
2.7. Data Processing and Statistical Analysis
Unless otherwise stated, all measurements presented are averaged from each of the ten samples. Standard deviation was calculated using the STDEV.P function on Microsoft Excel (Albuquerque, NM, USA).
3. Result and Discussion
3.1. Air Permeability
Air permeability measurements were taken for each of the sample sub-groups five times (for each of the ten samples) as shown in
Figure 6.
While most of the sample sub-groups showed a similar air permeability (513.40 ± 109.99 mm/s–657.60 ± 16.28 mm/s), it was evident that the air permeability of the sample with the embroidered electrode was significantly lower over the electrode area (188.00 ± 38.39 mm/s). This is due to its dense and less porous structure when compared to the other structures investigated.
Figure 7 presents a microscope image comparing the embroidered electrode area (lowest air permeability) and the knitted electrode area (highest air permeability), showing the difference in the structure. It is believed that the knitted electrode exhibited the highest air permeability, even above that of the plain knitted structure, as the silver-coated nylon is slightly less flexible and has a lower linear density than other yarn used in this study, making the loops in the knit less likely to relax, resulting in larger pores in the structure. Moreover, as can be observed in
Table A1, the knitted electrode has the smallest thickness, which is one of the main factors contributing to changes in air permeability.
Furthermore, the relative error for the air permeability results can be found in
Table A4 (
Appendix B). This additional information offers a more detailed analysis of these measurements and their alignment with the reference value (here, the base knitted structure). A relative error of 68.92% was observed for the embroidered electrode area.
3.2. Drape
After subjecting each fabric sample to ten rounds of drape testing, the summarized drape results have been outlined in
Figure 8.
The drape coefficient of the samples varied between 49.88 ± 2.34% and 52.69 ± 1.95%. Hence, no significant differences were observed between the samples, and any minor discrepancies can be attributed to variations in the overall weight of the fabric. The relative errors (
Table A5) show a variation between 1.65 and 3.50%. When electronics were added to the base fabric, it was expected that the drapability would differ due to differences in weight, structure, materials, and thickness.
Nevertheless, it was discovered that the Cusick method is not suitable for evaluating the drapability of the samples presented due to the large supporting disc (180 mm). This could be expected. Ultimately, the Cusick method is designed for standard textiles where the textile has a uniform weight distribution. E-textiles typically have areas with electronics, and areas without them, resulting in an uneven distribution of weight and varied drape characteristics across the sample.
To demonstrate how the drape results are not truly representative of the E-textile’s drape characteristics, photographs of samples held on a small supporting area (a metal bar, 10 mm diameter) are shown in
Figure 9.
From the figure, it is visually clear that the samples have different drape properties.
Figure 9 indicates that reducing the supporting circumference could make the different drape characteristics of the different components of these samples more notable. Although this method represents a current standard for testing, it is not the most effective approach for E-textile applications and further study is required.
Generally, there is an inverse relationship between stiffness and drapability; stiff fabrics are less likely to drape well compared to softer, more flexible fabrics. A fabric with a high stiffness value from a stiffness test is likely to have poorer drapability [
38]. However, while there are discussions among the E-textile community of using the Shirley Stiffness Test as an alternative to drape testing to assess the drapability of E-textiles, it is essential to note that the Shirley Stiffness Test primarily measures the bending stiffness or rigidity of fabrics, while the drape test specifically assesses the flexibility and draping behavior of fabrics. It is important to combine stiffness testing with drape testing for a subjective assessment, to provide a more comprehensive evaluation of drapability.
3.3. Thermal Conductivity
This study presents the differences in thermal conductivity (k) among the sample sub-groups, which are shown in
Figure 10.
The embroidered electrode had the highest thermal conductivity of 0.056 ± 0.003 W/mK; this was likely due to the high conductivity of silver-coated yarn, which is more thermally conductive than polyester. Conversely, the knitted conductive electrode had a slightly lower conductivity than the base plain knitted fabric of 0.045 ± 0.0004 W/mK. This was believed to be due to its porous and slightly thinner structure than the embroidered electrode despite using the same silver-coated yarn. The lowest conductivity was observed for the sample containing the E-yarn component where a conductivity of 0.038 ± 0.001 W/mK was observed. This suggests that the presence of the component slightly restricted the heat flow in this location. However, the result was still in the same order as the plain knitted structure (k = 0.049 ± 0.001 W/mK). This gave a relative error of 42.34% (see
Table A6). It is worth mentioning that the thermal conductivity range of 0.035 to 0.9 W/mK for dry textile fabric is mentioned in the literature [
39], so while the addition of the E-yarn did decrease the thermal conductivity, the resultant textile still had thermal characteristics in a normal range.
3.4. Moisture Transfer
The GATS system assesses three crucial aspects related to fabric absorption: total absorbency capacity (measured in grams of water per gram of the sample), the average absorption rate between 5% and 80% of the total absorption (grams of water per second), and time to saturation (measured in seconds).
Figure 11 summarizes the findings.
Overall, due to having a high density and low porose structure, the embroidered conductive electrode had the lowest capacity (1.66 ± 0.17), lowest average rate (0.06 ± 0.01 g/s), and the highest saturation time (150.4 ± 29.6 s) (relative errors 43.68% and 93.94, respectively, see
Table A7 and
Table A8). Conversely, there are no significant differences between the capacities of the remaining samples (2.87 ± 0.31–3.20 ± 0.28). With the exception of the conductive tracks of the embroidered electrode, where the average rate was 0.22 ± 0.27 g/s (the high variation was due to results from a single sample), only minor differences in average rates were observed for the other sub-groups (0.96 ± 0.30–1.14 ± 0.04). The saturation time showed significant differences between the sub-groups, with the knitted structure having the lowest time at 46.43 ± 10.92 s. High saturation times were seen for both the embroidered electrode (150.44 ± 29.60 s; relative error 224.85%, see
Table A9) and knitted electrode (139.64 ± 17.48 s; relative error 200.03%, see
Table A9), possibly due to the conductive elements having a poor moisture uptake.
4. Conclusions
This study demonstrated that structural density and material composition can have a significant impact on the properties of E-textiles. The research has provided quantified data characterizing air permeability, heat transfer, and moisture transfer, which are all known to influence comfort for sportswear. It shows that even small changes in the construction of the E-textiles can influence the heat and moisture exchange properties of the fabrics, which will need to be taken into account by companies or sports clothing designers who are hoping to gain an edge in terms of thermoregulation. This is important as the incorporation of technology into sports clothing for physiological monitoring is becoming more popular. This work will therefore act as a helpful reference to those developing E-textiles for sports applications. The work has also shown that some existing textile testing protocols are suitable for evaluating these properties.
The researchers found that the embroidered electrode produced using silver-coated yarn as its base material had the lowest air permeability of 188.0 ± 38.4 mm/s, possibly due to it being the least porous structure, thus allowing less air to pass through, indicating better insulation. In the other explored cases, the air permeability was similar.
The embroidered electrode also had the highest thermal conductivity of 0.056 ± 0.003 W/mK, which meant that it was an excellent conductor of heat and could transfer heat quickly. Overall, the thermal properties of all the explored E-textiles were fairly close.
Additionally, the embroidered electrode had the lowest liquid capacity of 1.66 ± 0.17, indicating its low water-holding capacity. As a result, it may not be suitable for applications that require moisture management. It also had the highest saturation time of 150.44 ± 29.60 s, indicating that it takes more time to reach saturation when exposed to moisture. The other E-textiles explored had similar absorption capacities.
The work also sort to classify the drape of E-textiles; however, drape testing using existing standards showed similar drape ratios between the samples. This has highlighted a potential limitation in existing textile testing methodologies related to drape, and this must be explored in future work. It is envisioned that a future drape testing apparatus will be similar to the existing standard device but with a thinner support structure. As shown in this work, this will provide very different drape behaviors for the samples that are not apparent when conducting a standard drape test. The support structure must be significantly smaller than the non-homogenous part of the sample being tested (i.e., the electrode).
While this work has provided a useful case study, future investigations must explore other E-textile integration methods and how these influence these key properties, for example, printed electronics. Additionally, there are other areas of textile testing that are critical to normal textile comfort or durability that are seldom examined in the E-textiles domain, such as abrasion resistance.
Overall, the structural density and material composition of E-textiles play a crucial role in determining their properties and performance. Despite this, of the different types of E-textiles tested, most showed similar properties to each other and the base knitted structure in most (but not all) cases. While this knowledge is somewhat implicit, this work provides a critical case study of comparing E-textiles constructed using different techniques and provides quantified data evaluating their performance in these areas. By understanding these properties and designing optimized fabrics, it is possible to create a new generation of smart textiles that are both comfortable and functional.

 ,
, 


