
Diversity of Cryptofaunal Nematode Assemblages along the Jardines de La Reina Coral Reef, Southern Cuba


1
Centro de Investigaciones Marinas, Universidad de La Habana, Habana 11300, Cuba
2
Department of Marine Chemistry and Geochemistry, Woods Hole Oceanographic Institution, Woods Hole, MA 04523, USA
3
Unidad Académica Mazatlán, Instituto de Ciencias del Mar y Limnología, Universidad Nacional Autónoma de México, Mazatlán 82040, Mexico
*
Author to whom correspondence should be addressed.
Diversity 2024, 16(5), 264; https://doi.org/10.3390/d16050264
Submission received: 4 April 2024
/
Revised: 25 April 2024
/
Accepted: 26 April 2024
/
Published: 29 April 2024
(This article belongs to the Special Issue Ecology and Paleoecology of Atlantic and Caribbean Coral Reefs)
Abstract
:Cryptofaunal nematodes, those living on the hard substrate of the coral reefs, are largely unknown in terms of diversity and assemblage structure. We described nematode assemblages at seven sites spanning about 200 km along Jardines de La Reina, a well-preserved reef system in the Greater Antilles. We identified about 3000 nematodes, mostly of the families Desmodoridae and Chromadoridae; the most abundant species were Croconema cinctum, Desmodora communis, and Euchromadora vulgaris. The regional richness was moderate with 70 observed species (0.95 confidence interval: 65–75 species) and 75 extrapolated species (0.95 CI: 68–83 species). This richness was lower than in other reef biotopes, maybe reflecting evolutionary constraints due to interactions with stony corals. The local expected richness at 100 individuals was similar among sites, with a median of 26 species (0.95 CI: 20–34 species), and likely caused by diversification rate and evolutionary time acting at the same pace on populations. The taxonomic β-diversity was high and without differences among sites (median: 0.85; 0.95 CI: 0.33–1), probably due to significant substrate heterogeneity at 10-cm scale. The prevalence of replacement over richness difference suggests that local processes (e.g., environmental filtering and competition) contribute more to β-diversity than niche availability, which would be largely similar across the reef terraces. Contrary to our expectations, no gradient of assemblage structure occurred, nor significant effect of benthic cover on nematodes. However, nematode functional structure showed a conservative set of biological traits reflecting adaptations to hydrodynamic regime: armed oral cavity/intermediate colonizing capability/ornamented cuticles/conical tail. Our results provide insights about the taxonomic and functional diversity of nematodes and highlight the vast knowledge gaps about the processes ruling the meiofauna community structure in coral reefs.
Keywords:
meiofauna; macrofauna; richness; β-diversity; cryptofauna; epilithic matrix; Caribbean Sea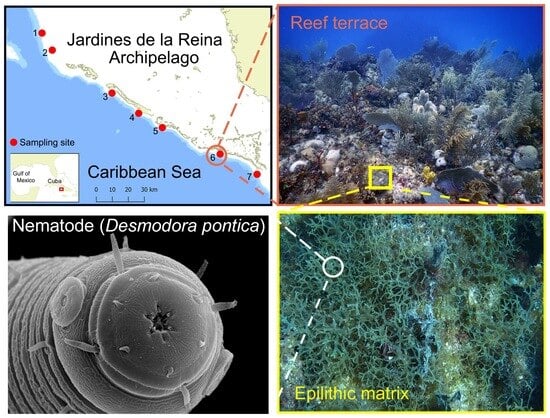
1. Introduction
Coral reefs are hotspots of diversity, harboring a substantial fraction of global species richness despite covering about 0.2% of the total seabed area [1,2]. Coral reefs also contain the largest higher-taxon diversity when compared with other ecosystems, homing 32 of the 34 recognized metazoan phyla [3]. Much of that biodiversity is poorly known and threatened because of the worldwide degradation of coral reef ecosystems [4].
The cryptofauna comprises the small-sized metazoans (size range about 0.06–4 mm) inhabiting within the crevices and cavities of coral reef substrates [5,6]. The cryptobenthic invertebrates contribute decisively to the total diversity of the reefs and encompass specious taxa such as gastropods, polychaetes, and microcrustaceans (e.g., amphipods, copepods, tanaids, and isopods) [7,8]. Their members include ecologically important trophic guilds such as suspension feeders, predators, herbivores, and detritivores [5]. Ecological functions of cryptofauna that contribute to the health of the reef system include capture of plankton from surrounding waters, recycling detritus, grazing on algae, preying upon other organisms, and providing a source of food for larger epibenthos and nekton [9,10]. The biodiversity of the cryptofauna is strongly influenced by the microhabitat type and reef degradation profiles [4], and thus structural complexity and hydrodynamic regime are two main drivers of the community [5].
Free-living marine nematodes are one of the most successful taxa on Earth. Nematode diversity comprises 29,000 living species [11], but this is only a fraction of its true diversity [12]. Nematodes and copepods are the two most abundant meiofaunal taxa in coral reefs, albeit their relative importance depends on the specific substrate. Copepods tend to be dominant in phytal substrates and coarse sands [13], while nematodes dominate in fine sands with sharp vertical gradients of oxygen [14]. Most studies on cryptofaunal nematode assemblages in coral reefs have investigated coral degradation zones because of the relative advantage for quantitative sampling by collecting coral pieces [15,16]. The most abundant nematode families in reef environments are Chromadoridae, Desmodoridae, and Epsilonematidae, while their species bear adaptations to cope with intense physical disturbance from waves and currents [17]. However, there are still substantial knowledge gaps about the diversity patterns of cryptofaunal nematodes in coral reefs.
We analyze two facets of diversity: richness and β-diversity. Richness describes the number or inventory of units at local (α-diversity) and regional (γ-diversity) scales [18]. While β-diversity represents the change of community structure along a gradient or among sampling units [19]. First defined by Whittaker [20] as the ratio of regional to local species richness, β-diversity is a multifaceted concept that can be separated into two partitions: replacement that accounts for the substitution of species between sites and richness differences that describes the loss or gain of species [21,22]. In addition, diversity can be analyzed from taxonomic, functional, and phylogenetic perspectives [23]. In the present study, both taxonomic and functional aspects are considered. Taxonomic diversity assesses the number of different taxonomic units or, in many cases, the distribution of the species’ abundances within the community [23]. Meanwhile, functional diversity measures the extent of distinct functional characteristics among different species in a community [24].
Diversity studies that include functional or biological traits have significantly increased over the past two decades [25]. The functional traits capture characteristics of organisms (e.g., body size, behavior, and feeding habit) that are linked to life history and ecological functioning [26]. At the same time, functional diversity enhances the detection of a biota’s responses to anthropogenic disturbances and their effects on ecological processes and services [27]. In the case of marine free-living nematodes, several biological traits have been related to functional responses. For instance, morphology of buccal cavity provides information about specific trophic roles in the sediments, such as deposit feeders or predators [28]. Tail shape has an important role in locomotion [29] and body size may be related to energy requirements and carbon flows [30]. Amphid shape, as the main chemosensory organs of the cephalic region, may influence the success in the search for food and mates [31]. The use of a functional approximation to study nematode assemblages provides additional insights to those from traditional taxonomic analyses when deriving general descriptions of benthic diversity [32].
Cuba is the largest archipelago in the Caribbean Sea and contains extensive areas of coral reefs [33]. One of the four large coral reef systems of the archipelago resides in the southeast region, Jardines de La Reina (hereafter, JR). JR has been described as one of the least damaged reefs in the Caribbean Sea and includes a Marine Protected Area (MPA) with the category of National Park. We did a scientific expedition in November 2017 to investigate several components of the ecosystem such as metabolites [34], reef metabolism [35], microbes [36,37], coralline communities [38], fishes [39], and reef’s soundscape [40].
In the Caribbean region, a few studies have targeted free-living nematodes in coralline sands [41,42,43]. However, cryptofaunal nematodes, those living on hard substrates in the reef, are poorly known in the region. Only two studies analyzed cryptofaunal nematodes in coral degradation zones (i.e., coral dead fragments) in the southwestern Cuban archipelago [16,43]. Recently, a taxonomic list of nematodes in JR reef system reported 10 new records for Cuban waters [44]. To our knowledge, no study has documented quantitatively the nematode assemblages at a taxonomic level lower than phylum inhabiting the hard substrate covered by coralline communities (i.e., living corals, sponges, gorgonians, and epilithic algae). In this contribution, we report the diversity, assemblage structure, and biological trait analysis of free-living cryptofaunal nematodes inhabiting hard substrates along a well-preserved reef system spanning about 200 km in Jardines de La Reina. Specifically, we documented the taxonomic and functional diversity based on species and biological traits data, respectively.
2. Materials and Methods
2.1. Study Zone
The coral reef system Jardines de La Reina (JR), in southeastern Cuba, runs along the shelf border of the Gulf of Ana María (Figure 1). JR is formed by an extensive reef tract of approximately 200 km of length that extends from the northwest to the southeast. Coralline communities dominate in two fringes along the reef axis [37]: First, a reef terrace (5–10 m depth) followed by a gentle slope ending on a sandy flat. Second, a deeper ridge formation (15–25 m depth) ending at the outer wall of the reef. Samples were taken in the first reef terrace.
2.2. Sampling Design and Sample Processing
A scientific expedition was carried out aboard the research vessel M/V Alucia throughout the entire reef system Jardines de La Reina on 1–23 November 2017. For the study of nematode assemblages, we targeted seven sampling sites approximately equidistant along the reef axis (Figure 1, Table 1). Abiotic data collected during the expedition indicated that water column variables (e.g., temperature, salinity, nutrients) were largely the same along the reef and reflected a rather oligotrophic environment without signatures of chemical pollution or eutrophication [36].
Sampling areas were always located on the reef terrace, where coralline communities showed the best development (Figure 2a,b). At each sampling site, a SCUBA diver collected replicate sampling units of the material on the hard substrate of the reef. Specifically, we sampled the epilithic algal matrix, that is the mixture of detritus, sand grains and turf-forming algae covering the hard bottom of the reef. We did not collect large pieces of coral (dead or alive), nor sediment accumulated on the bottom. The protocol was as follows: A PVC frame of 25 cm × 25 cm (i.e., the sampling unit) was thrown out at random on the reef bottom (Figure 2c,d), in the case that the frame landed on a large coral colony (occupying > 50% of the frame’s area) or in oblique angle, the frame was thrown out again. For the collection, a gallon sized Ziploc bag was put on the frame and all the material was carefully removed by hand. This method collected the cryptofauna living mostly on the epilithic algal matrix but may also include cryptofauna associated to other invertebrates found within the PVC frame (e.g., sponges, gorgonians, or even small corals). We considered this method as semiquantitative because of the difficulty of standardizing the amount of material to be collected inside the frame. However, all the replicates were collected consistently by the same diver (MA), who collected as much material as possible while avoiding the escape of swimming organisms. Each bag of material was considered a replicate, and we generally collected 10 replicates per site within a radius of ca. 25 m from a central point (Table 1). On board the boat, the excess of water in the bags was removed using a pipette with a 45 μm mesh at the tip to avoid accidental removal of organisms. The material contained inside the bags was preserved at −6 °C until further processing. Photos of each square frame were taken before collecting the material for quantification of benthic cover [38].
In the laboratory, the contents of the bags were washed over a column of 500 and 63 μm test sieves to separate the fractions of macro- and meiofauna, respectively. The two fractions of each sample were analyzed on the same day to avoid the degradation of the material after thawing. Subsequently, the material retained in each sieve was transferred to a Petri dish and observed under a stereomicroscope Olympus SZX7 (Olympus, Tokyo, Japan) at a maximum magnification of 112×. Nematodes in the samples were counted, extracted, and stored in DESS (i.e., dimethyl sulphoxide + EDTA + NaCl) for later identification to the lowest taxonomic level.
The fixation and permanent mounting of the nematodes was made following a variant of the method reported by [45]. Nematodes were transferred sequentially to three solutions: solution I (formalin 4% and glycerin, 99:1), solution II (ethanol 96% and glycerin, 95:5), and solution III (ethanol 96% and glycerin, 50:50). The increased concentration of glycerin gradually penetrates the nematode’s body, improving its transparency.
Nematodes were observed under an optical microscope Olympus CX41 at a maximum magnification of 1000× and identified to the lowest taxonomic level, usually species or genus. We used taxonomic books for identification [46,47,48,49]; also, we reviewed papers for some specific families and genera were used. Validity and nomenclature of taxa was revised according to the World Register of Marine Species (https://www.marinespecies.org, accessed on 15 January 2024).
Photos were analyzed using the hierarchical segmentation-based software Seascape 3.2.4 [50]. This allowed for semi-automatic calculation of coral and algae. Full details about the image processing and data analyses were given in [38]. The advantage of this type of data is that cryptofaunal nematodes and benthic cover data were measured from the same quadrat (replicate) allowing testing the effects of benthic cover on nematodes.
2.3. Biological Traits
We analyzed five biological traits of nematodes: feeding group, life strategy, amphidial fovea shape, cuticle ornamentation, and tail shape. The feeding group was classified into four categories [51]: microbivore scraper, microbivore sucker, microbivore processor, and predator ingester. Life strategy was classified into five categories [52,53], according to colonization capacity, from 1 (extreme colonizer) to 5 (extreme persister). Amphidial fovea shape was classified into eight categories [31]: blister-like, circular oval, indistinct, longitudinal, loop, pocket-like, slit-like, and spiral. Cuticle ornamentation was classified into four categories [31]: smooth, with desmens, with a bacterial cover, and punctuated/annulated. Tail shape was classified into four categories [29]: rounded, clavate/conico-cylindrical, conical, and long.
2.4. Data Analysis
The primary data were a matrix of species × replicates. For the analysis of diversity, we summed all the replicates per site to obtain higher completeness of the sampling and more robust diversity estimates (i.e., based on larger sample size). We structured the data analysis in three parts: a first part devoted to diversity (both taxonomic and functional), a second part focused on taxonomic structure that used the abundance of species along the samples, and a third part focused on functional structure that used the relative abundance of biological traits.
2.4.1. Diversity
We built species accumulation curves versus individuals with 500 permutations using the function inext of R package iNEXT [54]. For the whole reef system, we summed all the replicates and calculated extrapolation to double the observed number of individuals [55]. On the local scale (i.e., site), we also summed the replicates to obtain the largest possible number of individuals per site. To compare the richness among sites, we used rarefaction by calculating the expected number of species (ES) at the lowest level of abundance. We also generated 0.95 confidence intervals (CIs) based on 500 permutations using the function alpha of R package BAT [56]. We estimated the average pairwise species β-diversity using the complementary form of the Sorensen index with rarefaction to the lowest abundance at each comparison. Total β-diversity was decomposed in two additive partitions: replacement and richness difference [21]. β-diversity was computed using the function beta of R package BAT.
For the analysis of functional diversity, we built a functional tree relating species based on their five biological traits with the following settings: original categorical variables dummyfied, Gower as resemblance measure, and unweighted pair group method with arithmetic mean (UPGMA) as linkage strategy. Functional richness was calculated using the FD metric that sums the branch lengths of those trait combinations that occur at each site [57]. We used rarefaction to reduce the effects of differences of abundance and 500 permutations to generate 0.95 CIs around the expected richness. Functional richness was calculated with the function alpha in the R package BAT. We estimated the average pairwise functional β-diversity using the complementary form of Sorensen index with rarefaction to the lowest abundance at each comparison and the same functional tree used for richness. Total β-diversity was decomposed in two additive partitions as well: replacement that accounts for substitution in the identity of the traits, and richness difference that accounts for differences in the number of traits between pairs of sites. β-diversity was computed using the function beta of R package BAT.
2.4.2. Taxonomic Structure
We built ranked species abundance curves (a.k.a., dominance curves) representing the relative abundance of species versus the rank of species in log scale for each site [58]. To visualize the similarity pattern among samples based on species abundance, we built a numerical ordination by non-metric multidimensional scaling (NMDS) with following settings: Bray–Curtis similarity index as measure of resemblance, 50 random restart configurations, and Kruskal fit Scheme 1. NMDS was calculated in the program PRIMER 7.0.23 [58]. We search for those species that most contribute to the 75% of the similarity within a site using the function SIMPER in PRIMER; these species can be considered as typical of the site. After, we represented the relative abundance of these species independently for each site in the heatmap.
We tested statistical differences between sites using permutational analysis of variance (PERMANOVA) in the add-on program PERMANOVA for PRIMER [59]. We conducted a univariate PERMANOVA to test differences in abundance with the following settings: Euclidean distance as measure of resemblance, sum of squares type III, 999 permutations to generate the null distribution, and unrestricted permutation of the data. We also tested for differences in the species multivariate structure of assemblages with the same settings, except for Bray–Curtis similarity index as measure of resemblance. For both tests, we included coral and algae cover as covariates since they may influence nematode assemblages.
We also explored the effects of benthic cover on the abundance and species density (i.e., number of species per quadrat) of nematodes using generalized linear mixed modelling (GLMM). The GLMM technique was selected because the error structure was non-Gaussian (i.e., counts) and it considered the occurrence of random effects [60]. The fixed-effect predictors were Coral_cover, Algae_cover, and its interaction. We applied a Generalized Linear Mixed Model (GLMM) including SITE as random effect and Poisson distribution for fitting the error term. The response variables were abundance and species density of nematodes. The full model was as follows:
GLMMs were calculated in the R package lme4 v1.1-35.1 using the function glmer [61]. We used unstandardized slopes as a measure of effect size and calculated 0.95 CIs using the bootstrap method (500 permutations, basic type) with the function confint.merMod. If 0.95 CIs around the estimated slopes include zero, we considered that the effect was non-significant (i.e., model slope = 0).
2.4.3. Functional Structure
We represented the relative abundance of each category for the five biological traits using stacked bar graphs. All graphs were made in the R package Tidyverse [62].
3. Results
We identified 1648 nematodes belonging to two classes, six orders, 20 families, 58 genera, and 70 species in 66 replicates (Table S1). The most abundant species (all samples pooled) were Croconema cinctum (12%), Desmodora communis (9%), Euchromadora vulgaris (9%), Chromadora brevipapillata (7%), Dichromadora amphidiscoides (7%), Desmodora pontica (6%), and Zalonema vicentei (5%). Together they comprised 54% of the total abundance and belonged to only two families: Desmodoridae and Chromadoridae.
3.1. Diversity
The species accumulation curve for the whole reef system showed an observed richness of 70 ± 5 species (Figure 3a). The asymptotic value of richness at double of observed abundance (i.e., 3296 nematodes) was about 75 ± 7 species. The complete accumulation curve (i.e., rarefaction + extrapolation) had an asymptotic shape likely close to the true richness for the whole reef system. The species accumulation curves for sites did not reach an asymptote, except maybe for Site 4, suggesting that more nematodes should be identified at each site (Figure 3b).
For a comparison among sites, we calculated the expected species richness (±0.95 CIs) at the same level of abundance (i.e., 100 individuals). The average ES(100) varied between 20 and 30 species and the broad overlapping of the 0.95 CIs suggested no differences among sites (Figure 4a). Estimates of mean total species β-diversity varied from 0.6 at Site 4 to 0.9 at Site 5 (Figure 4b). The large 0.95 CIs broadly overlap, suggesting no differences among sites. The relatively high values of species β-diversities were mostly due to the replacement partition, with low contribution of richness differences.
The functional richness ranged among five and eight trait combinations, and the broad overlapping of the 0.95 CIs suggested no significant differences among sites (Figure 4c). The total functional β-diversity was in general lower (<0.5) when compared to species β-diversity. There were no differences in functional β-diversity among sites, although absolute values were in the middle of the range (i.e., Sorensen ≈ 0.5) (Figure 4d). The replacement partition was larger than the richness difference for all the sites.
3.2. Taxonomic Structure
The dominance profiles of sites were rather similar, except for Sites 5 and 6, with highest (22%) and lowest (10%) dominance, respectively (Figure 5a). The rareness was not so large, for instance, there were nine doubletons (species with two individuals) and 11 singletons (species with single individual) accounting for 13% and 16% of the total number of species, respectively.
The numerical ordination of the samples, based on species abundance, did not show any clustering pattern referred to site (Figure 5b). In other words, assemblage composition was largely unaffected by site identity.
PERMANOVA tests were coherent with these findings (Table 2). The three tested metrics (abundance, species density, and assemblage structure) were significantly and consistently influenced by site identity, but with a low amount of explained variance (26%, 34%, and 24%, respectively). Benthic cover explained very low variance in the data, and only for multivariate structure had a significant effect (Table 2).
We further explored the effects of coral and algae cover on the abundance and species density. The effects of the benthic cover (coral or algae) on assemblage metrics depended on the site as indicated by the intertwined of the best-fit lines (Figure 6a–d). The GLMM results indicate that no general slope related with the fixed effects (i.e., coral, algae, and its interaction) was significantly different from 0 (Table 3). In addition, the explained variance by the random effect (i.e., site) was at least double when compared with fixed effects. The whole analysis suggests an overriding effect of the local environment on the univariate metrics.
We selected those species that most contribute to the similarity within a site (i.e., typical species) using the SIMPER procedure and represented their relative abundance in a heatmap (Figure 7). Each site had a different species composition without any regularity along the reef tract. Sites 4, 5, and 7 had dominance of C. cinctum and D. communis, while sites 2 and 3 were dominated by C. brevipapillata. Site 1 was dominated by E. vulgaris, while site 6 was largely evened without any dominant species.
3.3. Functional Structure
Feeding group composition was similar across sites and largely dominated by microbial scraper nematodes (a.k.a., epigrowth feeders) (Figure 8a). The structure based on life strategy had dominance of nematodes with c-p values of 2 and 3, which are defined as good colonizers (Figure 8b). Nematodes with extreme colonizing abilities were absent, that is opportunistic nematodes with c-p 1 and “persister” nematodes with c-p 5. The structure based on amphidial fovea shape indicated a mild dominance of spiral and slit categories, but no clear pattern of occurrence (Figure 8c). The structure based on cuticle type was almost characterized by nematodes with punctuations and/or striations in the cuticle (Figure 8d). Nematodes with conical tail largely dominated the assemblages in all the sites (Figure 8e). In general, the functional structure was reasonably similar across the sites for all the biological traits except amphidial fovea shape.
4. Discussion
We have described the diversity and assemblage structure of cryptofaunal nematodes using taxonomic and functional approaches in Jardines de La Reina, one of the best-preserved coral reef systems in the Caribbean region. To our knowledge, no study has described the cryptofaunal nematode assemblages at genus/species level inhabiting on hard substrates partially covered by epilithic algal matrix and dominated by coralline communities. We organized this section in five subsections: γ-diversity, α- and β-diversity, assemblage structure, biological traits, and sampling issues.
4.1. Species Accumulation Curve and γ-Diversity
The species accumulation curve for the whole reef suggested that γ-diversity was reasonably well assessed given its asymptotic shape [63]. The asymptotic estimate of regional richness for the JR reef system was about 75 ± 7 species. There is not any other estimate of γ-diversity of free-living nematodes inhabiting hard substrates in coral reef terraces for comparison. In terms of regional diversity, this estimate is lower than those reported for coral degradation zones at species level (e.g., 112 species after [16]) and at genus level (e.g., 89–127 genera after [64]). For coralline sands, the reported γ-diversity is higher than in our study as well; for instance, 123 genera from Maldives atolls [65] and 146 species from a lagoon in New Caledonia [66].
On a regional scale, cryptofaunal nematodes seem less diverse than counterparts living on coral dead fragments or coralline sediments. Two plausible explanations ad hoc are possible here. First, nematodes are outcompeted by copepods, which are better adapted to thrive in epilithic algal matrices [13]. Second, the near-coral environment (coral ecosphere sensu [36]) generates deterrent metabolites that deplete the nematode diversity. Corals may defend against nematodes (and other cryptofauna) that erode the coral surface and/or feed on the mucus [3]. However, finer-scale observations and experiments are needed for testing these explanations. We further explored this effect in the analysis of potential drivers of the community structure (see below).
4.2. Striking Patterns of α- and β-Diversity
On a local scale, the species accumulation curve only approached an asymptote at Site 4, with nearly 500 individuals identified. This suggests that accurate assessment of α-diversity requires a sample size at least around this number [43]. This broadly agrees with a previous study [67] that suggested at least 300 nematodes for the estimation of local richness at genus level in tropical seagrass beds and unvegetated sediments. Lower sample sizes (e.g., 100 or 200 nematodes) still underestimate the local species richness, posing a formidable effort for diversity inventories in coral reefs.
We used rarefied samples to compare α-diversity among sites because abundance positively influences species richness [68]. Based on a sample size of 100 nematodes, we found similar species and functional richness along the seven sites in JR. Causes of spatial patterns in species richness are ultimately linked to two evolutionary processes, namely diversification rate and time [69]. Dispersal may also play a role as part of other ecological processes influencing richness [69]. We believe that diversification rate and time influences nematode populations at the same pace because of two reasons. First, the regional pool of species is common because sites all belong to the same biogeographic realm, namely Greater Antilles [70]. Second, the habitat type, which strongly influences the diversity of nematode assemblages [17], was the reef terrace at all the sites. In addition, dispersal should tend to homogenize the richness among sites because nematodes can passively disperse over hundreds of kilometers, especially when water flows are fast [71].
Species and functional β-diversity were characterized by substantial variability within sites that derived in broad 0.95 confidence intervals and lack of differences among sites. In general, small-scale heterogeneity of the substrate promotes nematode β-diversity in a variety of environments such as deep sea [72], lakes [73], and mangroves [74]. These findings fit theoretical considerations about the enhancing effects of habitat complexity and spatial heterogeneity on biodiversity [75]. In coral reefs, the microhabitat complexity positively influenced the cryptofaunal communities [76]. A previous report [38] showed large spatial heterogeneity of reef substrate at the same spatial grain (i.e., quadrats) that in current study. Therefore, we think that large heterogeneity at about 10-cm scale may explain both the high mean β-diversity and its variability within a site.
The decomposition of β-diversity into partitions may inform about the causes of the observed patterns [21]. We found that the replacement partition of β-diversity prevailed over the richness difference partition at all the sites. It was coherent with the lack of differences in α-diversity along sites and with the high total β-diversity reported above. The substantial replacement in our study reflected a simultaneous gain and loss of species and functional groups due to local processes such as environmental filtering and competition [22]. We hypothesize that these processes reflected the response of nematode assemblages to the spatial heterogeneity outlined above. In agreement with our results, other studies have reported that replacement partition is due to local environmental changes related with substrate (e.g., [77]). While richness differences could be related with niche availability [22], reef terraces within the JR reef system would be largely similar, thus maintaining this β-diversity partition in low magnitude.
4.3. Assemblage Structure
Nematode assemblages in the JR reef system had a rather moderate rareness with about 29% of singletons + doubletons. This is a rather low number when compared with deep sea, where environmental stability and poor dispersal promotes higher rareness of species/genera [78,79]. The proportion of rare species in other coral reef biotopes was higher as well; for instance, a previous study reported 38% [16] and another reported 48% [80], which is typical of hyperdiverse assemblages. We hypothesized that the moderate rareness is related to the effects of chronic stress by hydrodynamics on the nematode assemblages. This hypothesis is also supported by the similar morphology shared by the three dominant species in our study (C. cinctum, D. communis, and E. vulgaris). All of them exhibited robust shapes with thick setae longitudinally arranged and ornate cuticles, which pointed to a common set of traits adapted to physical stress (see section below).
The water flow regime is a main driver of meiofauna (and nematodes) in coral reefs as reported by studies from tropical Caribbean [16,80,81], equatorial Atlantic Ocean [82], and Maldives [83]. However, the effects of hydrodynamics on small-sized benthic animals in the coral reefs are hard to quantify because turbulence rules the interactions between substrate and surrounding seawater [84]. Turbulence may be linked to the significant random component of variation associated with sites that override the effects by benthic cover. Also, the high variability among quadrats points to the pervasive effects of turbulent water flows acting at centimeter-scale on the nematodes and causing resuspension and transport over the reef. We highlight the necessity of an experimental approach to relate small-scale water flows with meiofauna resuspension rate in the different features of the reef bottom (e.g., coral heads, epilithic algal matrix).
4.4. A Conservative Set of Biological Traits in the Reef
Nematode assemblages had a remarkable homogeneity in the functional structure, likely reflecting evolutionary adaptations to the reef environment. The oceanographic regime along the JR reef system was characterized by intense hydrodynamics, good oxygenation, and oligotrophy along the whole reef tract [85]. The benthic substrate varied significantly along the JR reef tract, but mostly at small scale among quadrats (separated about 5–10 m) within sites, with much less variation occurring among sites (separated about 10 km) [38]. These scale-dependent conditions likely favored the convergence into a similar “average” combination of biological traits along the studied sites: armed oral cavity/intermediate colonizing capability/ornamented cuticle/conical tail. The term “average” accounts for the averaging of the relative abundance of traits over all the replicates per site.
Microbivore scrapers dominated because of their ability to feed directly on the broad spectrum of food items that compose the biofilm (bacteria + microalgae + fungi) present on the substrate [86]. The armed oral cavity allows grazing on the biofilm and confers an adaptive advantage over detritivores which requires the accumulation of detritus, a condition limited by the intense hydrodynamics in the reef.
The assemblages were characterized by nematodes with good or intermediate colonizing capacity, that is c-p values 2 and 3 [52]. This life strategy is advantageous in an environment where nematodes are subjected to successive events or resuspension, transport, and settlement. Experimental evidence suggests that small-sized nematodes, which coincide mostly with good/intermediate colonizers, are most efficient in choosing habitats when descending in the water column [87]. However, more knowledge about the life strategy of most species is needed for a better interpretation of responses to physical disturbance.
The shape of amphidial fovea has been recently incorporated into the biological traits that may inform functional aspects of nematode assemblages [88]. The amphids are the main sensory organs of nematodes, functioning as mechano- and chemoreceptors [89]. Two types of foveae were consistently the best represented in our study: spiral and slit shapes; the other shapes varied largely among sites. Spiral shape can be considered as large-sized fovea, and slit shape as small-sized fovea [88]. Latter authors stated that nematodes with rounded and elongated loop foveae tend to dominate in dynamic environments with strong currents. They also related the fovea size to the availability of food sources in coralline sands, suggesting that well-developed amphids tend to predominate in habitats with less dissolved organic matter where chemical information travels long distances. Our evidence does not support this hypothesis because both large and small foveae occurred indistinctly in all the sites. An additional fact to consider is that, despite an oligotrophic oceanographic regime in JR, sharp gradients in organic matter and reef metabolites occur at scale of a few centimeters within the coral ecosphere [36]. These gradients may influence nematodes significantly and result in a particular combination of adaptive traits. We think that further experimental evidence gathered from different ecosystems is needed for developing an ecological interpretation of the fovea shape (but also for other “well-established” traits) within the framework of biological trait analysis.
We found a clear dominance of ornamented cuticles (i.e., striated and/or punctuated), likely reflecting an adaptation to physical forces that causes abrasion and reworking of nematodes. This type of cuticle is also typical of nematodes inhabiting coral degradation zones in the reefs [16] and coarse coralline sands [42].
The tail shape may play a role in the locomotion of marine nematodes, but also may work for avoiding resuspension into the water column [29,90]. Several studies have reported the dominance of conical tails in coral reef environments subjected to intense hydrodynamic regime [16,43,88]. Tail tip often bears a spinneret/valve secreting a sticky substance from caudal glands that may enhance the temporary attachment of the nematode’s body to the substrate [89]. Conspicuous pores in the tip tail of Croconema and Desmodora species, those more abundant in this study, were reported based on ultrastructural observations [91]. We hypothesize that these pores may function together with the spinneret for an enhanced secretion that increases the adherence to the substrate, avoiding resuspension by water flows.
4.5. A Sampling Method with Pros and Cons
The employed sampling method has pros and cons, reflecting the difficulty of quantitatively sampling the complex substrate of coral reefs. The most employed methods for sampling cryptofauna are based on manual collection or air-suction devices. A comparison between them indicated that no method clearly outperforms the others [92]. In this study, we used by-hand collection into bags, which likely missed an unknown fraction of cryptofauna. The most underestimated fraction was likely comprised of groups with good swimming capabilities such as crustaceans, for instance, copepods and amphipods. Nematodes are poor swimmers and likely escaped from the sampling in limited numbers; although, they have some minimal natatory capacity when descending from the water column [87]. That sampling was conducted by the same diver (MA) also ensured consistency in the procedure for all the samples. However, we avoided comparing the absolute total abundance of nematodes with other studies using methods such as suction devices [6] and experimental substrates [5,93] because of potential methodological differences. Overall, we believe that our sampling reasonably well represented the whole assemblage living on the reef substrate, based on the relatively high number of collected nematodes (>3000 individuals) and the rich taxonomic and functional information gathered.
5. Conclusions
We found several spatial patterns of cryptofaunal nematode assemblages inhabiting coralline hard substrates. The γ-diversity of cryptofaunal nematodes was moderate and lower than in other reef biotopes (e.g., coralline sands and coral degradation zones), likely reflecting evolutionary constraints related to interactions with living corals. The high β-diversity (mean over sites: 0.85) was likely due to the large substrate heterogeneity at 10-cm scale. The prevalence of replacement partition over richness difference further supports the influence of local substrate-related processes such as environmental filtering and competition on the β-diversity. The community structure was indistinct along the reef and likely affected by substrate heterogeneity and turbulent water flows. Therefore, no gradient occurred along the reef tract regarding the assemblage structure, nor was there a significant effect of benthic cover on nematodes. However, nematode functional structure showed a conservative set of four biological traits that enhances adaptation to the intense hydrodynamic regime of the coral reef. First, an armed oral cavity allowed grazing on the biofilm on reef substrate. Second, intermediate colonizing capability for survival of successive events of resuspension, transport, and settlement by water flows. Third, ornamented cuticles that increase the resistance to water flows causing abrasion and reworking. And fourth, a conical tail with a spinneret that enhances adherence to the substrate via secretion of substances. Small-scale observations and experiments are needed for quantifying the role of turbulent flows and substrate features on the cryptofaunal nematodes of coral reefs. Our results provide insights about the taxonomic and functional diversity of nematodes and highlight the vast knowledge gaps about the processes ruling the meiofauna community structure in coral reefs.
Supplementary Materials
The following supporting information can be downloaded at: https://www.mdpi.com/article/10.3390/d16050264/s1. Table S1: Excel spreadsheet of abundance of nematode species × sites.
Author Contributions
Conceptualization, M.A.; Methodology, M.A.; Software, M.A.; Validation, D.M.-P., J.A.P.-G. and M.A.; Formal Analysis, M.A.; Investigation, D.M.-P., J.A.P.-G., A.A. and M.A.; Resources, J.A.P.-G., A.A. and M.A.; Data Curation, D.M.-P. and J.A.P.-G.; Writing—Original Draft Preparation, D.M.-P.; Writing—Review & Editing, D.M.-P., J.A.P.-G., A.A. and M.A.; Visualization, M.A.; Supervision, J.A.P.-G.; Project Administration, A.A.; Funding Acquisition, A.A. and M.A. All authors have read and agreed to the published version of the manuscript.
Funding
This research was funded by Dalio Foundation’s Ocean Initiative (now OceanX). The APC was funded by Universidad Nacional Autónoma de México.
Institutional Review Board Statement
Not applicable.
Data Availability Statement
Data is contained within the article and Supplementary Material (Table S1).
Acknowledgments
Thanks to the crew and Captain Nick Inglis of the MV ‘Alucia’ for their invaluable assistance with this cruise and especially for diving assistance from Steve Hudson, Bubby Pavlo, Stefan McNabb, and Mitch Byron. We thank Adrián Martínez for helping us with the map, and Leslie Hernández-Fernández and Roberto González de Zayas for providing data of benthic cover. Observations were made under permit AN-(90)-2017 granted by the Oficina de Regulación Ambiental y de Seguridad Nuclear, Ministerio de Ciencia, Tecnología y Medio Ambiente (CITMA), Cuba. The research was made under permits NV2370 and NV2568 issued by the Ministerio de Relaciones Exteriores (MINREX), Republic of Cuba. We acknowledge two anonymous reviewers that improved the manuscript with their comments.
Conflicts of Interest
The authors declare no conflicts of interest. The funders had no role in the design of the study; in the collection, analyses, or interpretation of data; in the writing of the manuscript; or in the decision to publish the results.
References
- Roberts, C.M.; McClean, C.J.; Veron, J.E.N.; Hawkins, J.P.; Allen, R.; McAllister, D.E.; Mittermeier, C.G.; Schueler, F.W.; Spalding, M.; Wells, F.; et al. Marine biodiversity hotspots and conservation priorities for tropical reefs. Science 2002, 295, 1280–1284. [Google Scholar] [CrossRef] [PubMed]
- Wagner, D.; Friedlander, A.M.; Pyle, R.L.; Brooks, C.M.; Gjerde, K.M.; Wilhelm, T.A. Coral reefs of the high seas: Hidden biodiversity hotspots in need of protection. Front. Mar. Sci. 2020, 7, 567428. [Google Scholar] [CrossRef]
- Stella, J.S.; Pratchett, M.S.; Hutchings, P.A.; Jones, G.P. Coral-associated invertebrates: Diversity, ecological importance and vulnerability to disturbance. Oceanogr. Mar. Biol. Annu. Rev. 2011, 49, 43–104. [Google Scholar]
- Stella, J.S.; Wolfe, K.; Roff, G.; Rogers, A.; Priest, M.; Golbuu, Y.; Mumby, P.J. Functional and phylogenetic responses of motile cryptofauna to habitat degradation. J. Anim. Ecol. 2022, 91, 2203–2219. [Google Scholar] [CrossRef] [PubMed]
- Enochs, I.C.; Toth, L.T.; Brandtneris, V.W.; Afflerbach, J.C.; Manzello, D.P. Environmental determinants of motile cryptofauna on an eastern Pacific coral reef. Mar. Ecol. Progr. Ser. 2011, 438, 105–118. [Google Scholar] [CrossRef]
- Kramer, M.J.; Bellwood, D.R.; Bellwood, O. Cryptofauna of the epilithic algal matrix on an inshore coral reef, Great Barrier Reef. Coral Reefs 2012, 31, 1007–1015. [Google Scholar] [CrossRef]
- Klumpp, D.W.; McKinnon, A.D.; Mundy, C.N. Motile cryptofauna of a coral reef: Abundance, distribution and trophic potential. Mar. Ecol. Prog. Ser. 1988, 5, 95–108. [Google Scholar] [CrossRef]
- Wolfe, K.; Kenyon, T.M.; Desbiens, A.; de la Motte, K.; Mumby, P.J. Hierarchical drivers of cryptic biodiversity on coral reefs. Ecol. Monogr. 2023, 93, e1586. [Google Scholar] [CrossRef]
- Lewis, J.B.; Snelgrove, P.V.R. Corallum morphology and composition of crustacean cryptofauna of the hermatypic coral Madracis mirabilis. Mar. Biol. 1990, 106, 267–272. [Google Scholar] [CrossRef]
- Enochs, I.C.; Manzello, D.P. Species richness of motile cryptofauna across a gradient of reef framework erosion. Coral Reefs 2012, 31, 653–661. [Google Scholar] [CrossRef]
- Hodda, M. Phylum Nematoda: A classification, catalogue and index of valid genera, with a census of valid species. Zootaxa 2022, 5114, 1–289. [Google Scholar] [CrossRef] [PubMed]
- Appeltans, W.; Ahyong, S.T.; Anderson, G.; Angel, M.V.; Artois, T.; Bailly, N.; Bamber, R.; Barber, A.; Bartsch, I.; Berta, A.; et al. The magnitude of global marine species diversity. Curr. Biol. 2012, 22, 2189–2202. [Google Scholar] [CrossRef] [PubMed]
- Hicks, G.R.F.; Coull, B.C. The ecology of marine meiobenthic harpacticoid copepods. Oceanogr. Mar. Biol. Annu. Rev. 1983, 21, 67–175. [Google Scholar]
- Heip, C.; Vincx, M.; Vranken, G. The ecology of marine nematodes. Oceanogr. Mar. Biol. Annu. Rev. 1985, 23, 399–489. [Google Scholar]
- Semprucci, F.; Colantoni, P.; Baldelli, G.; Sbrocca, C.; Rocchi, M.; Balsamo, M. Meiofauna associated with coral sediments in the Maldivian subtidal habitats (Indian Ocean). Mar. Biodiv. 2013, 43, 189–198. [Google Scholar] [CrossRef]
- Pérez-García, J.A.; Marzo-Pérez, D.; Armenteros, M. Spatial scale influences diversity patterns of free-living nematode assemblages in coral degradation zones from the Caribbean Sea. Mar. Biodivers. 2019, 49, 1831–1842. [Google Scholar] [CrossRef]
- Armenteros, M.; Pérez-García, J.A.; Marzo-Pérez, D.; Rodríguez-García, P. The influential role of the habitat on the diversity patterns of free-living aquatic nematode assemblages in the Cuban Archipelago. Diversity 2019, 11, 166. [Google Scholar] [CrossRef]
- Magurran, A.E. Measuring Biological Diversity; Blackwell: Oxford, UK, 2004. [Google Scholar]
- Anderson, M.J.; Crist, T.O.; Chase, J.M.; Vellend, M.; Inouye, B.D.; Freestone, A.L.; Sanders, N.J.; Cornell, H.V.; Comita, L.S.; Davies, K.F.; et al. Navigating the multiple meanings of β diversity: A roadmap for the practicing ecologist. Ecol. Lett. 2011, 14, 19–28. [Google Scholar] [CrossRef]
- Whittaker, R.H. Vegetation of the Siskiyou mountains, Oregon and California. Ecol. Monogr. 1960, 30, 279–338. [Google Scholar] [CrossRef]
- Carvalho, J.C.; Cardoso, P.; Gomes, P. Determining the relative roles of species replacement and species richness differences in generating beta-diversity patterns. Glob. Ecol. Biogeogr. 2012, 21, 760–771. [Google Scholar] [CrossRef]
- Legendre, P. Interpreting the replacement and richness difference components of beta diversity. Glob. Ecol. Biogeogr. 2014, 23, 1324–1334. [Google Scholar] [CrossRef]
- Cardoso, P.; Rigal, F.; Carvalho, J.C.; Fortelius, M.; Borges, P.A.; Podani, J.; Schmera, D. Partitioning taxon, phylogenetic and functional beta diversity into replacement and richness difference components. J. Biogeogr. 2014, 41, 749–761. [Google Scholar] [CrossRef]
- Petchey, O.L.; Gaston, K.J. Functional diversity (FD), species richness and community composition. Ecol. Lett. 2002, 5, 402–411. [Google Scholar] [CrossRef]
- Mammola, S.; Carmona, C.P.; Guillerme, T.; Cardoso, P. Concepts and applications in functional diversity. Funct. Ecol. 2021, 35, 1869–1885. [Google Scholar] [CrossRef]
- Violle, C.; Navas, M.L.; Vile, D.; Kazakou, E.; Fortunel, C.; Hummel, I.; Garnier, E. Let the concept of trait be functional! Oikos 2007, 116, 882–892. [Google Scholar] [CrossRef]
- Mouillot, D.; Graham, N.A.J.; Villéger, S.; Mason, N.W.H.; Bellwood, D.R. A functional approach reveals community responses to disturbances. Trends Ecol. Evol. 2013, 28, 167–177. [Google Scholar] [CrossRef]
- Alves, A.S.; Veríssimo, H.; Costa, M.J.; Marques, J.C. Taxonomic resolution and Biological Traits Analysis (BTA) approaches in estuarine free-living nematodes. Estuar. Coast. Shelf Sci. 2014, 138, 69–78. [Google Scholar] [CrossRef]
- Thistle, D.; Lambshead, P.J.D.; Sherman, K.M. Nematode tail-shape groups respond to environmental differences in the deep sea. Vie Milieu 1995, 45, 107–115. [Google Scholar]
- Li, J.; Vincx, M.; Herman, P.M.J. Carbon flows through meiobenthic nematodes in the Westerschelde Estuary. Fundam. Appl. Nematol. 1997, 20, 487–494. [Google Scholar]
- Semprucci, F.; Grassi, E.; Balsamo, M. Simple is the best: An alternative method for the analysis of free-living nematode assemblage structure. Water 2022, 14, 1114. [Google Scholar] [CrossRef]
- Schratzberger, M.; Warr, K.; Rogers, S.I. Functional diversity of nematode communities in the southwestern North Sea. Mar. Environ. Res. 2007, 63, 368–389. [Google Scholar] [CrossRef] [PubMed]
- Caballero Aragón, H.; Armenteros, M.; Perera Valderrama, S.; Rey Villiers, N.; Cobian Rojas, D.; Campos Verdecia, K.; Alcolado Menéndez, P.M. Ecological condition of coral reef assemblages in the Cuban Archipelago. Mar. Biol. Res. 2019, 15, 61–73. [Google Scholar] [CrossRef]
- Grabb, K.C.; Kapit, J.; Wankel, S.D.; Manganini, K.; Apprill, A.; Armenteros, M.; Hansel, C. Development of a handheld submersible chemiluminescent sensor: Quantification of superoxide at coral surfaces. Environ. Sci. Technol. 2019, 53, 13850–13858. [Google Scholar] [CrossRef] [PubMed]
- Babbin, A.R.; Tamasi, T.; Dumit, D.; Weber, L.; Iglesias Rodríguez, M.V.; Schwartz, S.L.; Armenteros, M.; Wankel, S.D.; Apprill, A. Discovery and quantification of anaerobic nitrogen metabolisms among oxygenated tropical Cuban stony corals. ISME J. 2021, 15, 1222–1235. [Google Scholar] [CrossRef] [PubMed]
- Weber, L.; González-Díaz, P.; Armenteros, M.; Apprill, A. The coral ecosphere: A unique coral reef habitat that fosters coral–microbial interactions. Limnol. Oceanogr. 2019, 64, 2373–2388. [Google Scholar] [CrossRef]
- Weber, L.; González-Díaz, P.; Armenteros, M.; Ferrer, V.M.; Bretos, F.; Bartels, E.; Santoro, A.E.; Apprill, A. Microbial signatures of protected and impacted Northern Caribbean reefs: Changes from Cuba to the Florida Keys. Environ. Microbiol. 2019, 22, 499–519. [Google Scholar] [CrossRef]
- Hernández-Fernández, L.; González de Zayas, R.; Weber, L.; Apprill, A.; Armenteros, M. Small-scale variability dominates benthic coverage and diversity across the Jardines de La Reina, Cuba coral reef system. Front. Mar. Sci. 2019, 6, 747. [Google Scholar] [CrossRef]
- Navarro-Martínez, Z.M.; Armenteros, M.; Espinosa, L.; Lake, J.J.; Apprill, A. Taxonomic and functional assemblage structure of coral reef fishes from Jardines de la Reina (Caribbean Sea, Cuba). Mar. Ecol. Prog. Ser. 2022, 690, 113–132. [Google Scholar] [CrossRef]
- Lillis, A.; Apprill, A.; Armenteros, A.; Mooney, T.A. Small-scale variation in the soundscapes of coral reefs. In The Effects of Noise on Aquatic Life; Popper, A.N., Sisneros, J., Hawkins, A.D., Thomsen, F., Eds.; Springer Nature: Cham, Switzerland, 2023; pp. 1–23. [Google Scholar] [CrossRef]
- Boucher, G.; Gourbault, N.E.C. Sublitoral meiofauna and diversity of nematode assemblages of Guadeloupe Islands (French West Indies). Bull. Mar. Sci. 1990, 47, 448–463. [Google Scholar]
- De Jesús-Navarrete, A. Nematodos de los arrecifes de Isla Mujeres y Banco Chinchorro, Quintana Roo, Mexico. Rev. Biol. Mar. Oceanogr. 2007, 42, 193–200. [Google Scholar] [CrossRef]
- Armenteros, M.; Ruiz-Abierno, A.; Sosa, Y.; Pérez-García, J.A. Habitat heterogeneity effects on macro- and meiofauna (especially nematodes) in Punta Francés coral reef (SW Cuban Archipelago). Rev. Investig. Mar. 2012, 32, 50–61. [Google Scholar]
- Marzo-Pérez, D.; Pérez-García, J.A.; Armenteros, M. Lista taxonómica de nemátodos marinos de vida libre del sistema de arrecife coralino Jardines de la Reina, Cuba. Rev. Investig. Mar. 2023, 42, 38–46. [Google Scholar]
- Smol, N. (Ghent University, Ghent, Belgium). General techniques. International Nematology Course. 2007; Unpublished work. [Google Scholar]
- Platt, H.M.; Warwick, R.M. Free-Living Marine Nematodes. Part I. British Enoplids; Synopses of the British Fauna (New Series) 28; The Linnean Society of London and The Estuarine and Brackish-Water Sciences Association: Cambridge, UK, 1983. [Google Scholar]
- Platt, H.M.; Warwick, R.M. Free-Living Marine Nematodes. Part II. British Chromadorids; Synopses of the British Fauna (New Series) 38; The Linnean Society of London and The Estuarine and Brackish-Water Sciences Association: Cambridge, UK, 1988. [Google Scholar]
- Warwick, R.M.; Platt, H.M.; Somerfield, P.J. Free-Living Marine Nematodes. Part III. Monhysterids; Synopses of the British Fauna (New Series) 38; The Linnean Society of London and The Estuarine and Coastal Sciences Association: Shrewsbury, UK, 1998. [Google Scholar]
- Schmidt-Rhaesa, A. Handbook of Zoology. Gastrotricha, Cycloneuralia, Gnathifera. Volume 2: Nematoda; De Gruyter: Berlin, Germany, 2014. [Google Scholar]
- Teixidó, N.; Albajes-Eizagirre, A.; Bolbo, D.; Le Hir, E.; Demestre, M.; Garrabou, J.; Guigues, L.; Gili, J.; Piera, J.; Prelot, T.; et al. Hierarchical segmentation-based software for cover classification analyses of seabed images (Seascape). Mar. Ecol. Prog. Ser. 2011, 431, 45–53. [Google Scholar] [CrossRef]
- Hodda, M. Phylum Nematoda: Feeding habits for all valid genera using a new, universal scheme encompassing the entire phylum, with descriptions of morphological characteristics of the stoma, a key, and discussion of the evidence for trophic relationships. Zootaxa 2022, 5114, 318–451. [Google Scholar] [CrossRef] [PubMed]
- Bongers, T. The maturity index: An ecological measure of environmental disturbance based on nematode species composition. Oecologia 1990, 83, 14–19. [Google Scholar] [CrossRef] [PubMed]
- Bongers, T.; Bongers, M. Functional diversity of nematodes. Appl. Soil Ecol. 1998, 10, 239–251. [Google Scholar] [CrossRef]
- Hsieh, T.C.; Ma, K.H.; Chao, A. iNEXT: An R package for rarefaction and extrapolation of species diversity (Hill numbers). Methods Ecol. Evol. 2016, 7, 1451–1456. [Google Scholar] [CrossRef]
- Chao, A.; Gotelli, N.J.; Hsieh, T.C.; Sander, E.L.; Ma, K.H.; Colwell, R.K.; Ellison, A.M. Rarefaction and extrapolation with Hill numbers: A framework for sampling and estimation in species diversity studies. Ecol. Monogr. 2014, 84, 45–67. [Google Scholar] [CrossRef]
- Cardoso, P.; Rigal, F.; Carvalho, J.C. BAT–Biodiversity Assessment Tools, an R package for the measurement and estimation of alpha and beta taxon, phylogenetic and functional diversity. Methods Ecol. Evol. 2015, 6, 232–236. [Google Scholar] [CrossRef]
- Petchey, O.L.; Gaston, K.J. Functional diversity: Back to basics and looking forward. Ecol. Lett. 2006, 9, 741–758. [Google Scholar] [CrossRef]
- Clarke, K.R.; Gorley, R.N.; Somerfield, P.J.; Warwick, R.M. Change in Marine Communities: An Approach to Statistical Analysis and Interpretation, 3rd ed.; PRIMER-E: Plymouth, UK, 2014. [Google Scholar]
- Anderson, M.J.; Gorley, R.N.; Clarke, K.R. PERMANOVA+ for PRIMER: Guide to Software and Statistical Methods; PRIMER-E Ltd.: Massey, New Zealand, 2008. [Google Scholar]
- Zuur, A.F.; Ieno, E.N.; Walker, N.J.; Saveliev, A.A.; Smith, G.M. Mixed Effects Models and Extensions in Ecology with R; Springer: New York, NY, USA, 2009. [Google Scholar] [CrossRef]
- Bates, D.; Mächler, M.; Bolker, B.M.; Walker, S.C. Fitting linear mixed-effects models using lme4. J. Stat. Softw. 2015, 67, 1–48. [Google Scholar] [CrossRef]
- Wickham, H.; Averick, M.; Bryan, J.; Chang, W.; McGowan, L.D.A.; François, R.; Grolemund, G.; Hayes, A.; Henry, L.; Hester, J.; et al. Welcome to the Tidyverse. J. Open Source Softw. 2019, 4, 1686. [Google Scholar] [CrossRef]
- Colwell, R.K.; Chao, A.; Gotelli, N.J.; Lin, S.-Y.; Mao, C.-X.; Chazdon, R.L.; Longino, J.T. Models and estimators linking individual-based and sample-based rarefaction, extrapolation and comparison of assemblages. J. Plant Ecol. 2012, 5, 3–21. [Google Scholar] [CrossRef]
- Raes, M.; De Troch, M.; Ndaro, S.G.M.; Muthumbi, A.; Guilini, K.; Vanreusel, A. The structuring role of microhabitat type in coral degradation zones: A case study with marine nematodes from Kenya and Zanzibar. Coral Reefs 2007, 26, 113–126. [Google Scholar] [CrossRef]
- Semprucci, F.; Colantoni, P.; Baldelli, G.; Rocchi, M.; Balsamo, M. The distribution of meiofauna on back-reef sandy platforms in the Maldives (Indian Ocean). Mar. Ecol. 2010, 31, 592–607. [Google Scholar] [CrossRef]
- Boucher, G. Structure and biodiversity of nematode assemblages in the SW lagoon of New Caledonia. Coral Reefs 1997, 16, 177–186. [Google Scholar] [CrossRef]
- Liao, J.-X.; Yeh, H.-M.; Mok, H.-K. Meiofaunal communities in a tropical seagrass bed and adjacent unvegetated sediments with note on sufficient sample size for determining local diversity indices. Zool. Stud. 2015, 54, 14. [Google Scholar] [CrossRef]
- Gotelli, N.J.; Colwell, R.K. Estimating species richness. In Biological Diversity: Frontiers in Measurement and Assessment; Magurran, A.E., McGill, B.J., Eds.; Oxford University Press: Oxford, UK, 2011; pp. 39–54. [Google Scholar]
- Wiens, J.J. The causes of species richness patterns across space, time, and clades and the role of “ecological limits”. Quart. Rev. Biol. 2011, 86, 75–96. [Google Scholar] [CrossRef] [PubMed]
- Costello, M.J.; Tsai, P.; Wong, P.S.; Cheung, A.K.L.; Basher, Z.; Chaudhary, C. Marine biogeographic realms and species endemicity. Nat. Commun. 2017, 8, 1057. [Google Scholar] [CrossRef]
- Ptatscheck, C.; Traunspurger, W. The ability to get everywhere: Dispersal modes of free-living, aquatic nematodes. Hydrobiologia 2020, 847, 3519–3547. [Google Scholar] [CrossRef]
- Gambi, C.; Pusceddu, A.; Benedetti-Cecchi, L.; Danovaro, R. Species richness, species turnover and functional diversity in nematodes of the deep Mediterranean Sea: Searching for drivers at different spatial scales. Glob. Ecol. Biogeogr. 2014, 23, 24–39. [Google Scholar] [CrossRef]
- Flach, P.Z.S.; Ozorio, C.P.; Melo, A.S. Alpha and beta components of diversity of freshwater nematodes at different spatial scales in subtropical coastal lakes. Fundam. Appl. Limnol. 2012, 108, 249–258. [Google Scholar] [CrossRef]
- Spedicato, A.; Zeppilli, D.; Thouzeau, G.; Michaud, E. Nematode diversity patterns in mangroves: A review of environmental drivers at different spatial scales. Biodivers. Conserv. 2023, 32, 1451–1472. [Google Scholar] [CrossRef]
- Loke, L.H.L.; Chisholm, R.A. Measuring habitat complexity and spatial heterogeneity in ecology. Ecol. Lett. 2022, 25, 2269–2288. [Google Scholar] [CrossRef] [PubMed]
- Wolfe, K.; Desbiens, A.A.; Mumby, P.J. Emigration patterns of motile cryptofauna and their implications for trophic functioning in coral reefs. Ecol. Evol. 2023, 13, e9960. [Google Scholar] [CrossRef] [PubMed]
- Victorero, L.; Robert, K.; Robinson, L.F.; Taylor, M.L.; Huvenne, V.A.I. Species replacement dominates megabenthos beta diversity in a remote seamount setting. Sci. Rep. 2018, 8, 4152. [Google Scholar] [CrossRef] [PubMed]
- Armenteros, M.; Quintanar-Retama, O.; Gracia, A. Depth-related patterns and regional diversity of free-living nematodes in the deep-sea Southwestern Gulf of Mexico. Front. Mar. Sci. 2022, 9, 1023996. [Google Scholar] [CrossRef]
- Danovaro, R.; Gambi, C. Cosmopolitism, rareness and endemism in deep- sea marine nematodes. Eur. Zool. J. 2022, 89, 653–665. [Google Scholar] [CrossRef]
- Ruiz-Abierno, A.; Armenteros, M. Coral reef habitats strongly influence the diversity of macro and meiobenthos in the Caribbean. Mar. Biodivers. 2017, 47, 101–111. [Google Scholar] [CrossRef]
- Gamenick, I.; Giere, O. The microdistribution of coral sand meiofauna affected by water currents. Vie Milieu 1994, 44, 93–100. [Google Scholar]
- Netto, S.A.; Attrill, M.J.; Warwick, R.M. The effect of a natural water-movement related disturbance on the structure of meiofauna and macrofauna communities in the intertidal sand flat of Rocas Atoll (NE, Brazil). J. Sea Res. 1999, 42, 291–302. [Google Scholar] [CrossRef]
- Semprucci, F.; Colantoni, P.; Sbrocca, C.; Baldelli, G.; Rocchi, M.; Balsamo, M. Meiofauna in sandy back-reef platforms differently exposed to the monsoons in the Maldives (Indian Ocean). J. Mar. Syst. 2011, 87, 208–215. [Google Scholar] [CrossRef]
- Davis, K.A.; Pawlak, G.; Monismith, S.G. Turbulence and coral reefs. Annu. Rev. Mar. Sci. 2021, 13, 343–373. [Google Scholar] [CrossRef] [PubMed]
- Weber, L.; Armenteros, M.; Kido Soule, M.; Longnecker, K.; Kujawinski, E.B.; Apprill, A. Extracellular Reef Metabolites Across the Protected Jardines de la Reina, Cuba Reef System. Front. Mar. Sci. 2020, 7, 582161. [Google Scholar] [CrossRef]
- Moens, T.; Yeates, G.W.; de Ley, P. Use of carbon and energy sources by nematodes. Nematol. Monogr. Perspect. 2004, 2, 529–545. [Google Scholar]
- Ullberg, J.; Ólafsson, E. Free-living marine nematodes actively choose habitat when descending from the water column. Mar. Ecol. Prog. Ser. 2003, 260, 141–149. [Google Scholar] [CrossRef]
- Semprucci, F.; Cesaroni, L.; Guidi, L.; Balsamo, M. Do the morphological and functional traits of free-living marine nematodes mirror taxonomical diversity? Mar. Environ. Res. 2018, 35, 114–122. [Google Scholar] [CrossRef] [PubMed]
- Decraemer, W.; Coomans, A.; Baldwin, J. Morphology of Nematoda. In Handbook of Zoology. Gastrotricha, Cycloneuralia and Gnathifera; Schmidt-Rhaesa, A., Ed.; De Gruyter: Berlin, Germany, 2014; Volume 2, pp. 1–59. [Google Scholar]
- Thistle, D.; Sherman, K.M. The nematode fauna of a deep-sea site exposed to strong near-bottom currents. Deep-Sea Res. 1985, 32, 1077–1088. [Google Scholar] [CrossRef]
- Armenteros, M.; Ruiz-Abierno, A.; Decraemer, W. Revision of Desmodorinae and Spiriniinae (Nematoda: Desmodoridae) with redescription of eight known species. Eur. J. Taxon. 2014, 96, 1–32. [Google Scholar] [CrossRef]
- Keklikoglou, K.; Chatzigeorgiou, G.; Faulwetter, S.; Kalogeropoulou, V.; Plaiti, W.; Maidanou, M.; Dounas, C.; Lampadariou, N.; Arvanitidis, C. “Simple” can be good, too: Testing three hard bottom sampling methods on macrobenthic and meiobenthic assemblages. J. Mar. Biol. Assoc. UK 2019, 99, 777–784. [Google Scholar] [CrossRef]
- Pearman, J.K.; Leray, M.; Villalobos, R.; Machida, R.J.; Berumen, M.L.; Knowlton, N.; Carvalho, S. Cross-shelf investigation of coral reef cryptic benthic organisms reveals diversity patterns of the hidden majority. Sci. Rep. 2018, 8, 8090. [Google Scholar] [CrossRef] [PubMed]
Figure 1.
Study sites in the coral reef system Jardines de la Reina, southeastern Cuba. The inset shows the position of the reef system (red rectangle) at regional scale.
Figure 1.
Study sites in the coral reef system Jardines de la Reina, southeastern Cuba. The inset shows the position of the reef system (red rectangle) at regional scale.

Figure 2.
Photos of the sampled coral reefs in Jardines de La Reina. (a,b) Typical seascape of the coral reef terraces. (c,d) Typical aspect of the reef bottom included within the 25 cm × 25 cm frames.
Figure 2.
Photos of the sampled coral reefs in Jardines de La Reina. (a,b) Typical seascape of the coral reef terraces. (c,d) Typical aspect of the reef bottom included within the 25 cm × 25 cm frames.

Figure 3.
Species accumulation curves for cryptofaunal nematode assemblages from coral reef system Jardines de La Reina. (a) Curve of the whole reef system. (b) Curves of the seven sites. Both panels show rarefaction, observed, and extrapolated (to double of sample size) components. Gray shaded area indicates 0.95 confidence intervals.

Figure 4.
Taxonomic and functional diversity. (a) Expected species richness at 100 individuals. (b) Species β-diversity. (c) Expected functional richness at 100 individuals. (d) Functional β-diversity. In the box plots, horizonal lines = mean, box = 0.95 confidence intervals, and vertical lines = range. In the bar plots, the two additive partitions of β-diversity (replacement and richness difference) are indicated with colors, and whiskers indicate 0.95 confidence intervals around total β-diversity.

Figure 5.
The taxonomic structure of nematode assemblages in seven sites of the coral reef system Jardines de La Reina based on species abundance. (a) Dominance curves for sites. (b) Ordination by NMDS of the 66 samples coded by site. Relat. abund. = relative abundance.
Figure 5.
The taxonomic structure of nematode assemblages in seven sites of the coral reef system Jardines de La Reina based on species abundance. (a) Dominance curves for sites. (b) Ordination by NMDS of the 66 samples coded by site. Relat. abund. = relative abundance.

Figure 6.
Effects of benthic cover on univariate metrics of nematode assemblages at seven sites of the coral reef system Jardines de La Reina. (a) Abundance versus coral cover. (b) Abundance versus algae cover. (c) Species density versus coral cover. (d) Species density versus algae cover. Points represent replicates (quadrats), and lines are the best linear fit per site.

Figure 7.
Taxonomic structure of nematode assemblages in seven sites of the coral reef system Jardines de La Reina. The heatmap indicates the relative abundance (in %) of 14 typical species along sites. Typical species were selected independently for each site based on their contribution to the total similarity using the SIMPER procedure.

Figure 8.
Functional structure of nematode assemblages in seven sites of the coral reef system Jardines de La Reina based on relative abundance of biological traits. (a) feeding groups. Mic_Pro = microbivore processor, Mic_Scr = microbivore scraper, Mic_Suc = microbivore sucker, and Pre_Ing = predator ingester. (b) Life strategy (c-p value) from 1 (extreme colonizer) to 5 (extreme persister). (c) Amphidial fovea shape. Cir_Ova = circular or oval, Indisti = indistinct, Longitu = longitudinal. (d) Type of cuticle. Bac_cov = bacterial cover, Pun_Str = punctate and/or striated. (e) Tail shape. Con_cyl = conical-cylindrical, Elong_F = elongated and/or filiform, Short_R = short and/or rounded.


Table 1.
Sampling sites in the coral reef system Jardines de La Reina. The total number of identified nematodes and observed richness are given.
Table 1.
Sampling sites in the coral reef system Jardines de La Reina. The total number of identified nematodes and observed richness are given.
| Site | Latitude (N) | Longitude (W) | Depth (m) | Sampling Units | Nematodes | Observed Richness |
|---|---|---|---|---|---|---|
| 1 | 21.18351 | −79.35556 | 9 | 10 | 278 | 43 |
| 2 | 21.11029 | −79.32738 | 10 | 9 | 144 | 30 |
| 3 | 20.58030 | −79.11847 | 12 | 10 | 300 | 39 |
| 4 | 20.51286 | −79.02910 | 8 | 10 | 493 | 43 |
| 5 | 20.46464 | −78.54922 | 9 | 8 | 102 | 21 |
| 6 | 20.37612 | −78.35676 | 9 | 10 | 226 | 41 |
| 7 | 20.30788 | −78.23179 | 10 | 9 | 105 | 24 |
Table 2.
Results of the PERMANOVA testing different among sites in univariate (abundance and species density) and multivariate (assemblage structure) metrics. Coral and algae cover were included as covariates. DF = degrees of freedom, MS = mean square, ECV = estimates of components of variation. DF total = 65. Significant effects (p < 0.05) in bold.
| Metric | Source of Variation | DF | MS | Pseudo-F | p-Value | ECV (%) |
|---|---|---|---|---|---|---|
| Abundance | Coral cover | 1 | 290 | 0.49 | 0.47 | 0 |
| Algae cover | 1 | 1495 | 2.57 | 0.09 | 10 | |
| Site | 6 | 1495 | 2.57 | 0.019 | 26 | |
| Residual | 57 | 582 | 64 | |||
| Species density | Coral cover | 1 | 1.85 | 0.053 | 0.82 | 0 |
| Algae cover | 1 | 130 | 3.74 | 0.05 | 11 | |
| Site | 6 | 158 | 4.55 | 0.002 | 34 | |
| Residual | 57 | 35 | 55 | |||
| Assemblage structure | Coral cover | 1 | 2324 | 0.77 | 0.73 | 0 |
| Algae cover | 1 | 5151 | 1.72 | 0.03 | 7 | |
| Site | 6 | 6314 | 2.11 | 0.001 | 24 | |
| Residual | 57 | 2998 | 69 |
Table 3.
Results of the Generalized Linear Mixed Models testing for the effects of benthic cover (coral and algae) on the abundance and observed richness of nematodes. LCI = lower confidence interval, UCL = upper confidence interval. Note that only fixed effects have slope (with confidence intervals) and p-values associated. Random effects related to site only have explained variance.
| Response | Predictor | Slope | 0.95 LCI | 0.95 UCI | Explained Variance | p-Value |
|---|---|---|---|---|---|---|
| Abundance | Coral cover | 0.016 | −0.09 | 0.11 | 0.0023 | 0.73 |
| Algae cover | −0.004 | −0.03 | 0.021 | 0.0002 | 0.8 | |
| Interaction coral*algae | −0.002 | −0.005 | 0.0009 | 0.0000019 | 0.14 | |
| Coral|Site | 0.0048 | |||||
| Algae|Site | 0.0013 | |||||
| Species density | Coral cover | 0.038 | −4.25 | 0.12 | 0.0018 | 0.36 |
| Algae cover | −0.0011 | −1.24 | 0.01 | 0.000037 | 0.85 | |
| Interaction coral*algae | −0.0024 | −5.84 | 0.0004 | 0.0000023 | 0.11 | |
| Coral|Site | 0.000099 | |||||
| Algae|Site | 0.00031 |
Disclaimer/Publisher’s Note: The statements, opinions and data contained in all publications are solely those of the individual author(s) and contributor(s) and not of MDPI and/or the editor(s). MDPI and/or the editor(s) disclaim responsibility for any injury to people or property resulting from any ideas, methods, instructions or products referred to in the content. |
© 2024 by the authors. Licensee MDPI, Basel, Switzerland. This article is an open access article distributed under the terms and conditions of the Creative Commons Attribution (CC BY) license (https://creativecommons.org/licenses/by/4.0/).
Share and Cite
MDPI and ACS Style
Marzo-Pérez, D.; Pérez-García, J.A.; Apprill, A.; Armenteros, M. Diversity of Cryptofaunal Nematode Assemblages along the Jardines de La Reina Coral Reef, Southern Cuba. Diversity 2024, 16, 264. https://doi.org/10.3390/d16050264
AMA Style
Marzo-Pérez D, Pérez-García JA, Apprill A, Armenteros M. Diversity of Cryptofaunal Nematode Assemblages along the Jardines de La Reina Coral Reef, Southern Cuba. Diversity. 2024; 16(5):264. https://doi.org/10.3390/d16050264
Chicago/Turabian StyleMarzo-Pérez, Diana, Jose Andrés Pérez-García, Amy Apprill, and Maickel Armenteros. 2024. "Diversity of Cryptofaunal Nematode Assemblages along the Jardines de La Reina Coral Reef, Southern Cuba" Diversity 16, no. 5: 264. https://doi.org/10.3390/d16050264
Note that from the first issue of 2016, this journal uses article numbers instead of page numbers. See further details here.