
Bibliometric Literature Review of Adaptive Learning Systems
by
 , , , , and
Dionisios Koutsantonis
1,
Konstantinos Koutsantonis
1,
Nikolaos P. Bakas
1,*,
Vagelis Plevris
2 ,
,
Andreas Langousis
3 and
Savvas A. Chatzichristofis
4,*
1
Research and Development Department, RDC Informatics, 10442 Athens, Greece
2
Department of Civil and Architectural Engineering, Qatar University, Doha P.O. Box 2713, Qatar
3
Department of Civil Engineering, University of Patras, 26504 Patras, Greece
4
Intelligent Systems Laboratory, Department of Computer Science, Neapolis University Pafos, Pafos 8042, Cyprus
*
Authors to whom correspondence should be addressed.
Sustainability 2022, 14(19), 12684; https://doi.org/10.3390/su141912684
Submission received: 6 August 2022
/
Revised: 28 September 2022
/
Accepted: 28 September 2022
/
Published: 5 October 2022
(This article belongs to the Topic Effectiveness and Sustainable Application on Educational Technology)
Abstract
:In this review paper, we computationally analyze a vast volume of published articles in the field of Adaptive Learning, as obtained by the Scopus Database. Particularly, we use a query with search terms targeting the area of Adaptive Learning Systems by utilizing a combination of specific keywords. Accordingly, we apply a multidimensional scaling algorithm to construct bibliometric maps for keywords, authors, and references. Subsequently, we present the computational results for the studied dataset, reveal significant patterns appearing in the field of adaptive learning and the inter-item associations, and interpret the findings based on the current state-of-the-art literature in the area. Furthermore, we demonstrate the time-series of the evolution of the research terms, their trends over time, as well as their prevalent statistical associations.
1. Introduction
Scientific research in the field of learning systems has progressed through the inevitable utilization of technology advancements [1]. The aim is to describe and design learning processes that are able to dynamically adjust to the level or type of course content based on an individual student’s tacit knowledge or skills. Accordingly, systems that accelerate a learner’s performance have emerged, often characterized as intelligent tutoring systems and personalized training [2]. Among others, these terms have been referenced in numerous scientific papers over the last 20 years, to describe the notion and aspects of adaptive learning systems. However, due to the vast scientific output produced in any discipline, it is a modern approach to use quantitative tools to analyze the current structure of a thematic area [3], usually followed by a more specific analysis of the most influential papers [4].
The purpose of this paper is to systematically analyze the evolution, status, and trends of scientific research in the field of adaptive learning systems, by utilizing a generic framework for Bibliometric Analysis [5,6,7,8]. This analysis is performed by assorting specific attributes of the papers, such as the comprised keywords, authors, references, as well as other types of bibliographical information, e.g., journal’s metrics and papers’ citations, herein called Bibliometric Objects (BO), and using a machine learning algorithm, which is described in Section 2. In Section 3, the query for the extraction of the studied datasets is described, and in Section 4 we analyze the numerical results. In Section 5 we associate the results with the top-cited papers in the field and interpret the findings. In Section 7, the conclusions of the study are presented.
2. Multidimensional Scaling for Bibliometric Mapping
The rendering of a bibliometric map requires the identification of the location of each BO on a two-dimensional space, such that the distances among the objects represent the inter-item dissimilarities. Particularly, a bibliometric map has the following characteristic attributes:
- Each object (e.g., Keyword, Author, or Reference) is represented as a point on the 2D map, with its coordinates on the Cartesian plane;
- The objects with co-occurrences are connected with a line;
- The thickness of the line represents the link strength, which is proportional to the similarity (or co-occurrence) between the objects;
- The distances between the objects are indicators of their dissimilarity.
2.1. Baseline Formulation
We define as the elements of the contingency matrix , with
the iterator for the number of Bibliometric Objects N, and . The contingency table corresponds to the counting of the co-occurrence of objects. Henceforth, it is rational to define the similarity matrix , with elements
and the corresponding dissimilarity
both comprising values in . Accordingly, we define the pairwise distances of two elements on the map
where stands for the t-dimensional vector, defining the position of the point on the map. For the case of two-dimensional maps, we use ; however, the procedure can be generalized for as well for 3D maps or dimensionality reduction procedures.
Ideally, we should have a map such that
or alternatively,
However, this cannot be attained exactly for any . Henceforth, the problem of finding the bibliometric objects’ location on the map should be formulated as an optimization problem, that is, to find the best possible Furthermore, the formulation of a representative objective function for such a purpose is not unique and vastly affects the obtained shape of the map (see next Section 2.2). Moreover, the optimization algorithm used to solve this problem is still an open issue (see below Section 2.3).
2.2. Objective Functions
By defining f as the objective function, the problem of finding the best possible topology of the objects is formulated as finding the optimal , that is to say
for a t-dimensional map, and a given domain . A number of objective functions were investigated in order to construct a map, such that each corresponds to the reciprocal . One approach to this multidimensional scaling problem [9], can be formulated as finding a t-dimensional map, where the order of distances of the N objects, when ranked monotonically at a descending order, corresponds to the monotonically descending order of their dissimilarities [10,11]. That is to say, higher distances resemble lower similarities. This is achieved through the minimization of the corresponding errors, called stresses. However, this approach does not always offer a consistent representation of the dissimilarities, as it does not utilize a mathematical association for the mapping of the dissimilarities to the distances further than the monotonicity. Thus, two pairs of points on the map with comparable distances may correspond to dissimilarities with a high difference.
Another approach often used in bibliometric mapping [12], is to minimize the objective function
or, equivalently,
However, this approach does not exploit the significant information where the similarities are equal to zero because they will be omitted in the summation. Additionally, it does not offer a measure of the efficiency of the algorithm, as the summation is not comprehensible.
Additionally, we investigated as an objective function a combined metric obtained by fitting a regression curve between the dissimilarities and the distances. The regression was nonlinear, considering the dissimilarities to an power as the independent variable and the corresponding distances as the dependent ones. The regression equation is written as
where is the regression coefficient, is the constant term, and is the regression residuals. Hence, by varying the positions on map , the regression coefficients , as well as the coefficient of determination , also varied. Accordingly, the objective function to be minimized can be written as
using the factor for , for normalization purposes. This way, the optimization algorithm is utilized to find a solution satisfying the fundamental regression requirements, for low or zero constant term, high and close to a unit slope of the regression line. The total number of design variables was ; i.e., for the points and 1 for r, as we varied r during the optimization process. The regression coefficient that was divided by three relaxed the variation of the slope, as it is important to avoid extreme values, for example, slopes close to zero or tending to infinity. However, this formulation is in fact a double optimization problem, one for the map and one for the regression, which is nested into the former. Hence, the execution time was very slow. Additionally, the results were not satisfactory, as the errors, although small, disorientated the mapping procedure.
Accordingly, another idea was to minimize directly, the absolute value of the difference between the distances, and a nonlinear function of the dissimilarities
Therefore, by including in the optimization problem, the number of variables becomes . However, this approach gave us good results only for extreme (high or small) values of ; thus, the corresponding maps did not supply any information regarding the efficiency of the algorithm.
Additional approaches were investigated. In particular, instead of using the co-occurrence map, the matrix of the chi-squared statistic, as well as the corresponding p-values, were investigated as candidates for similarity matrices. However, the p-values exhibit vastly low values (e.g., or less), and thus the corresponding distances could not be coherent. Similarly, for the , the values were either equal to zero or close to 1, not supplying the necessary information to construct the map. Furthermore, instead of minimizing the summation of the errors between the distances and the dissimilarities, the maximum difference, as well as specific quantiles of the distribution of the differences, were also investigated. However, they did not perform well enough, as the minimization problem does not have a solution equal to zero because of the error always existing in dimensionality reduction problems. Thus, optimizing the maximum or the 75% percentile does not necessarily lead to the minimization of the other distances, as well.
Another idea was also investigated, inspired by the dropout technique [13], which is common in the training of artificial neural networks, targeting the avoidance of over-fitting. In particular, the technique was used each time the optimizer did not optimize the percentile (i.e., 75%) but the , where stands for a randomly generated error number. However, this technique did not give satisfactory results for the reasons stated above. Other specific techniques, such as linkage or hierarchical clustering, exist for the representation of multiple correlations between N objects; however, they do not usually offer a coherent, easy, and quick interpretable way of representing the associations between N objects simultaneously, as that multidimensional scaling offers.
Finally, after many trials, we decided to utilize the formula
We may also add the constraint
where l is a specified threshold to avoid the coincidence of pairs of objects in the final map.
Furthermore, we may easily weigh the elements of the objective function by multiplying them by the summation of the occurrences for each pair . This way, we can control the map creation by giving more attention to the most important elements.
2.3. Optimization Algorithms
A number of optimization algorithms were investigated for the minimization of the objective function of the optimization problem, including genetic algorithms [14], pattern search [15], particle swarm optimization [16,17,18], trust region [19], global search [20], and the Levenberg–Marquardt Algorithm [10,21,22], among others. For the trust region and global search methods, the supply of the gradient was investigated, as well. Finally, we utilized the Pure Random Orthogonal Search (PROS) optimization Algorithm [23,24], modified to fit the Bibliometric problem, as presented in Algorithm 1.
| Algorithm 1: Bibliometric map generation |
| Data: Vector of Strings of the Bibliometric Objects Result: optimal positions on the Bibliometric Map Compute co-occurrences of the studied BO and maximum iterations ; Compute from (Equations (1) and (2)); Initialize randomly Assign ;  |
The procedure is generic for all BO, denoting either keywords, authors, references, or any other object. All the matrices are symmetric. The vector comprises the design variables of the optimization problem. For a 2D map, denotes a set of points in the space, that is
Ideally and only theoretically, all the errors should become equal to zero, but this cannot be attained in practice because the map represents multidimensional relationships in the 2D space, leading in dimensionality reduction. Hence, the aim is to find all the , corresponding to the minimum errors .
The algorithm starts with the initial calculation of the co-occurrence table of the studied objects (keywords, authors, or references). Accordingly, the similarity and dissimilarity matrices are obtained, as per Section 2.1. The optimization algorithm randomly initializes the positions of each object and computes the distances between the objects on the bibliometric map. In the end, the optimal values of the positions are utilized to visualize the results on the bibliometric map.
Furthermore, we may specify a priori the locations of the top frequent keywords . For this work, we positioned the most frequent keyword at the center of the map (0, 0) and the next four most frequent on a unit rectangle around zero. The optimization algorithm runs after this step accordingly.
3. The Studied Databases of Papers
A bibliometric study depends on the papers’ database; subsequently, the initial effort is given to assembling a thorough query. Some iterations might be necessary until the query represents the actual topic studied. It is essential to keep track of the searching date, as well as the exact query, in order to obtain reproducible results. A good practice is to start with a generic search and, step-by-step, narrow it down to identify the thematic area in the database in order to obtain a final search query that will focus on a particular field without losing its significant thematic areas. There are several databases that can be used such as Scopus (https://www.scopus.com, (accessed on 17 March 2022) ), Web of Science (https://www.webofscience.com, (accessed on 17 March 2022)), Google Scholar (https://scholar.google.com/, (accessed on 17 March 2022)), etc. In this work we use the Scopus database, comprising a rich collection of journals [25].
3.1. The Scopus Query
We searched in the Scopus [26] database by using a combination of keywords derived from an initial screening of the papers in the literature regarding Adaptive Learning (Table 1). Hence we get the following query of the form “TITLE-ABS-KEY (“personalized learning”) OR TITLE-ABS-KEY (“intelligent tutoring systems”) …”, etc. The complete structure of the query is presented in Table 1. We selected these particular keywords, after an overview of the literature regarding adaptive learning systems. Accordingly, after a manual search of the existing papers, we selected the ones that occurred with high frequency, still relevant to the studied topic.
We assembled the query on 17 March 2022. We limit the results to the last 30 years, i.e., within the period 1992–2021, as before 1992 we had only a few papers (less than 20 per year), and 2022 is still a year in progress. Hence, we obtained a total of 5564 papers in the following categories: Conference Papers (N = 3756), Articles (N = 1489), Book Chapters (N = 129), Conference Reviews (N = 75), Reviews (N = 67), Books (N = 19), Notes (N = 11), Retracted Articles (N = 6), Editorials (N = 6), Letters (N = 3), Errata (N = 2), Short Surveys (N = 1).
3.2. Keywords’ Grouping
Keywords’ grouping is a significant part of the analysis, as some keywords appear with multiple records. For example, the keyword “Artificial Neural Network”, will count as different than “Artificial Neural Networks”, and “ANNs”. The grouping of keywords after a first analysis will contribute to obtaining aggregated and meaningful results. In Appendix A, we provide the grouping of the utilized keywords. All keywords (as well as authors, references, etc.) are converted to lowercase so as to avoid duplicate BO.
4. Results
4.1. Bibliometric Map of Keywords
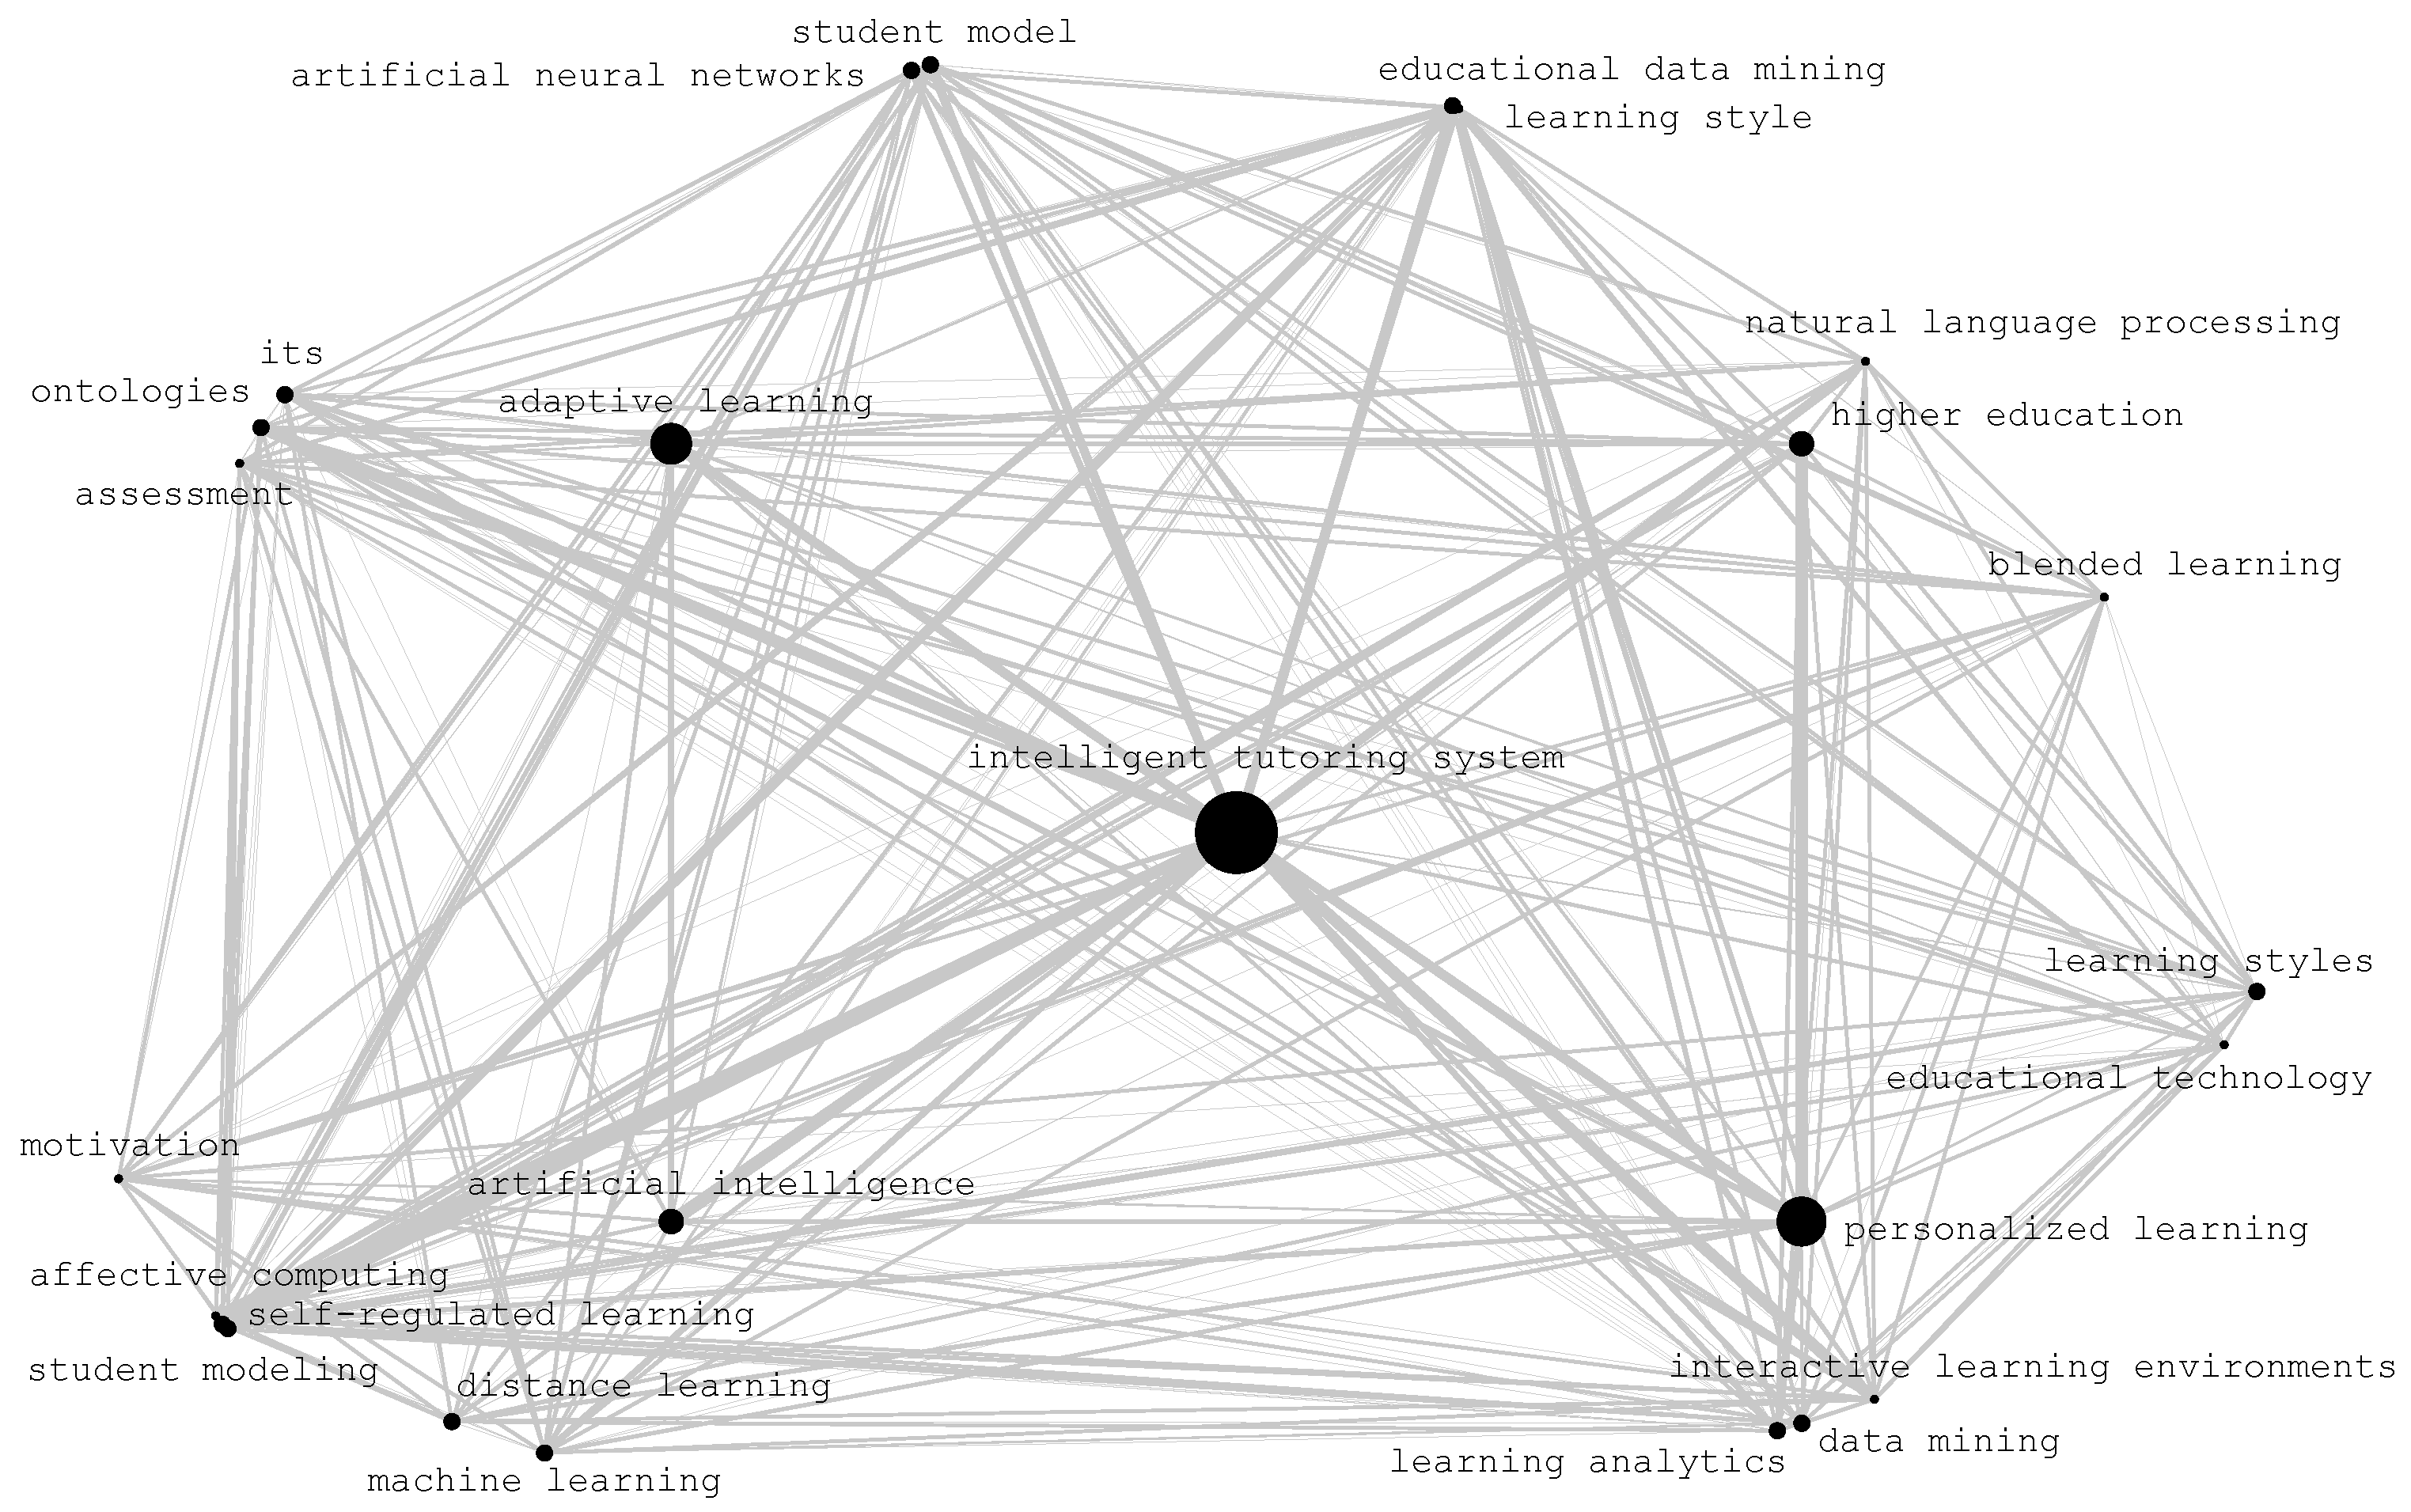
In Figure 1, the bibliometric map of the top 28 keywords after grouping is presented. As stated in Section 2, we put in the center the keyword “intelligent tutoring system”, and around it the next top four keywords, which are:
- Adaptive learning;
- Personalized learning;
- Artificial intelligence;
- Higher education.
Despite the complex nature of the associations presented by the lines connecting the keywords, we may distinguish some clusters of keywords as automatically detected by the algorithm. Particularly, close to keyword “artificial intelligence”, we observe the following keywords:
- Self-regulated learning;
- Affective computing;
- Machine learning;
- Distance learning;
- Student modeling,
- Motivation.
Furthermore, close to “adaptive learning”, we see “ontologies”, and “assessment”. Additionally, close to “personalized learning”, we observe the keywords “interactive learning environments”, “data mining”, “learning analytics” at a micro cluster, along with keywords “educational technology”, and “learning styles” at another cluster near the former one. The keyword “higher education”, was found close to “natural language processing”, and “blended learning”. Finally, at the top edge of the map, we may see the keyword “student model”, very close to “artificial neural networks”, and “learning style”, close to “educational data mining”. Accordingly, we present in Table 2 the automatically extracted sub-categories of the field.
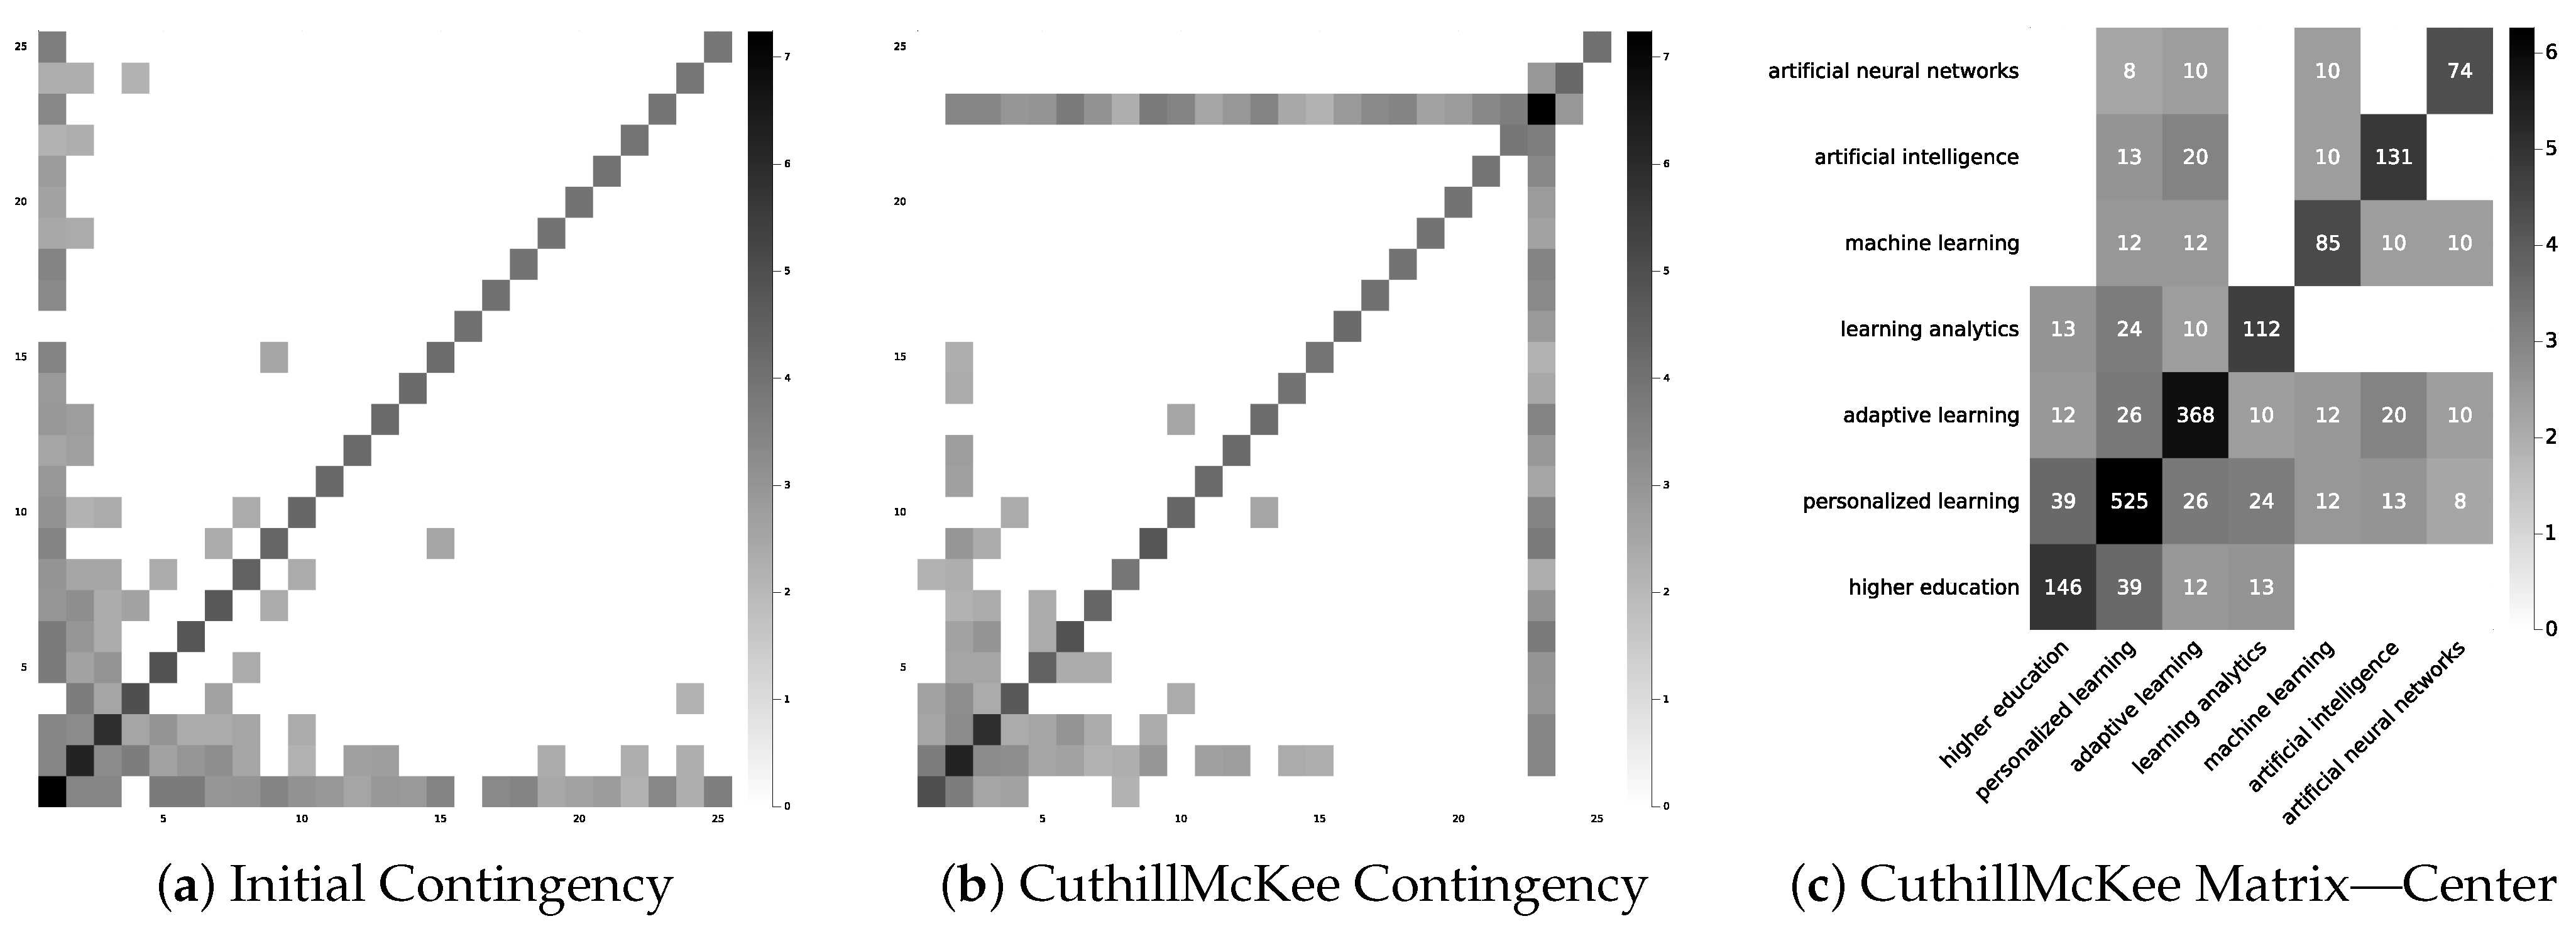
Similar findings are rendered if we re-arrange the co-occurrence matrix for keywords, using the Cuthill McKee algorithm [27,28] as per Figure 2. Particularly, by re-arranging the rows and columns of the matrix to obtain the majority of the elements near the main diagonal, we see that the keywords “higher education”, “personalized learning”, “adaptive learning”, “learning analytics”, “machine learning”, “artificial intelligence”, and “artificial neural networks” are highly related pair-wise.
4.2. Current State and Emerging Insights
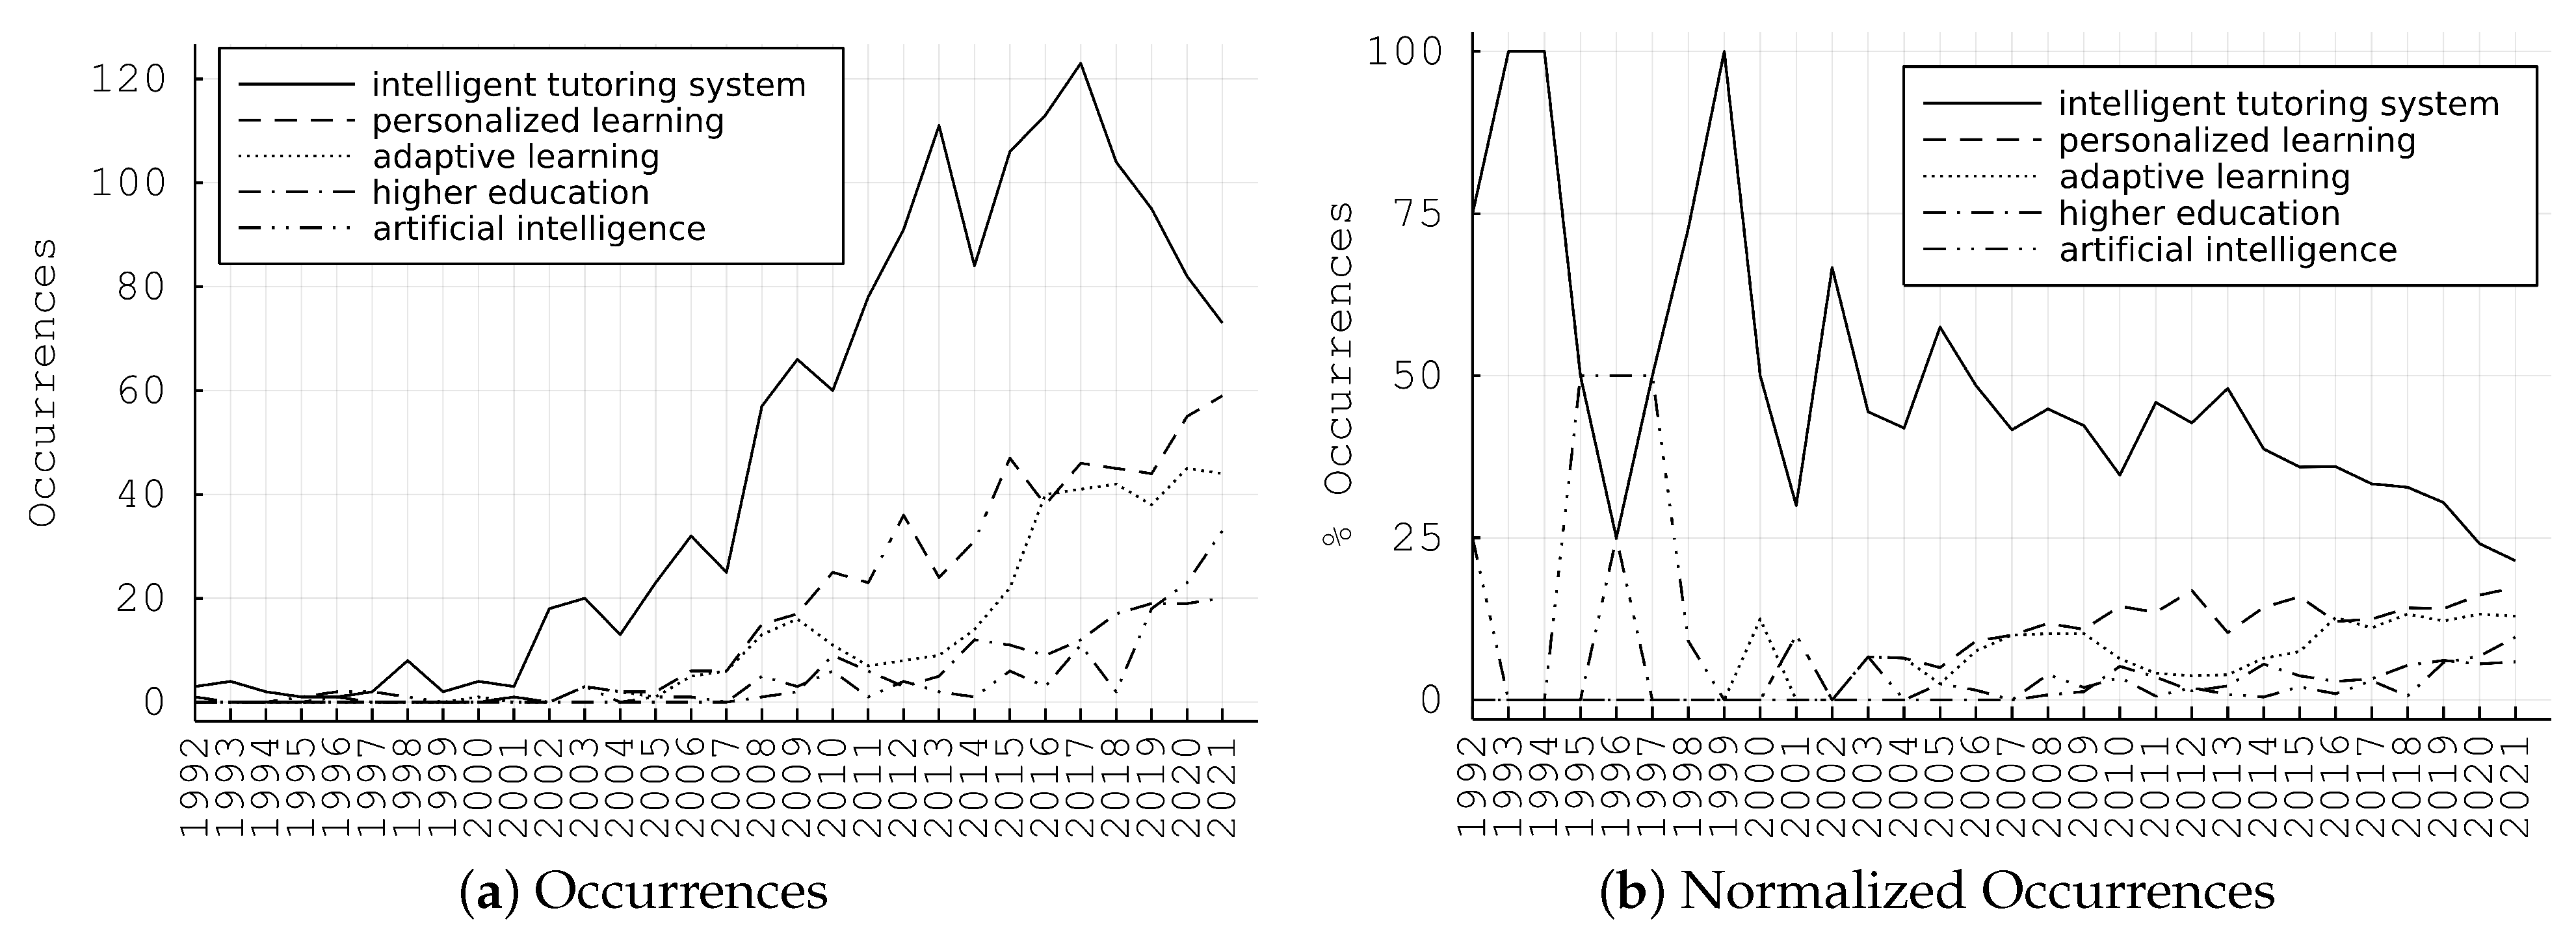
It is of great importance to highlight not only the structure of the studied field and its sub-categories, but also the evolution of the research, along with future trends. In order to do this in a generic, quantitative manner, we perform time-series analysis. Particularly, in Figure 3a, we demonstrate the evolution of the number of the top five keywords’ occurrences over time. We may observe a clear increasing pattern for all keywords, apart from “intelligent tutoring system”, which presents a decreasing pattern after 2017. This is further confirmed if we plot the normalized time-series, which is the initial counting, divided by the total number of papers published in the current year for the specific data set. This is depicted in Figure 3b, where “intelligent tutoring system”, decreases constantly, contradictory with the other top four keywords.
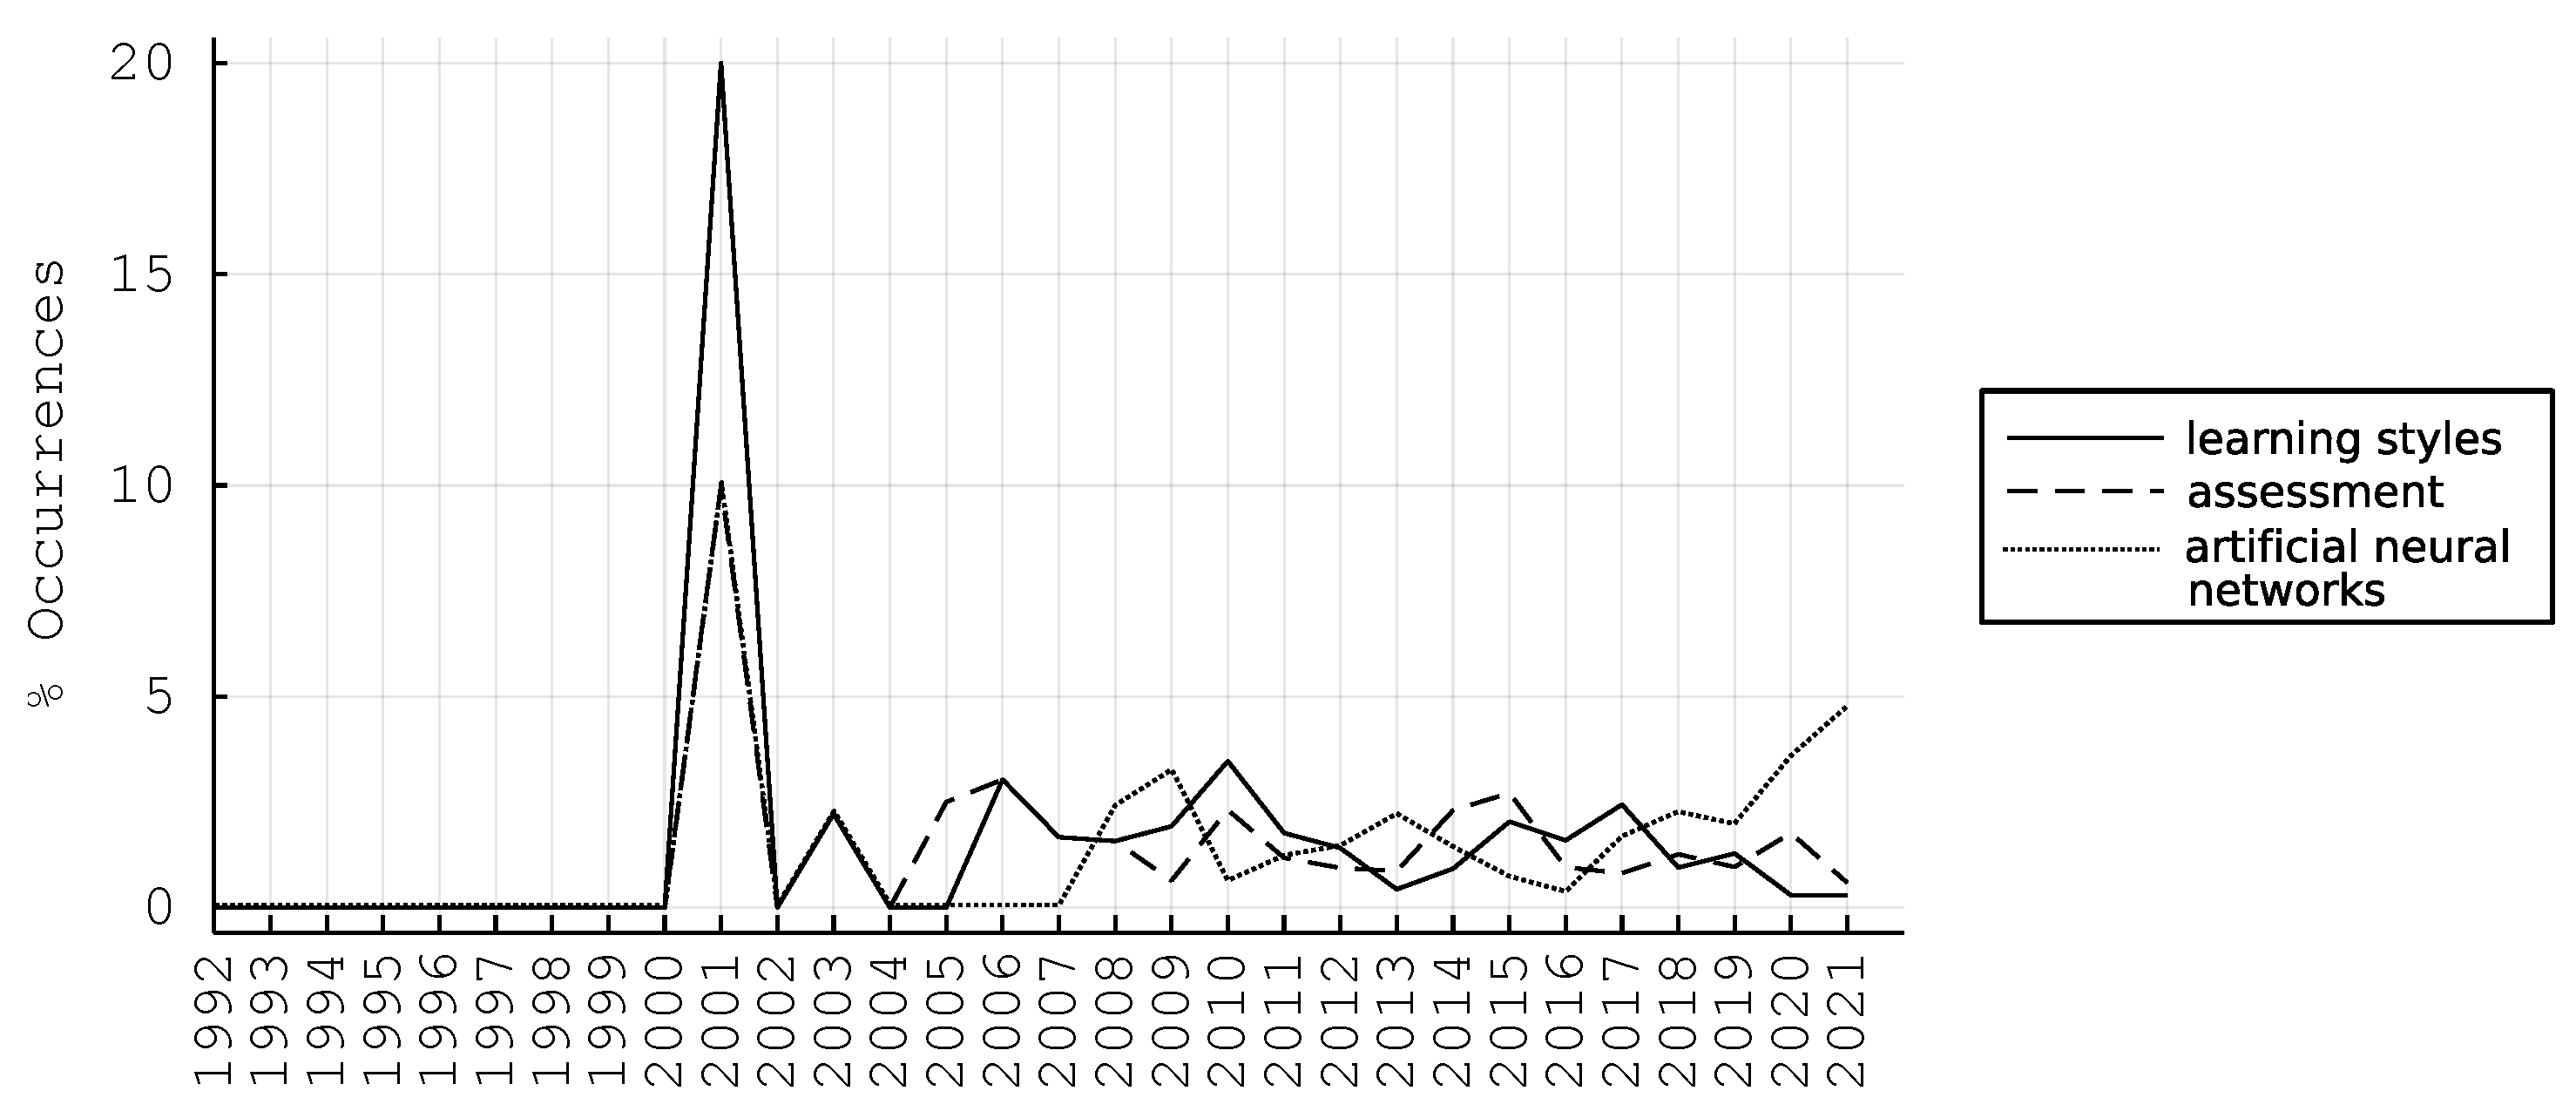
Furthermore, by identifying all the pairwise Pearson correlation coefficients of the time-series, we obtain Figure 4, depicting “learning styles” to be highly correlated over time with “assessment”, with a peak in 2001, a Pearson correlation of 92.7%, and, similarly “learning styles” with “artificial neural networks”, having a Pearson correlation of 79.3%.
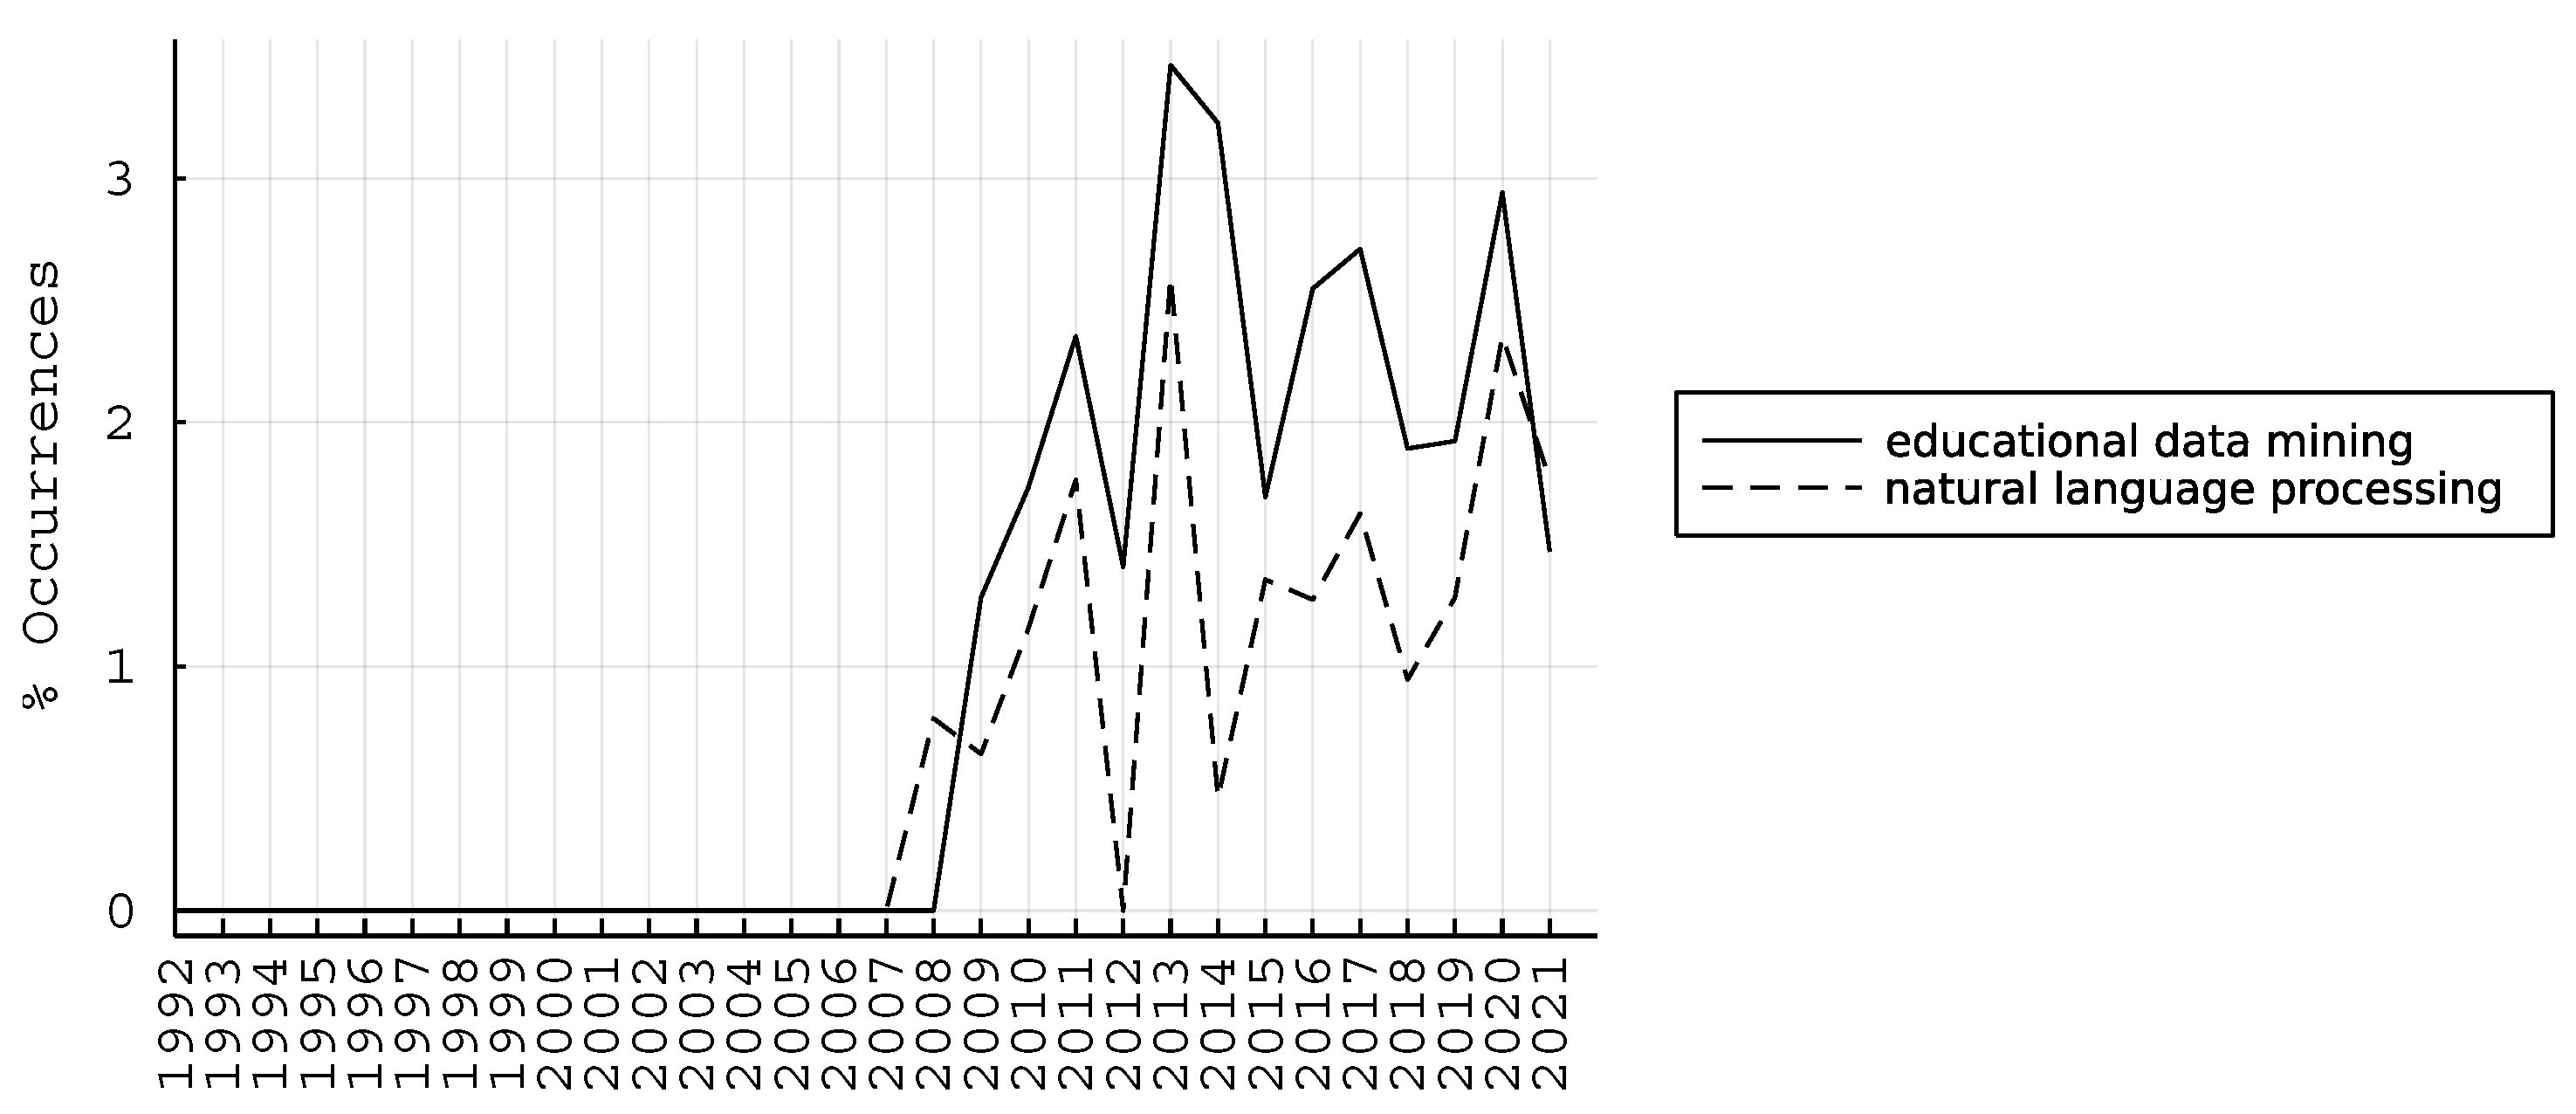
An interesting finding is obtained from Figure 5, where we may see that “educational data mining” and “natural language processing” time-series exhibit close evolution over time, with a Pearson correlation of 85.1%. This indicates a significant part of the modern adaptive learning system, where text analysis is prevalent.
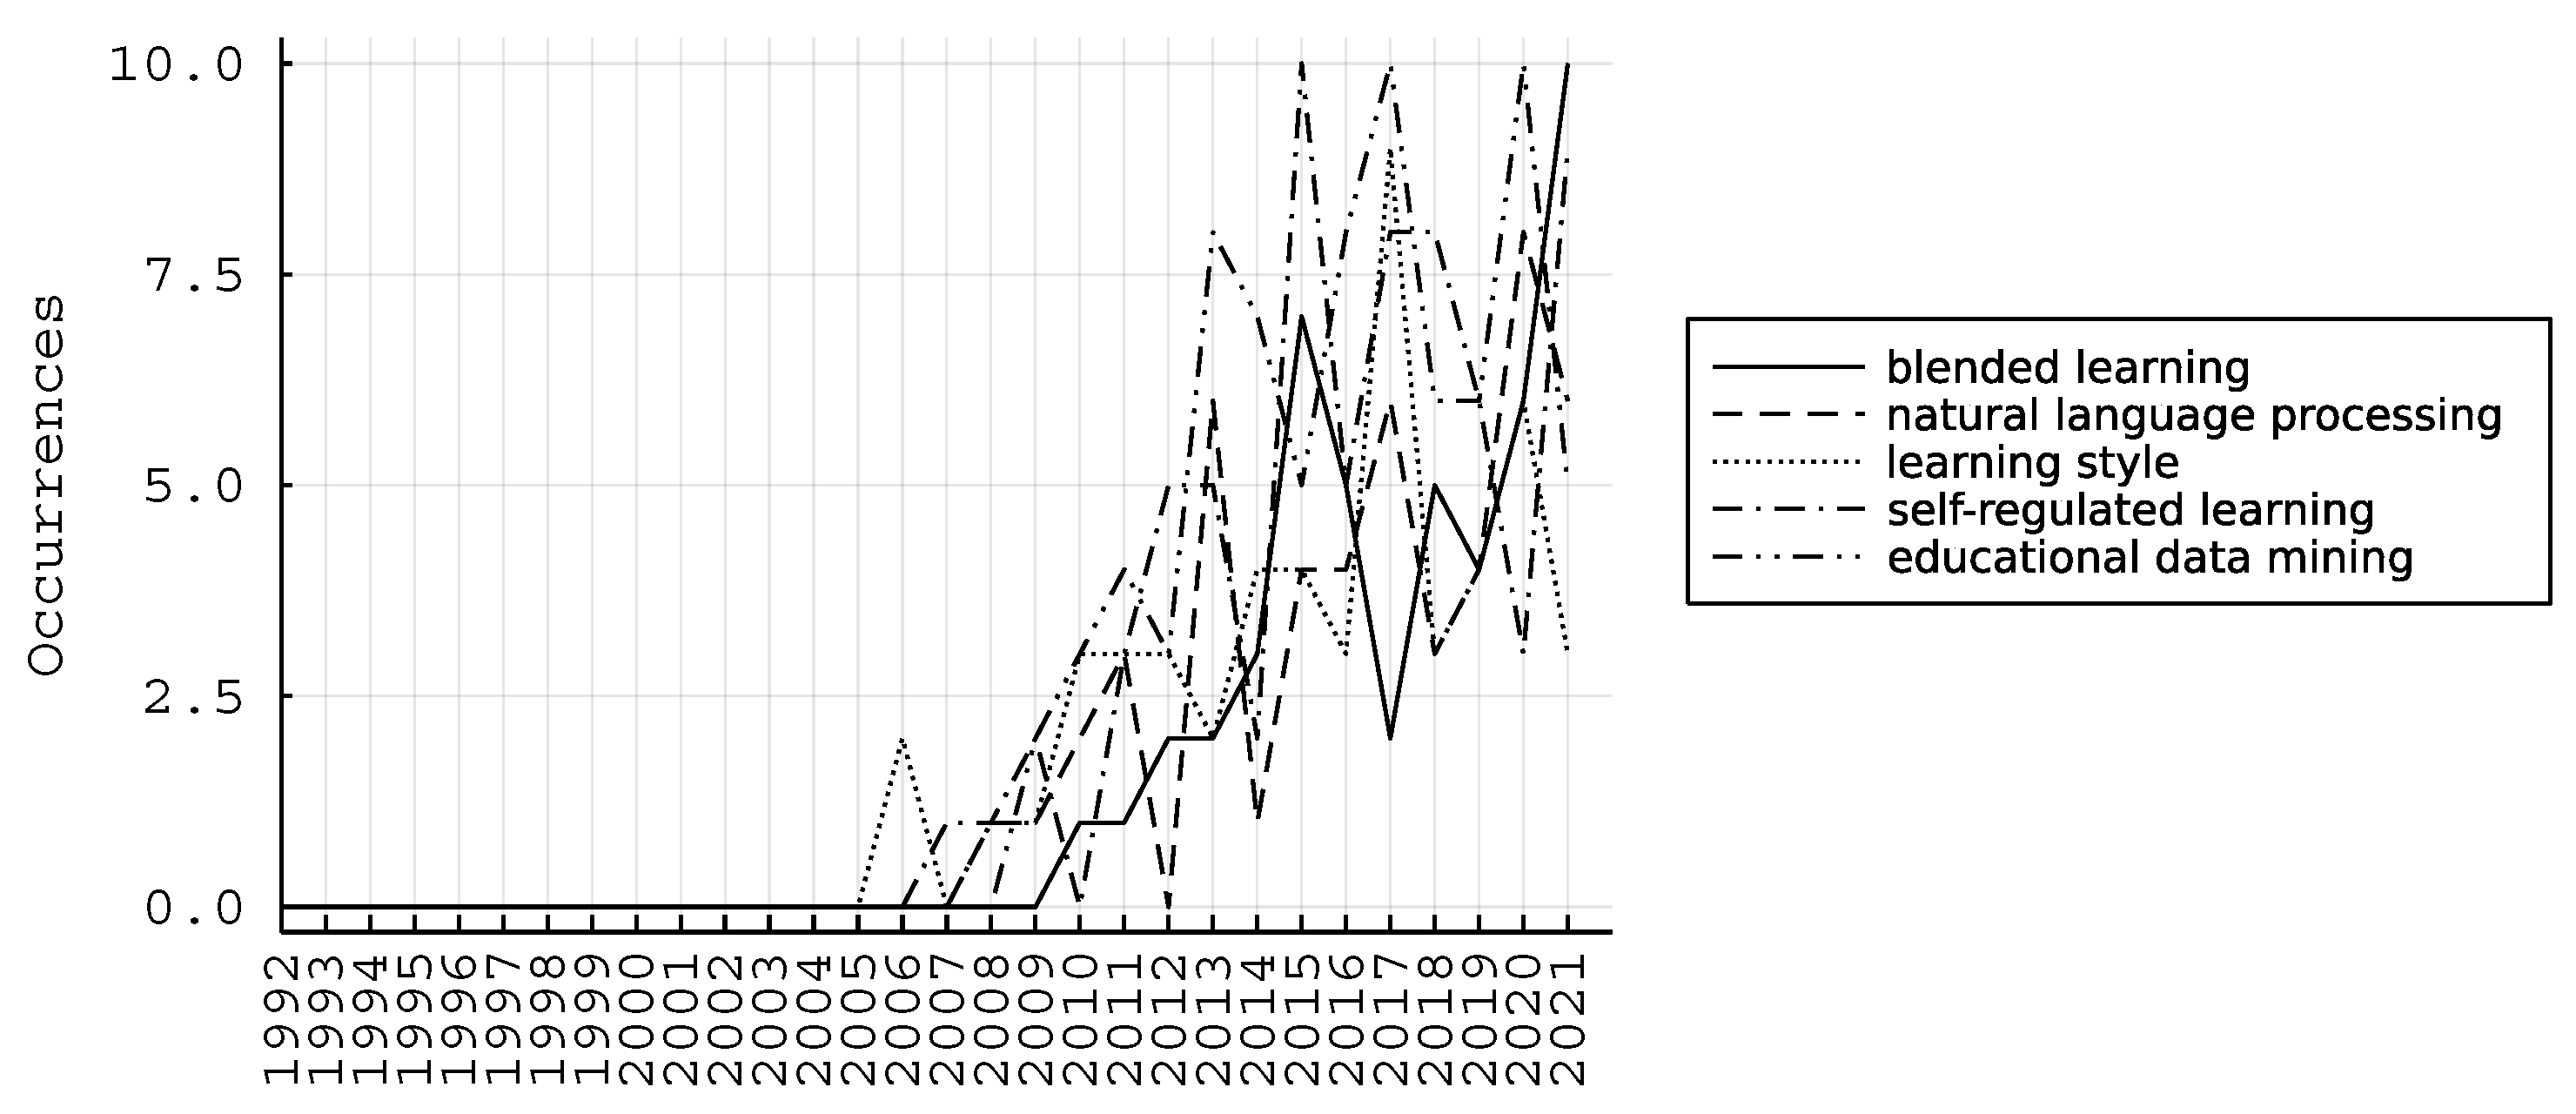
Finally, in Figure 6, we automatically detect the five top nonlinear trends by fitting a second order polynomial in the time-series, and selecting the ones with higher coefficients.
Hence, we identify as emerging trends the following keywords: “blended learning”, “natural language processing”, “learning style”, “self-regulated learning”, and “educational data mining”.
4.3. Map of References
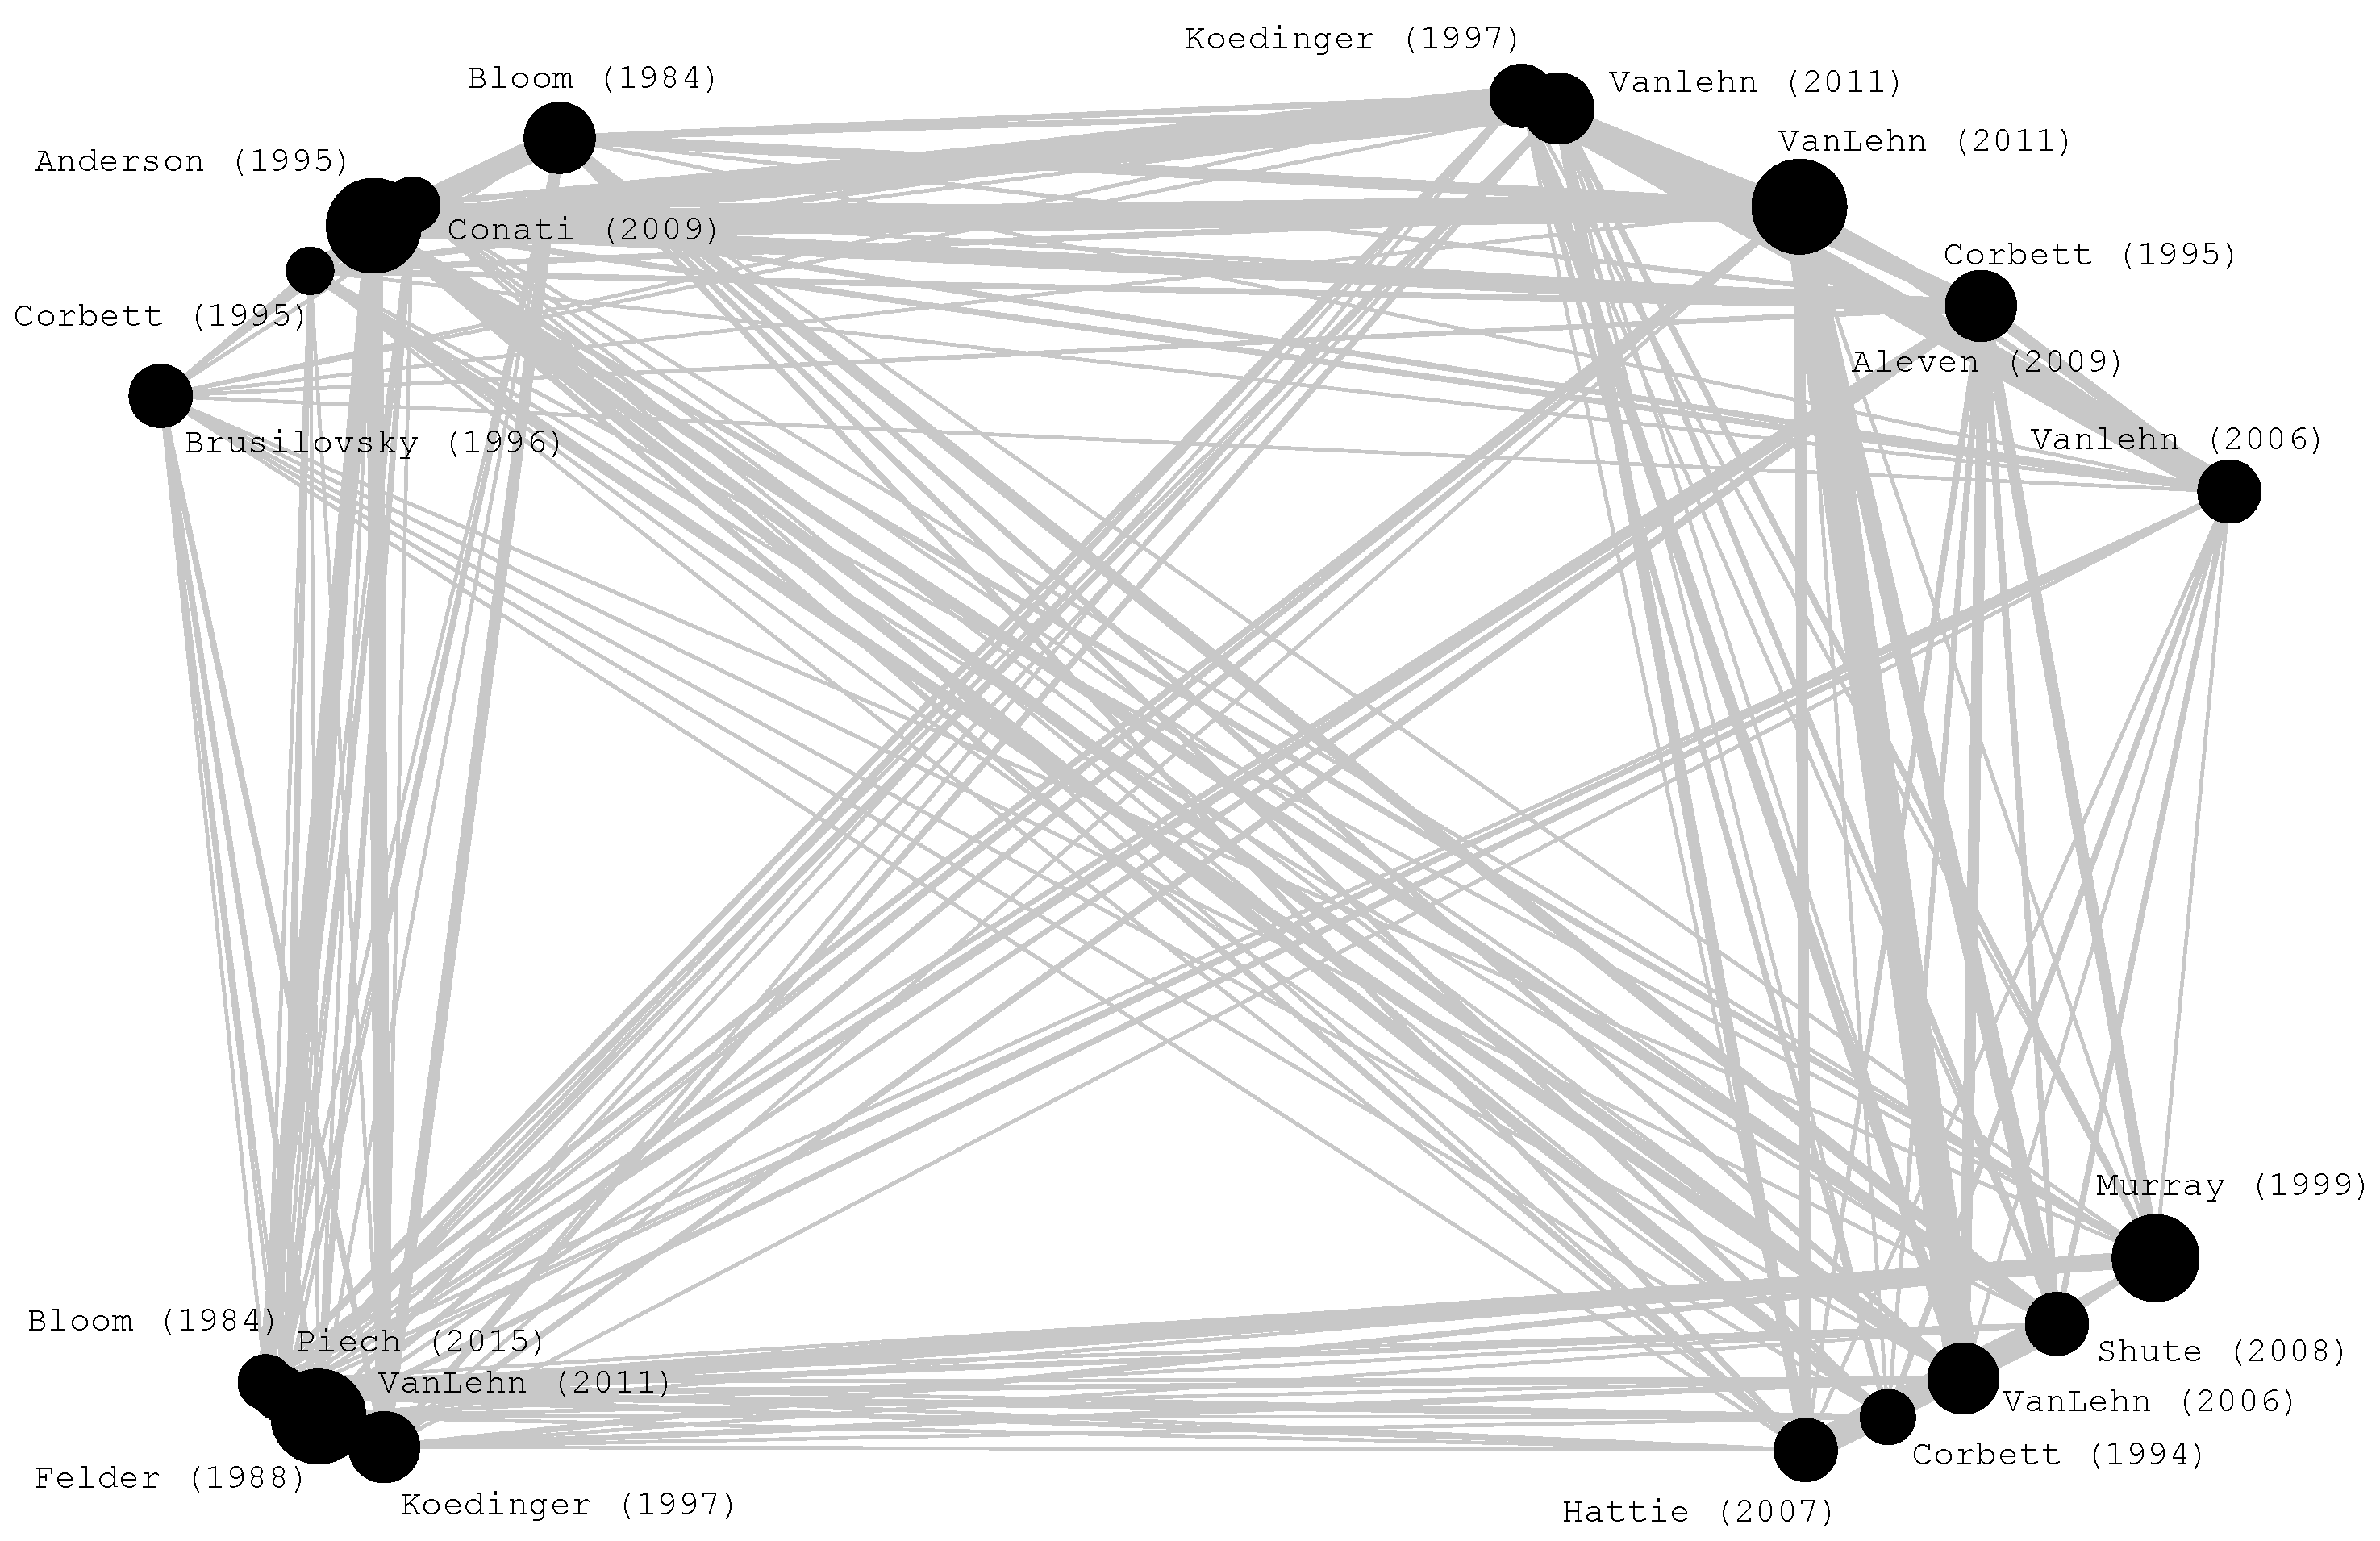
In total, we identified 131,898 references in the studied papers. The top 25 papers cited within the studied database were extracted to create their bibliometric map. Four of them did not appear simultaneously as references; hence 21 were finally kept [29,30,31,32,33,34,35,36,37,38,39,40,41,42] (Figure 7). Accordingly, we observe four distinct clusters of references.
5. Analysis of Top Cited Papers
5.1. Highly Cited Original Research Articles
This section revisits and briefly presents the contribution of the 10 most cited original research articles retrieved using the query described in Section 3. For each manuscript, we attempt to identify how its content and scope relate to the terms listed on the top-keywords map.
The authors in Ref. [43] performed a comparative study between an inverted classroom and the traditional classroom for an introductory statistics course at the same university. The findings of this study demonstrated that students participating in the inverted classroom were less satisfied with the teaching format than students in the traditional classroom were. Yet, they became more open to cooperative learning and innovative teaching methods. Although the inverted classroom is not explicitly referred to in the map, it is however directly related to the term “blended learning” as the inverted classroom is a specific type of blended learning.
Baker et al. [44] examined student nonverbal behaviors such as boredom, frustration, confusion, and engagement during interactions with three computer-based learning environments, including a dialogue tutor and a problem-solving-based intelligent tutoring system. The results showed that boredom in computer learning environments is associated with poorer learning and problem behavior, while frustration was less associated with more inadequate understanding. In this case, we can easily correlate the term intelligent tutoring system with the keyword map as it appears to be the map’s core term.
Another study that refers to the term “intelligent tutoring systems” of the map is the work of VanLehn et al. [45]. Their research reported results from 5 years of using the Andes [45,46] tutoring system in introductory physics courses taught at the U.S. Naval Academy. The authors noted that students who used the Andes for homework got significantly higher exam scores than students in control groups who did paper-and-pencil homework.
In a similar study [47], the researchers used a probabilistic student model with Bayesian networks in the Andes tutoring system to manage uncertainty. This intelligent tutoring system hints at “rules” when it infers that a student has not yet mastered the lesson. Regarding the keyword map, besides the “intelligent tutoring system” term, the term “machine learning” also appears as the authors performed both a machine learning style evaluation and an evaluation with real students of the Andes student model for problem-solving.
In addition, Chen et al. [48] proposed a personalized e-learning system based on IRT (PEL-IRT), which considers both the course material’s difficulty and the learner’s ability to provide individual learning paths for learners. Experimental results show that the proposed system can provide personalized learning and help learners learn more effectively and efficiently. The term “personalized learning”, which is the researchers’ primary goal, can be found among the keywords of the map.
In Ref. [49], the authors present a web-based Adaptive Educational Hypermedia system, called INSPIRE, designed to support web-based personalized instruction and traditional classroom-based teaching as a supplementary resource. The proposed method includes adaptive and adaptable behavior guided by the learner model and characteristics such as knowledge level and learning style. Regarding the keyword map, we can easily recognize the “adaptive learning”, “personalized learning”, “learning styles”, and “student model” terms.
ELM-ART [50] is another adaptive remote tutor system implemented on WWW that combines the features of an electronic textbook, a learning environment, and an intelligent tutoring system, helping students learn to program in Lisp. The system supports the student by applying adaptive hypermedia techniques—adaptive annotation and adaptive link sorting. As before, “intelligent tutoring system”, and “adaptive learning” are among the terms in the keyword map.
In another study, Chen and Chun [51] presented an analysis of a personalized mobile English vocabulary learning system in mobile devices providing appropriate English vocabulary for learning. Results showed that the vocabulary learning system promoted the students’ performance and interest because of the practical and flexible vocabulary learning process. According to most of the learners who participated in the experiments, the proposed system was very helpful in English vocabulary learning. It promoted their learning interests and English vocabulary abilities without time or constraints according to their vocabulary ability and memory cycle. Furthermore, by observing the terms of the keyword map, we can indirectly associate the terms “distance learning” and “learning styles” terms with the paper.
Vrugt et al. [52] introduced a self-adaptive multimethod evolutionary search concept and proposed the multi-algorithm genetically adaptive method (AMALGAM). The AMALGAM-SO merges different optimization methods such as covariance matrix adaptation evolutionary strategy, parental-centric recombination operator, PSO, GA, and DE for population evolution [17]. The optimization methods with the highly productive search were adaptively selected to generate more offspring during the investigation. Experimental results conducted using a set of standard benchmark functions showed that the concept of self-adaptive multimethod optimization improved the robustness and efficiency of the evolutionary search. For this paper, we can see that the term “genetic algorithm” is not explicitly referred to in the map as a keyword but is directly related to the terms “machine learning” and “artificial intelligence”.
Finally, in Ref. [53], researchers proposed a three-interval type-2 fuzzy neural network (IT2FNN) architecture, with hybrid learning algorithm techniques (gradient descent backpropagation and gradient descent with adaptive learning rate backpropagation), for solving the uncertainty of real-life problems. Through the two conducted experiments (i.e., a nonlinear identification problem for control systems simulation and a nonlinear Mackey–Glass chaotic time series prediction problem with uncertainty sources), the efficiency of the IT2FNN algorithm was validated. “Artificial neural networks”, “artificial intelligence”, and “machine learning” terms on the map are directly or indirectly related to Ref. [53].
5.2. Highly Cited Original Research Articles Published in the Last 5 Years
This section continues by presenting the most highly cited articles published in the last five years in order to discuss recent significant advancements.
The authors in Ref. [54] analyzed the implementation of adaptive learning systems in the learning process of higher education according to the scope, type of adaptive learning, functional purpose, integration with existing learning management systems, and application of modern technologies. Researchers support that utilizing the blended learning concept makes it easier to structure an e-learning course and define how it can be adapted. By observing the terms of the keyword map, we can easily recognize the terms “blended learning”, “adaptive learning”, and “higher education”.
Ullah et al. [55] proposed an expanded Technology Acceptance Model for implementing blockchain that could assist decision-makers in building an intelligent learning environment for the educational institutes of the emerging economies. Although no specific terms can be directly identified in the keyword map, the term “adaptive learning” can indirectly be related to the paper.
In addition, in their study, Molenaar et al. [56] investigated the student’s self-regulated learning (i.e., how learners regulate their effort, accuracy, and education) with adaptive learning technology using moment-by-moment learning curves. Their result confirmed that adaptive technology could improve self-regulated learning and increase learning efficiency. In this case, “self-regulated learning”, “adaptive learning”, and “learning analytics” terms can be directly and indirectly associated with the keyword map.
Han et al. [57] used learning analytics to develop two dashboards for students and instructors. This enabled students to monitor their face-to-face collaborative argumentation (FCA) process through adaptive feedback and helped the instructor provide adaptive support at the right time. The paper easily relates to the keyword map’s terms “learning analytics” and “adaptive learning”.
Furthermore, in Ref. [58], researchers conducted an integrative literature review in higher education to identify the most applicable and effective technology models that support personalized learning within blended learning environments. The study highlighted three models:
- Digital badges;
- A learner dashboard as the main feature and adaptive learning technology;
- Competency-based technology that adopts algorithm-based tutoring systems.
The terms “blended learning”, “personalized learning”, and “higher education”, which are the researchers’ focus, also appear in the keyword map.
Shiff [59], in his recent work, assessed the status of artificial intelligence in education (AIEd’s), with a focus on intelligent tutoring systems and anthropomorphized artificial teaching agents. According to the author, the most prominent AIEd characteristics are personalized real-time feedback and adaptive learning. Correlating this paper with the keyword map, one can easily recognize the terms “artificial intelligence”, “adaptive learning”, and “personalized learning”.
In Ref. [60], the prototype for a fully automated gaze-based attention-aware adaptive intelligent tutoring system for classroom use is presented. To do so, Hutt et al. [60] leverage eye trackers and pre-trained machine learning models to detect mind-wandering, using data from high-school students. At the same time, they interacted with educational technology in classrooms. The researchers used this approach to trigger dynamic interventions to reengage attention and improve learning. The paper is, directly and indirectly, related to the terms “educational technology”, “machine learning”, “adaptive learning”, and “artificial intelligence” of the keyword map.
Tabuenca et al., in their work [61], conducted a systematic literature review to investigate an intelligent learning environment (SLE) according to three parameters:
- What affordances make a learning environment smart?
- Which technologies are used in SLEs?
- In what pedagogical contexts are SLEs used?
According to the authors, smart learning can be analyzed as learning “in interactive, intelligent, and tailored environments, supported by advanced digital technologies and services”. Based on this definition, we can easily correlate the paper with the terms “adaptive learning”, “personalized learning”, “interactive learning environments”, and “educational technology”.
Finally, Christopoulos and Sprangers [62] studied the factors affecting the perspective of teachers and students on ICT integration for mathematics teaching during the COVID-19 pandemic. Among the factors examined in their paper are:
- Different contexts (school vs. home) and circumstances (in-person vs. remote learning);
- Demographics;
- Confidence in using technology;
- Perspective on technical usefulness;
- Platform evaluation.
The correlation of Ref. [62] with the terms in the keyword map is achieved through the words “educational technology”, and “distance learning”.
6. Discussion
The analysis of the articles reinforces the conclusions drawn from the study of the co-occurrence of keywords, as discussed in Section 4. Both older and modern literature focuses on adaptive learning and personalized learning methodologies with an emphasis on using artificial intelligence. In recent years, however, particular emphasis has been placed on developing blended and distanced learning systems. This is to be expected, given that the COVID-19 pandemic has forced the education systems to adapt to the new reality globally.
We now find the terms “educational data mining” and “natural language processing” co-occurring in modern literature. The educational data mining process focuses on creating techniques for examining the distinctive, massive amounts of data generated in educational settings and using them to better understand students and the environments in which they learn. Today, the literature offers a large amount of data on student behavior, allowing researchers to conduct in-depth analyses and draw valuable conclusions. In addition, the significant development of artificial intelligence techniques provides researchers with tools for accurate and efficient automated data analysis without requiring special technical knowledge.
It is also important to note that the current literature focuses on self-regulated learning techniques. Self-regulated learning is described as the ability of a learner to understand and control his/her learning environment. The students are asked to define their goals and search for self-learning and self-reinforcement methods. Intelligent tutoring systems are called upon to support the student’s effort, monitor his/her progress, and suggest methods to improve the process.
Observing the technologies used in adaptive learning systems, it is clear that the recent literature focuses on adopting artificial neural networks, leaving behind other artificial intelligence approaches. Thus, the term “intelligent tutoring systems” is being less utilized, and the current research focuses on “personalized” and “adaptive” learning, with the usage of machine learning algorithms. This is, of course, to be expected, given that this technology seems to dominate the field of artificial intelligence. The fact that artificial neural networks are nowadays easy to use plays an important role in shaping effective and efficient adaptive learning systems. Today, many open-source solutions allow their adoption by researchers with minimal technological background. As a result, educational researchers have vital artificial intelligence tools at their disposal without necessarily having to work with computer scientists.
7. Conclusions
The rendering of a bibliometric map, although computationally rigorous, is strongly affected by the researcher’s judgment regarding the grouping of the Bibliometric Object (BO), the selection of the objective function, and the optimization algorithm to solve the problem. In this study, we introduced a novel framework for bibliometric analysis, accompanied by critical insights of the most influential papers. Particularly, this review paper presented the main outcomes of a bibliometric analysis for Adaptive Learning Systems based on 5564 research papers. We discussed the inter-associations of the BOs in the corresponding keywords’ map, along with a narrative analysis of the most cited papers in (a) the entire database and (b) in the last five years. Furthermore, by using time-series analysis, we identified the trends of the top five keywords, the significant associations among them, and emerging trends. By combining this computational procedure and the conceptual analysis, we obtained a documented overview of the literature regarding Adaptive Learning Systems. A limitation of the research work is that although a large number of articles has been used for the generation of the papers’ collection, these papers have been extracted from a single database only. Particularly, we used the Scopus service, which is considered to be one of the major scientific literature databases. Other databases could have been employed for the same, either on their own or in combination with the one used in the study, for example Web of Science, which is a rich and reliable alternative. The idea of enriching the study with additional data taken from other databases is a clear future research direction. In addition, it would be interesting to analyze each one of the specific subcategories identified in Table 2 using bibliometric algorithms in combination with critical analysis.
The vast amount of scientific papers that have been written and are constantly being produced confirm the interest of the academic community in developing more “smart” and “adaptive” digital learning systems. By combining the conclusions obtained from the bibliometric map and the time series of the appearance of the keywords, it was revealed that the research interest shifts from intelligent tutoring systems to adaptive learning systems through the utilization of the emerging technologies of artificial intelligence, learning analytics, and learning styles.
Author Contributions
Conceptualization, D.K., K.K., N.P.B., V.P., A.L. and S.A.C.; Methodology, D.K., V.P. and A.L.; Project administration, D.K. and K.K.; Resources, K.K.; Software, N.P.B.; Visualization, N.P.B.; Writing—original draft, N.P.B., V.P. and S.A.C.; Writing—review & editing, K.K. and A.L. All authors have read and agreed to the published version of the manuscript.
Funding
This research received no external funding.
Data Availability Statement
The data that support the findings of this study are available from the corresponding author, N.P.B., upon reasonable request.
Conflicts of Interest
The authors declare no conflict of interest.
Appendix A. The Most Frequent Keywords
Table A1 presents the 100 most frequent keywords found in the studied database, and their correction, in order of appearance grouped in the bibliometric map and time-series. The NULL identifier groups generic keywords, which were excluded from the analysis.

Table A1.
100 Most frequent keywords and their grouping.
| Initial String | Corrected String | Frequency | Initial String | Corrected String | Frequency |
|---|---|---|---|---|---|
| adaptive learning | adaptive learning | 1697 | feedback | NULL | 83 |
| intelligent tutoring systems | intelligent tutoring system | 1518 | web 2.0 | NULL | 83 |
| intelligent tutoring system | intelligent tutoring system | 865 | adaptivity | adaptive learning | 81 |
| personalized learning | personalized learning | 673 | distance learning | NULL | 81 |
| e-learning | NULL | 665 | knowledge tracing | knowledge management | 81 |
| machine learning | machine learning | 282 | learner model | learner model | 80 |
| learning | NULL | 279 | genetic algorithm | genetic algorithm | 78 |
| learning analytics | learning analytics | 241 | intelligent tutoring | intelligent tutoring system | 78 |
| neural network | artificial neural networks | 240 | adaptive learning systems | adaptive learning | 75 |
| artificial intelligence | artificial intelligence | 236 | learning management system | learning management system | 71 |
| personalization | personalized learning | 232 | learning objects | learning objects | 71 |
| neural networks | artificial neural networks | 217 | lifelong learning | NULL | 71 |
| ontology | ontologies | 208 | smart learning | intelligent tutoring system | 70 |
| personal learning environment | personalized learning | 206 | smart learning environments | intelligent tutoring system | 70 |
| mobile learning | NULL | 193 | affect | NULL | 69 |
| personal learning environments | personalized learning | 171 | artificial neural networks | artificial neural networks | 69 |
| online learning | NULL | 169 | problem solving | NULL | 68 |
| adaptive learning rate | adaptive learning | 167 | serious games | NULL | 68 |
| deep learning | artificial neural networks | 167 | adaptive | adaptive learning | 67 |
| education | NULL | 163 | e-learning | NULL | 67 |
| self-regulated learning | self-regulated learning | 163 | instructional design | NULL | 66 |
| reinforcement learning | reinforcement learning | 158 | ontologies | ontologies | 65 |
| collaborative learning | NULL | 155 | recommender systems | recommender systems | 65 |
| learning style | learning style | 148 | virtual reality | NULL | 65 |
| data mining | data mining | 145 | game-based learning | NULL | 64 |
| higher education | NULL | 145 | metacognition | metacognition | 64 |
| educational data mining | data mining | 141 | mooc | NULL | 64 |
| learning styles | learning style | 141 | Bayesian networks | Bayesian networks | 61 |
| student modeling | student modeling | 132 | adaptive hypermedia | adaptive learning | 60 |
| adaptation | adaptive learning | 130 | item response theory | item response theory | 59 |
| its | intelligent tutoring system | 117 | knowledge representation | knowledge management | 59 |
| artificial neural network | artificial neural networks | 108 | clustering | clustering | 58 |
| interactive learning environments | intelligent tutoring system | 106 | user modeling | user modeling | 58 |
| semantic web | NULL | 106 | cloud computing | NULL | 57 |
| adaptive control | adaptive learning | 105 | knowledge management | knowledge management | 57 |
| motivation | motivation | 102 | personalised learning | personalized learning | 57 |
| adaptive learning system | adaptive learning | 100 | bp neural network | artificial neural networks | 55 |
| student model | student modeling | 100 | simulation | NULL | 55 |
| affective computing | NULL | 99 | lms | learning management system | 54 |
| natural language processing | natural language processing | 96 | ubiquitous learning | NULL | 54 |
| evaluation | NULL | 95 | collaboration | NULL | 53 |
| assessment | NULL | 94 | moocs | NULL | 53 |
| blended learning | NULL | 93 | concept drift | concept drift | 52 |
| big data | data mining | 89 | intelligent tutoring system (its) | intelligent tutoring system | 52 |
| ple | personalized learning | 89 | m-learning | NULL | 52 |
| gamification | NULL | 86 | prediction | NULL | 52 |
| smart learning environment | intelligent tutoring system | 85 | augmented reality | NULL | 51 |
| classification | classification | 84 | adaptive e-learning | adaptive learning | 50 |
| fuzzy logic | NULL | 84 | collaborative filtering | recommender systems | 50 |
| educational technology | NULL | 83 | engagement | NULL | 50 |
References
- Koutsantonis, D.; Panayiotopoulos, J.C. Expert system personalized knowledge retrieval. Oper. Res. 2011, 11, 215–227. [Google Scholar] [CrossRef]
- Mastorodimos, D.; Chatzichristofis, S.A. Studying Affective Tutoring Systems for Mathematical Concepts. J. Educ. Technol. Syst. 2019, 48, 14–50. [Google Scholar] [CrossRef]
- Dima, A.; Bugheanu, A.M.; Dinulescu, R.; Potcovaru, A.M.; Stefanescu, C.A.; Marin, I. Exploring the Research Regarding Frugal Innovation and Business Sustainability through Bibliometric Analysis. Sustainability 2022, 14, 1326. [Google Scholar] [CrossRef]
- Popescu, D.V.; Dima, A.; Radu, E.; Dobrotă, E.M.; Dumitrache, V.M. Bibliometric Analysis of the Green Deal Policies in the Food Chain. Amfiteatru Econ. 2022, 24, 410–428. [Google Scholar] [CrossRef]
- Plevris, V.; Solorzano, G.; Bakas, N. Literature review of historical masonry structures with machine learning. In Proceedings of the 7th ECCOMAS Thematic Conference on Computational Methods in Structural Dynamics and Earthquake Engineering, Crete, Greece, 24–26 June 2019; ECCOMAS: Crete, Greece, 2019; pp. 1547–1562. [Google Scholar]
- Plevris, V.; Bakas, N.; Markeset, G.; Bellos, J. Literature review of masonry structures under earthquake excitation utilizing machine learning algorithms. In Proceedings of the 6th ECCOMAS Thematic Conference on Computational Methods in Structural Dynamics and Earthquake Engineering, Rhodes Island, Greece, 15–17 June 2017; ECCOMAS: Rhodes Island, Greece, 2017; pp. 2685–2694. [Google Scholar]
- Papadaki, M.; Bakas, N.; Ochieng, E.; Karamitsos, I.; Kirkham, R. Big data from social media and scientific literature databases reveals relationships among risk management, project management and project success. PM World J. 2019, 8. [Google Scholar] [CrossRef] [Green Version]
- Dimopoulos, T.; Bakas, N. An artificial intelligence algorithm analyzing 30 years of research in mass appraisals. RELAND Int. J. Real Estate Land Plan. 2019, 2, 10–27. [Google Scholar]
- Kruskal, J.B. Multidimensional scaling by optimizing goodness of fit to a nonmetric hypothesis. Psychometrika 1964, 29, 1–27. [Google Scholar] [CrossRef]
- Moré, J.J. The Levenberg-Marquardt algorithm: Implementation and theory. In Numerical Analysis; Springer: Berlin, Germany, 1978; pp. 105–116. [Google Scholar]
- Shepard, R.N. The analysis of proximities: Multidimensional scaling with an unknown distance function. I. Psychometrika 1962, 27, 125–140. [Google Scholar] [CrossRef]
- van Eck, N.; Waltman, L. Software survey: VOSviewer, a computer program for bibliometric mapping. Scientometrics 2009, 84, 523–538. [Google Scholar] [CrossRef] [PubMed] [Green Version]
- Srivastava, N.; Hinton, G.; Krizhevsky, A.; Sutskever, I.; Salakhutdinov, R. Dropout: A simple way to prevent neural networks from overfitting. J. Mach. Learn. Res. 2014, 15, 1929–1958. [Google Scholar]
- Conn, A.R.; Gould, N.I.; Toint, P. A globally convergent augmented Lagrangian algorithm for optimization with general constraints and simple bounds. SIAM J. Numer. Anal. 1991, 28, 545–572. [Google Scholar] [CrossRef] [Green Version]
- Audet, C.; Dennis, J.E., Jr. Analysis of generalized pattern searches. SIAM J. Optim. 2002, 13, 889–903. [Google Scholar] [CrossRef]
- Shi, Y.; Eberhart, R. A modified particle swarm optimizer. In Proceedings of the 1998 IEEE International Conference on Evolutionary Computation Proceedings. IEEE World Congress on Computational Intelligence, Anchorage, AK, USA, 4–9 May 1998; IEEE: Piscataway, NJ, USA, 1998; pp. 69–73. [Google Scholar]
- Plevris, V. Innovative Computational Techniques for the Optimum Structural Design Considering Uncertainties. Ph.D. Thesis, National Technical University of Athens, Athens, Greece, 2009. [Google Scholar]
- Moayyeri, N.; Gharehbaghi, S.; Plevris, V. Cost-Based Optimum Design of Reinforced Concrete Retaining Walls Considering Different Methods of Bearing Capacity Computation. Mathematics 2019, 7, 1232. [Google Scholar] [CrossRef] [Green Version]
- Byrd, R.H.; Gilbert, J.C.; Nocedal, J. A trust region method based on interior point techniques for nonlinear programming. Math. Program. 2000, 89, 149–185. [Google Scholar] [CrossRef] [Green Version]
- Ugray, Z.; Lasdon, L.; Plummer, J.; Glover, F.; Kelly, J.; Martí, R. Scatter search and local NLP solvers: A multistart framework for global optimization. INFORMS J. Comput. 2007, 19, 328–340. [Google Scholar] [CrossRef]
- Levenberg, K. A method for the solution of certain non-linear problems in least squares. Q. Appl. Math. 1944, 2, 164–168. [Google Scholar] [CrossRef] [Green Version]
- Marquardt, D.W. An algorithm for least-squares estimation of nonlinear parameters. J. Soc. Ind. Appl. Math. 1963, 11, 431–441. [Google Scholar] [CrossRef]
- Bakas, N.P.; Plevris, V.; Langousis, A.; Chatzichristofis, S.A. ITSO: A novel inverse transform sampling-based optimization algorithm for stochastic search. Stoch. Environ. Res. Risk Assess. 2022, 36, 67–76. [Google Scholar] [CrossRef]
- Plevris, V.; Bakas, N.P.; Solorzano, G. Pure Random Orthogonal Search (PROS): A Plain and Elegant Parameterless Algorithm for Global Optimization. Appl. Sci. 2021, 11, 5053. [Google Scholar] [CrossRef]
- Pranckutė, R. Web of Science (WoS) and Scopus: The titans of bibliographic information in today’s academic world. Publications 2021, 9, 12. [Google Scholar] [CrossRef]
- Scopus Database. Available online: https://www.scopus.com/search/ (accessed on 17 March 2022).
- Liu, W.H.; Sherman, A.H. Comparative analysis of the Cuthill–McKee and the reverse Cuthill–McKee ordering algorithms for sparse matrices. SIAM J. Numer. Anal. 1976, 13, 198–213. [Google Scholar] [CrossRef]
- Gates, R.L. CuthillMcKee.jl. Available online: https://github.com/rleegates/CuthillMcKee.jl (accessed on 17 March 2022).
- Anderson, J.R.; Corbett, A.T.; Koedinger, K.R.; Pelletier, R. Cognitive tutors: Lessons learned. J. Learn. Sci. 1995, 4, 167–207. [Google Scholar] [CrossRef]
- VanLehn, K. The relative effectiveness of human tutoring, intelligent tutoring systems, and other tutoring systems. Educ. Psychol. 2011, 46, 197–221. [Google Scholar] [CrossRef]
- Felder, R.M.; Silverman, L.K. Learning and teaching styles in engineering education. Eng. Educ. 1988, 78, 674–681. [Google Scholar]
- Murray, T. Authoring intelligent tutoring systems: An analysis of the state of the art. Int. J. Artif. Intell. Educ. (IJAIED) 1999, 10, 98–129. [Google Scholar]
- Koedinger, K.R.; Anderson, J.R.; Hadley, W.H.; Mark, M.A. Intelligent tutoring goes to school in the big city. Int. J. Artif. Intell. Educ. 1997, 8, 30–43. [Google Scholar]
- Bloom, B.S. The 2 sigma problem: The search for methods of group instruction as effective as one-to-one tutoring. Educ. Res. 1984, 13, 4–16. [Google Scholar] [CrossRef]
- VanLehn, K. The behavior of tutoring systems. Int. J. Artif. Intell. Educ. 2006, 16, 227–265. [Google Scholar]
- Corbett, A.T.; Anderson, J.R. Knowledge tracing: Modeling the acquisition of procedural knowledge. User Model. -User-Adapt. Interact. 1994, 4, 253–278. [Google Scholar] [CrossRef]
- Brusilovsky, P. Methods and Techniques of Adaptive Hypermedia. In Learner Modeling and Learner-Adapted Interaction; Springer: Dordrecht, The Netherlands, 1996; Volume 6. [Google Scholar]
- Hattie, J.; Timperley, H. The power of feedback. Rev. Educ. Res. 2007, 77, 81–112. [Google Scholar] [CrossRef] [Green Version]
- Shute, V.J. Focus on formative feedback. Rev. Educ. Res. 2008, 78, 153–189. [Google Scholar] [CrossRef]
- Aleven, V.; Mclaren, B.M.; Sewall, J.; Koedinger, K.R. A new paradigm for intelligent tutoring systems: Example-tracing tutors. Int. J. Artif. Intell. Educ. 2009, 19, 105–154. [Google Scholar]
- Conati, C.; Maclaren, H. Empirically building and evaluating a probabilistic model of user affect. User Model. -User-Adapt. Interact. 2009, 19, 267–303. [Google Scholar] [CrossRef]
- Piech, C.; Bassen, J.; Huang, J.; Ganguli, S.; Sahami, M.; Guibas, L.J.; Sohl-Dickstein, J. Deep knowledge tracing. In Proceedings of the Advances in Neural Information Processing Systems, Montreal, QC, Canads, 7–12 December 2015; Volume 28. [Google Scholar]
- Strayer, J.F. How learning in an inverted classroom influences cooperation, innovation and task orientation. Learn. Environ. Res. 2012, 15, 171–193. [Google Scholar] [CrossRef]
- Baker, R.S.; D’Mello, S.K.; Rodrigo, M.M.T.; Graesser, A.C. Better to be frustrated than bored: The incidence, persistence, and impact of learners’ cognitive–affective states during interactions with three different computer-based learning environments. Int. J. Hum.-Comput. Stud. 2010, 68, 223–241. [Google Scholar] [CrossRef] [Green Version]
- VanLehn, K.; Lynch, C.; Schulze, K.; Shapiro, J.A.; Shelby, R.; Taylor, L.; Treacy, D.; Weinstein, A.; Wintersgill, M. The Andes physics tutoring system: Lessons learned. Int. J. Artif. Intell. Educ. 2005, 15, 147–204. [Google Scholar]
- Schulze, K.G.; Shelby, R.N.; Treacy, D.J.; Wintersgill, M.C.; Vanlehn, K.; Gertner, A. Andes: An intelligent tutor for classical physics. J. Electron. Publ. 2000, 6. [Google Scholar] [CrossRef]
- Conati, C.; Gertner, A.; Vanlehn, K. Using Bayesian networks to manage uncertainty in student modeling. User Model. User-Adapt. Interact. 2002, 12, 371–417. [Google Scholar] [CrossRef]
- Chen, C.M.; Lee, H.M.; Chen, Y.H. Personalized e-learning system using item response theory. Comput. Educ. 2005, 44, 237–255. [Google Scholar] [CrossRef]
- Papanikolaou, K.A.; Grigoriadou, M.; Kornilakis, H.; Magoulas, G.D. Personalizing the Interaction in a Web-based Educational Hypermedia System: The case of INSPIRE. User Model. User-Adapt. Interact. 2003, 13, 213–267. [Google Scholar] [CrossRef]
- Brusilovsky, P.; Schwarz, E.; Weber, G. ELM-ART: An intelligent tutoring system on World Wide Web. In Proceedings of the International Conference on Intelligent Tutoring Systems, Montréal, Canada, 12–14 June 1996; Springer: Berlin, Germany, 1996; pp. 261–269. [Google Scholar]
- Chen, C.M.; Chung, C.J. Personalized mobile English vocabulary learning system based on item response theory and learning memory cycle. Comput. Educ. 2008, 51, 624–645. [Google Scholar] [CrossRef]
- Vrugt, J.A.; Robinson, B.A.; Hyman, J.M. Self-adaptive multimethod search for global optimization in real-parameter spaces. IEEE Trans. Evol. Comput. 2008, 13, 243–259. [Google Scholar] [CrossRef]
- Castro, J.R.; Castillo, O.; Melin, P.; Rodríguez-Díaz, A. A hybrid learning algorithm for a class of interval type-2 fuzzy neural networks. Inf. Sci. 2009, 179, 2175–2193. [Google Scholar] [CrossRef]
- Morze, N.; Varchenko-Trotsenko, L.; Terletska, T.; Smyrnova-Trybulska, E. Implementation of adaptive learning at higher education institutions by means of Moodle LMS. J. Physics Conf. Ser. 2021, 1840-1, 012062. [Google Scholar] [CrossRef]
- Ullah, N.; Mugahed Al-Rahmi, W.; Alzahrani, A.I.; Alfarraj, O.; Alblehai, F.M. Blockchain technology adoption in smart learning environments. Sustainability 2021, 13, 1801. [Google Scholar] [CrossRef]
- Molenaar, I.; Horvers, A.; Baker, R.S. What can moment-by-moment learning curves tell about students’ self-regulated learning? Learn. Instr. 2021, 72, 101206. [Google Scholar] [CrossRef]
- Han, J.; Kim, K.H.; Rhee, W.; Cho, Y.H. Learning analytics dashboards for adaptive support in face-to-face collaborative argumentation. Comput. Educ. 2021, 163, 104041. [Google Scholar] [CrossRef]
- Alamri, H.A.; Watson, S.; Watson, W. Learning technology models that support personalization within blended learning environments in higher education. TechTrends 2021, 65, 62–78. [Google Scholar] [CrossRef]
- Schiff, D. Out of the laboratory and into the classroom: The future of artificial intelligence in education. AI Soc. 2021, 36, 331–348. [Google Scholar] [CrossRef]
- Hutt, S.; Krasich, K.R.; Brockmole, J.; D’Mello, S.K. Breaking out of the lab: Mitigating mind wandering with gaze-based attention-aware technology in classrooms. In Proceedings of the 2021 CHI Conference on Human Factors in Computing Systems, Yokohama, Japan, 8–13 May 2021; pp. 1–14. [Google Scholar]
- Tabuenca, B.; Serrano-Iglesias, S.; Carruana-Martin, A.; Villa-Torrano, C.; Dimitriadis, Y.A.; Asensio-Perez, J.I.; Alario-Hoyos, C.; Gomez-Sanchez, E.; Bote-Lorenzo, M.L.; Martinez-Mones, A.; et al. Affordances and core functions of smart learning environments: A systematic literature review. IEEE Trans. Learn. Technol. 2021, 14, 129–145. [Google Scholar] [CrossRef]
- Christopoulos, A.; Sprangers, P. Integration of educational technology during the Covid-19 pandemic: An analysis of teacher and student receptions. Cogent Educ. 2021, 8, 1964690. [Google Scholar] [CrossRef]
Figure 1.
Association map of top 28 keywords, for adaptive learning database, after their grouping.

Figure 2.
Rearrangement of the contingency matrix using the CuthillMcKee method.

Figure 3.
Time series of the evolution of the top keywords.

Figure 4.
Computational identification of correlation among “learning styles”, “assessment”, and “artificial neural networks” timeseries.
Figure 4.
Computational identification of correlation among “learning styles”, “assessment”, and “artificial neural networks” timeseries.

Figure 5.
Similar evolution of “educational data mining” and “natural language processing” time series.
Figure 5.
Similar evolution of “educational data mining” and “natural language processing” time series.

Figure 6.
Time series of maximum nonlinear trends.


Table 1.
Search query in Scopus.
| Adaptive Educational Hypermedia System | OR | Adaptive Educational System | OR |
| adaptive learning | OR | advanced learning technologies | OR |
| intelligent learning platforms | OR | intelligent tutoring systems | OR |
| AI-based learning systems | OR | personal learning environments | OR |
| personalized learning | OR | smart learning environments | OR |
| tutor-based expert systems | OR | web-based adaptive educational applications | |
| AND | |||
| education OR lesson | in | Title OR Keywords |
Table 2.
Sub-categories of adaptive learning systems research.
| Artificial Intelligence | Adaptive Learning | Personalized Learning | Higher Education |
|---|---|---|---|
| self-regulated learning | ontologies | interactive learning environments | natural language processing |
| affective computing | assessment | data mining | blended learning |
| machine learning | learning analytics | ||
| distance learning | educational technology | ||
| student modeling | learning styles | ||
| motivation |
Publisher’s Note: MDPI stays neutral with regard to jurisdictional claims in published maps and institutional affiliations. |
© 2022 by the authors. Licensee MDPI, Basel, Switzerland. This article is an open access article distributed under the terms and conditions of the Creative Commons Attribution (CC BY) license (https://creativecommons.org/licenses/by/4.0/).
Share and Cite
MDPI and ACS Style
Koutsantonis, D.; Koutsantonis, K.; Bakas, N.P.; Plevris, V.; Langousis, A.; Chatzichristofis, S.A. Bibliometric Literature Review of Adaptive Learning Systems. Sustainability 2022, 14, 12684. https://doi.org/10.3390/su141912684
AMA Style
Koutsantonis D, Koutsantonis K, Bakas NP, Plevris V, Langousis A, Chatzichristofis SA. Bibliometric Literature Review of Adaptive Learning Systems. Sustainability. 2022; 14(19):12684. https://doi.org/10.3390/su141912684
Chicago/Turabian StyleKoutsantonis, Dionisios, Konstantinos Koutsantonis, Nikolaos P. Bakas, Vagelis Plevris, Andreas Langousis, and Savvas A. Chatzichristofis. 2022. "Bibliometric Literature Review of Adaptive Learning Systems" Sustainability 14, no. 19: 12684. https://doi.org/10.3390/su141912684
Note that from the first issue of 2016, this journal uses article numbers instead of page numbers. See further details here.