
Natural Ageing of PLA Filaments, Can It Be Frozen?


1
Centro de Investigación en Materiales Estructurales (CIME), Universidad Politécnica de Madrid, 28040 Madrid, Spain
2
Instituto de Cerámica y Vidrio (CSIC), Campus de Cantoblanco, 28049 Madrid, Spain
*
Author to whom correspondence should be addressed.
Polymers 2022, 14(16), 3361; https://doi.org/10.3390/polym14163361
Submission received: 25 May 2022
/
Revised: 8 July 2022
/
Accepted: 2 August 2022
/
Published: 17 August 2022
(This article belongs to the Special Issue Advances in the Mechanical Behavior of Polymeric Materials)
Abstract
:The physical ageing of polylactic acid (PLA) is a phenomenon that changes the material’s properties over time. This ageing process is highly dependent on ambient variables, such as temperature and humidity. For PLA, the ageing is noticeable even at room temperatures, a process commonly referred to as natural ageing. Stopping the ageing by freezing the material can be helpful to preserve the properties of the PLA and stabilise it at any time during its storage until it is required for testing. However, it is essential to demonstrate that the PLA’s mechanical properties are not degraded after defrosting the samples. Four different methods for stopping the ageing (anti-ageing processes) are analysed in this paper—all based on freezing and defrosting the PLA samples. We determine the temperature and ambient water vapor influence during the freezing and defrosting process using desiccant and zip bags. The material form selected is PLA filaments (no bulk material or scaffold structures) printed at 190 °C with diameters between 400 and 550 µm and frozen at −24 °C in the presence or absence of a desiccant. The impact of the anti-ageing processes on PLA’s ageing and mechanical integrity is studied regarding the thermal, mechanical and fractographical properties. In conclusion, an anti-ageing process is defined to successfully stop the natural ageing of the PLA for an indefinite length of time. This process does not affect the mechanical properties or the structural integrity of the PLA. As a result, large quantities of this material can be produced in a single batch and be safely stored to be later characterised under the same manufacturing and ageing conditions, which is currently a limiting factor from an experimental point of view as polymeric filament properties can show significant variety from batch to batch.
1. Introduction
PLA is the most common polymeric material found in the additive manufacturing industry, and it is printed via the material thermal extrusion process or material extrusion [1,2,3,4,5]. This material extrusion process consists of three main parts: melting, extrusion and cooling. The melting process liquefies the PLA and consequently removes any previous thermal history (however, thermal degradation might occur at this stage) [6]; the extrusion process generates filaments with the desired shape as the material flows through the nozzle; and finally, the cooling process solidifies the share of the extruded filament.
This last part generates an out-of-equilibrium microstructure inside the PLA, as the polymer chains of the amorphous phase are frozen in non-equilibrium positions with high enthalpy values compared with its stable state [7,8,9,10]. This excess of enthalpy is lost through ageing as the polymeric chains find lower energy configurations due to the thermal motions and can be assessed with increased enthalpic relaxation in differential scanning calorimetry.
Several ageing mechanisms are described in the bibliography, such as hydrolysis [11,12,13,14,15] or photodegradation [16,17,18,19] among other mechanisms [20]. However, the one related to the evolution of the non-equilibrium state after cooling is the physical or natural ageing, a type of ageing that occurs due to the macromolecular movements of the polymeric chains into more stable configurations employing the thermal energy available in the material at temperatures below the glass transition (Tg) [21,22,23]. Slowly after the cooling process, these polymeric chains rearrange into more stable configurations, which changes the material’s properties, such as the glass transition (Tg), the yield strength or the enthalpic relaxation [24]. This ageing process happens at temperatures below Tg but faster when the temperature is closer to Tg [25,26].
As is well known and from our previous experience [24], Tg for the PLA is between 50 to 63 °C, which are temperatures relatively close to room temperature, making it even more important to understand the ageing of the PLA and how to stop it when needed. The rearrangement of these polymer chains at the molecular level is the mechanism for physical ageing [27], and it is desired to stop these polymeric chain movements. Thus, the PLA was frozen, decreasing the thermal energy available in the system.
One of the PLA ageing mechanisms is hydrolysis, making the PLA’s ageing highly susceptible to ambient humidity. For this reason, we studied the influence of adding a desiccant in different steps during the anti-ageing process. Although the temperatures in this work are below 50 °C and were performed in dry weather (which allows us to neglect the influence of the humidity moisture on the ageing due to hydrolysis [28]), we want to analyse the effect of humidity on the mechanical properties of the PLA during freezing to stop the ageing process.
Our research aims to study the mechanical behavior of the PLA as it is intended to be used for medical prostheses, and it will be helpful to store the PLA and stop the ageing so that we can adapt the research schedule to external factors, such as COVID-19, without having to restart all the experiments. The value and evolution of the enthalpic relaxation usually indicate how aged the polymer is, which can be easily quantified by differential scanning calorimetry (DSC) [28,29].
The DSC provides plenty of information regarding the material’s thermal properties. However, at the same time, it also includes information on the physical properties, such as the residual monomer after a polymerisation curing reaction [30], the crystallisation or the ageing of the material. For our research, it is critical to demonstrate that the mechanical properties are not affected by these freezing–defrosting anti-ageing processes.
2. Materials and Methods
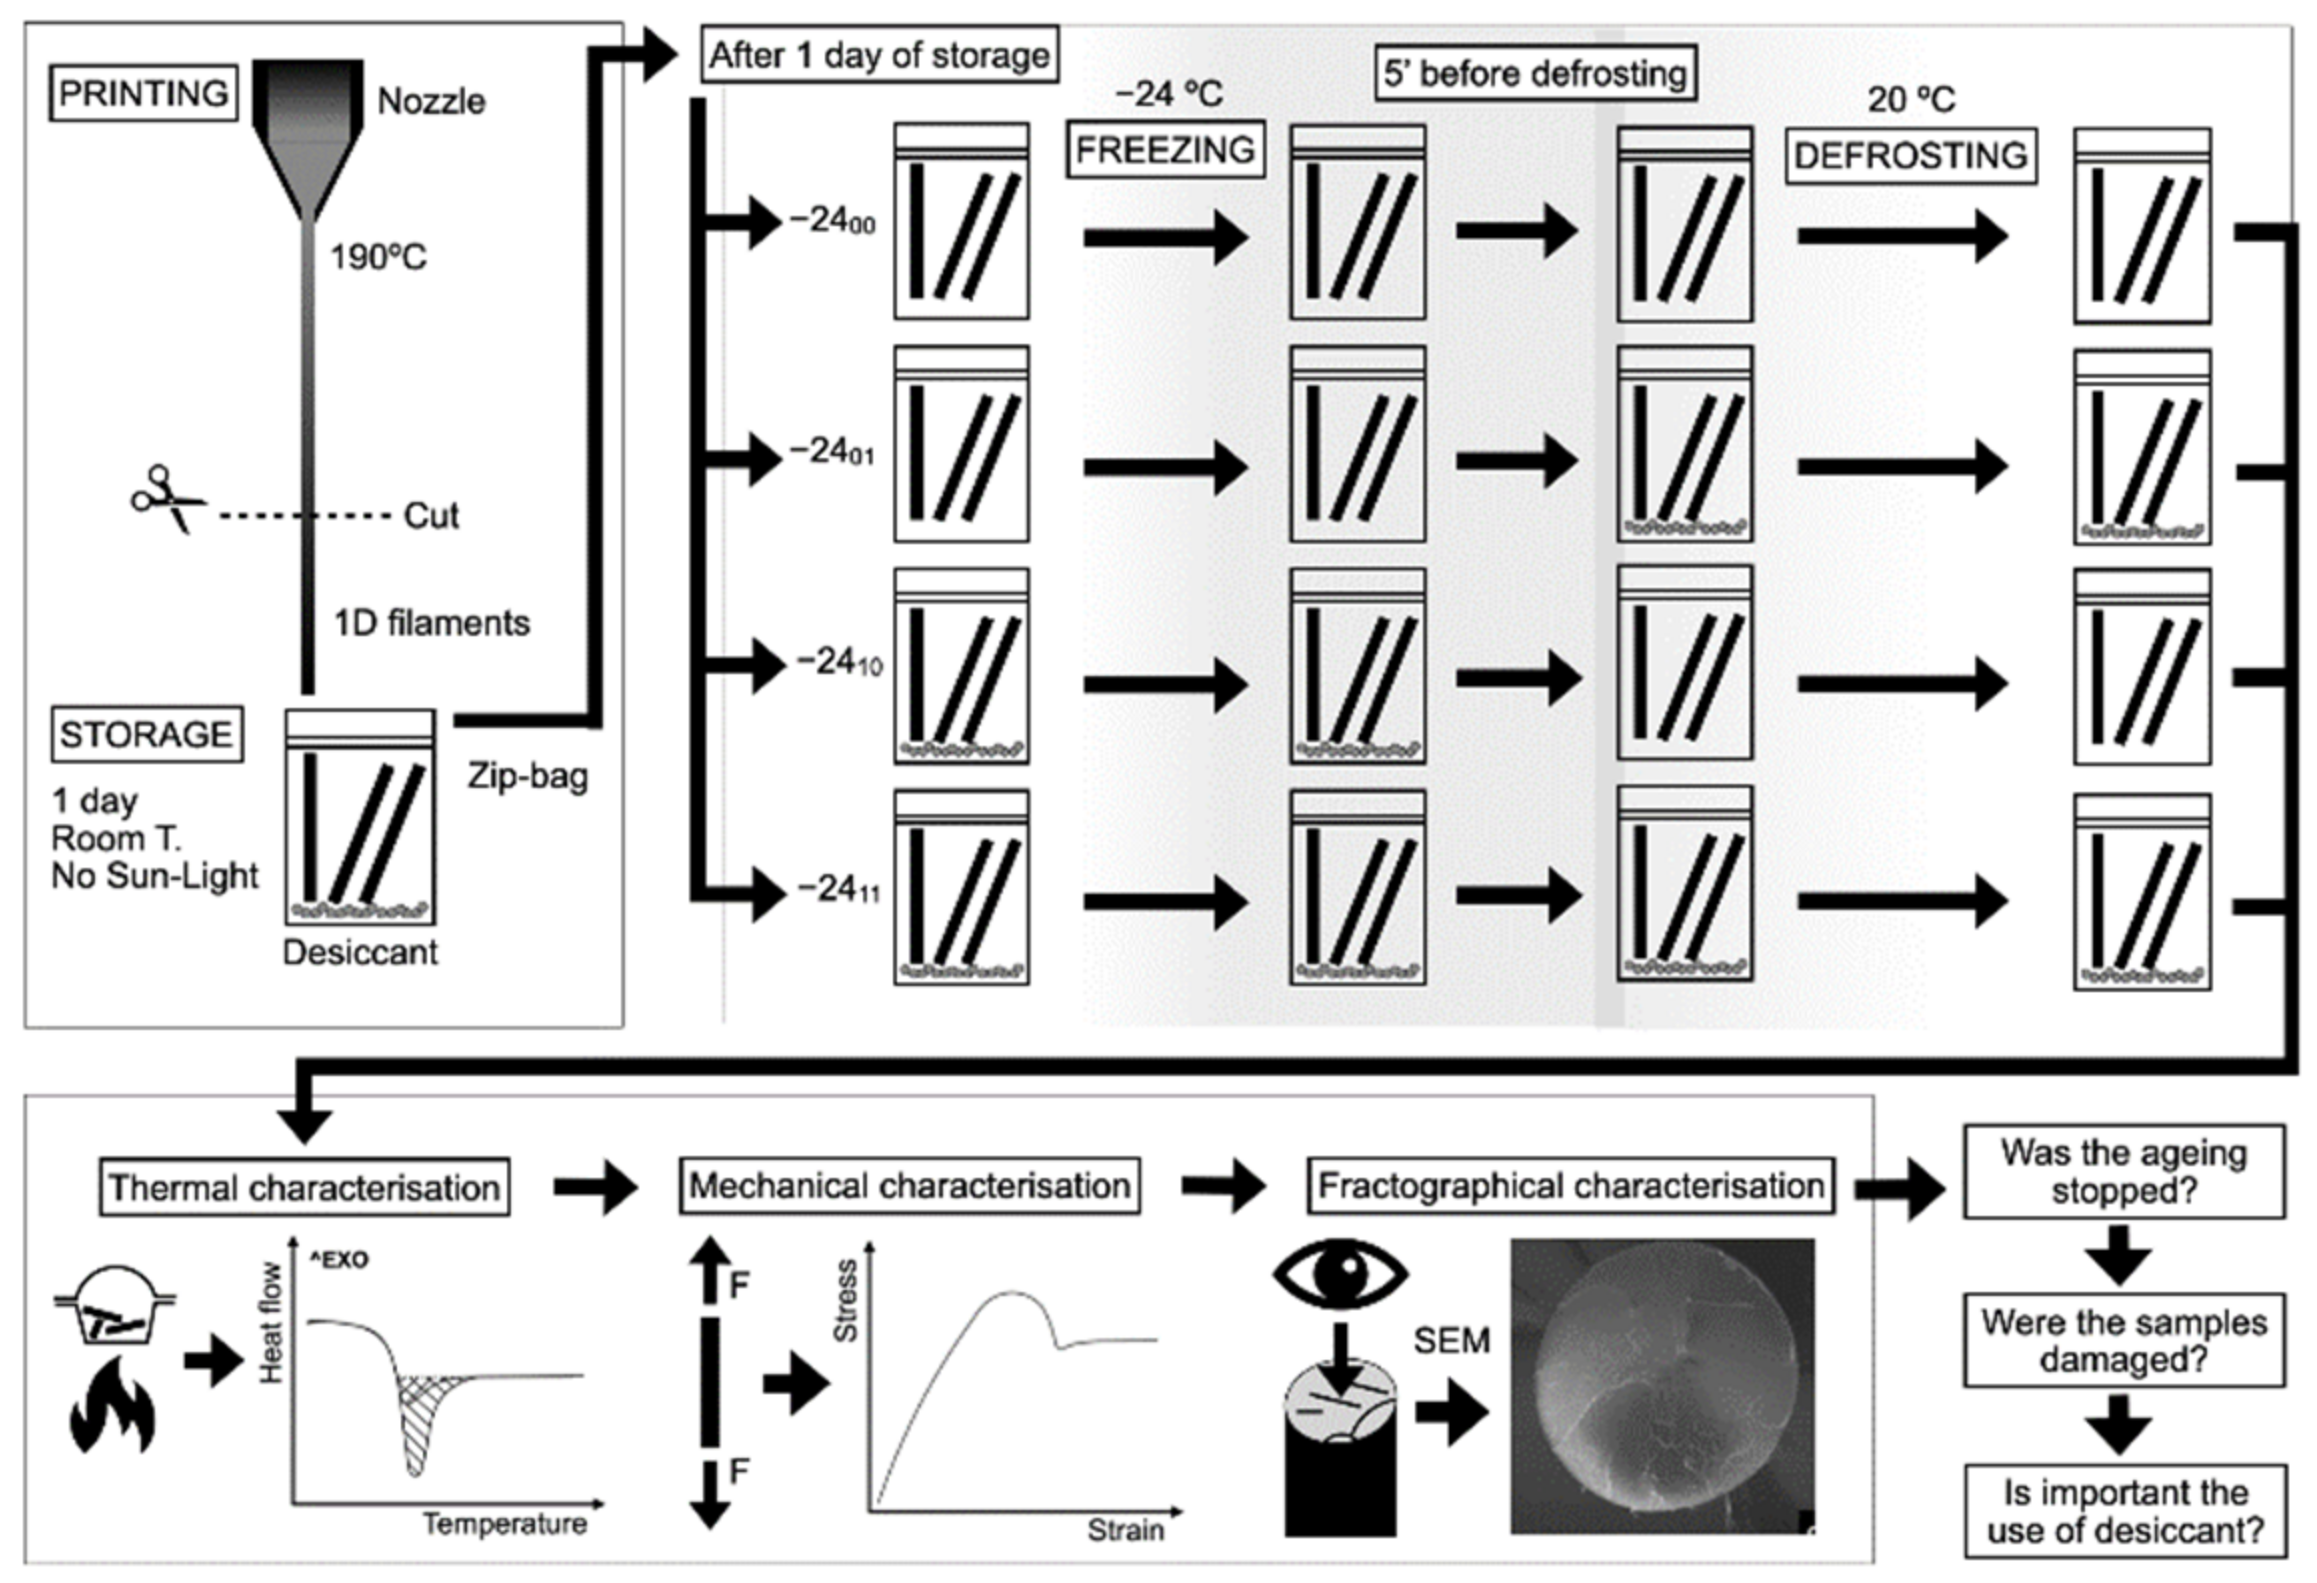
A summary of the materials and methods is presented in Figure 1.
2.1. Material Preparation
The PLA studied was the Ingeo biopolymer 2003D (Nature Works, United States), a high-molecular-weight polymer derived from natural sources and composed of 96% l-lactide and 4% d-lactide. This PLA was printed (extruded) as single filaments or 1D structures, as schematised in Figure 1, at the Institute of Glass and Ceramic (ICV, CSIC, Madrid, Spain) in a 3D printer Fused Filament Fabrication (Original Prusa i3 MK3S+ from Prusa Research, Prague, Czech Republic) at 190 ± 1 °C with a 0.4 mm nozzle, following the methods described in [24]. Filaments with a diameter between 400 and 550 µm were obtained.
The degradation by hydrolysis of the PLA molecular weight (Mw) was prevented by maintaining the material in low humidity and low-temperature conditions [31]. The low humidity condition was obtained by storing the samples inside PET zip-bags with silica desiccant inside. We observed how the color indicator of the silica desiccant inside the zip-bag remained stable over several weeks instead of only minutes. All the printed samples were dimensionally characterised with a Nikon Profile Projector V-12B, within a resolution of ±1 µm. The filaments with the right consistency on the diameter were studied, as this is essential for mechanical characterisation.
2.2. Anti-Ageing Methods
Printed PLA filaments were stored inside PET zip bags. Four different anti-ageing methods based on four freezing–defrosting routes were studied, as schematised in Figure 1 and described in more detail in Table 1. The influence of the presence of desiccant inside the zip bags during the freezing and defrosting processes was studied. A reference material aged at room temperature inside zip bags with desiccant was also studied.
The research was conducted in Madrid with dry weather and a maximum humidity percentage at room conditions below 70%. Samples were aged from 1 day to 273 days (9 months). Regarding [28], PLA degradation driven by hydrolysis requires temperatures of 50 °C, and thus it is not expected to occur on the PLA aged at room temperature.
The effectiveness of the anti-ageing method was assessed with the results from the Differential Scanning Calorimetry (DSC). Furthermore, tensile tests were performed to ensure that the mechanical properties of the filaments have not decreased nor increased and thus remained stable. Obtaining stable properties, especially for enthalpic relaxation and mechanical properties, indicated a successful anti-ageing method.
2.3. Thermal Analysis
Thermal analysis was conducted using the DSC technique on a Mettler Toledo 822e. The temperature range of this analysis was from 40 to 180 °C, at a heating rate of 10 °C/min. The weights of the samples were between 5 to 10 mg, and the filaments were cut into pieces of 3–4 mm, which were placed inside the DSC crucible. Before the tests, the DSC apparatus was calibrated with the Indium standard. A direct comparison between the DSC graphs was performed to identify any variation between the samples aged at room temperature and the frozen samples.
2.4. Mechanical Characterisation and Fractography
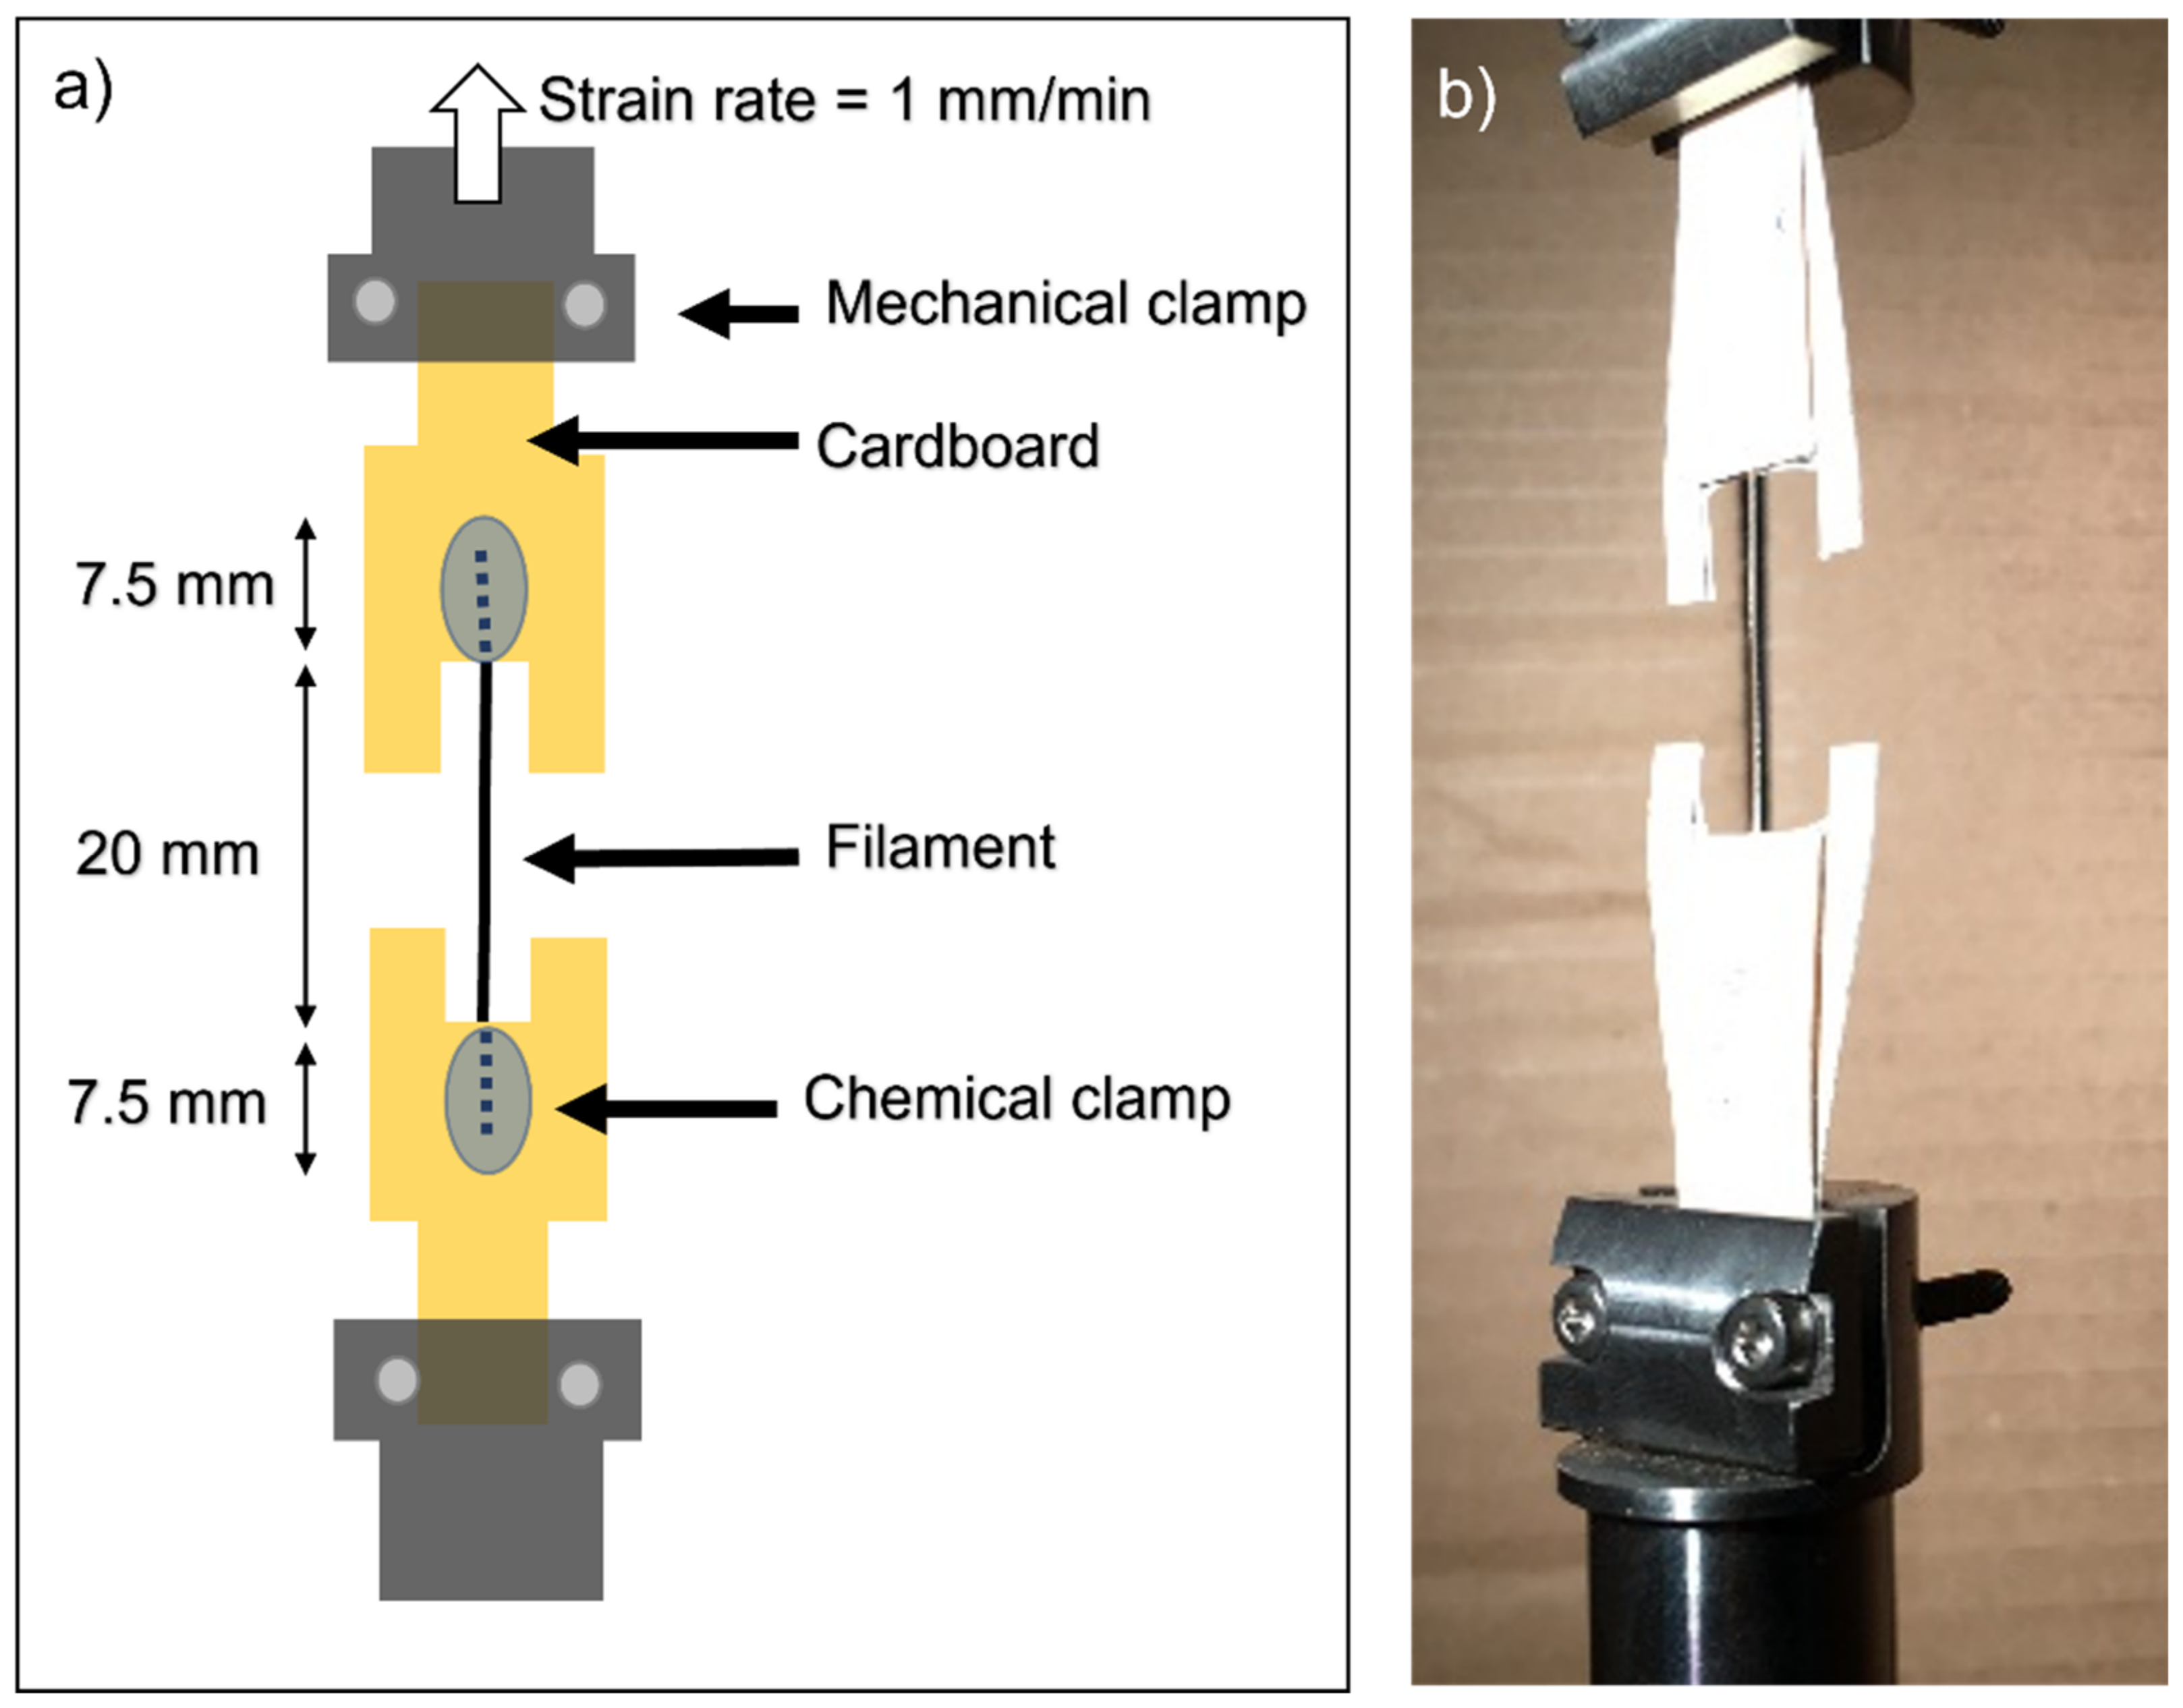
Samples were defrosted for one hour at room temperature before performing the mechanical testing. Tensile tests were prepared according to the ISO 527-3:2019 and served in the universal testing machine INSTRON 5866 (Instron, Norwood, MA, United States). A 1 kN cell was used for measuring the forces. Samples with a 20 mm length were tested at 1 mm/min (strain rate of 5 × 10⁻² min−1) at ambient humidity and room temperature. To avoid damage to the filaments due to the mechanical clamps, filaments were chemically clamped to cardboard with a cyanoacrylate glue following the procedure described in [24] and schematised in Figure 2. The yield strength, elongation at break and the elastic modulus were calculated. The formation or absence of a necking was studied as well. Fractographies of samples were taken with an AURIGA FESEM ZEISS (Carl Zeiss Microscopy GmbH, Germany) with a 20 nm thickness carbon coating in a LEICA EM ACE200 Vacuum Coater (Leica Myscrosystems, Germany) before the FESEM following the methods in [24].
The yield strength and the elastic modulus were fitted to a logistic model, as developed in [24].
3. Results and Discussion
3.1. Morphology
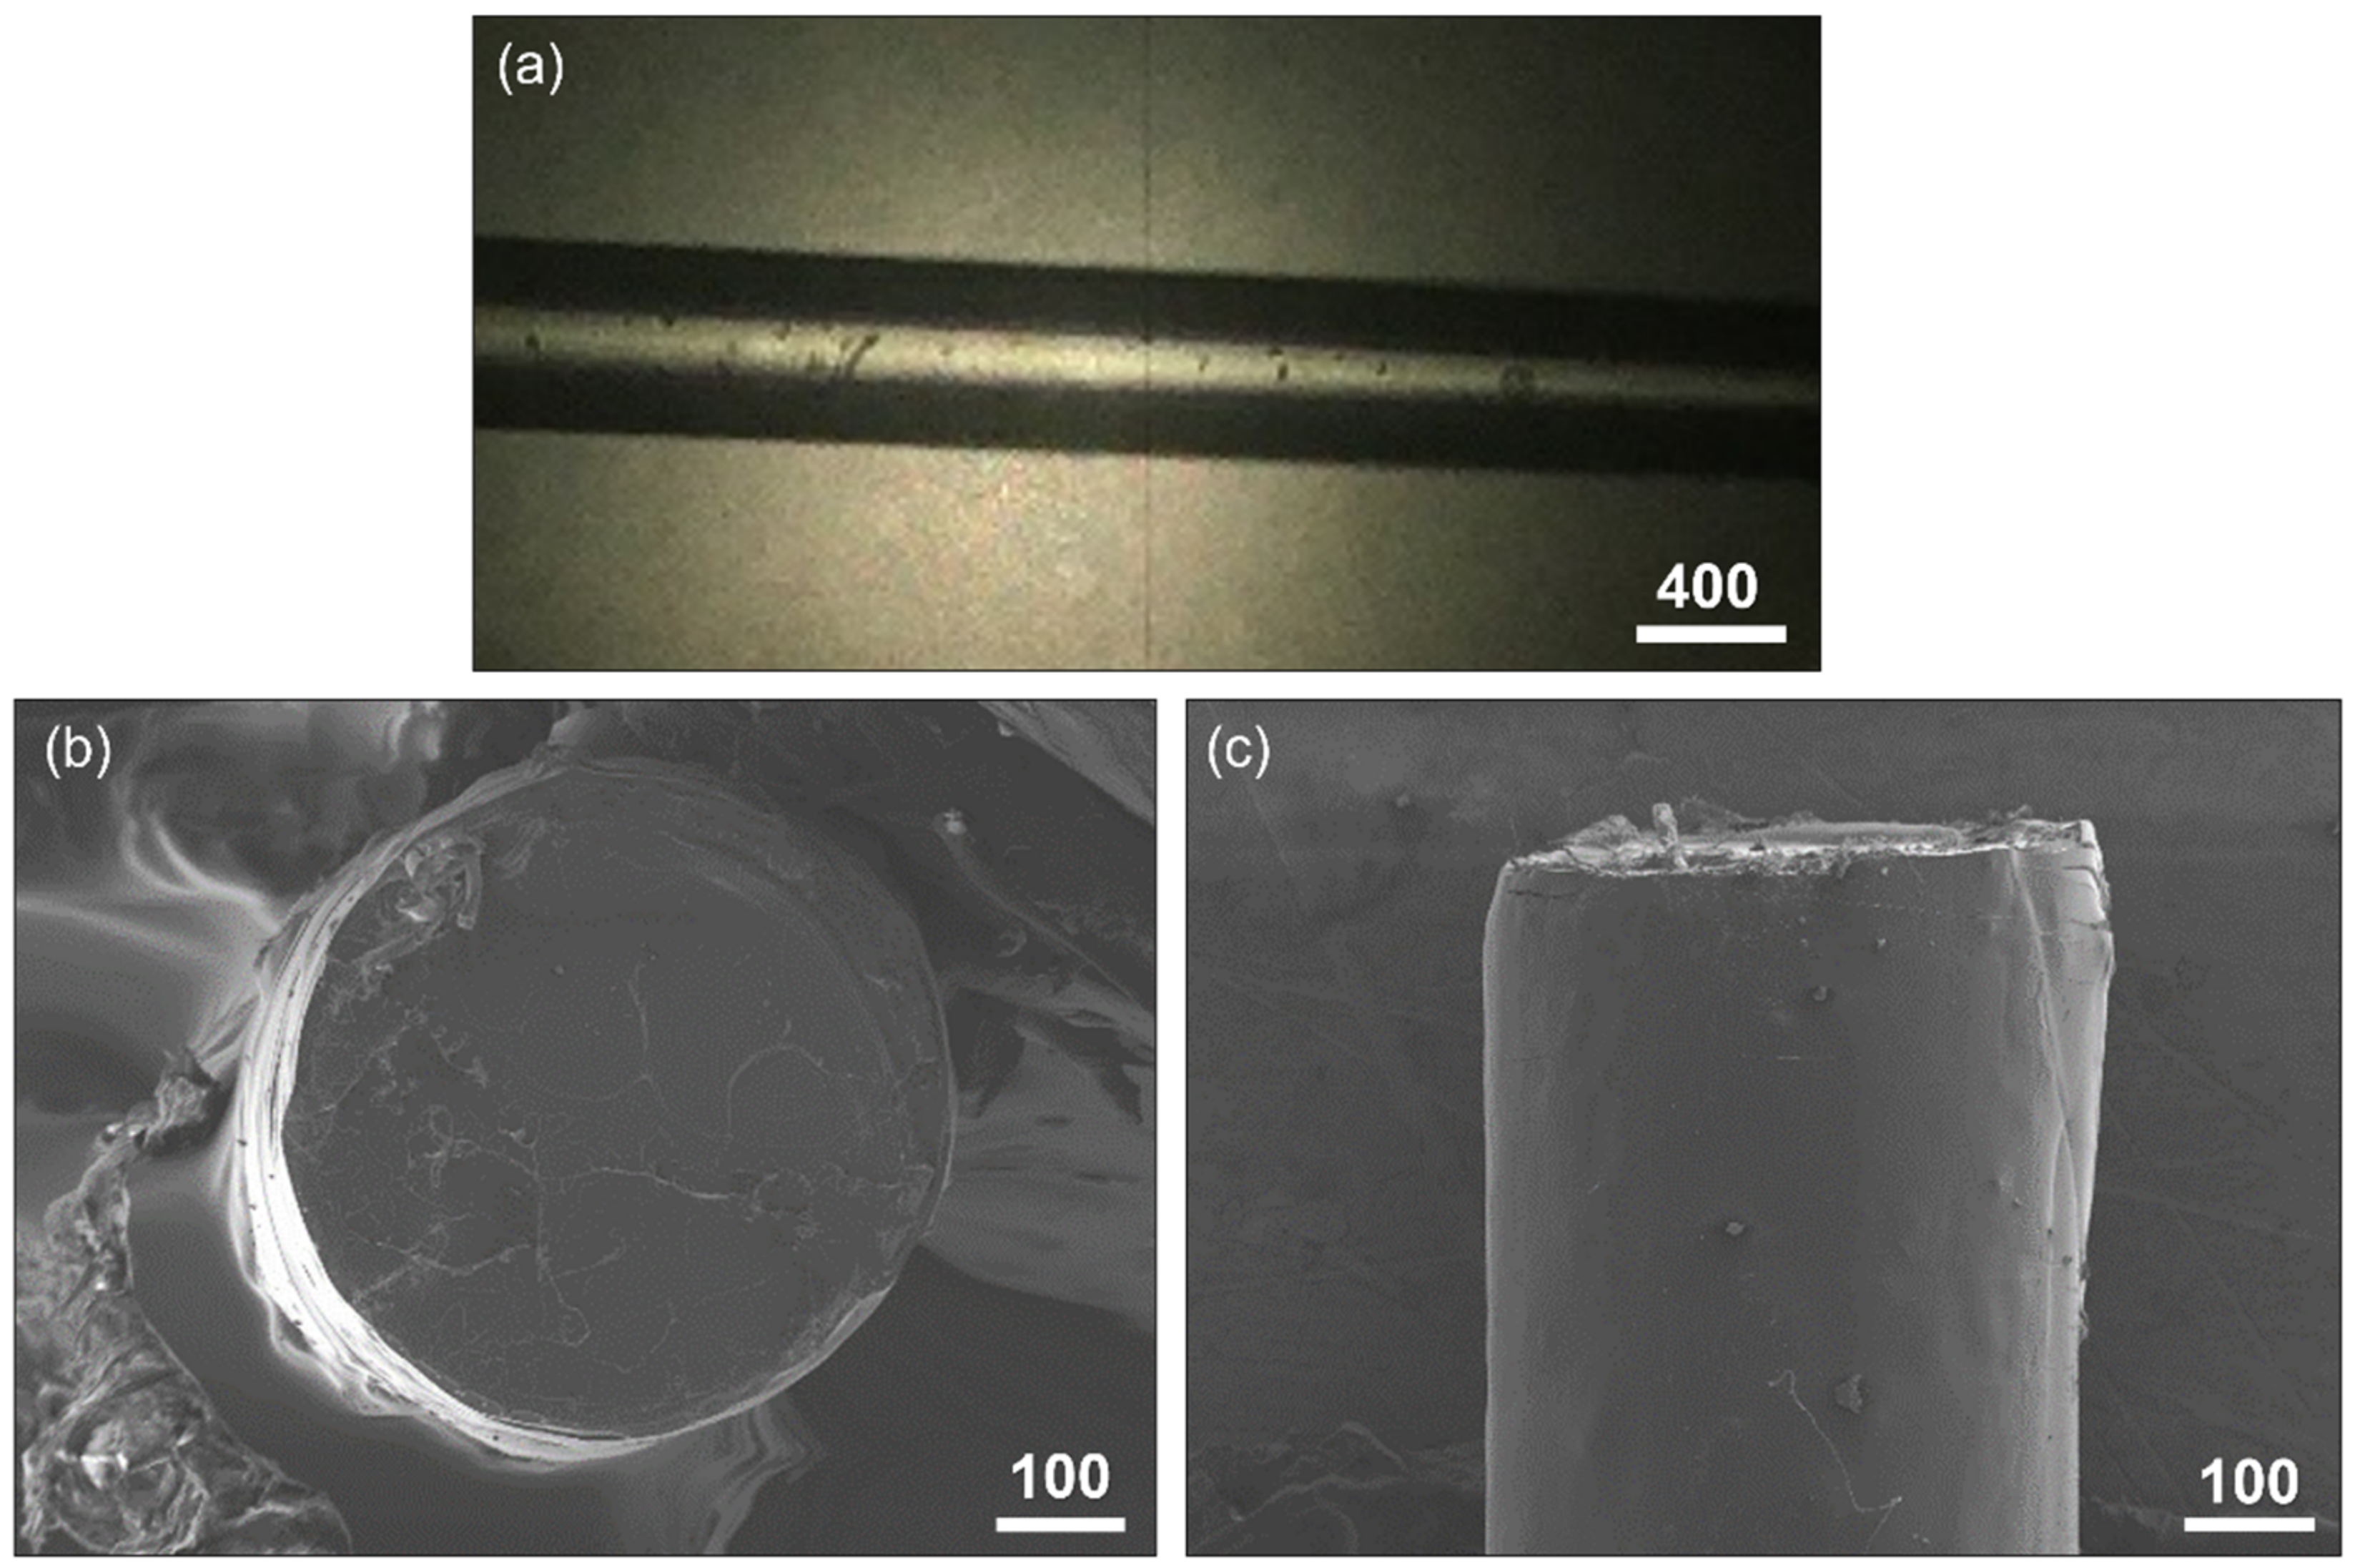
Samples extruded had a diameter between 400 and 550 µm, varying smoothly along the length of the filaments with high stability on the diameter through the filaments and good ovality, as shown in Figure 3.
3.2. Thermal Properties
All the results from the thermal properties are shown in Table 2.
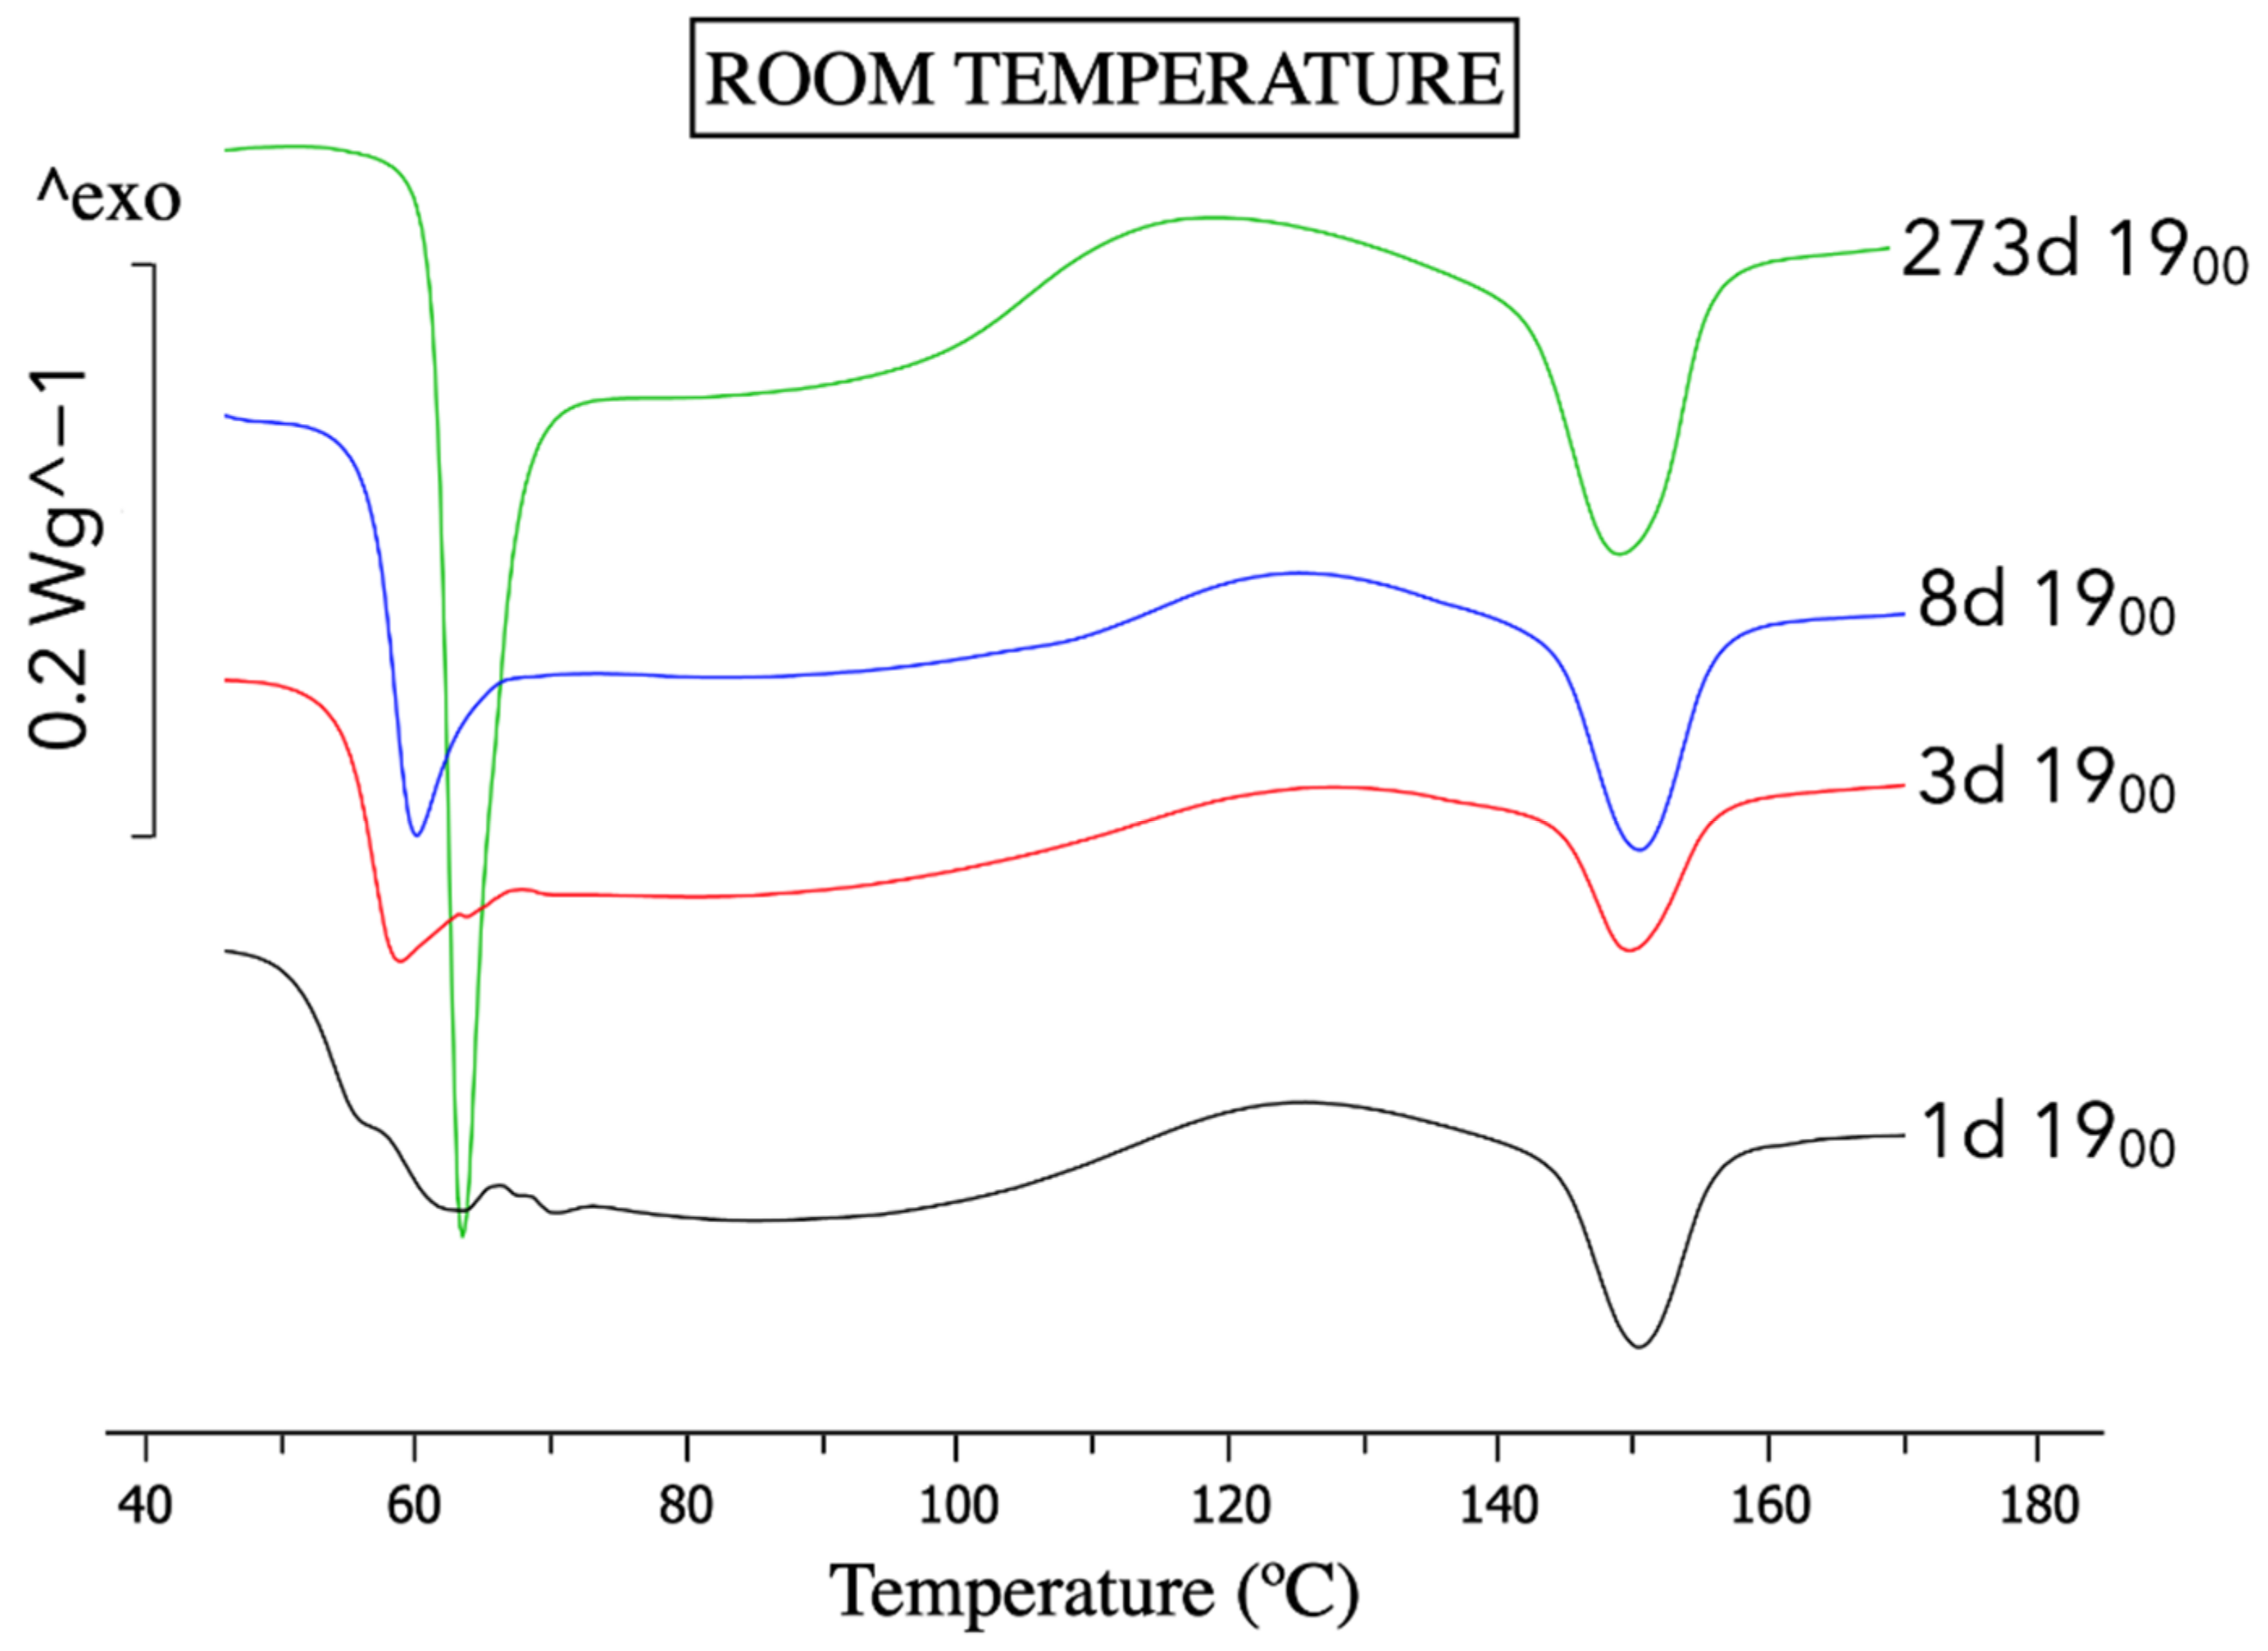
The ageing at room temperature on the reference material has produced an intense increase on enthalpic relaxation, indicative of physical ageing and a shift of Tg, as shown in Figure 4, which is coherent with our previous study [24]. This proves that the material studied has the potential to age.
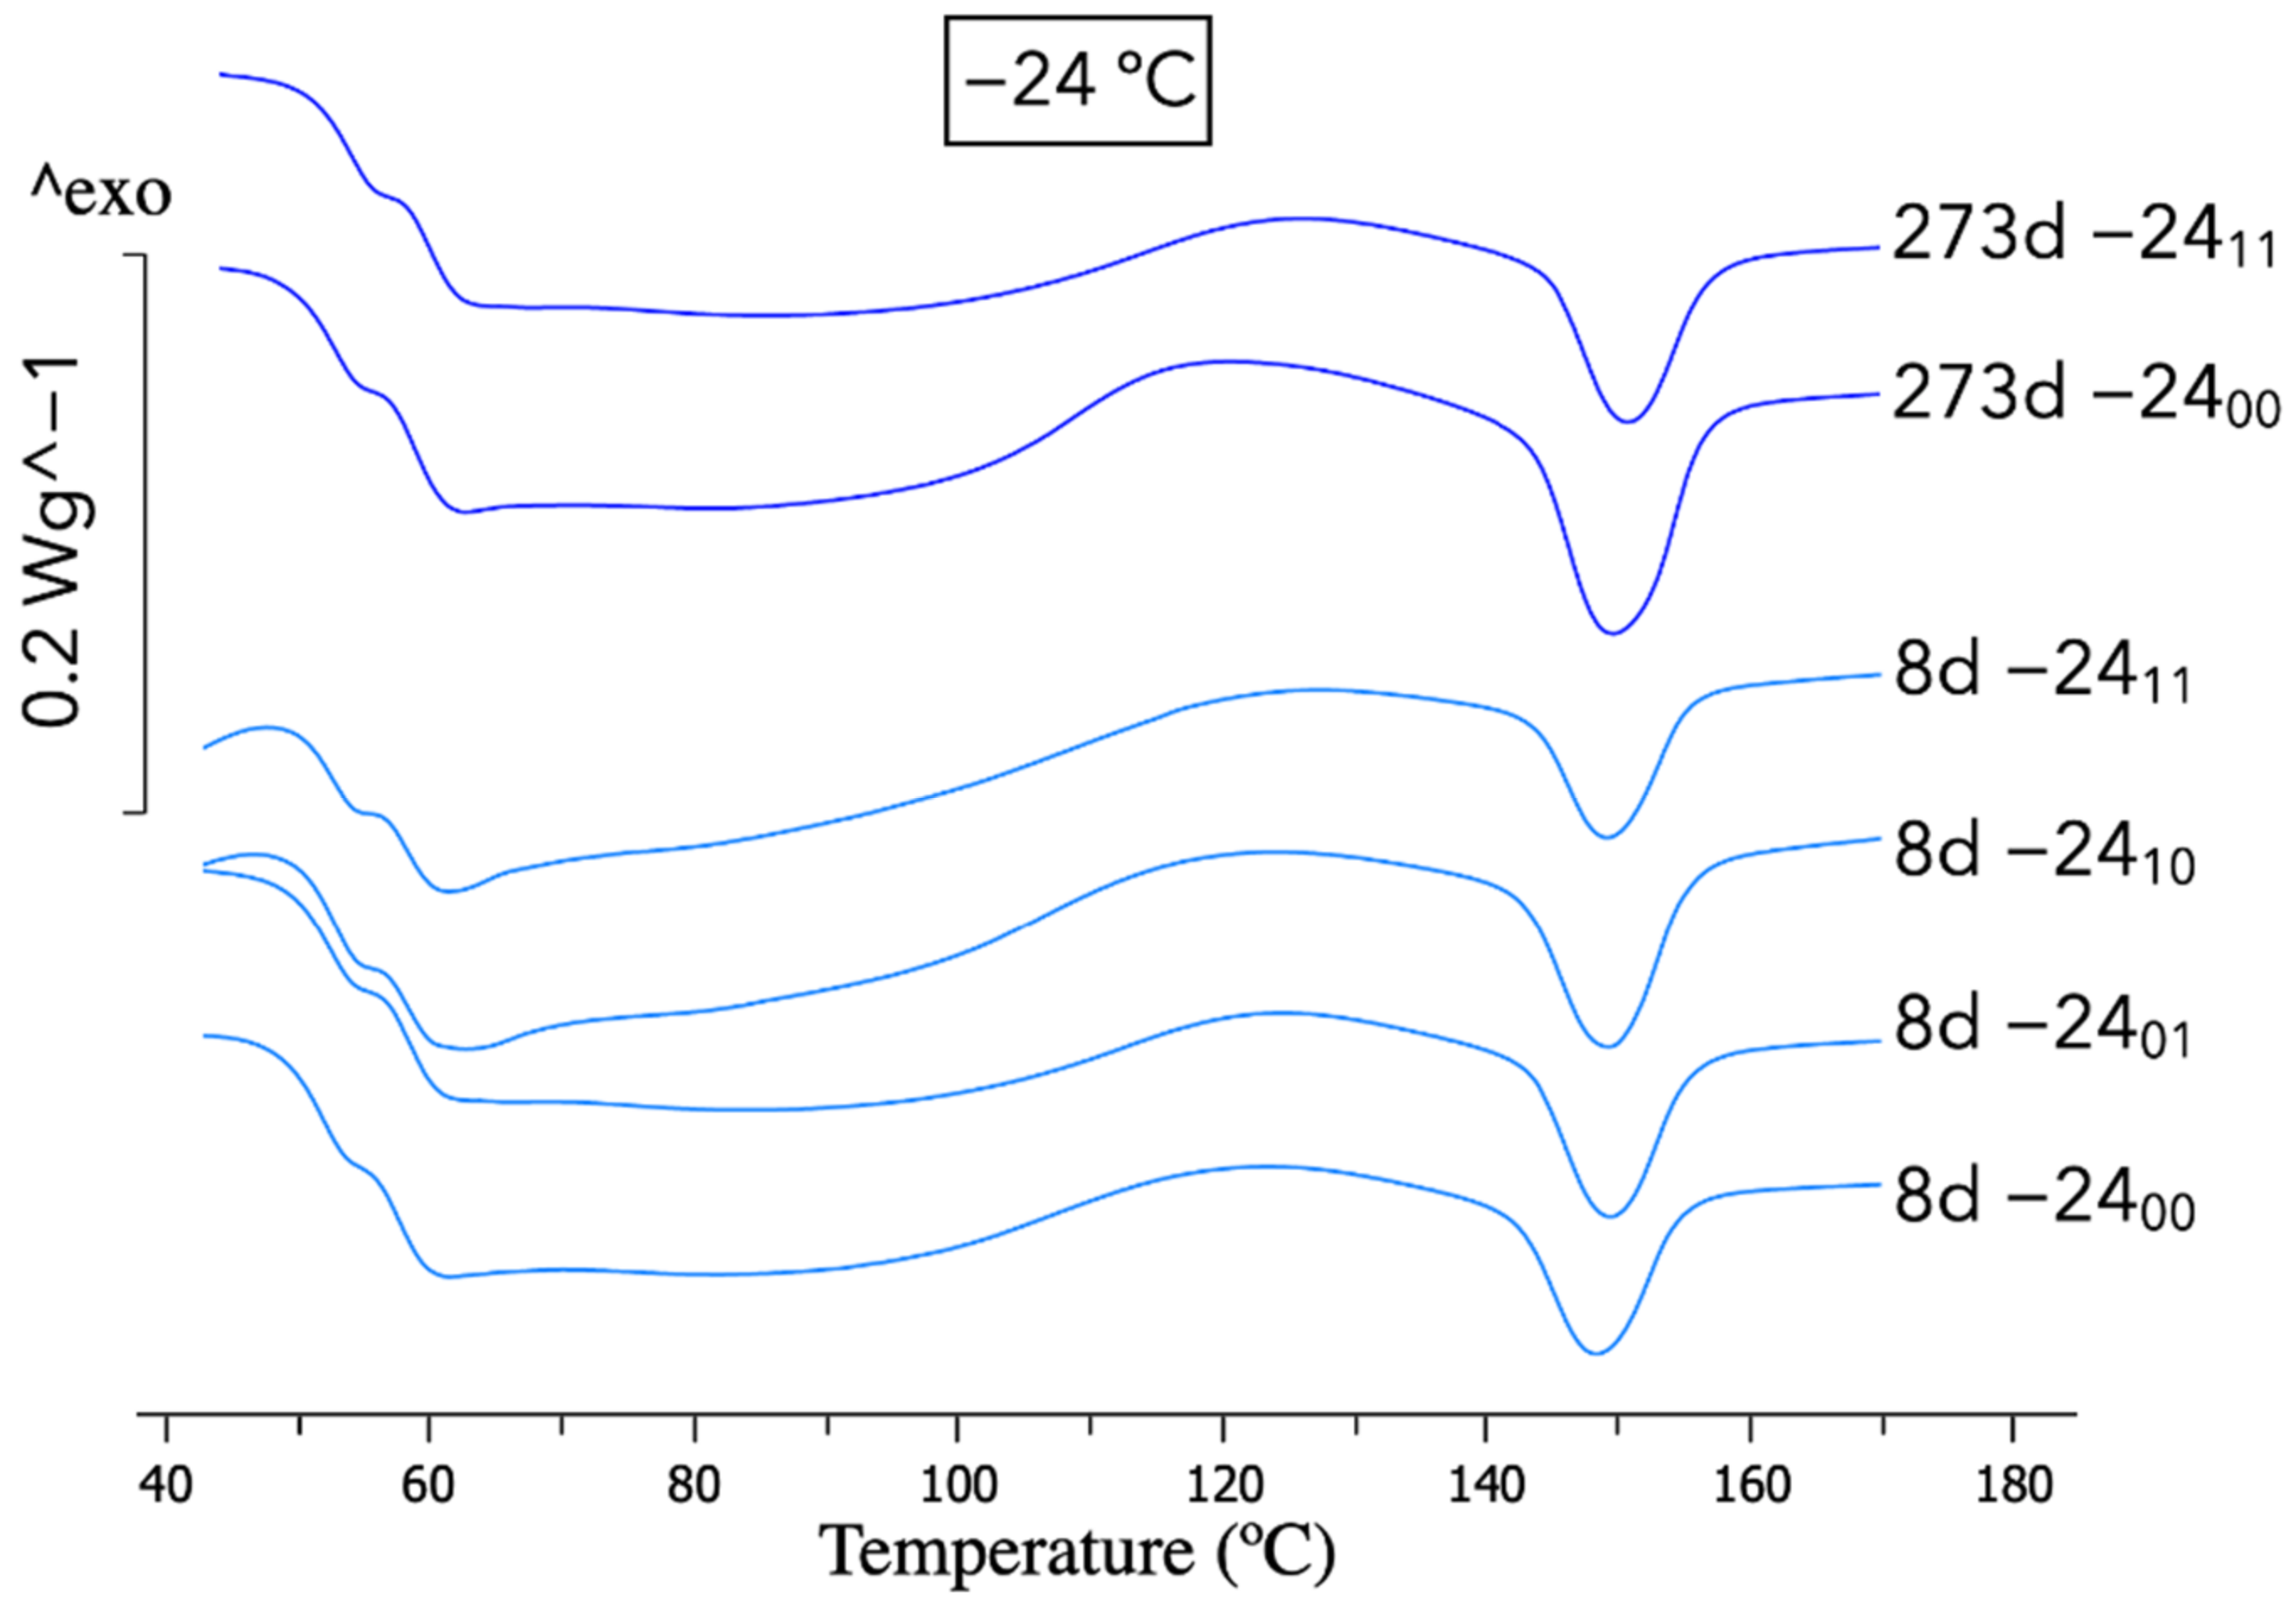
However, no changes were observed on samples frozen at −24 °C, regarding the results of the DSC in Figure 5, indicating that −24 °C stopped the physical ageing. Our previous work provides a deeper analysis of the DSC changes with physical ageing [24].
As can also be observed in the DSC diagram in Figure 5, for samples frozen at −24 °C there is no influence of using desiccant during the anti-ageing process. Neglectable differences can be found by comparing all the curves of the frozen samples.
With these results, it can be ensured that freezing the PLA at −24 °C has effectively stopped the PLA ageing. The fact that the ageing was arrested by decreasing the temperature is coherent with the ageing mechanism that requires thermal energy for the motion of the polymeric chains into those more stable configurations that produce a loss of enthalpy.
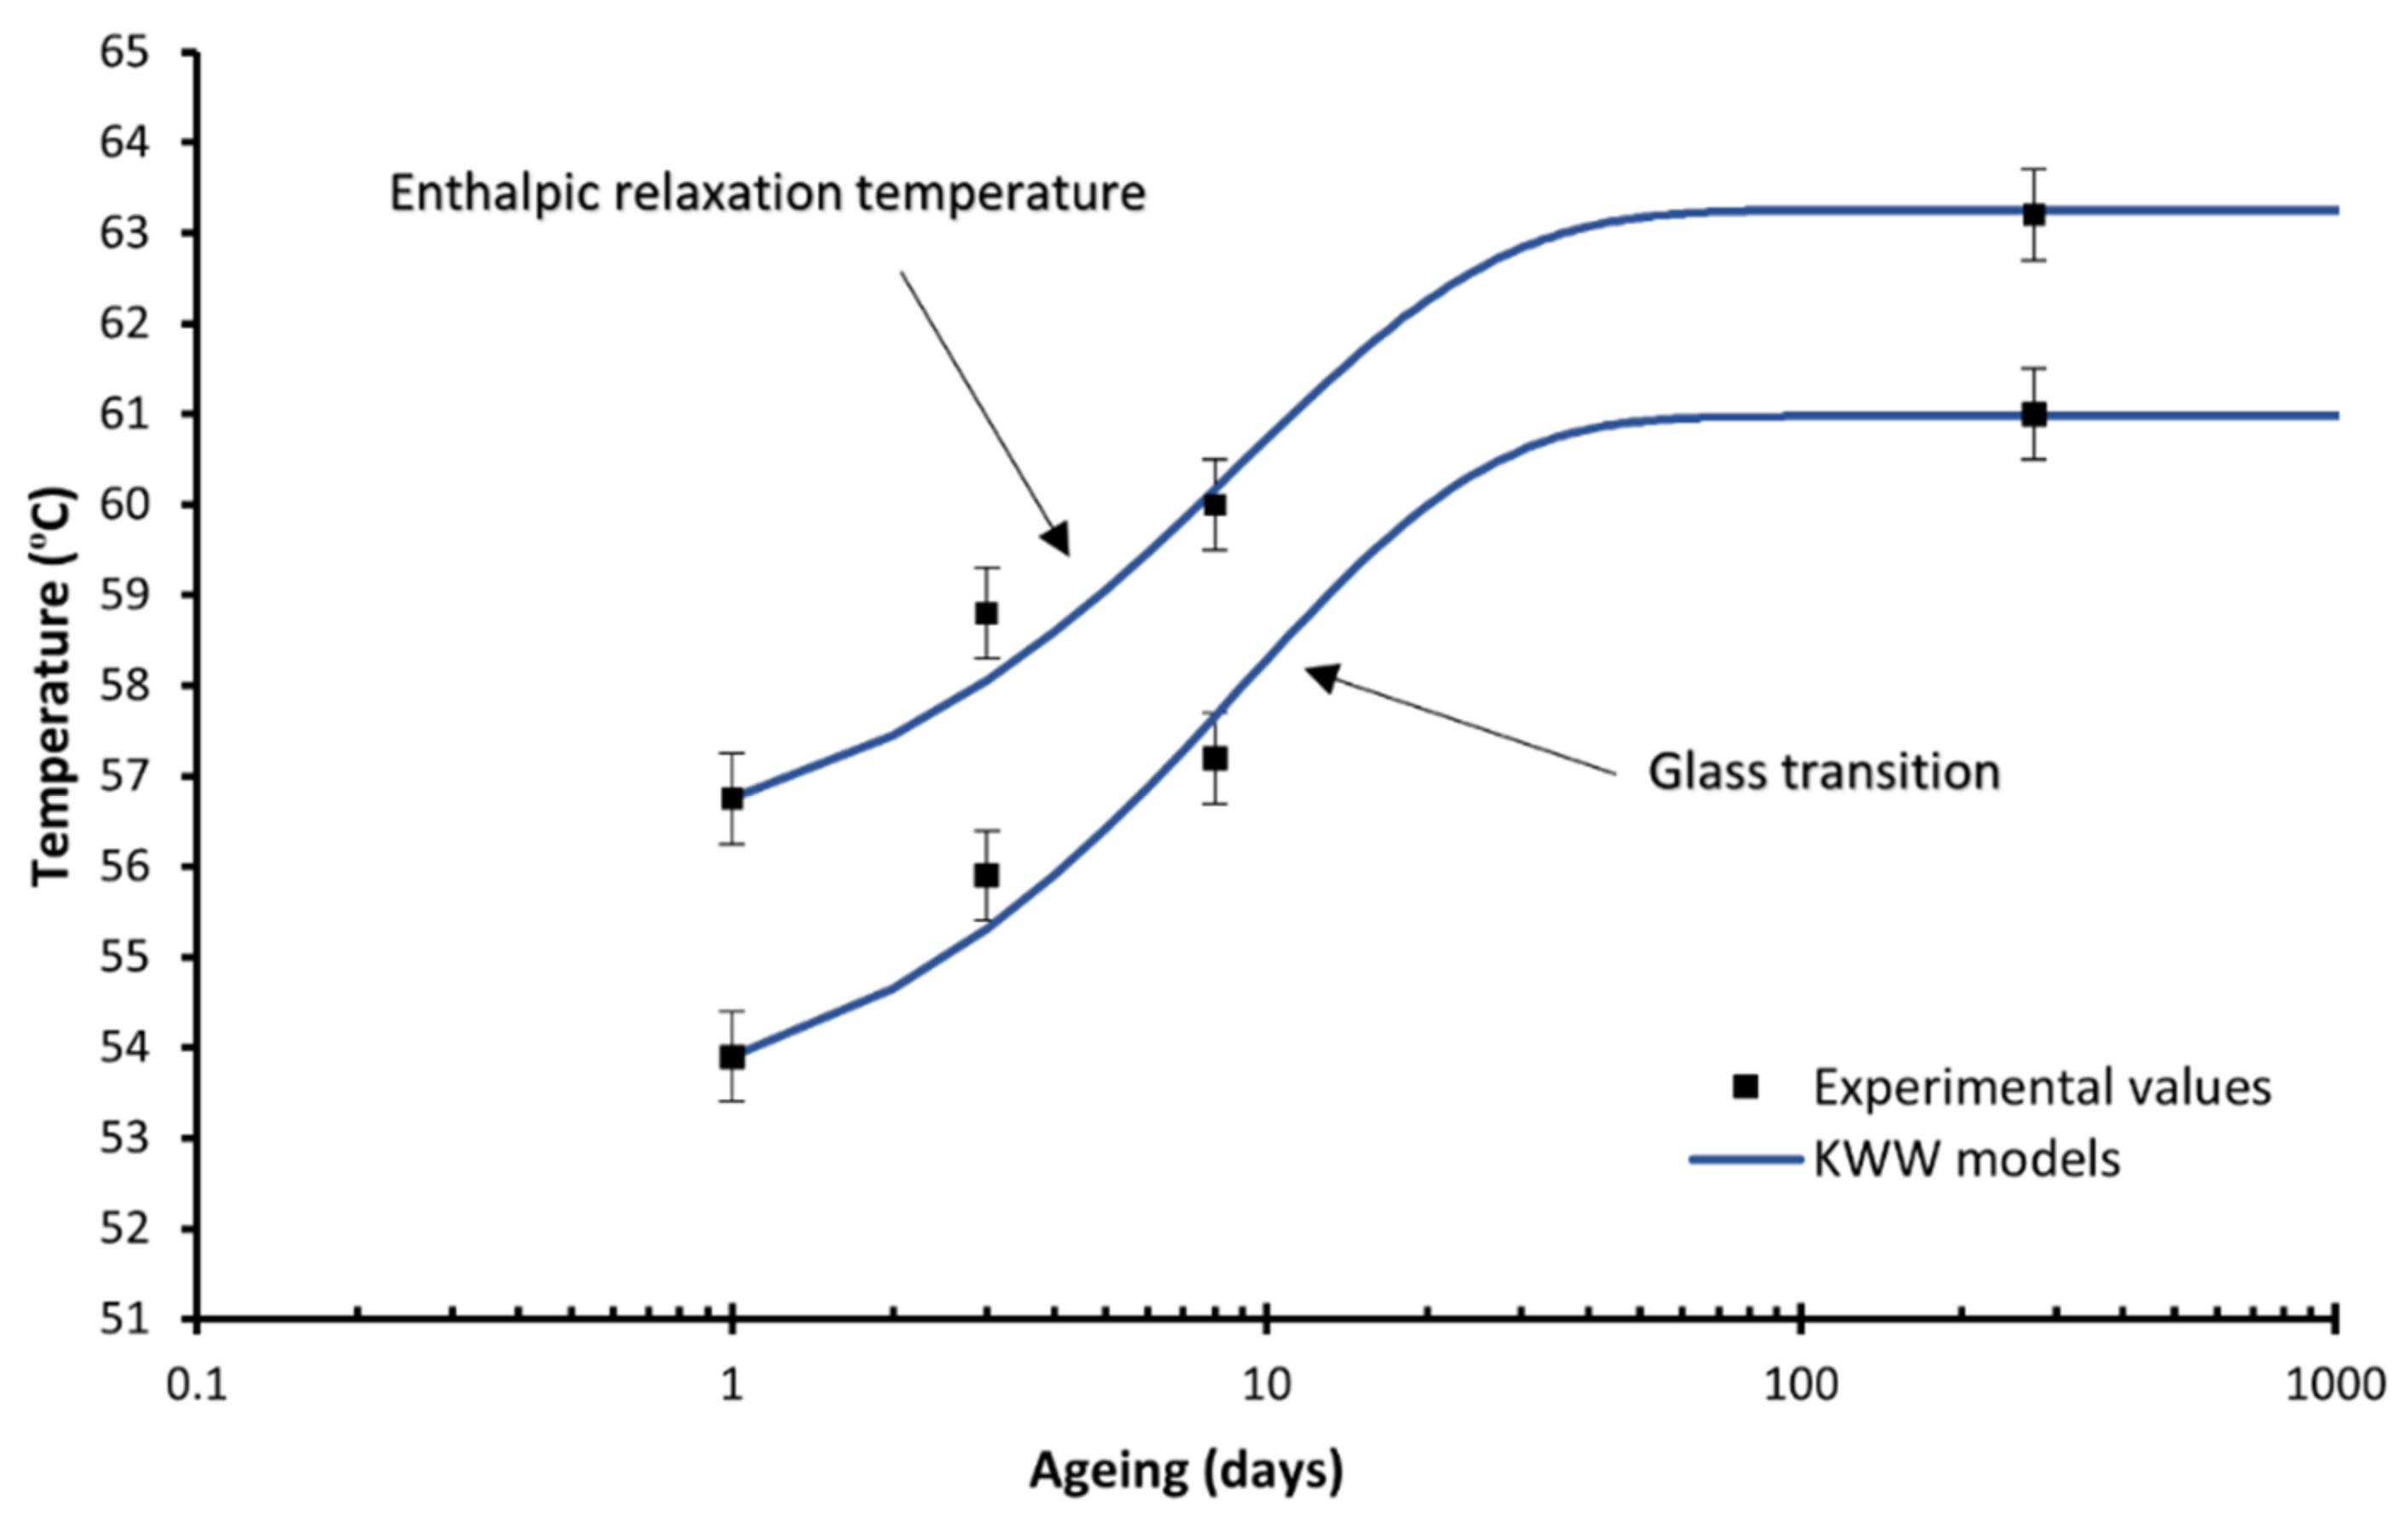
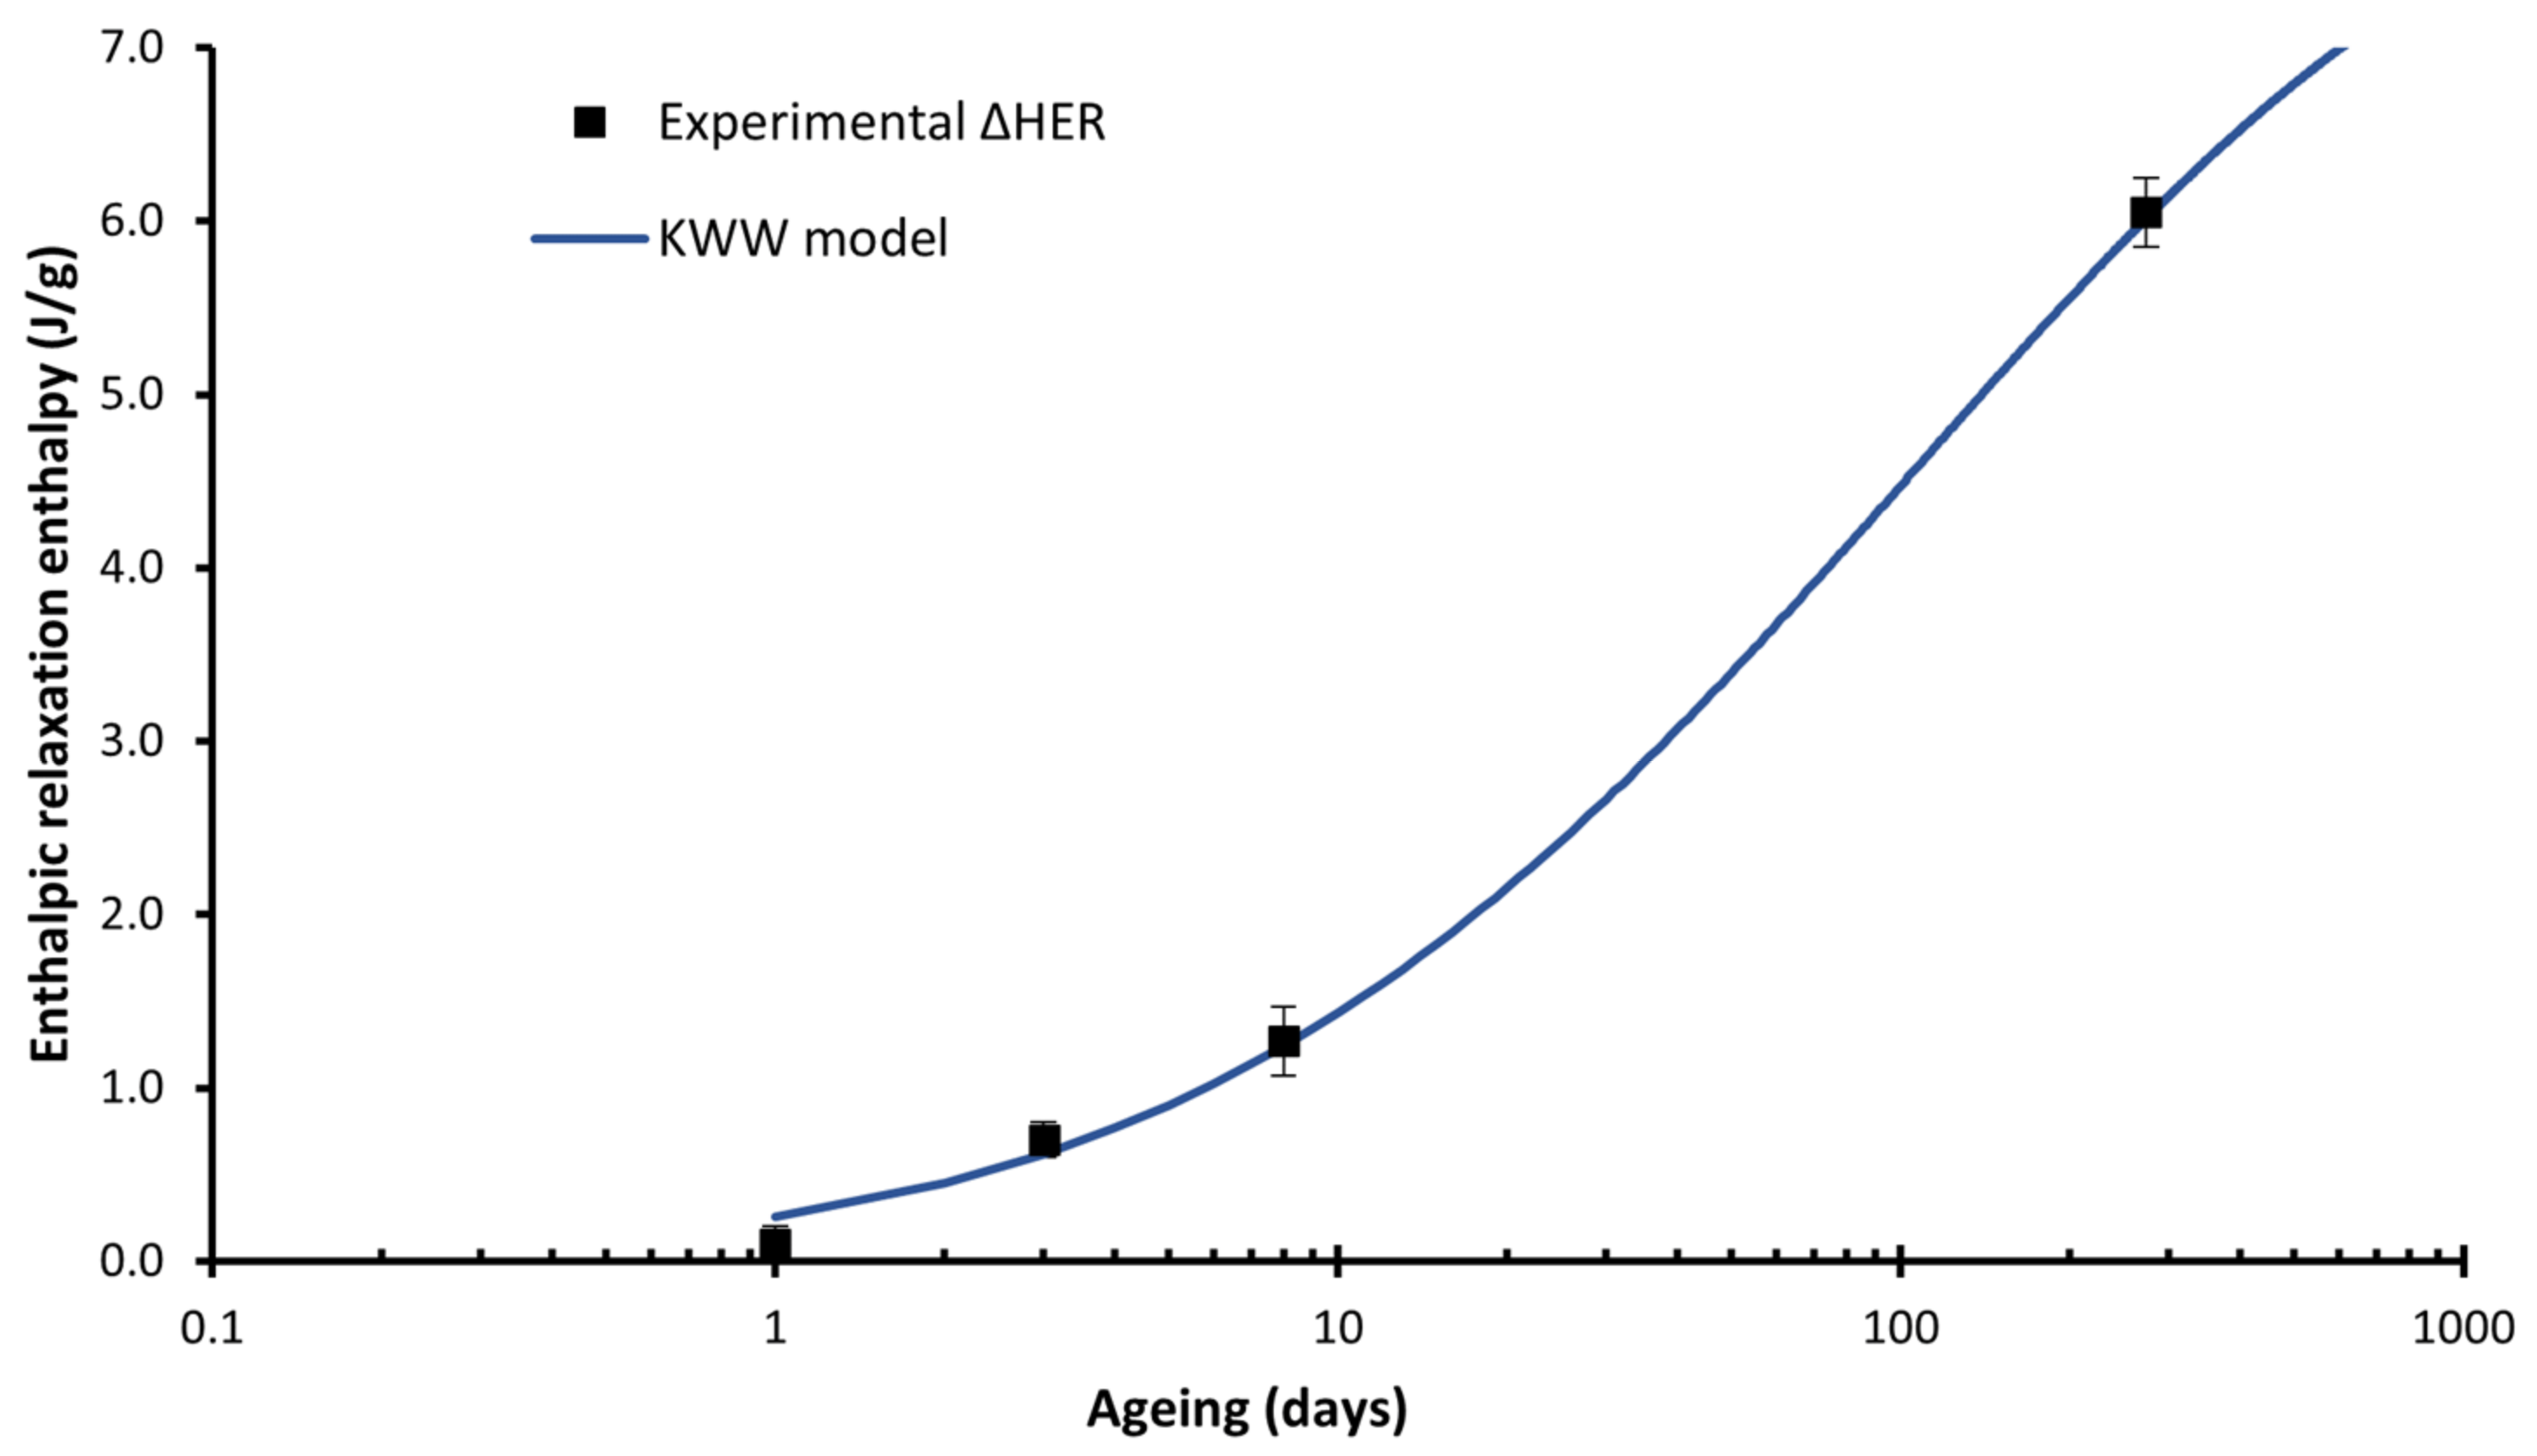
A deeper analysis of the DSC results in Figure 6 and Figure 7 represents the modelling of the glass transition, the enthalpic relaxation temperature, and the enthalpic relaxation enthalpy with the KWW model with a remarkable agreement with the experimental data. The KWW parameters obtained for the different models are as follows:
For the glass transition and the enthalpic relaxation temperature, the values are = 8.00 and = 0.9 days, and = 7.00 and = 0.82 days respectively, which plots are represented in Figure 6. It is observed how the stabilisation time for these two properties for the filaments aged at room temperature is of two months, coherent with our previous results [24].
For the enthalpic relaxation enthalpy: = 0.27 and = 0.24 days, which plot is represented in Figure 7, indicates that the enthalpic relaxation enthalpy will continue growing after 273 days on the material aged at room temperature, which is coherent with our previous study [24].
It is fascinating that the ratio between the and parameters on the KWW model is around 10 for both the glass temperature and the enthalpic relaxation temperature, which are similar to the ones obtained in our previous study, indicating that this relation for these properties could be a constant for the material PLA 2003D.
Regarding the crystallinity values, neglectable crystallinity percentages were calculated from the DSC, again coherent with our previous study of this material [24].
3.3. Mechanical Behaviour
Once it was obtained that the ageing can be stopped by freezing the PLA at −24 °C, it is crucial to see if the freezing–defrosting process has damaged the material. The mechanical properties were studied by an uniaxial tensile test, as they are susceptible to any induced microstructural damage.
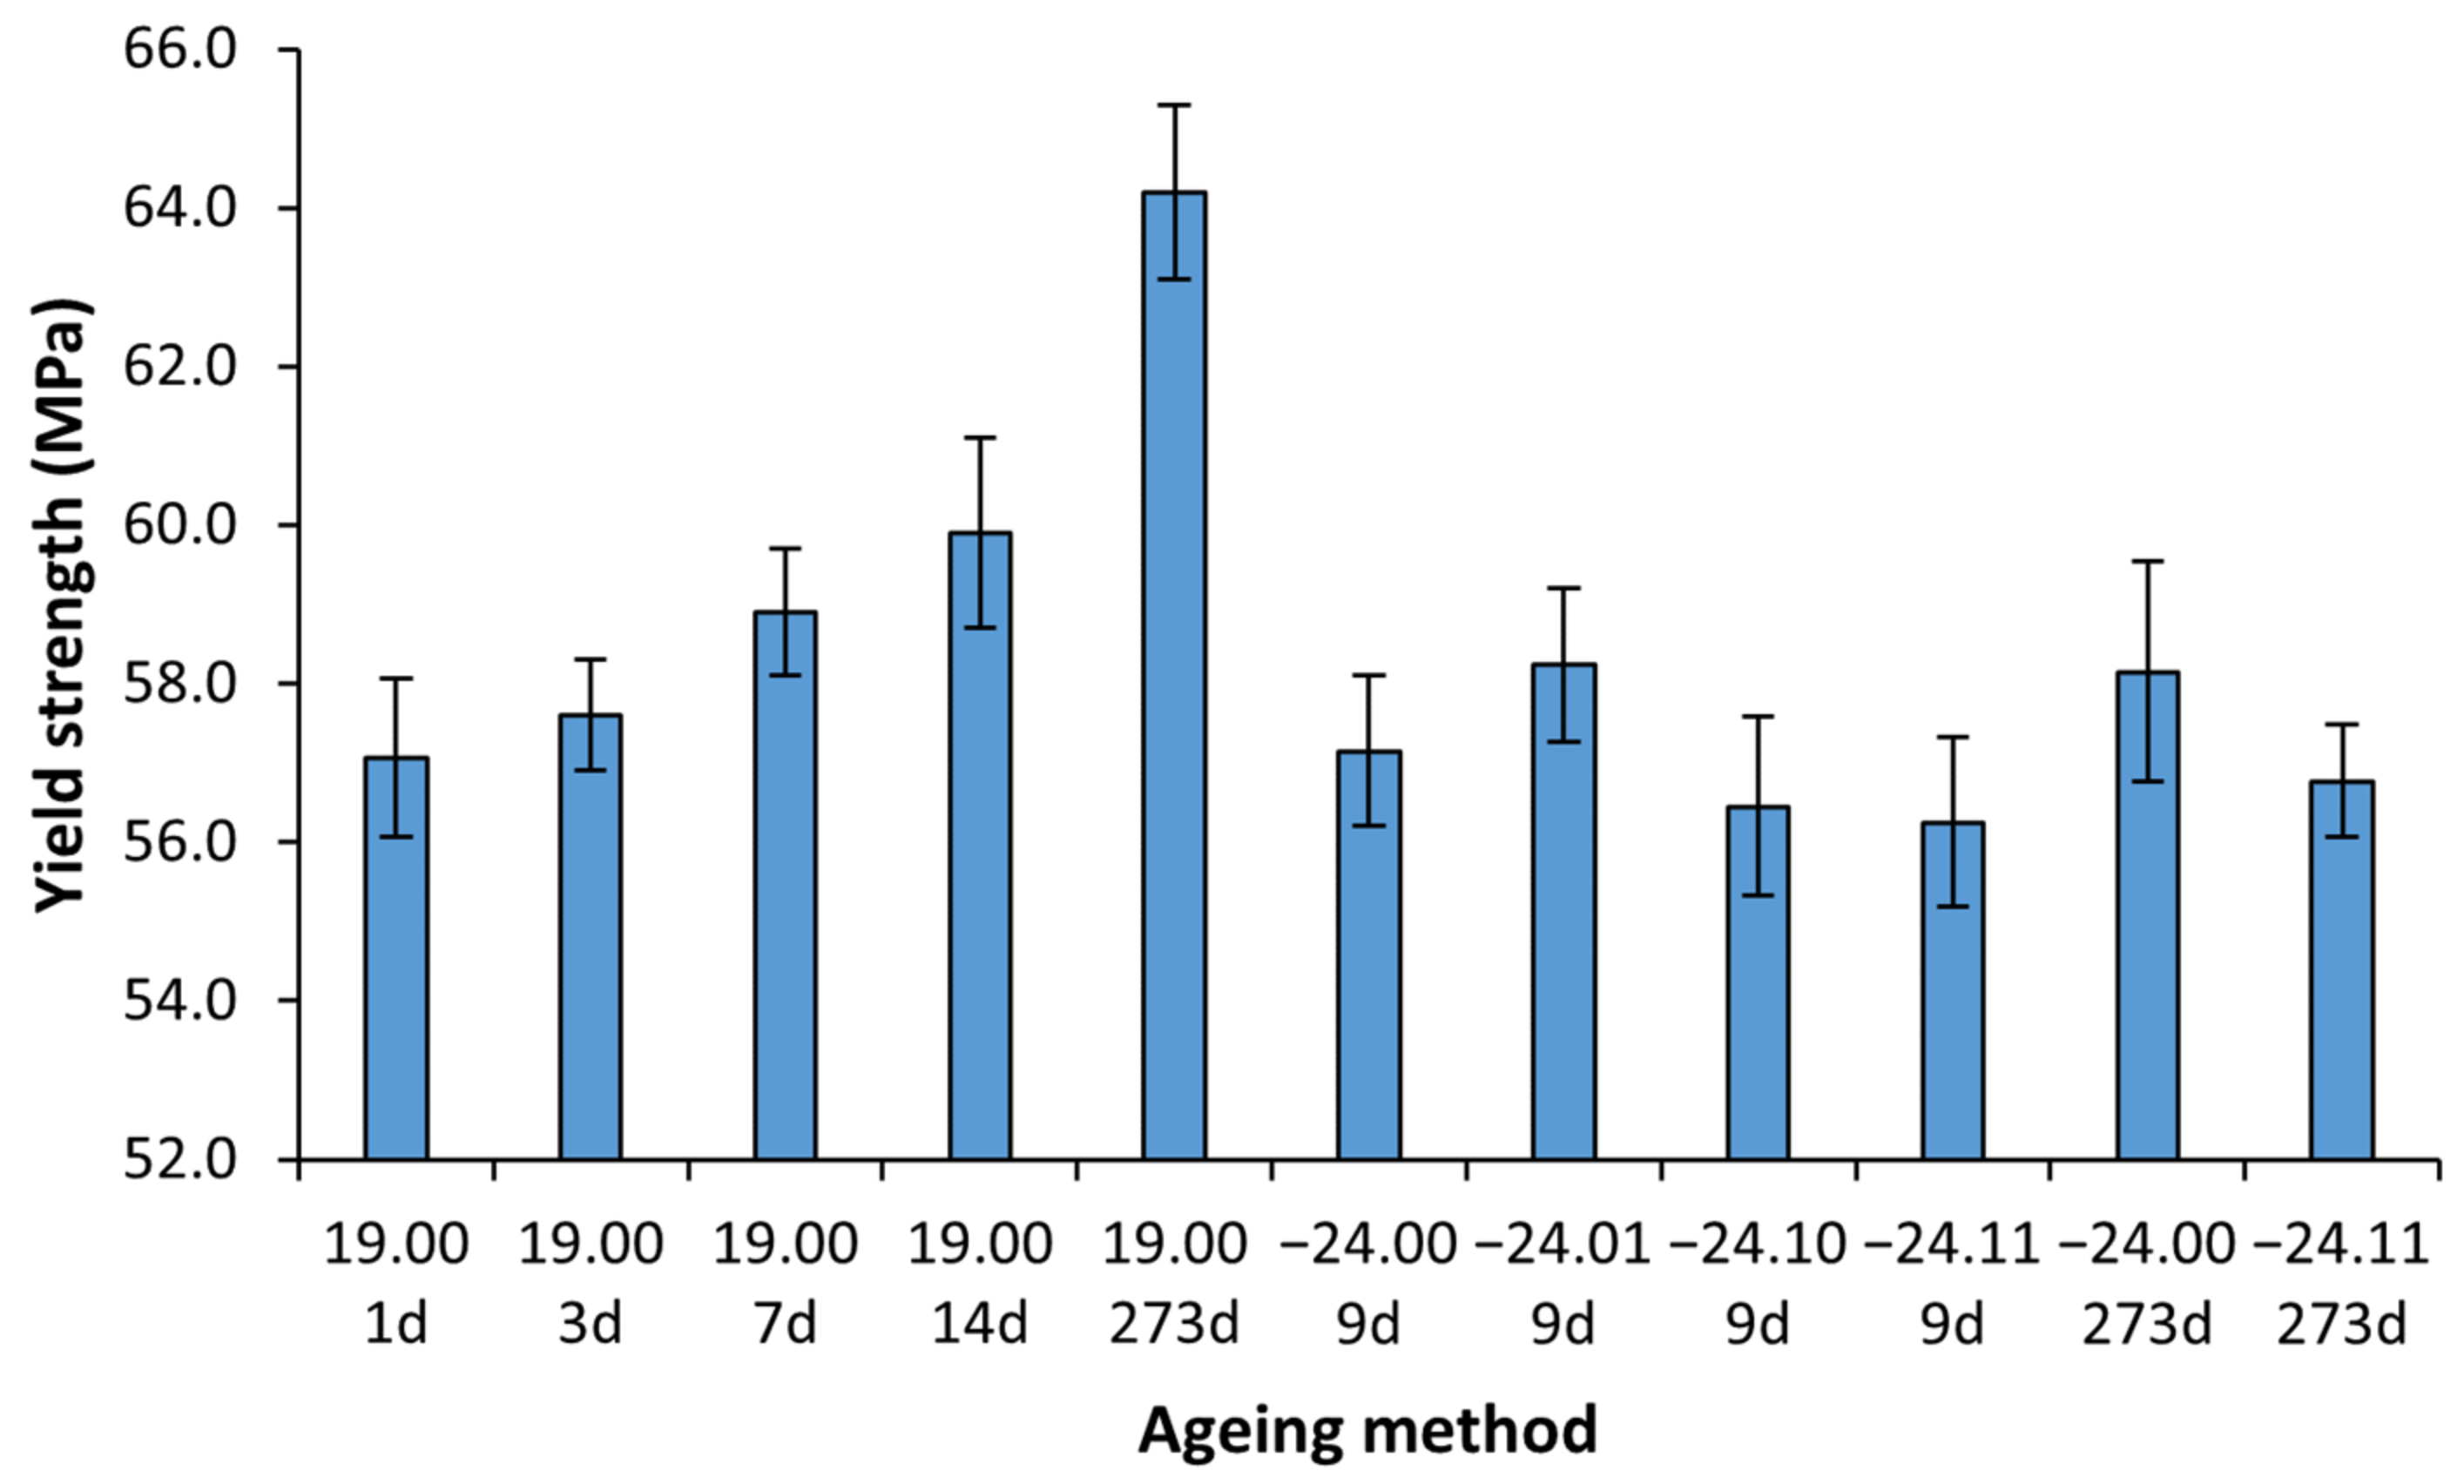
3.3.1. Yield Strength
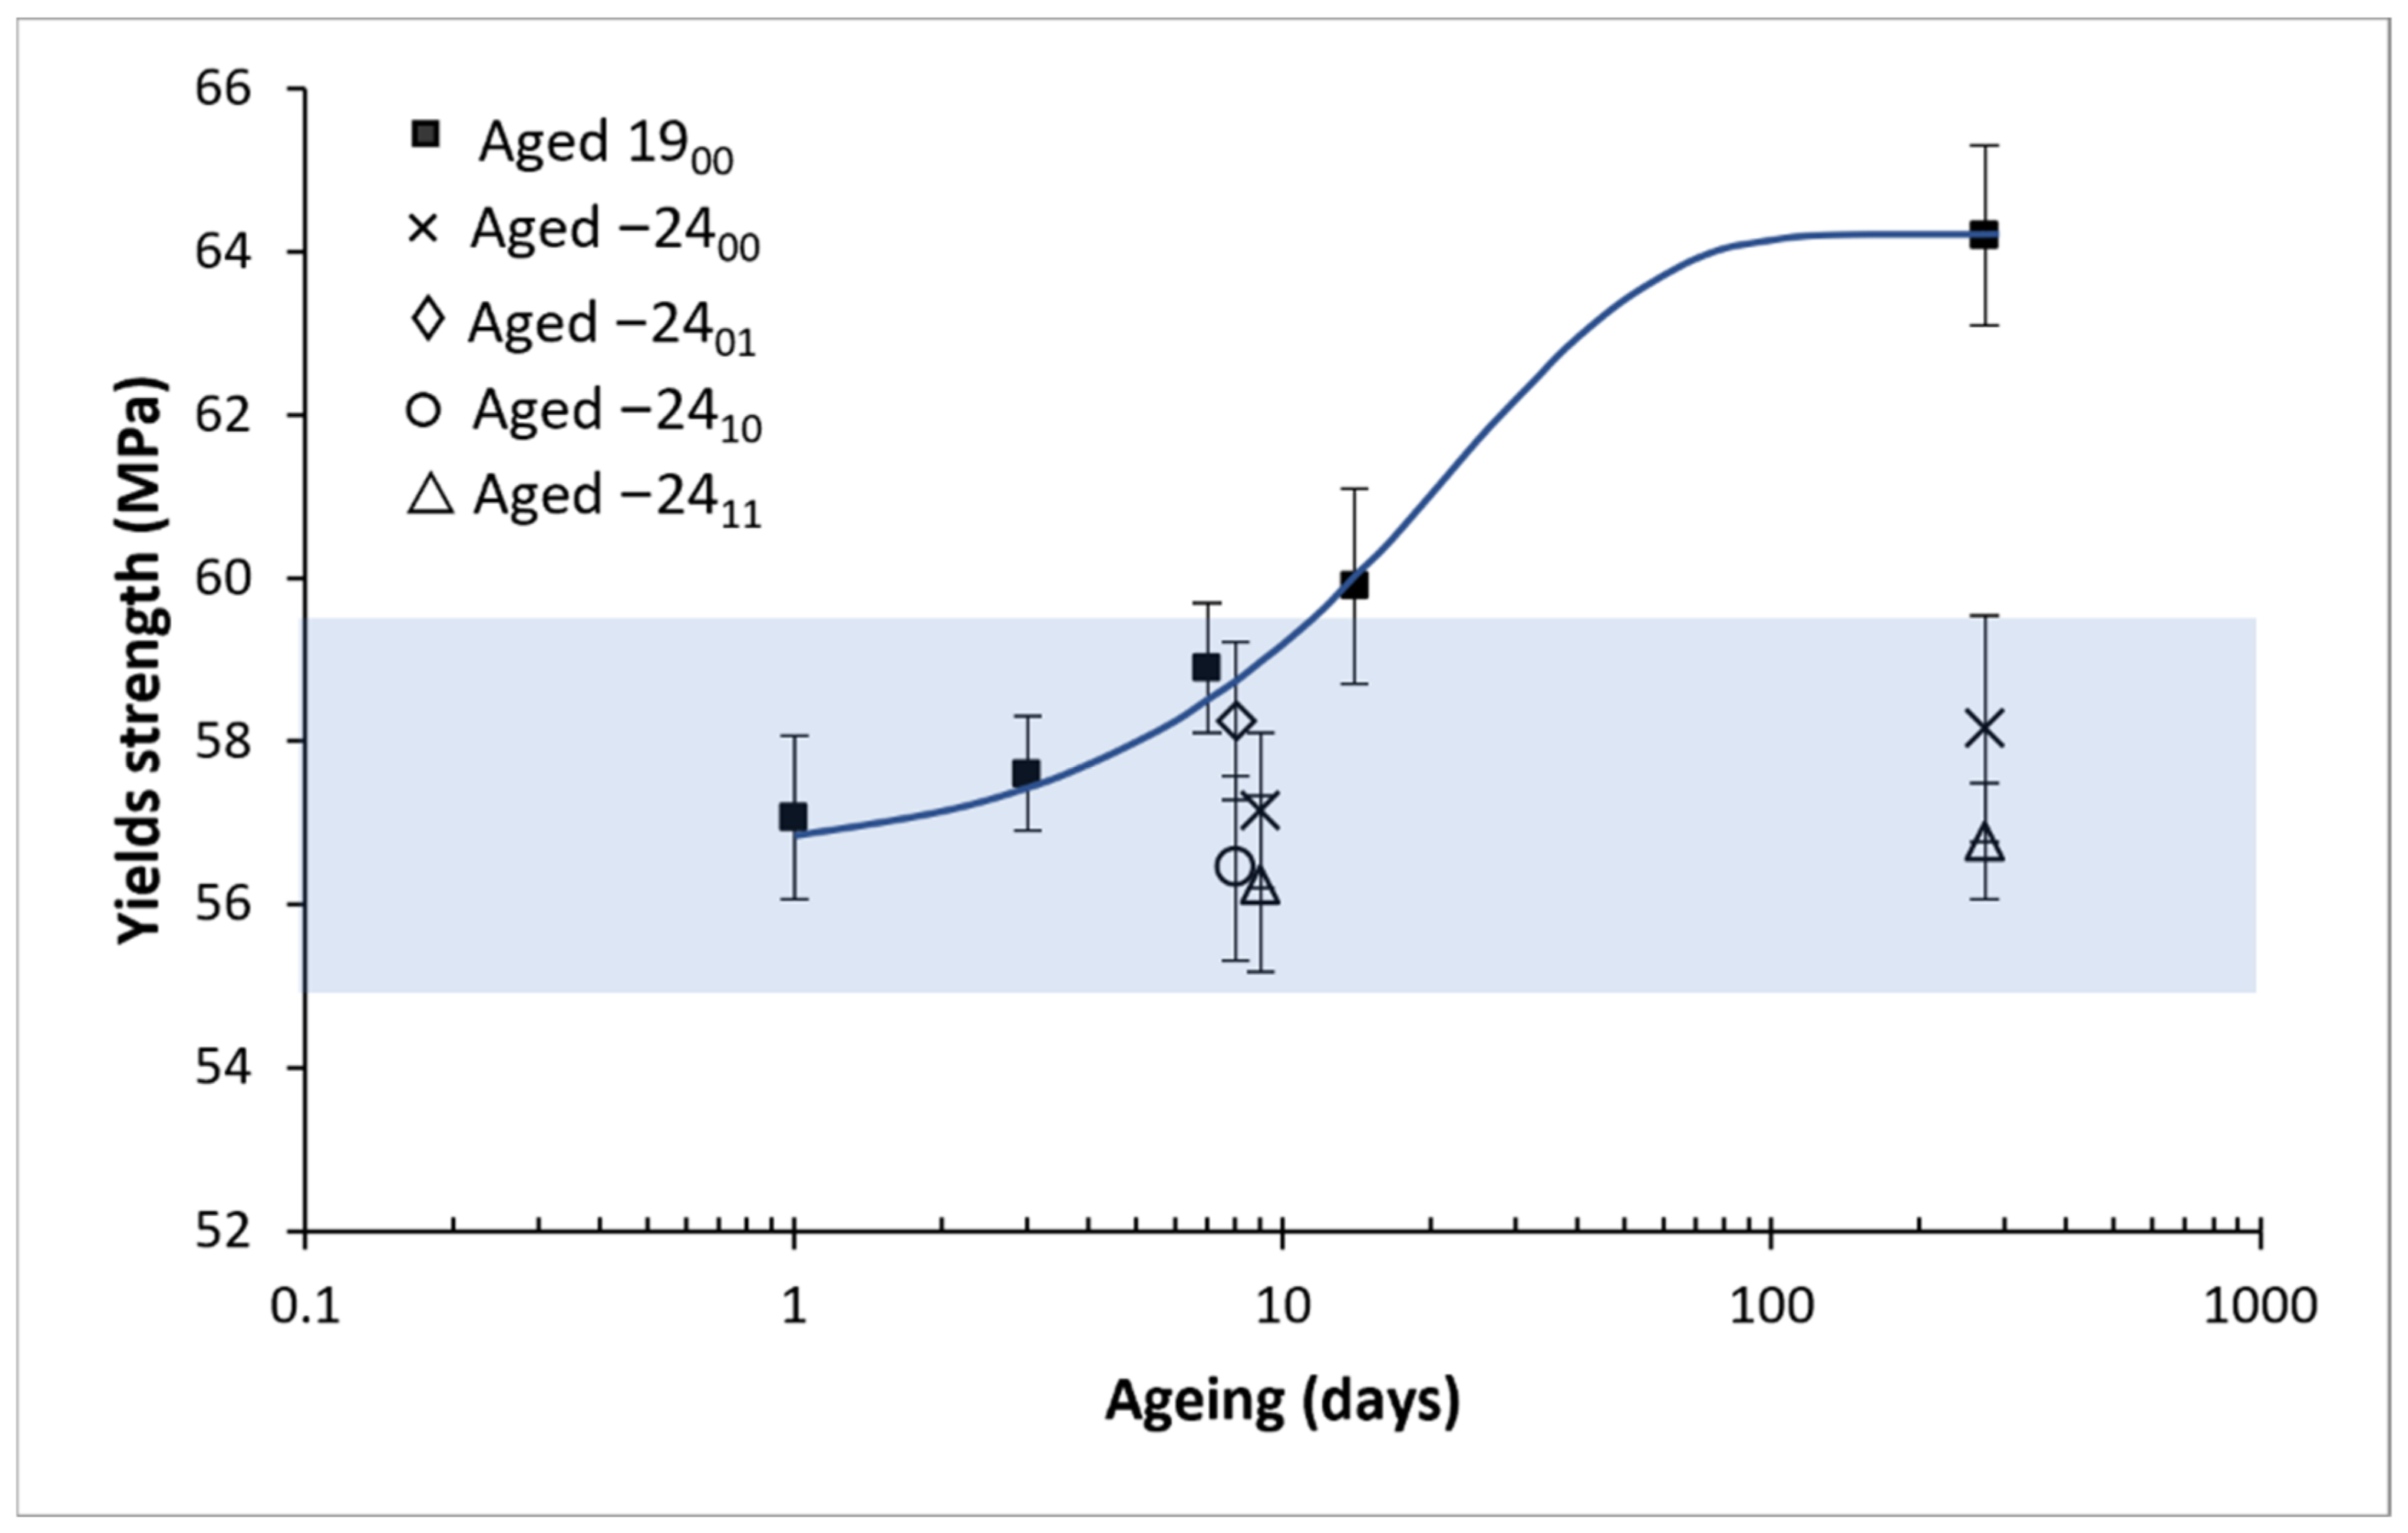
The values of the yield strength measured for the different aged samples at other times are shown in Figure 8. A logistic fitting, as developed in our previous study [24], was made on the PLA aged at room temperature, obtaining the following parameters: A = 0.132; B = −0.0477 days−1; = 64.2 MPa, where A is the ageing potential, B is the ageing rate and is the property at an infinite time of ageing corresponding to the steady-state, obtaining the following constitutive equation:
where is the yield strength in MPa, and t is the ageing time in days. The yield strength results and the Equation (1) obtained from the logistic fitting are represented in Figure 8. For a better visualisation to compare the data between the different ageing methods, a bar diagram is provided in Figure 9.
From the logistic fitting shown in Figure 8, it can be observed that the stabilisation times are expected to be around 100 days, which is coherent with our previous work [24]. Regarding both Figure 8 and Figure 9, it is observed that the yield strength has remained stable for the frozen samples concerning the properties at one day of natural ageing after being printed, as expected from the DSC results in which it is shown that the material is not ageing at −24 °C. However, it has also been observed that the freezing and defrosting process, with or without desiccant, has not damaged the samples, something critical that could not be assessed with the previous results from the DSC.
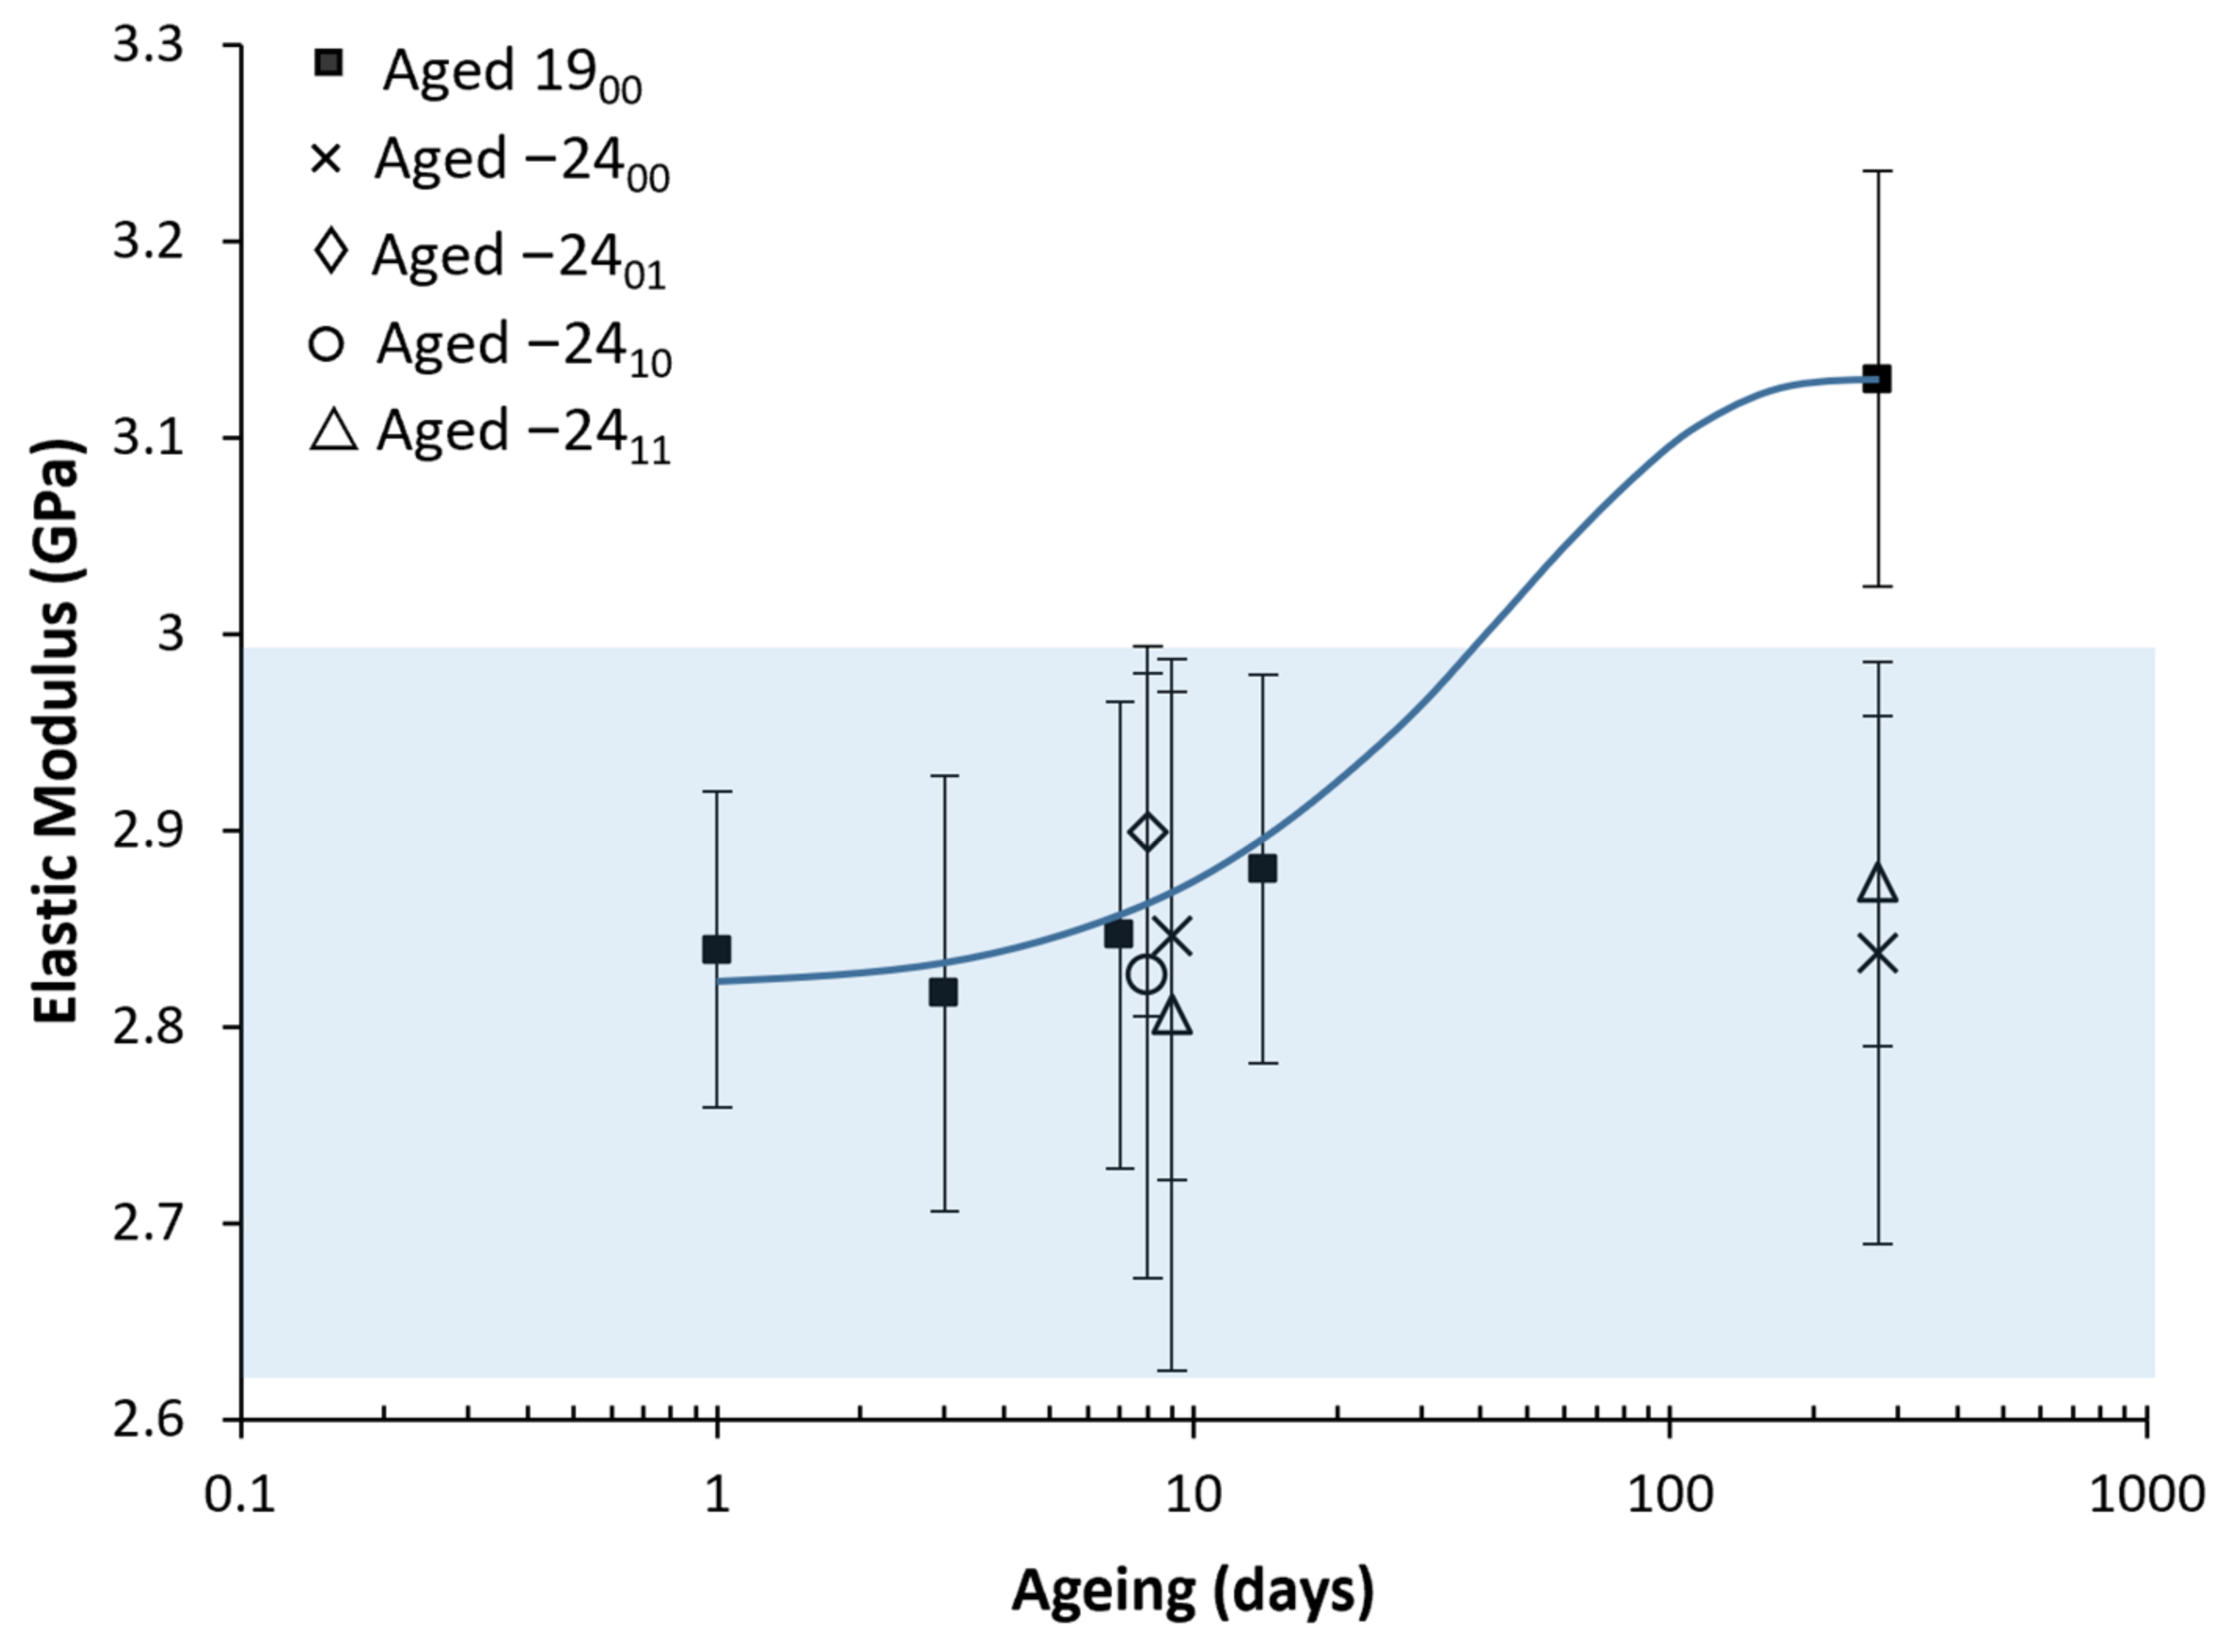
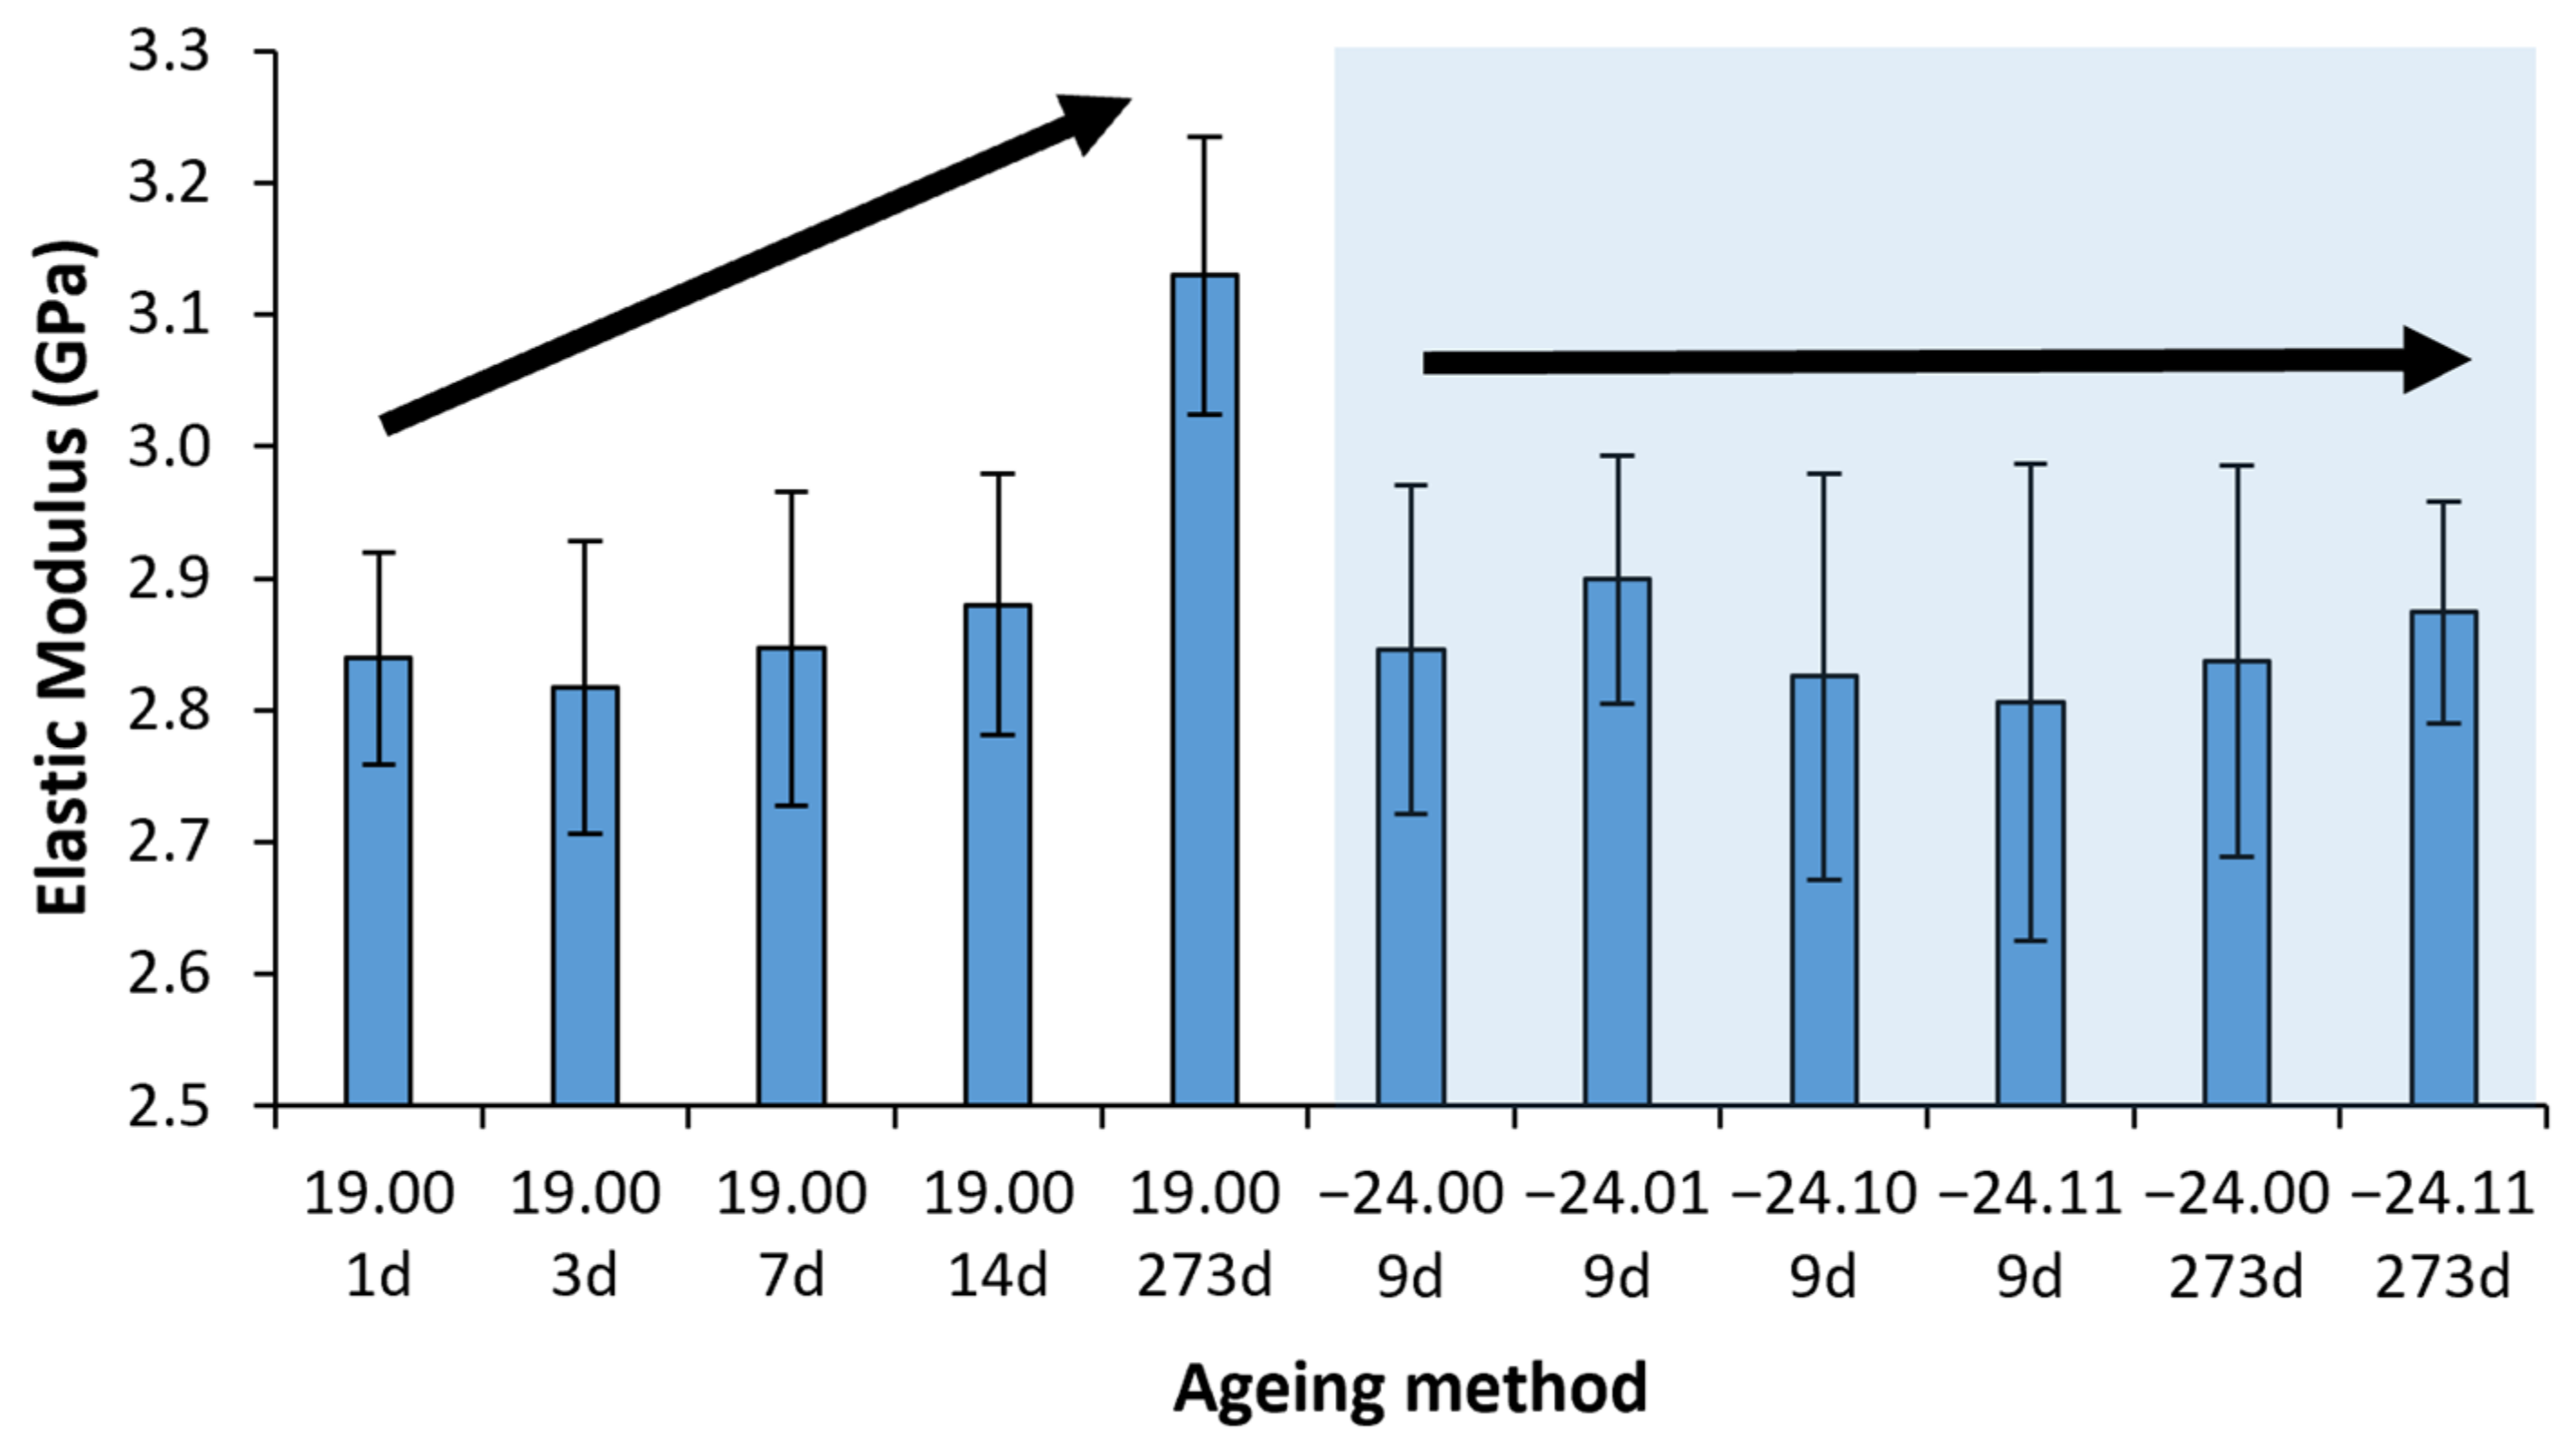
3.3.2. Elastic Modulus
The following results were obtained regarding the Elastic Modulus, shown in Figure 10 and Figure 11. Again, the results were adjusted to the logistic fitting developed in [24], obtaining parameters: A = 0.113; B = −0.023 days−1; = 3.13 GPa, where A is the ageing potential, B is the ageing rate and is the property at an infinite time of ageing corresponding to the steady-state, obtaining the following constitutive equation:
where is the elastic modulus in GPa, and t is the ageing time in days. The experimental results for the elastic modulus and the Equation (2) obtained from the logistic fitting are represented in Figure 10. For better visualisation and comparison of the ageing-defrosting methods, a bar diagram is provided in Figure 11.
The elastic modulus has remained stable through the freezing processes, independently of the presence or not of desiccant. However, it has increased through natural ageing, coherent with our previous work [24]. Although only a slight increase was observed, this is coherent with the also slight increase in the yield strength, which can be made by directly comparing the ageing potential (A) values on Equations (1) and (2) obtained from the logistic fittings.
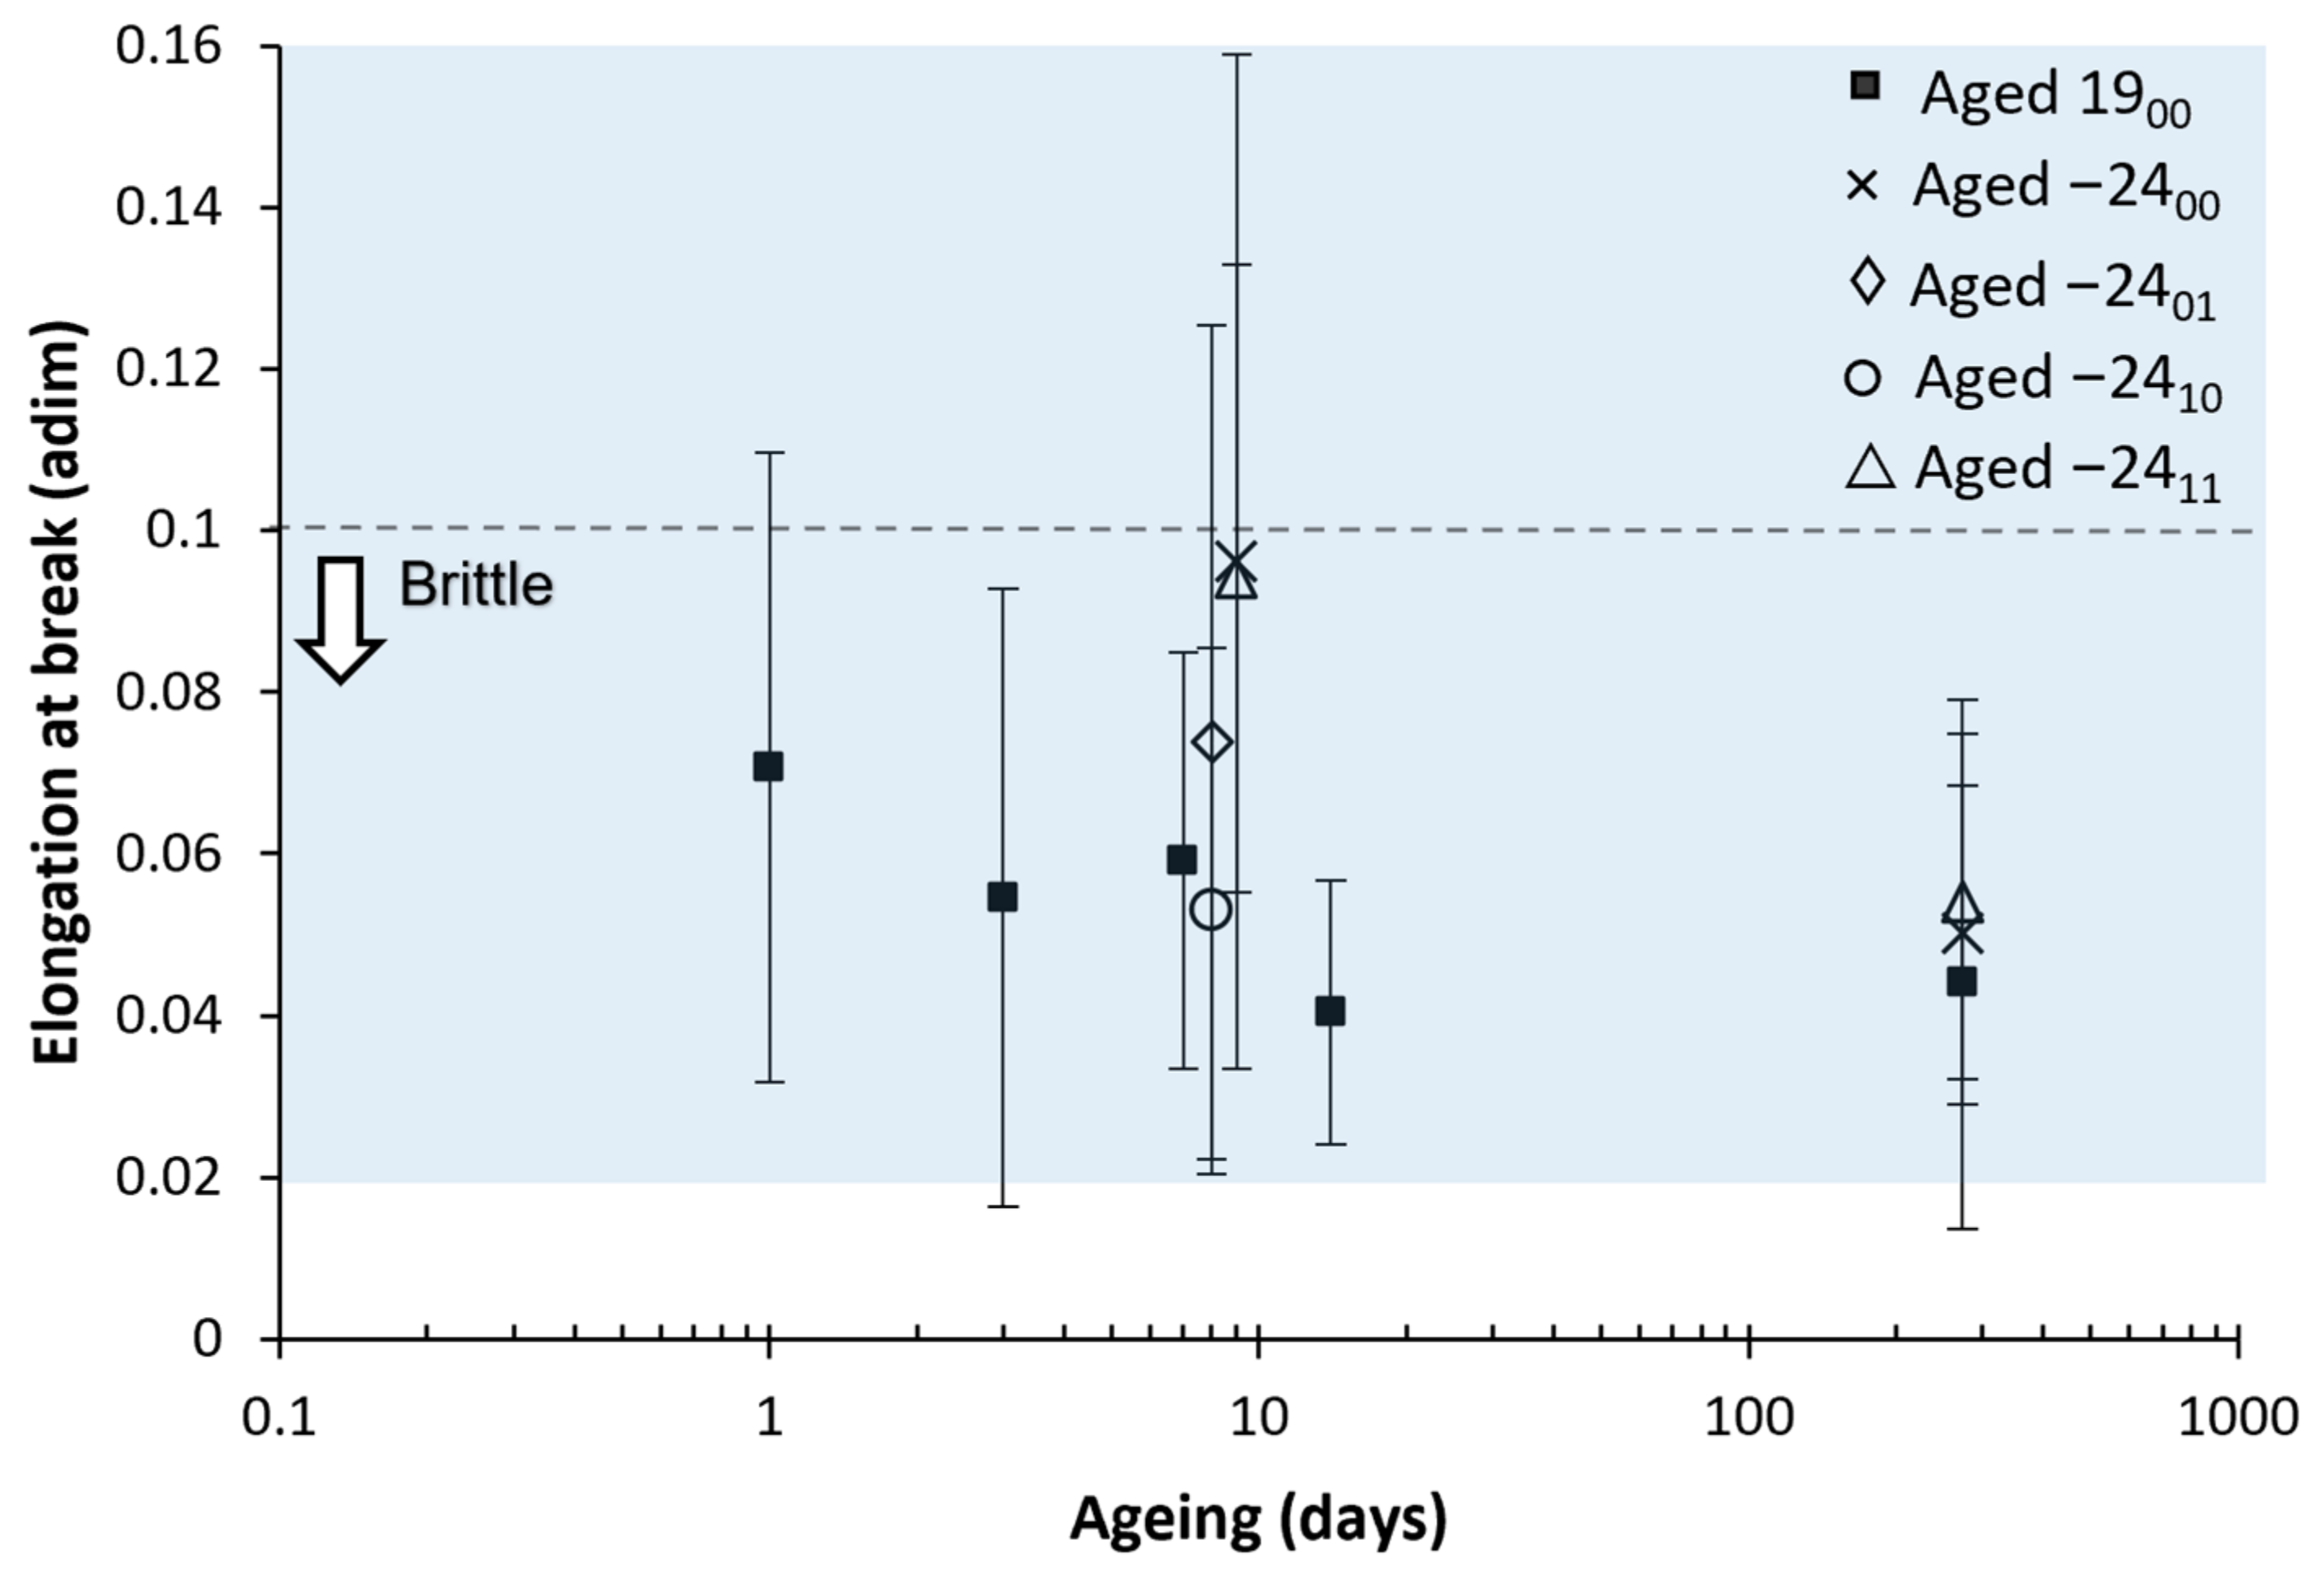
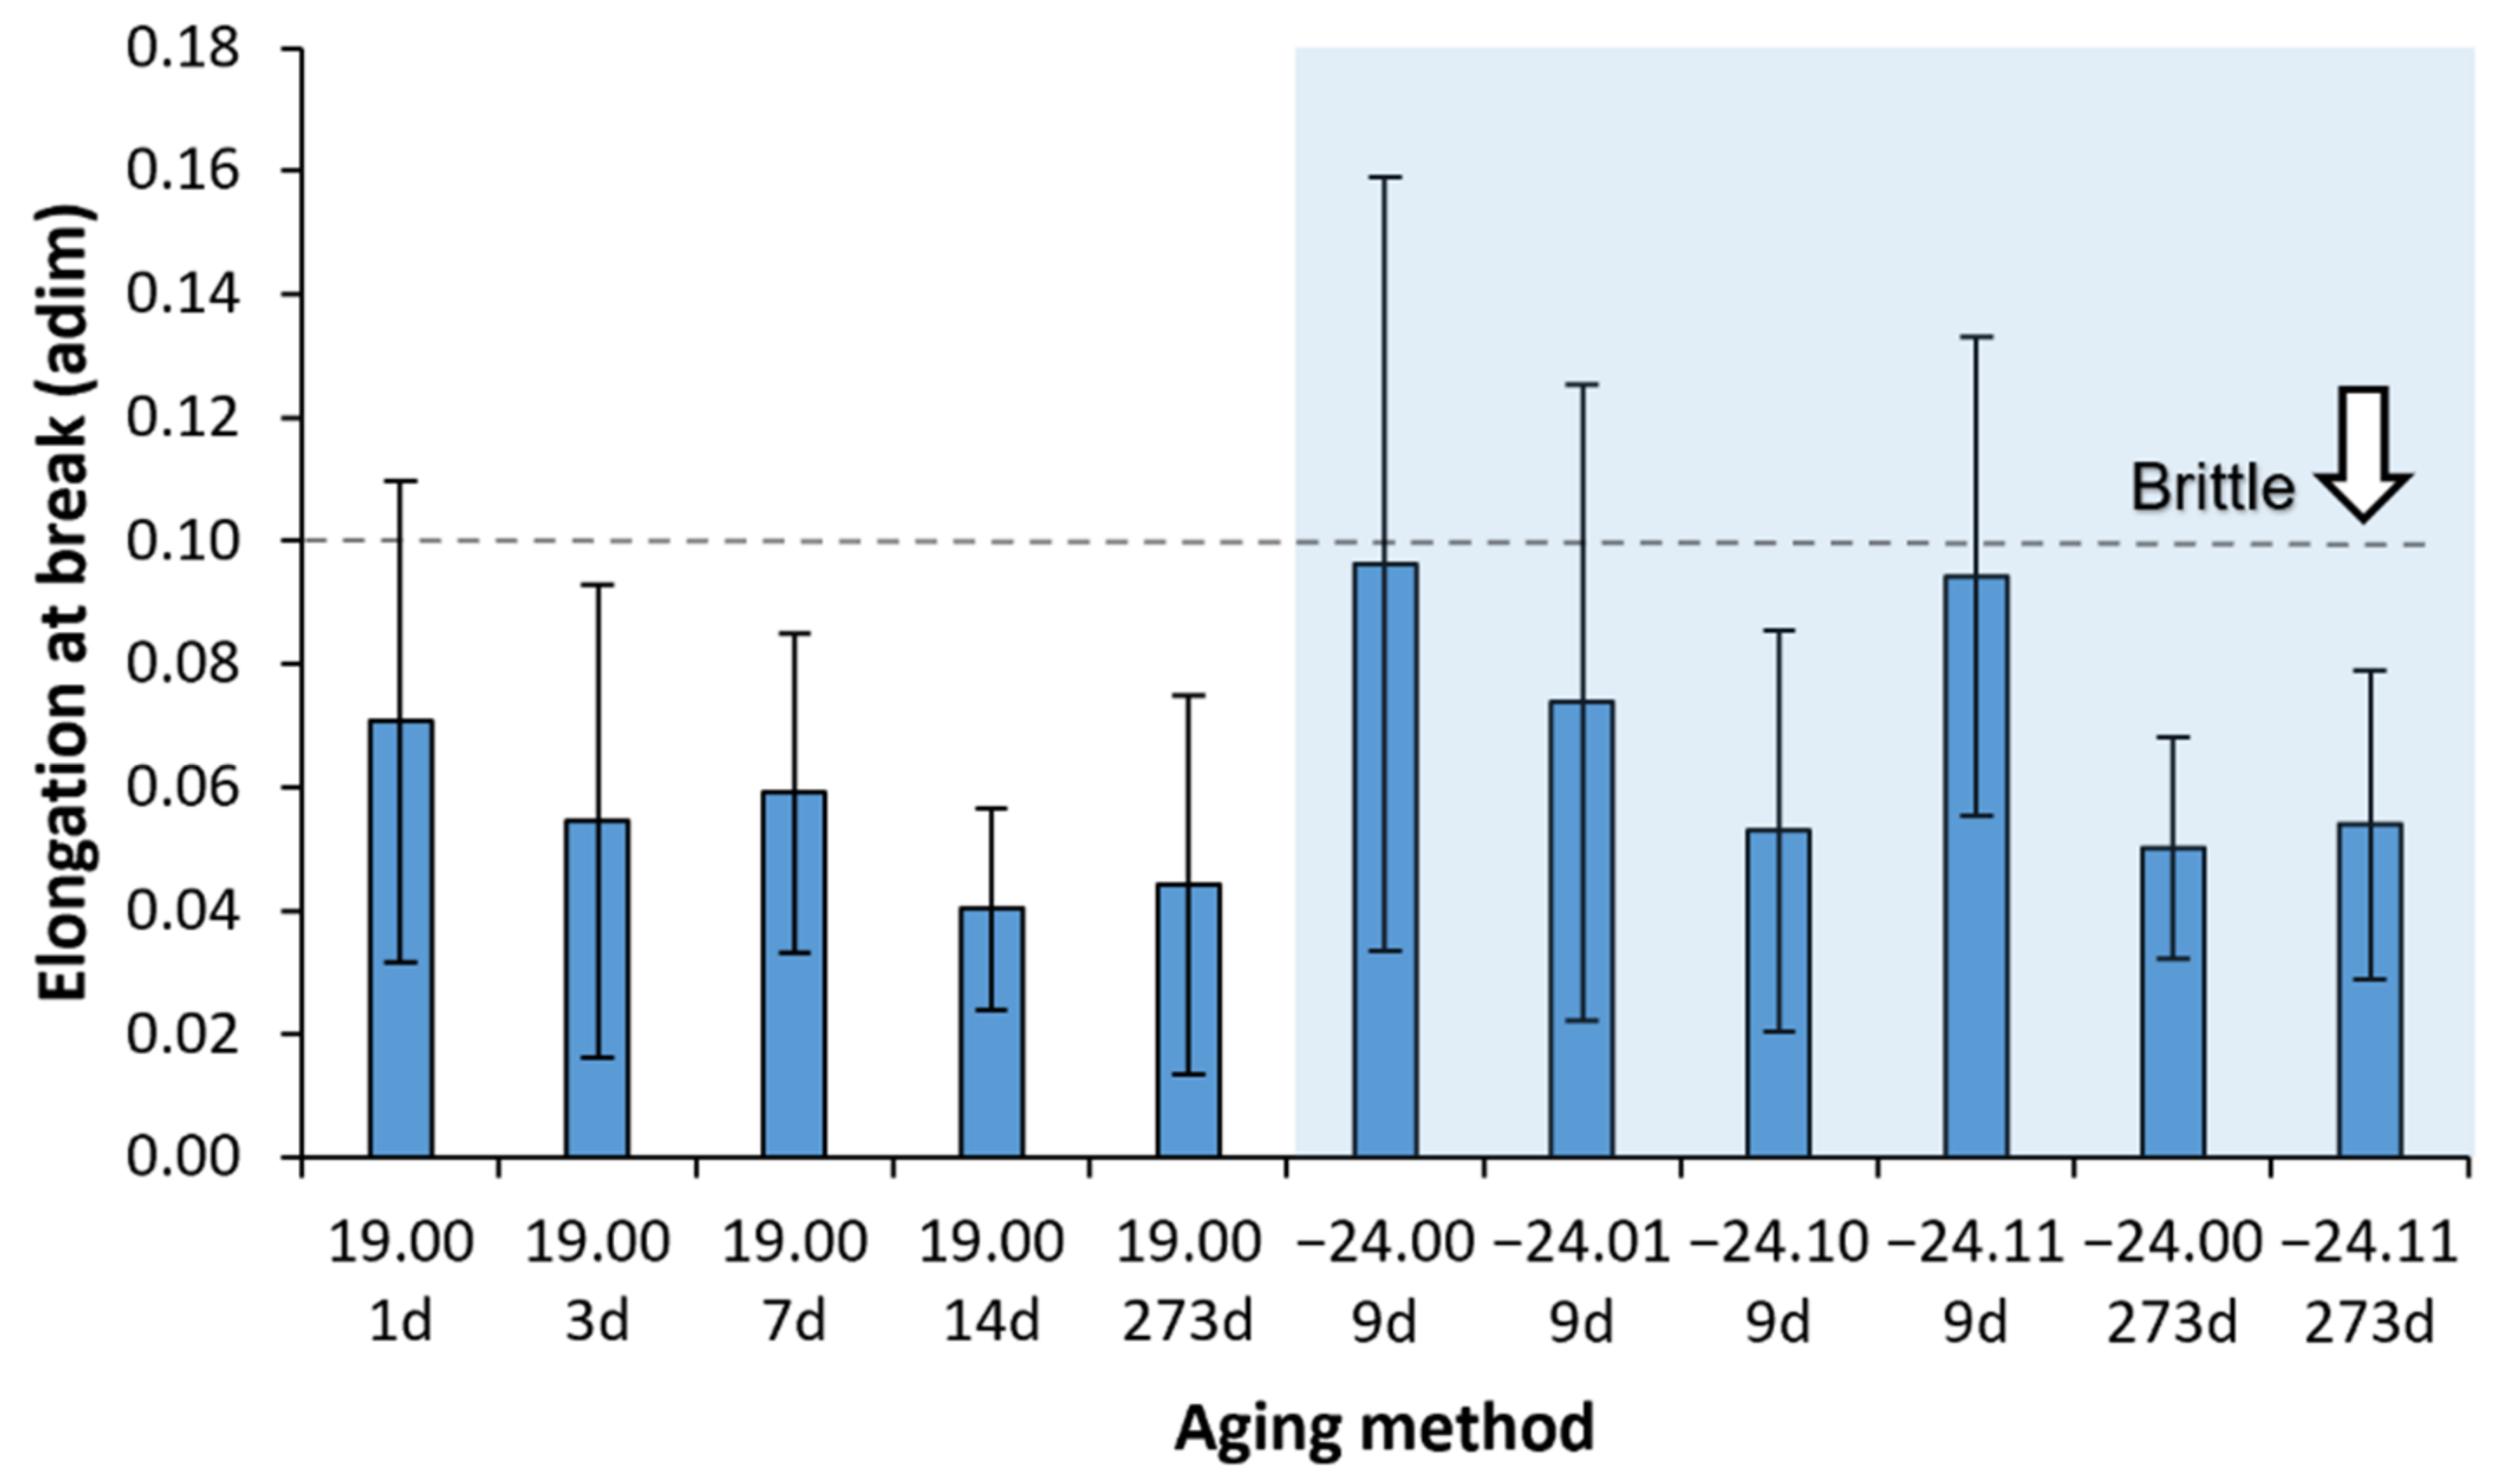
3.3.3. Elongation at Break and Necking Formation
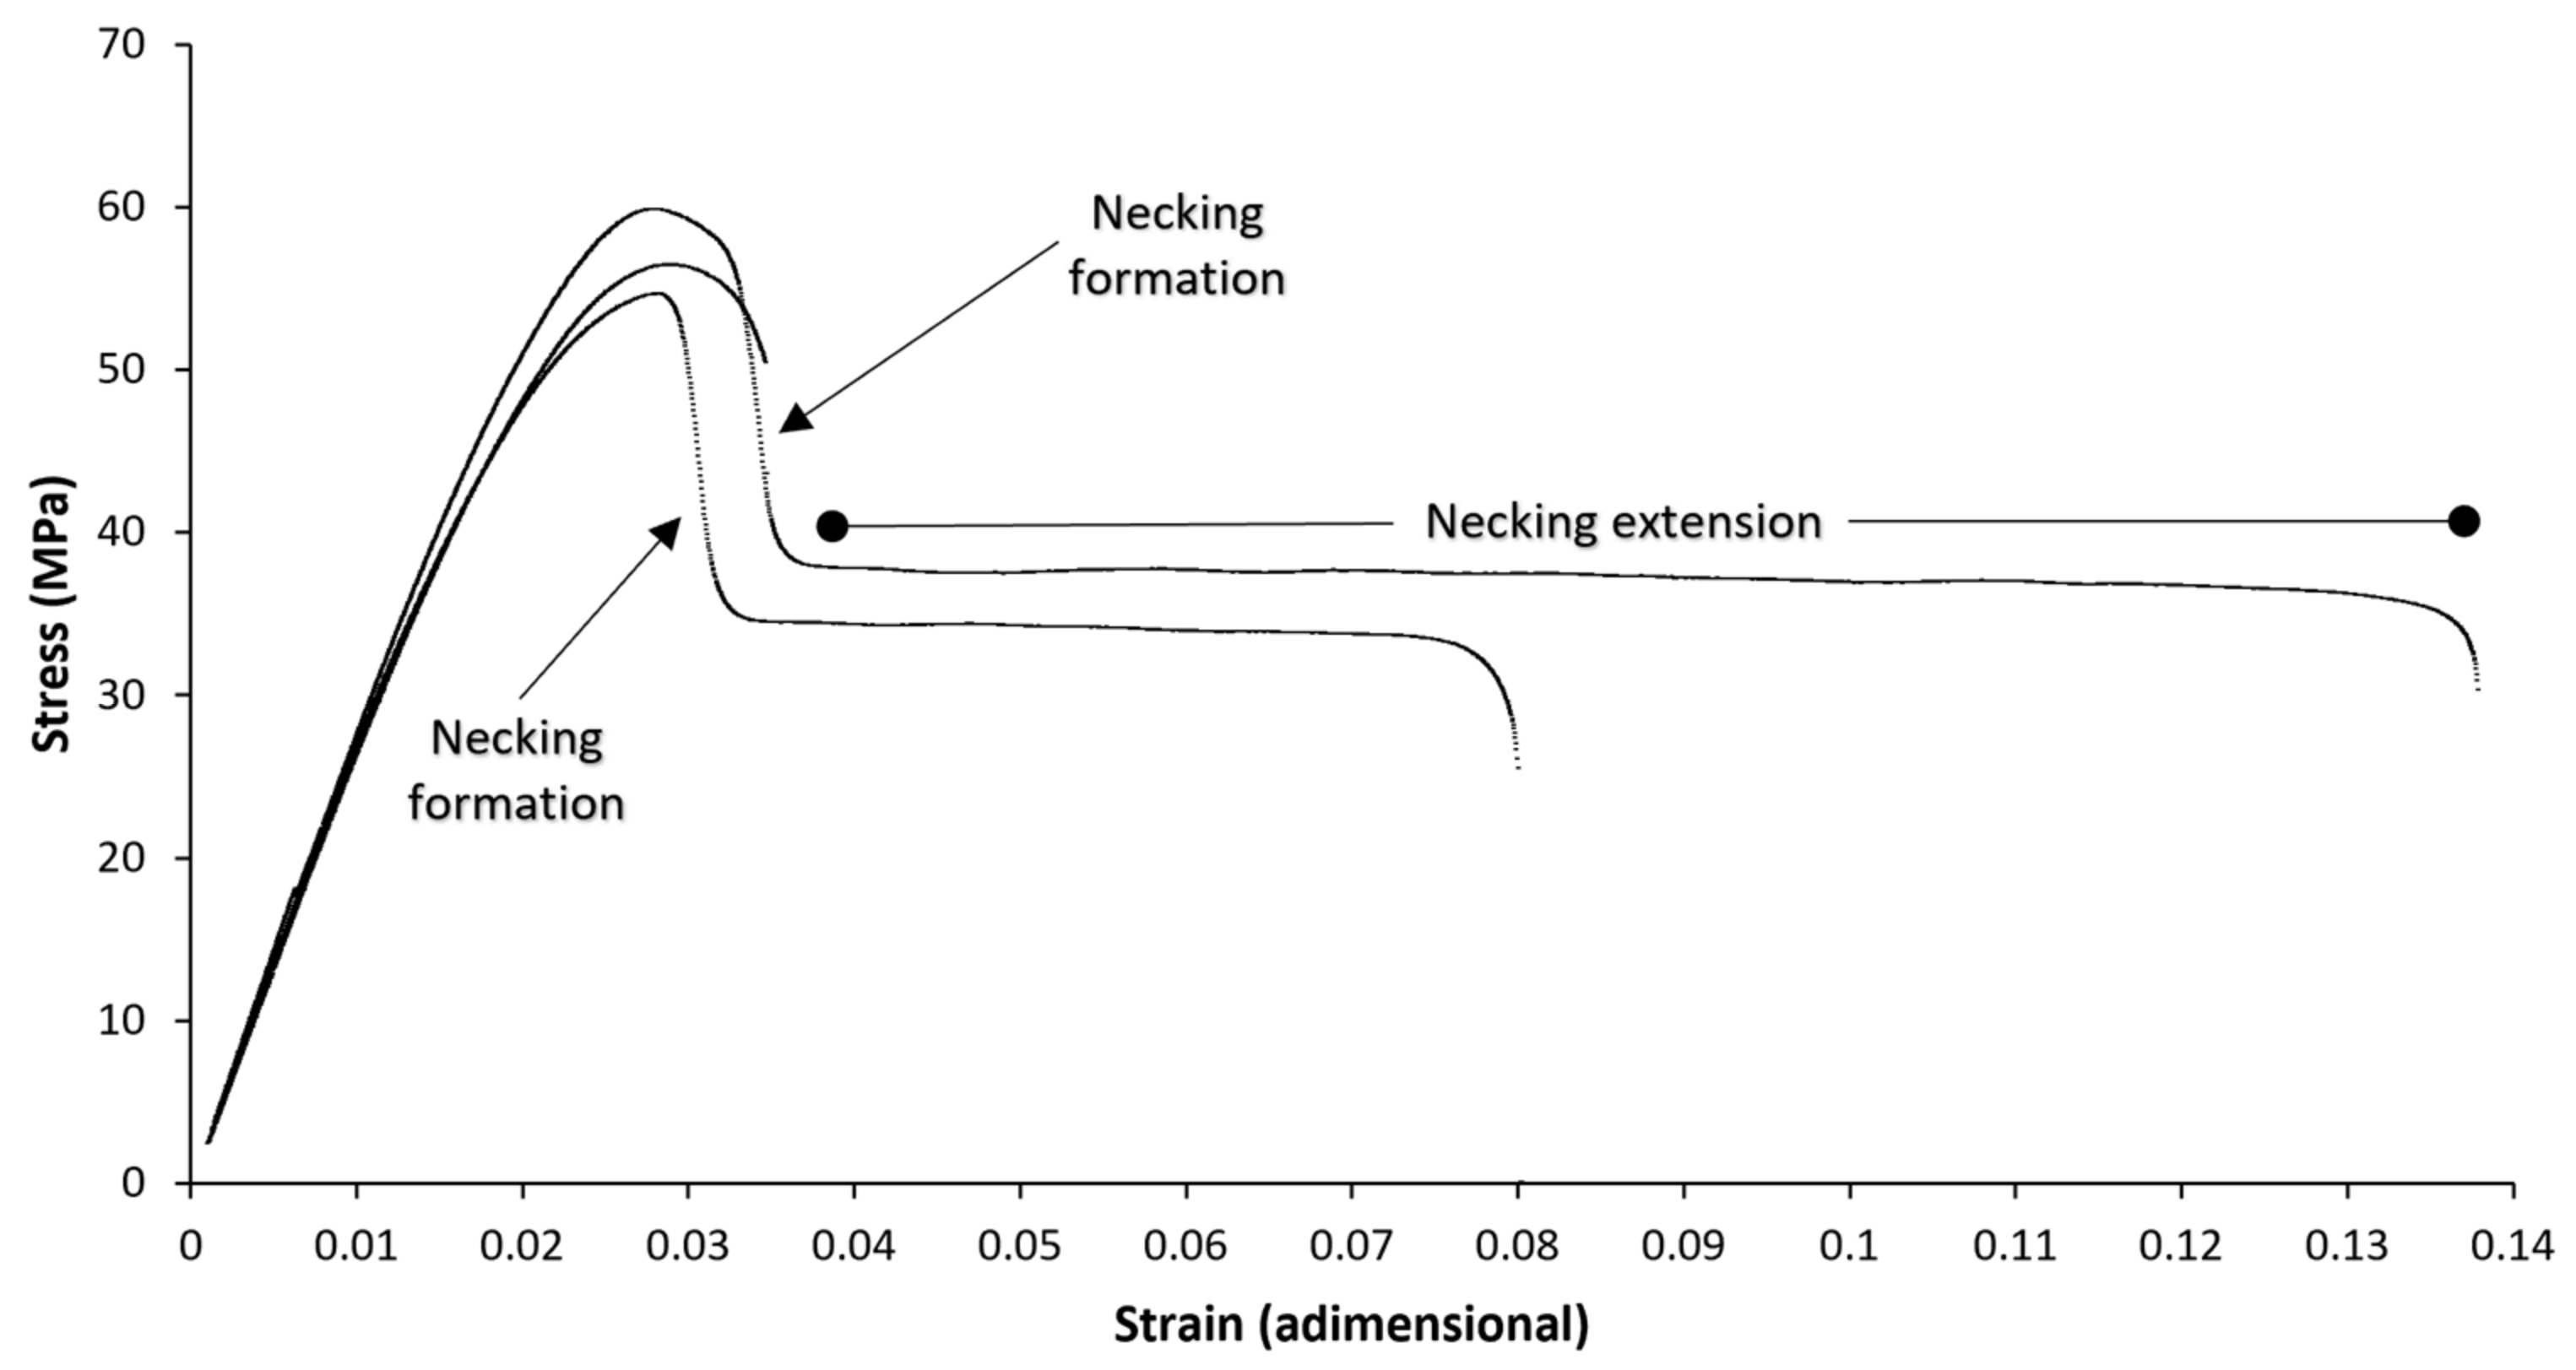
The elongation at break results are represented in Figure 12 and Figure 13. The big error bars observed are related to the formation of a necking. When the necking occurs, the elongation at break extended from 3% (0.03) up to 17% (0.17) in this study. Although the necking is useful in the practice for easily detecting a damaged component before it fails, it is a handicap for precisely determining the elongation at break. An example of a tensile test with necking is presented in Figure 14 to visualise the error induced by the necking. PLA is a fragile material, with typical elongation at the break below 10% (0.10), coherent with our results presented. However, the formation or not of a necking was studied to provide further information.
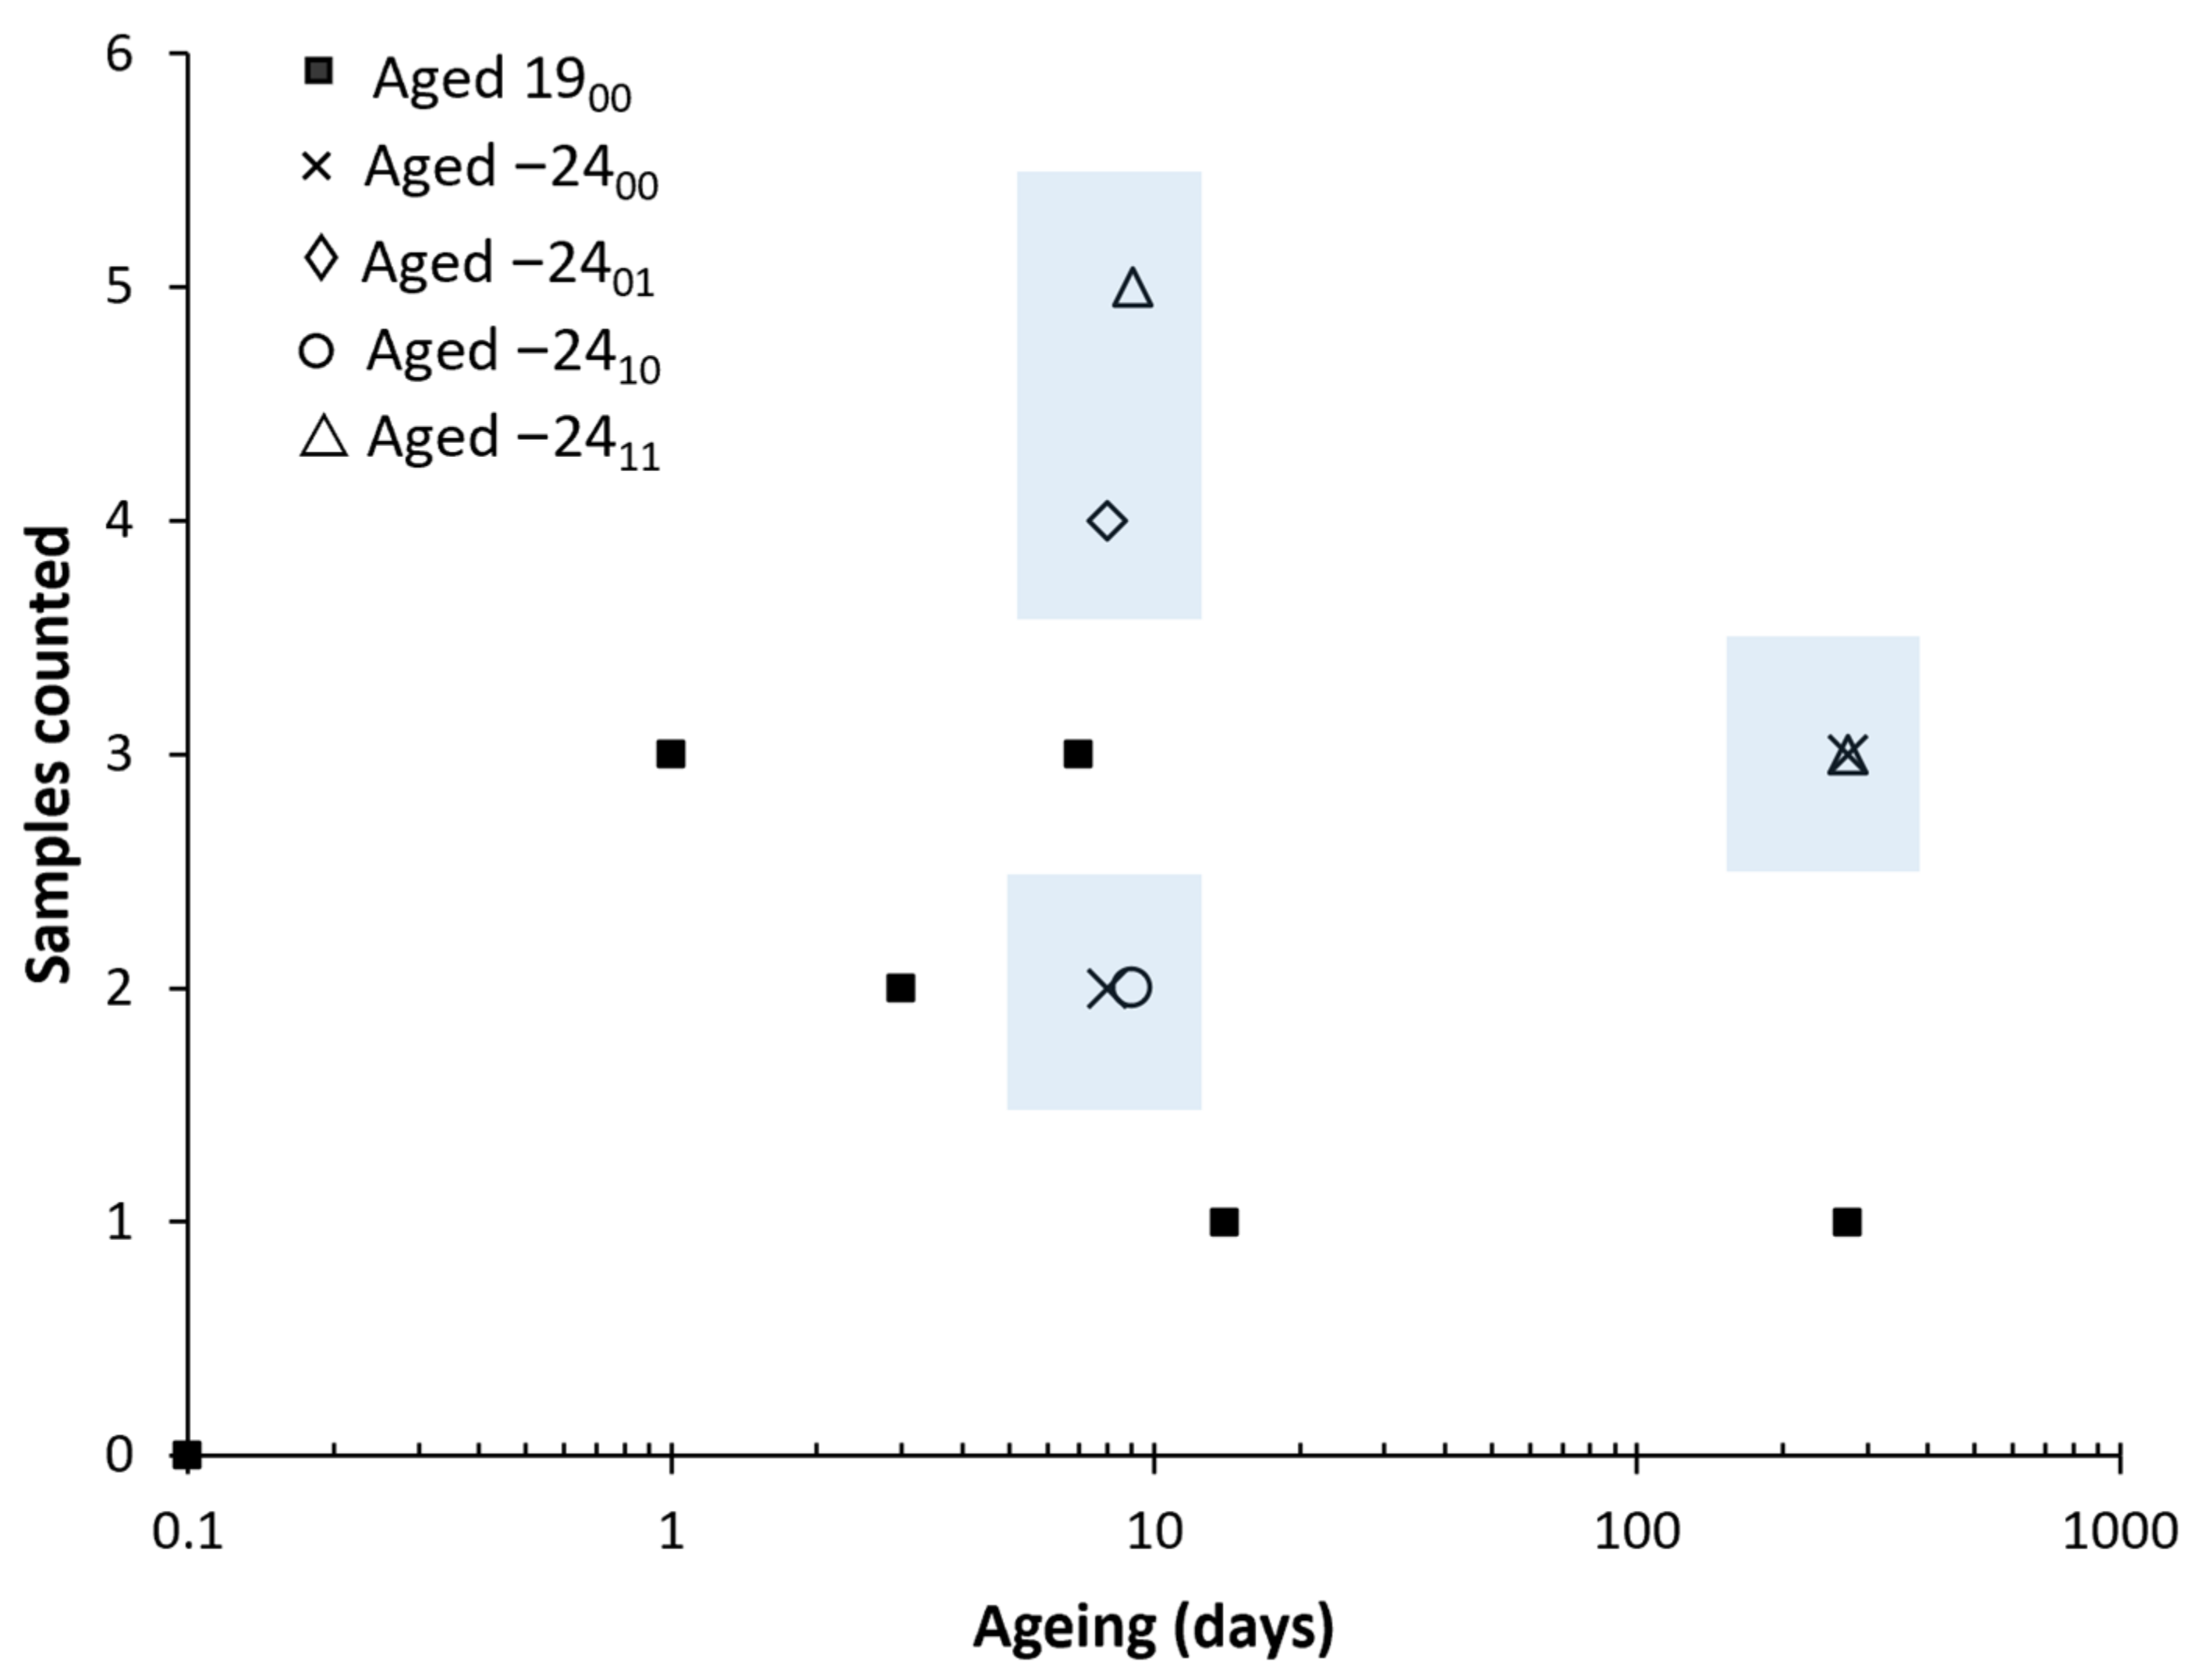
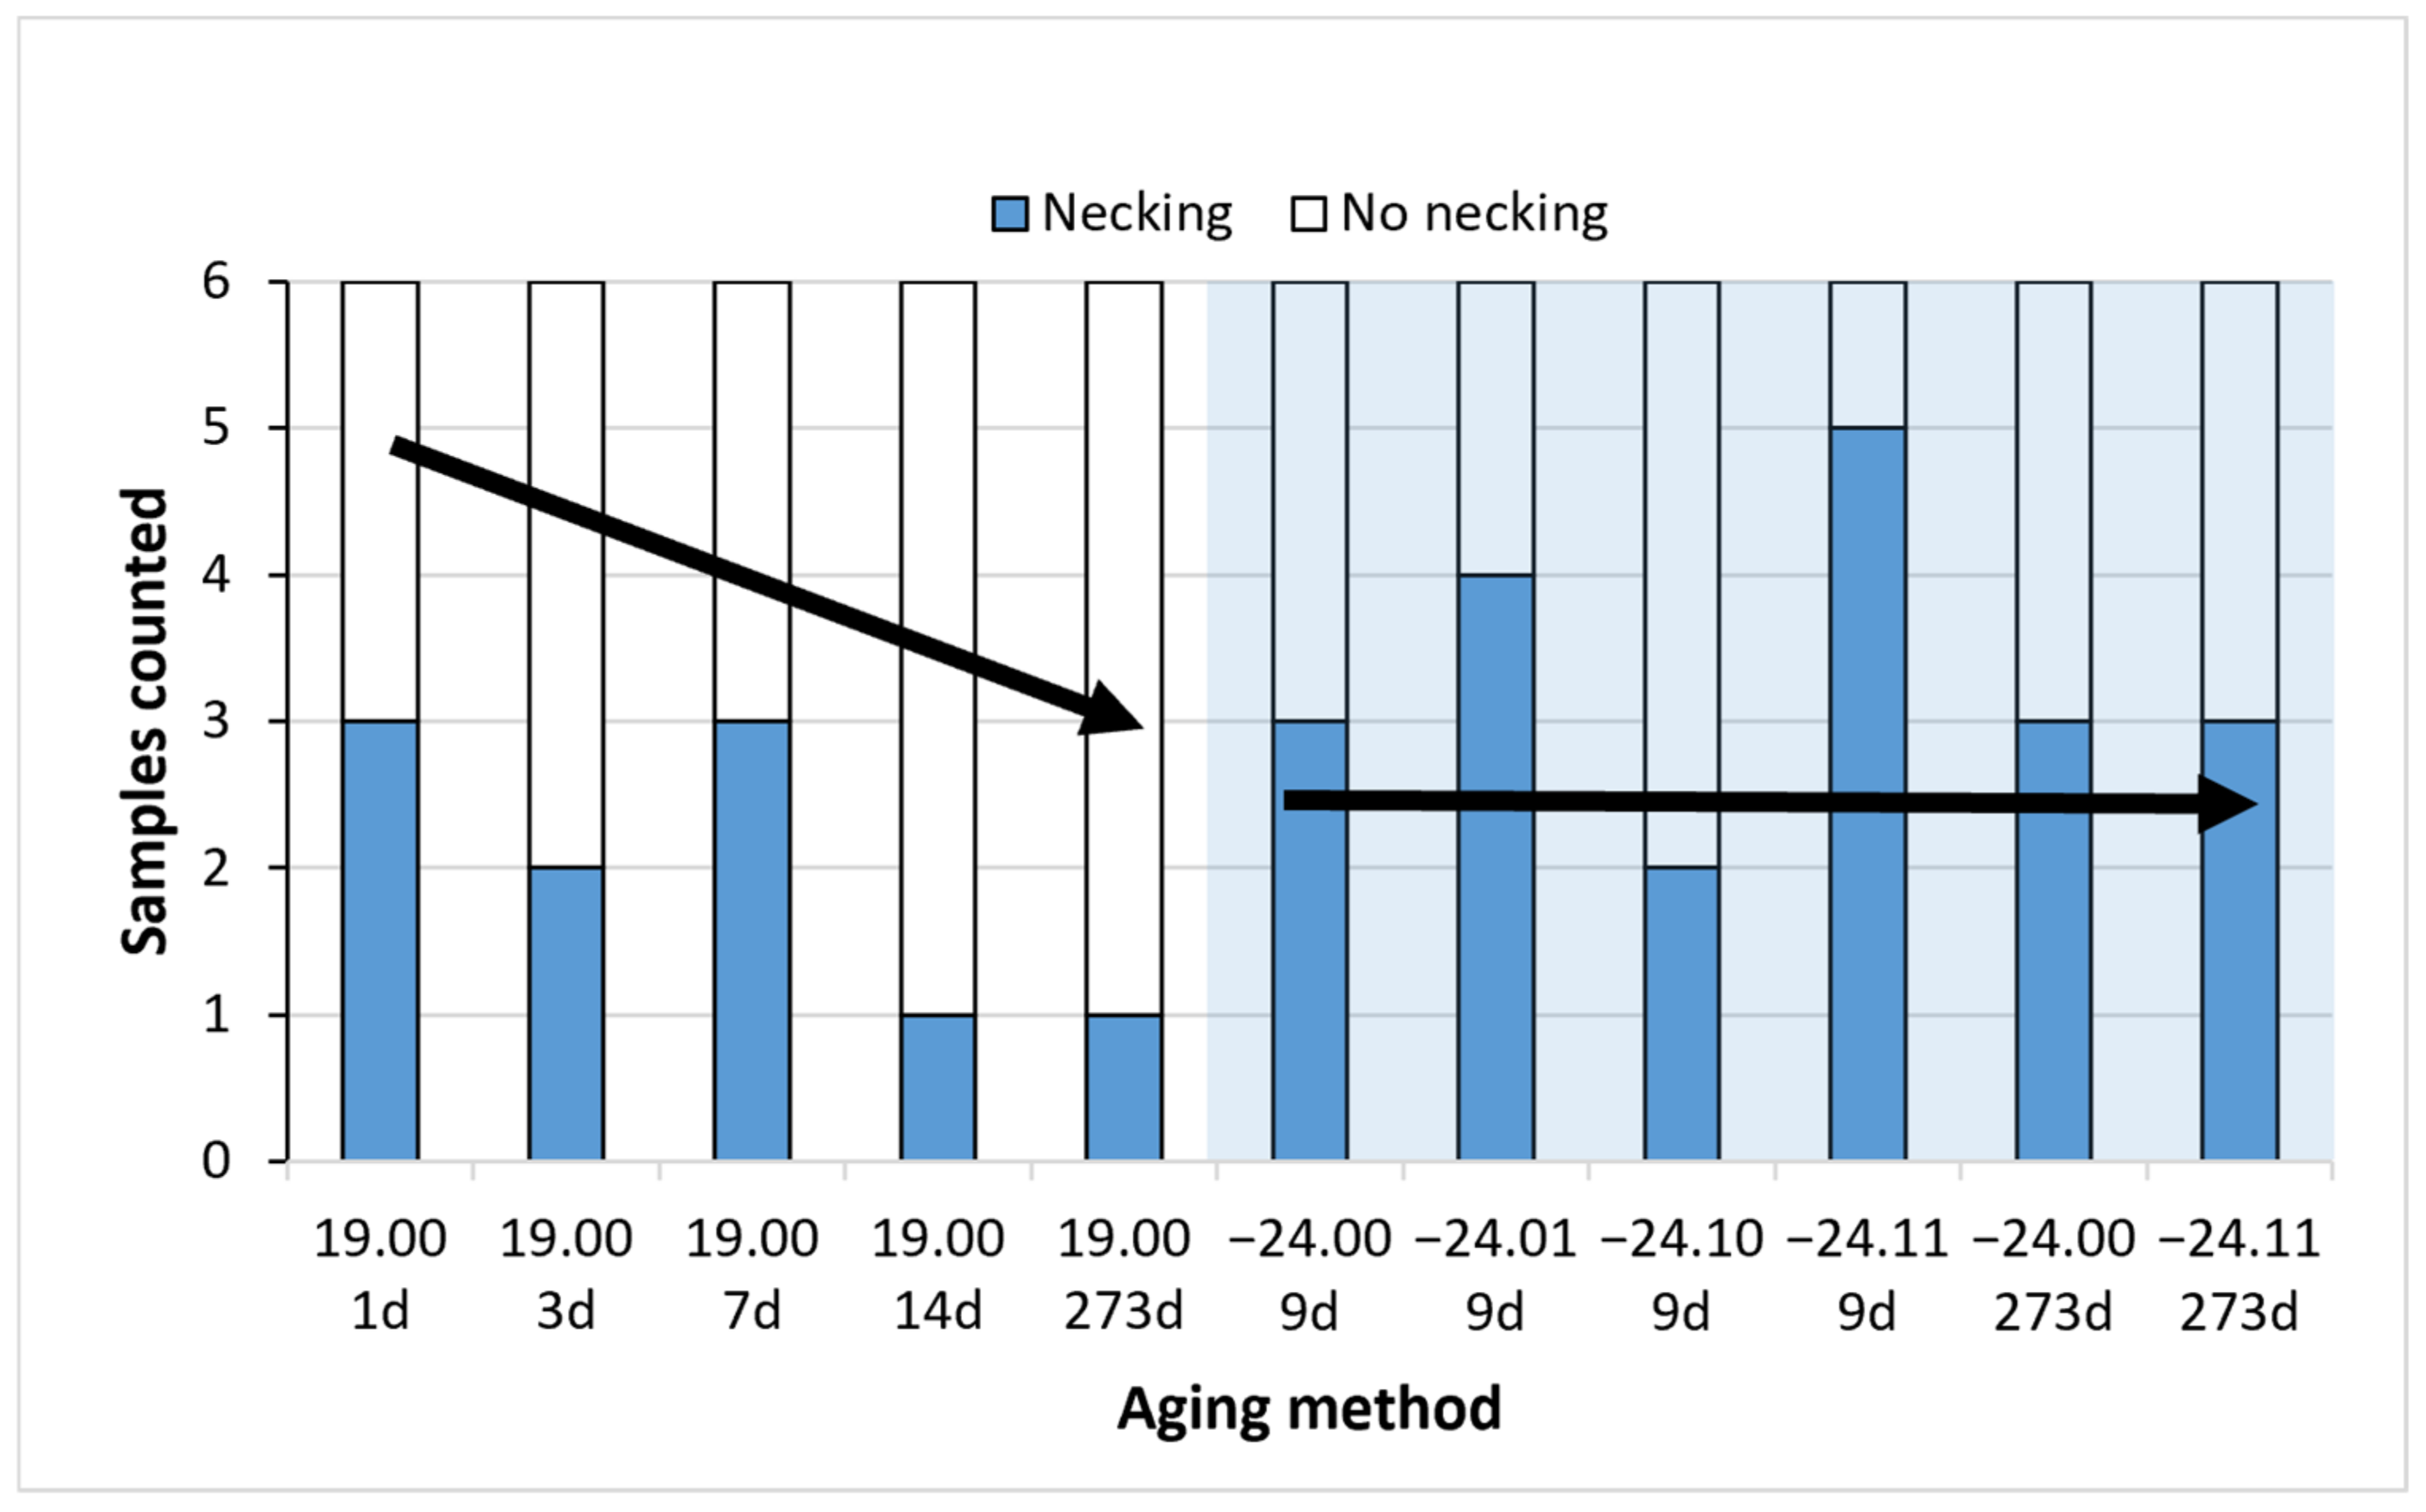
As necking formation has induced this high standard deviation values on the elongation at break, the number of samples that presented necking was counted. This is motivated as necking formation is less likely to happen on aged samples from our experience in our previous study [24]. A total of 6 pieces were tested for each ageing condition. The results are presented in Figure 15 and Figure 16.
It can be observed how natural ageing decreases the formation of the necking. Samples aged at room temperature up to 14 days and 273 days showed only one necking on one of the samples. However, on the frozen samples, almost all the ageing times have shown three or more samples with necking. This clearly indicates that the formation of the necking, related to the microstructure of the PLA and the ease of the polymer chains to move and rearrange during the test, have remained stable with all the freezing–defrosting conditions. This is directly related with the enthalpic relaxation observed in the DSC diagrams.
It is interesting to note how samples aged at 273 days, both aged at room temperature or frozen, demonstrated similar average elongation values at the break. The samples frozen were more prone to form a neck as they had not aged. However, the only neck formed on the specimen at 273 days elongated up to 11%; meanwhile, those necks formed on samples frozen for 273 days elongated between 4% to 9%.
As necking was observed to happen at elongations around 3.0% to 4.0%, it can be observed that a low elongation of the necking has happened on the frozen samples, explaining the similar average value for the stretching. The lower extension of the necking on samples frozen up to 273 days might indicate that there has been some ageing. Still, considering all the thermal and the rest of the mechanical data, the material has remained stable by freezing it. No differences were found regarding the use or not of desiccant.
Although PLA is highly sensitive to relative humidity [31], the humidity levels without desiccant on freezing and defrosting are not crucial for this anti-ageing process. This is an exciting result, as it simplifies the process of stopping the ageing of the PLA by simply freezing the samples at −24 °C inside a zip bag.
Summarising the mechanical properties, they have remained unaltered at −24 °C, and the presence of desiccant has not influenced the results. This result was expected from the thermal study, as mechanical and thermal properties are intimately related [33,34]. However, some mechanical properties are not only associated with the thermal properties but with the geometry and defects of the sample, and it was demonstrated that freezing the PLA has not produced any mechanism that hampers the mechanical properties, such as the formation of surface cracks or the decrease of the Mw. Again, it can be observed how the PLA aged at room temperature has increased its properties, proving that freezing the PLA has effectively stopped the ageing.
3.4. Microstructural and Fractographical Analysis
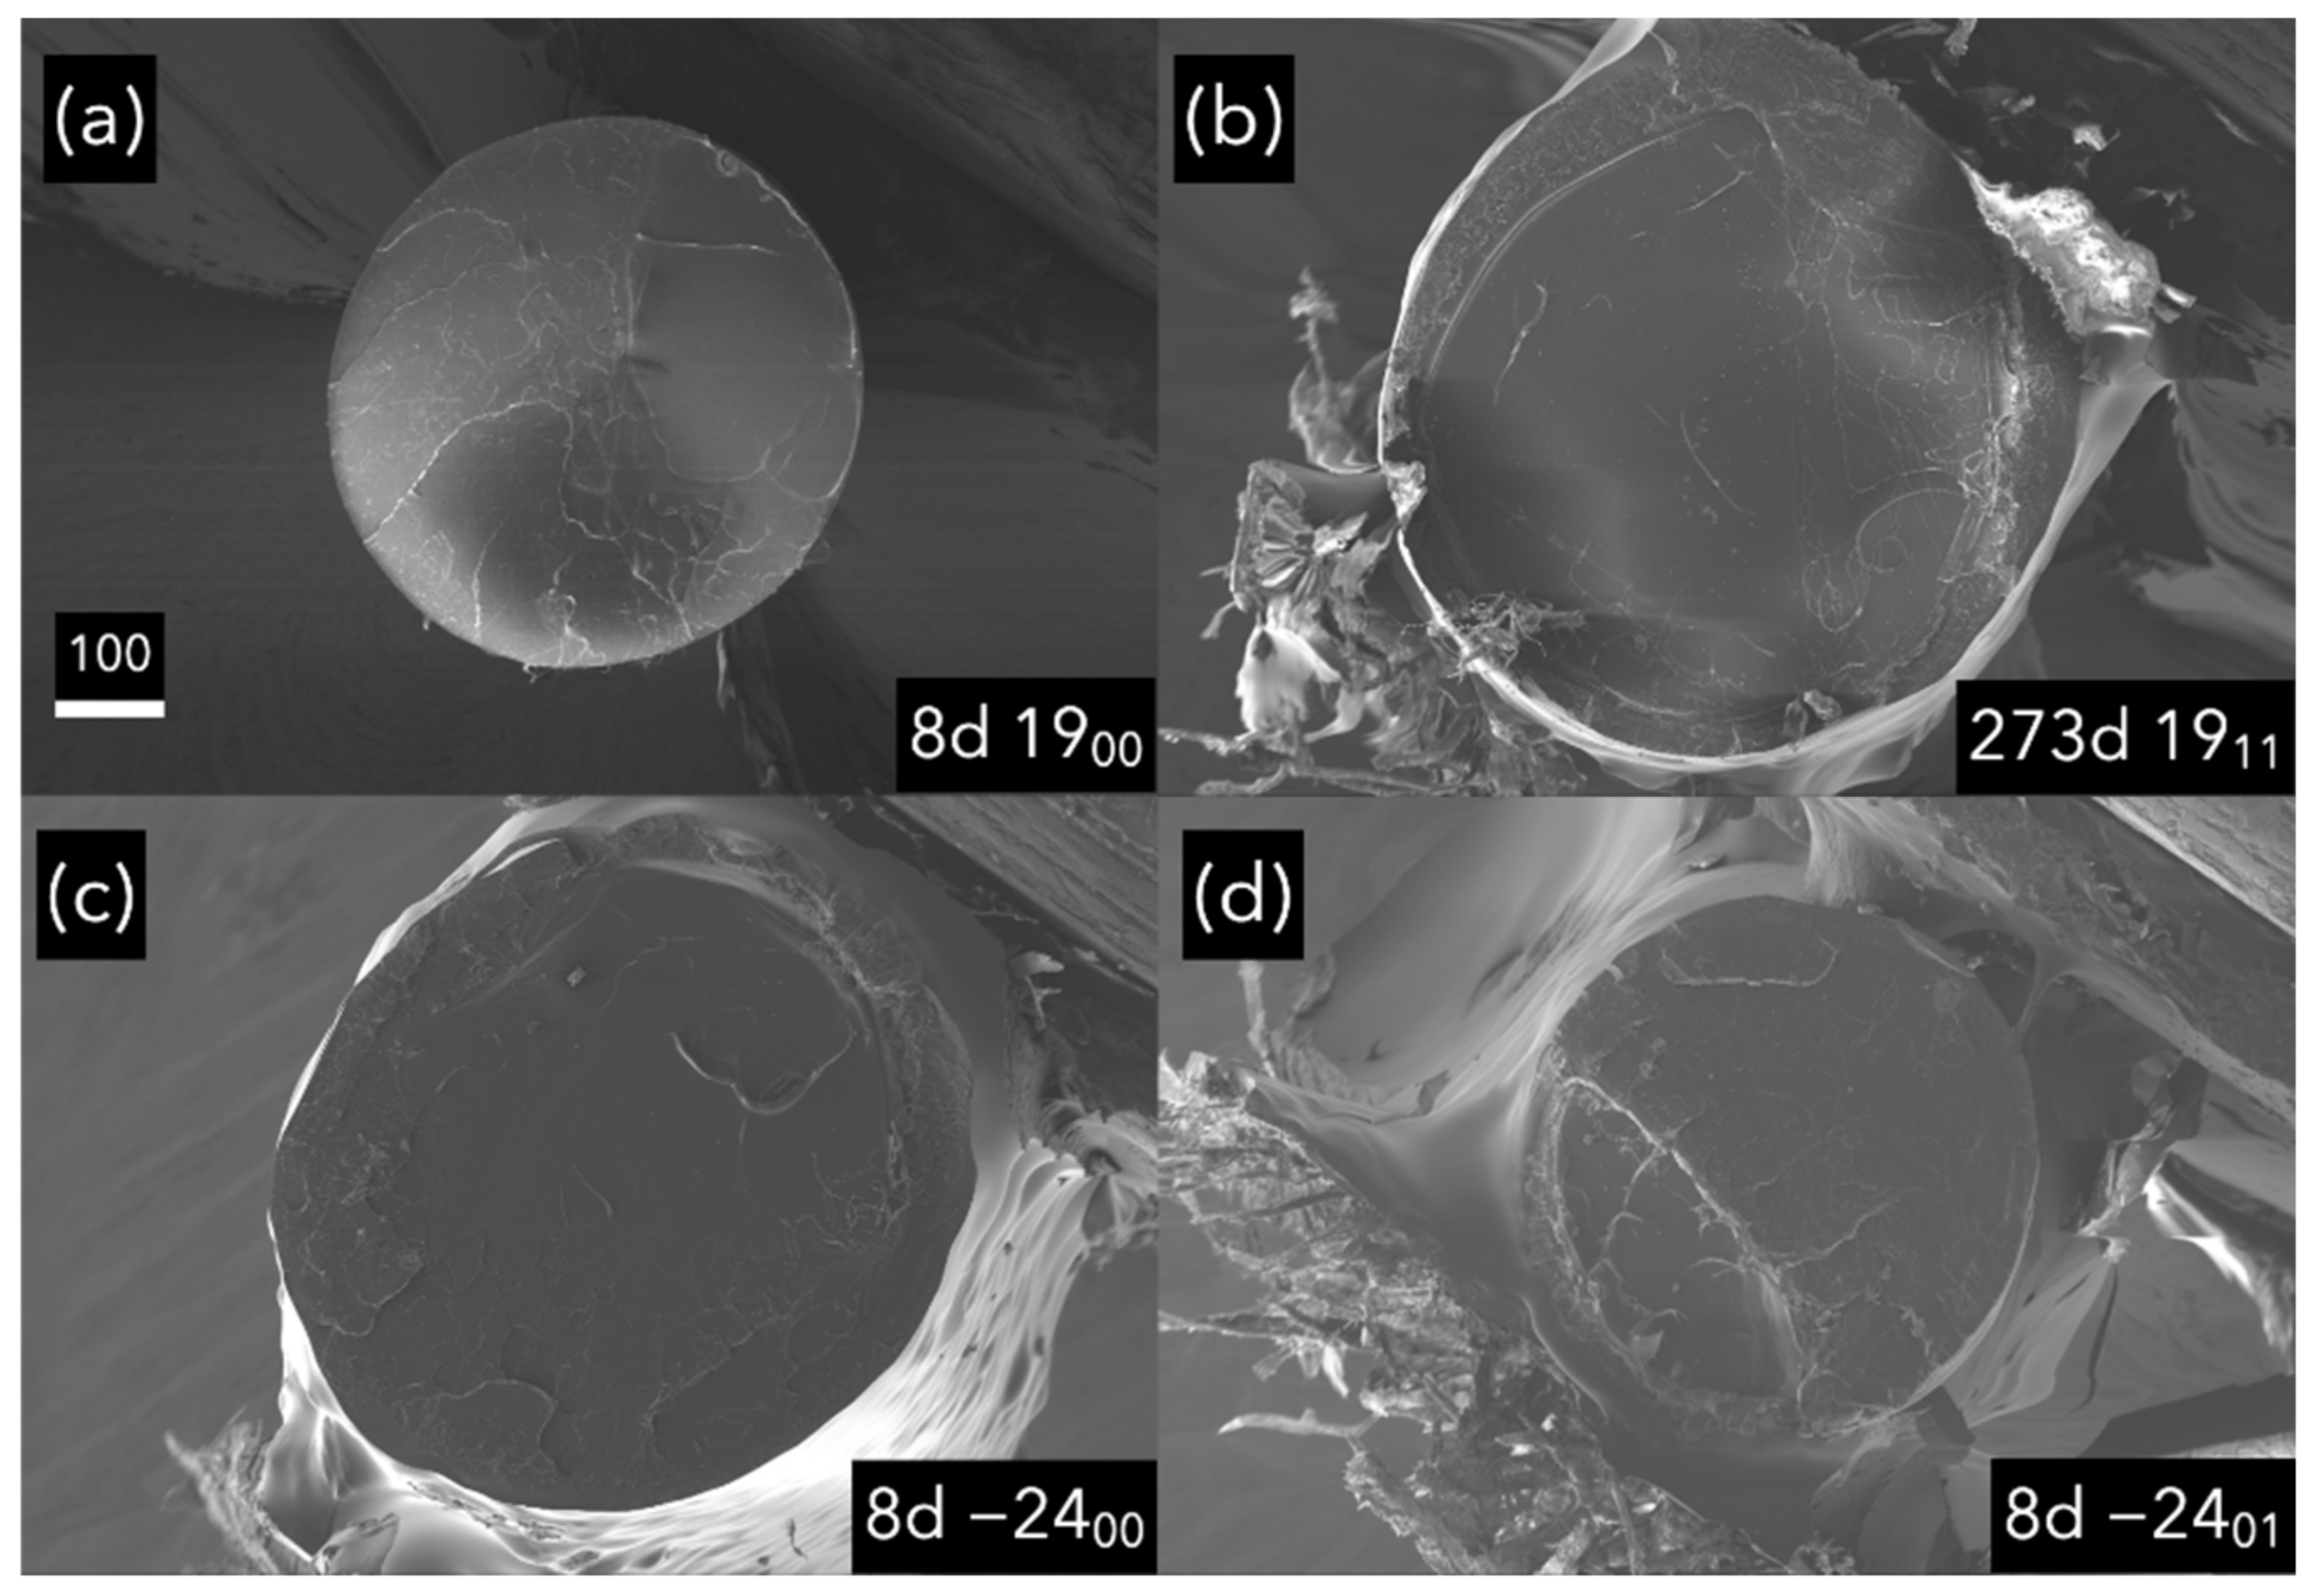
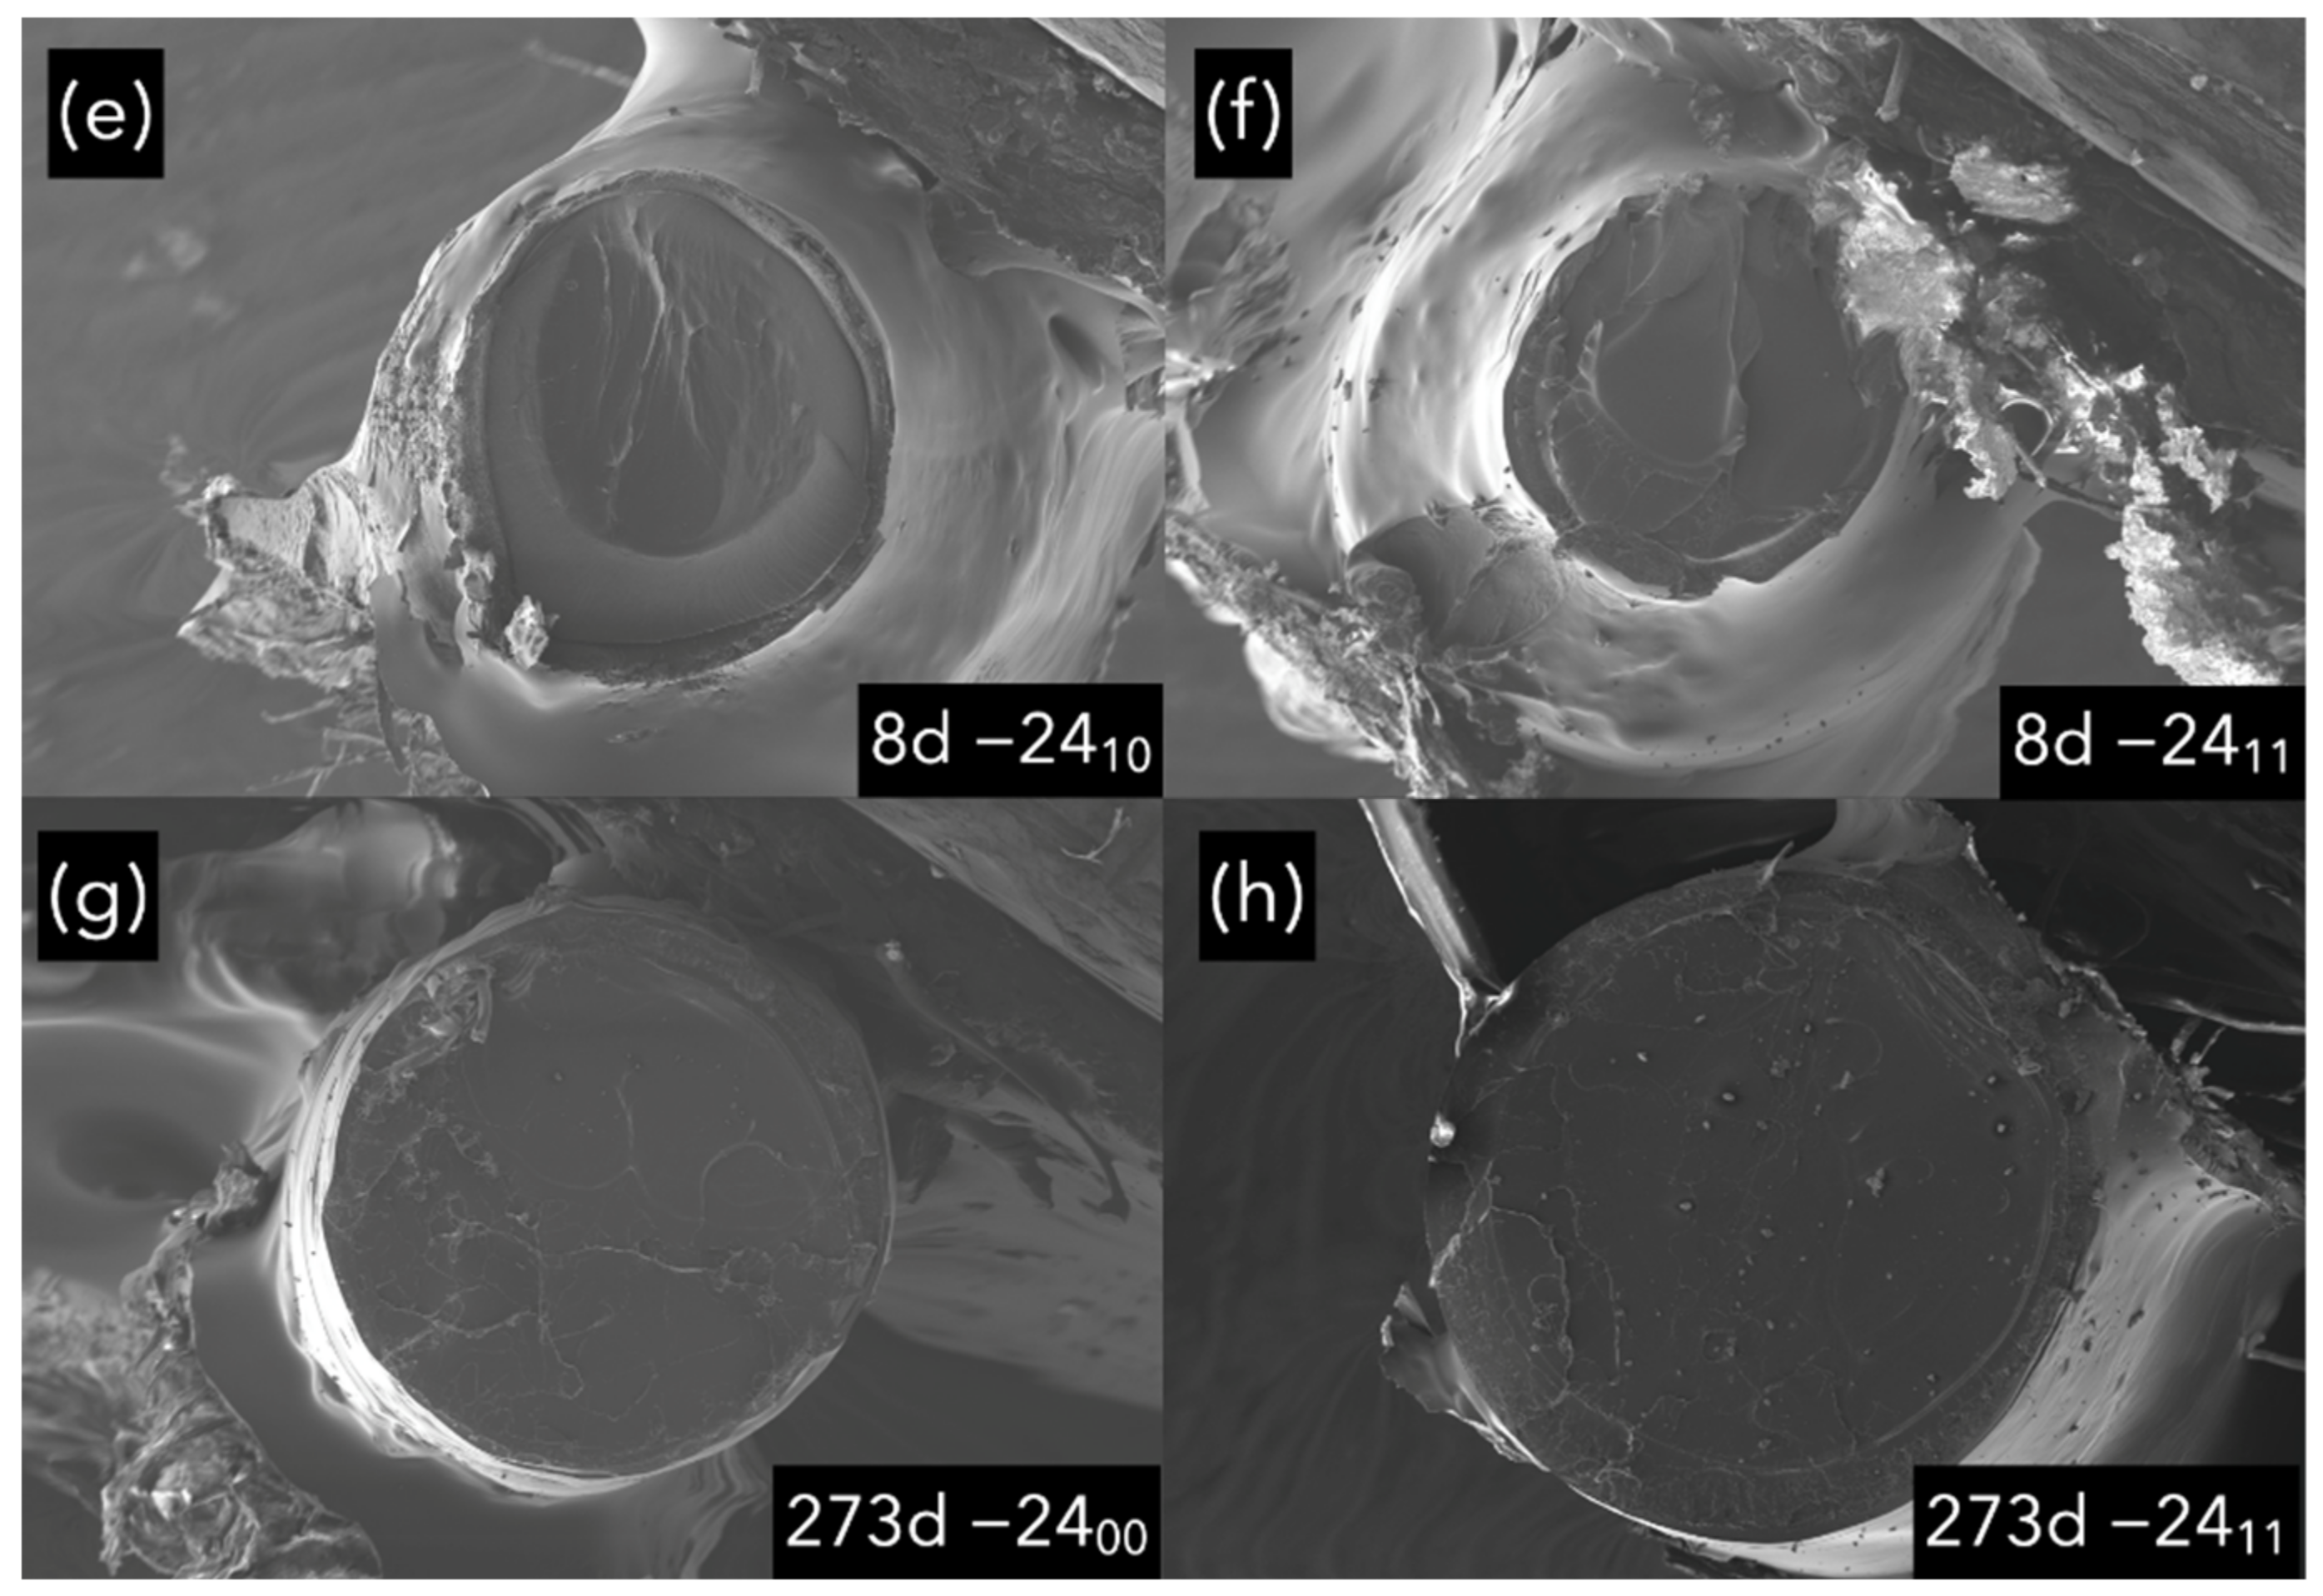
The samples’ fractographies show more evidence that the anti-ageing method has not damaged the material. This can be observed regarding the similarity among all the fracture surfaces. When the material ages, its properties change and how the material breaks [24]. The fact that there was no change even after 273 days of freezing indicates that the material was kept stable by freezing it.
This PLA had relatively high mechanical properties after being printed. Thus, only a fragile behavior was observed regarding the flatness of the surface crack, which is coherent with our previous results [24]. The most exciting findings here are that the fractographies were similar in all the materials and that freezing the PLA does not affect the PLA’s behavior once defrosted and tested.
Regarding the fractographical analysis in Figure 17, all the images have shown a similar fracture, indicating that the fracture mechanism was the same for the samples aged at room temperature and frozen. This is important as it provides more evidence that freezing the PLA has not affected the PLA structure, or at least not significantly produced any difference at the micro or the macro scale. It also proves that desiccant is unnecessary for the anti-ageing process inside PET zip-bags, making the anti-ageing process easier from an experimental point of view with the security that the PLA is not going to be degraded or aged in the absence of desiccant inside the PET zip bags.
4. Conclusions
According to the results presented, let us state this paper’s central and breakthrough conclusion: it is possible to stop PLA ageing by freezing at −24 °C or lower for up to nine months (probably at Infinitum) without damaging the material. Additionally, it can be safely performed without desiccant inside zip bags, simplifying the process so that this anti-ageing procedure is cheap, simple, and effective.
The main features of this new procedure are:
- Ageing was completely stopped by freezing PLA at −24 °C.
- No mechanical damage was produced in the frozen PLA.
- The presence or absence of desiccant during the freezing or defrosting process did not introduce measurable changes in the final state, properties, and behavior of the PLA.
- It is safe to freeze PLA at −24 °C inside PET zip-bags without a desiccant to stop ageing.
Author Contributions
Conceptualization, J.O.-B. and J.Y.P.; methodology, J.O.-B. and J.Y.P.; software, J.O.-B.; validation, J.O.-B., A.F.-M., B.F. and J.Y.P.; formal analysis, J.O.-B. and J.Y.P.; investigation, J.O.-B.; resources, A.F.-M., B.F. and J.Y.P.; data curation, J.O.-B.; writing—original draft preparation, J.O.-B.; writing—review and editing, J.O.-B., A.F.-M., B.F. and J.Y.P.; visualization, J.O.-B.; supervision, J.Y.P.; project administration, J.Y.P.; funding acquisition, B.F. and J.Y.P. All authors have read and agreed to the published version of the manuscript.
Funding
This research was funded by The Spanish Government under contract PID2019-106631GB-C42 and C44 (MICINN/FEDER, UE); and Madrid Regional Government under contract P2018/NMT-4411 ADITIMAT-CM (Comunidad de Madrid/FEDER, UE). Jaime Orellana Barrasa thanks the FPU17/02035 scholarship provided by the Ministerio de Educación, Cultura y Deporte of Spain and Universidad Politécnica de Madrid.
Institutional Review Board Statement
Not applicable.
Informed Consent Statement
Not applicable.
Data Availability Statement
Not applicable.
Conflicts of Interest
The authors declase no conflict of interest.
References
- Vu, M.C.; Jeong, T.; Kim, J.; Choi, W.K.; Kim, D.H.; Kim, S. 3D printing of copper particles and poly(methyl methacrylate) beads containing poly(lactic acid) composites for enhancing thermomechanical properties. J. Appl. Polym. Sci. 2021, 138, 49776. [Google Scholar] [CrossRef]
- Zhou, X.; Deng, J.; Fang, C.; Lei, W.; Song, Y.; Zhang, Z.; Huang, Z.; Li, Y. Additive manufacturing of CNTs/PLA composites and the correlation between microstructure and functional properties. J. Mater. Sci. Technol. 2021, 60, 27–34. [Google Scholar] [CrossRef]
- Valino, A.D.; Dizon, J.R.C.; Espera, A.H., Jr.; Chen, Q.; Messman, J.; Advincula, R.C. Advances in 3D printing of thermoplastic polymer composites and nanocomposites. Prog. Polym. Sci. 2019, 98, 101162. [Google Scholar] [CrossRef]
- Han, R.; Buchanan, F.; Ford, L.; Julius, M.; Walsh, P. A Comparison of the Degradation Behaviour of 3D Printed PDLGA Scaffolds incorporating Bioglass or Biosilica. Mater. Sci. Eng. C 2020, 120, 111755. [Google Scholar] [CrossRef] [PubMed]
- Tan, L.J.; Zhu, W.; Zhou, K. Recent Progress on Polymer Materials for Additive Manufacturing. Adv. Funct. Mater. 2020, 30, 2003062. [Google Scholar] [CrossRef]
- Signori, F.; Coltelli, M.-B.; Bronco, S. Thermal degradation of poly(lactic acid) (PLA) and poly(butylene adipate-co-terephthalate) (PBAT) and their blends upon melt processing. Polym. Degrad. Stab. 2009, 94, 74–82. [Google Scholar] [CrossRef]
- Hay, J.N. The physical ageing of amorphous and crystalline polymers. Pure Appl. Chem. 1995, 67, 1855–1858. [Google Scholar] [CrossRef]
- Hodge, I.M.; Berens, A.R. Effects of annealing and prior history on enthalpy relaxation in glassy polymers. 2. Mathematical modeling. Macromolecules 2002, 15, 762–770. [Google Scholar] [CrossRef]
- Hodge, I.M. Effects of annealing and prior history on enthalpy relaxation in glassy polymers. 4. Comparison of five polymers. Macromolecules 2002, 16, 898–902. [Google Scholar] [CrossRef]
- Napolitano, S.; Glynos, E.; Tito, N. Glass transition of polymers in bulk, confined geometries, and near interfaces. Rep. Prog. Phys. 2017, 80, 036602. [Google Scholar] [CrossRef]
- Gorrasi, G.; Pantani, R. Hydrolysis and Biodegradation of Poly(lactic acid). Adv. Polym. Sci. 2018, 279, 119–151. [Google Scholar] [CrossRef]
- Elsawy, M.A.; Kim, K.-H.; Park, J.-W.; Deep, A. Hydrolytic degradation of polylactic acid (PLA) and its composites. Renew. Sustain. Energy Rev. 2017, 79, 1346–1352. [Google Scholar] [CrossRef]
- Rodriguez, E.J.; Marcos, B.; Huneault, M.A. Hydrolysis of polylactide in aqueous media. J. Appl. Polym. Sci. 2016, 133. [Google Scholar] [CrossRef]
- Valentina, I.; Haroutioun, A.; Fabrice, L.; Vincent, V.; Roberto, P. Tuning the hydrolytic degradation rate of poly-lactic acid (PLA) to more durable applications. AIP Conf. Proc. 2017, 1914, 210001. [Google Scholar] [CrossRef]
- Restrepo, I.; Medina, C.; Meruane, V.; Akbari-Fakhrabadi, A.; Flores, P.; Rodríguez-Llamazares, S. The effect of molecular weight and hydrolysis degree of poly(vinyl alcohol)(PVA) on the thermal and mechanical properties of poly(lactic acid)/PVA blends. Polimeros 2018, 28, 169–177. [Google Scholar] [CrossRef]
- Copinet, A.; Bertrand, C.; Govindin, S.; Coma, V.; Couturier, Y. Effects of ultraviolet light (315 nm), temperature and relative humidity on the degradation of polylactic acid plastic films. Chemosphere 2004, 55, 763–773. [Google Scholar] [CrossRef]
- Tsuji, H.; Sugiyama, H.; Sato, Y. Photodegradation of Poly(lactic acid) Stereocomplex by UV-Irradiation. J. Polym. Environ. 2012, 20, 706–712. [Google Scholar] [CrossRef]
- Tsuji, H.; Echizen, Y.; Saha, S.K.; Nishimura, Y. Photodegradation of Poly(L-lactic acid): Effects of Photosensitizer. Macromol. Mater. Eng. 2005, 290, 1192–1203. [Google Scholar] [CrossRef]
- Tsuji, H.; Echizen, Y.; Nishimura, Y. Photodegradation of biodegradable polyesters: A comprehensive study on poly(l-lactide) and poly(ɛ-caprolactone). Polym. Degrad. Stab. 2006, 91, 1128–1137. [Google Scholar] [CrossRef]
- Zaaba, N.F.; Jaafar, M. A review on degradation mechanisms of polylactic acid: Hydrolytic, photodegradative, microbial, and enzymatic degradation. Polym. Eng. Sci. 2020, 60, 2061–2075. [Google Scholar] [CrossRef]
- Cangialosi, D.; Boucher, V.M.; Alegría, A.; Colmenero, J. Physical aging in polymers and polymer nanocomposites: Recent results and open questions. Soft Matter 2013, 9, 8619–8630. [Google Scholar] [CrossRef]
- Struik, L.C.E. Physical Aging in Amorphous Polymers and other Materials. Doctoral Thesis, Institutional Repository on TU Delft, Delft, The Netherlands, 1977. [Google Scholar]
- Eulate, N.G.P.-D.; Cangialosi, D. The very long-term physical aging of glassy polymers. Phys. Chem. Chem. Phys. 2018, 20, 12356–12361. [Google Scholar] [CrossRef] [PubMed]
- Barrasa, J.O.; Ferrández-Montero, A.; Ferrari, B.; Pastor, J.Y. Characterisation and Modelling of PLA Filaments and Evolution with Time. Polymers 2021, 13, 2899. [Google Scholar] [CrossRef] [PubMed]
- Moraczewski, K.; Stepczyńska, M.; Malinowski, R.; Karasiewicz, T.; Jagodziński, B.; Rytlewski, P. The Effect of Accelerated Aging on Polylactide Containing Plant Extracts. Polymers 2019, 11, 575. [Google Scholar] [CrossRef]
- Cui, L.; Imre, B.; Tátraaljai, D.; Pukánszky, B. Physical ageing of Poly(Lactic acid): Factors and consequences for practice. Polymer 2020, 186, 122014. [Google Scholar] [CrossRef]
- Cowie, J.M.G.; Arrighi, V. Physical Aging of Polymer Blends. In Polymer Blends Handbook, 2nd ed.; Springer: Berlin/Heidelberg, Germany, 2014; pp. 1357–1394. [Google Scholar] [CrossRef]
- Surana, R.; Pyne, A.; Rani, M.; Suryanarayanan, R. Measurement of enthalpic relaxation by differential scanning calorimetry—Effect of experimental conditions. Thermochim. Acta 2005, 433, 173–182. [Google Scholar] [CrossRef]
- Vyazovkin, S.; Koga, N.; Schick, C. Foreword. In Handbook of Thermal Analysis and Calorimetry; Elsevier: Amsterdam, The Netherlands, 2018; Volume 6. [Google Scholar] [CrossRef]
- Orellana, J.; Pastor, Y.; Calle, F.; Pastor, J. Influence of HRGO Nanoplatelets on Behaviour and Processing of PMMA Bone Cement for Surgery. Polymers 2021, 13, 2027. [Google Scholar] [CrossRef]
- Niaounakis, M.; Kontou, E.; Xanthis, M. Effects of aging on the thermomechanical properties of poly(lactic acid). J. Appl. Polym. Sci. 2011, 119, 472–481. [Google Scholar] [CrossRef]
- Williams, G.; Watts, D.C.; Dev, S.B.; North, A.M. Further considerations of non symmetrical dielectric relaxation behaviour arising from a simple empirical decay function. Trans. Faraday Soc. 1971, 67, 1323–1335. [Google Scholar] [CrossRef]
- Van Krevelen, D. Properties of Polymers; Elsevier: New York, NY, USA, 1997; p. 875. [Google Scholar]
- Smith, K.E.; Parks, S.S.; Hyjek, M.A.; Downey, S.E.; Gall, K. The effect of the glass transition temperature on the toughness of photopolymerisable (meth)acrylate networks under physiological conditions. Polymer 2009, 50, 5112. [Google Scholar] [CrossRef]
Figure 1.
Summary of the materials and methods: material preparation, anti-ageing process, thermal, mechanical and fractographical analysis.
Figure 1.
Summary of the materials and methods: material preparation, anti-ageing process, thermal, mechanical and fractographical analysis.

Figure 2.
(a) Scheme of the tensile test sample and clamping methods. (b) Picture of the actual tensile test sample.
Figure 2.
(a) Scheme of the tensile test sample and clamping methods. (b) Picture of the actual tensile test sample.

Figure 3.
(a) Detail of the PLA filament with the profilometer. (b) Fractography of the filament with the SEM in which the excellent ovality can be observed. (c) Transversal view of the same broken filament. Scale bars in microns.
Figure 3.
(a) Detail of the PLA filament with the profilometer. (b) Fractography of the filament with the SEM in which the excellent ovality can be observed. (c) Transversal view of the same broken filament. Scale bars in microns.

Figure 4.
DSC graphs for samples aged at room temperature using the nomenclature in Table 1.
Figure 4.
DSC graphs for samples aged at room temperature using the nomenclature in Table 1.

Figure 5.
DSC graphs for samples aged at −24 °C following the nomenclature in Table 1.
Figure 5.
DSC graphs for samples aged at −24 °C following the nomenclature in Table 1.

Figure 6.
Glass transition and enthalpic relaxation temperatures for the material 1900 with the corresponding KWW fitting models (lines). The line represents the KWW model, the dots the experimental data.
Figure 6.
Glass transition and enthalpic relaxation temperatures for the material 1900 with the corresponding KWW fitting models (lines). The line represents the KWW model, the dots the experimental data.

Figure 7.
Enthalpic relaxation enthalpy for the material 1900 and the corresponding KWW fitting model (line). The line represents the KWW model, the dots the experimental data.
Figure 7.
Enthalpic relaxation enthalpy for the material 1900 and the corresponding KWW fitting model (line). The line represents the KWW model, the dots the experimental data.

Figure 8.
The average value of the yield strength with its mean square error. The reference material aged at room temperature is with bold marks and with its logistic fitting (line); empty symbols are from frozen and defrosted materials. For better visualisation, samples aged 9 days are separated in 8 and 9 days in the graph, but all do correspond with 9 days. Six samples were measured for each ageing conditions and error bars are the standard deviation.

Figure 9.
Bar diagram with the average value of the yield strength with its mean square error versus the ageing time. The Shadow area shows the frozen sample value interval. Six samples were measured for each ageing conditions and error bars are the standard deviation.
Figure 9.
Bar diagram with the average value of the yield strength with its mean square error versus the ageing time. The Shadow area shows the frozen sample value interval. Six samples were measured for each ageing conditions and error bars are the standard deviation.

Figure 10.
The average value of the elastic modulus with its mean square error vs ageing. The reference material aged at room temperature has bold marks and its logistic fitting (line). For better visualisation, samples aged to nine days are separated into 8 and 9 days in the graph, but all correspond with nine days. The shadow area shows the frozen sample value interval. Six samples were measured for each ageing conditions and error bars are the standard deviation.

Figure 11.
Bar diagram with the average value of the elastic modulus with its mean square error versus the ageing time. The Shadow area shows the frozen sample value interval. Six samples were measured for each ageing conditions and error bars are the standard deviation.
Figure 11.
Bar diagram with the average value of the elastic modulus with its mean square error versus the ageing time. The Shadow area shows the frozen sample value interval. Six samples were measured for each ageing conditions and error bars are the standard deviation.

Figure 12.
The average value of the elastic modulus with its mean square error versus the ageing. The shadow area shows the frozen sample value interval. For better visualisations, samples aged nine days are separated into 8 and 9 days in the graph, but all correspond with nine days. Six samples were measured for each ageing conditions and error bars are the standard deviation.

Figure 13.
A bar diagram with the average elongation at break with its mean square error versus the ageing time. The shadow area shows the frozen sample value interval. Six samples were measured for each ageing conditions and error bars are the standard deviation.
Figure 13.
A bar diagram with the average elongation at break with its mean square error versus the ageing time. The shadow area shows the frozen sample value interval. Six samples were measured for each ageing conditions and error bars are the standard deviation.

Figure 14.
Example of tensile tests with and without necking formation. Notice the long strain for some necking extensions, which has induced considerable standard deviations in the average elongation at break.
Figure 14.
Example of tensile tests with and without necking formation. Notice the long strain for some necking extensions, which has induced considerable standard deviations in the average elongation at break.

Figure 15.
Counts of necking formation. The vertical axis represents how many samples have had a necking out of the six samples tested per material and condition. The shadow area shows the frozen samples. Six samples were measured for each ageing conditions and error bars are the standard deviation.

Figure 16.
Counts of necking formation. The blue one represents how many samples have had a necking out of the six samples tested per material and condition. Six samples were measured for each ageing conditions and error bars are the standard deviation.
Figure 16.
Counts of necking formation. The blue one represents how many samples have had a necking out of the six samples tested per material and condition. Six samples were measured for each ageing conditions and error bars are the standard deviation.

Figure 17.
Samples without necking. Scale in microns. (a,b), samples aged at room temperature; (c–h), samples aged at −24 °C.
Figure 17.
Samples without necking. Scale in microns. (a,b), samples aged at room temperature; (c–h), samples aged at −24 °C.


Table 1.
Methods: the freezing and defrosting routes for the PLA.
| Method | Ageing Temperature (°C) | Frozen with Desiccant | Defrosted with Desiccant |
|---|---|---|---|
| 1900 | 19 ± 3 | - * | - * |
| −2400 | −24 ± 1 | No | No |
| −2401 | −24 ± 1 | No | Yes |
| −2410 | −24 ± 1 | Yes | No |
| −2411 | −24 ± 1 | Yes | Yes |
* Samples stored with a desiccant inside zip-bags and at room temperature.
Table 2.
Thermal properties of the extruded 1D PLA. Tg: glass transition; TER: enthalpic relaxation temperature; ΔHER: enthalpy of enthalpic relaxation; TCC: cold crystallisation temperature; ΔHCC: enthalpy of cold crystallisation; Tm: melting temperature; ΔHm: enthalpy of melting; Xc%: crystallinity content. Following IUPAC’s convention, positive enthalpy changes indicate that the material absorbs the energy, indicative of an endothermal reaction.
| Method | Ageing (Days) | Tg (°C) | TER (°C) | ΔHER (J/g) | Tcc (°C) | ΔHcc (J/g) | Tm (°C) | ΔHm (J/g) | Xc% |
|---|---|---|---|---|---|---|---|---|---|
| 1900 | 1 | 53.9 | 56.8 | 0.0 | 124 | −3.1 | 150 | 3.7 | <1.5 |
| 1900 | 3 | 55.9 | 58.8 | 0.7 | 125 | −2.1 | 150 | 2.8 | <1.5 |
| 1900 | 7 | 57.2 | 59.9 | 1.3 | 124 | −2.7 | 150 | 3.7 | <1.5 |
| 1900 | 240 | 61.0 | 63.2 | 6.1 | 118 | −6.7 | 149 | 5.1 | <1.5 |
| −2400 | 8 | 52.1 | 56.9 | 0.0 | 123 | −3.6 | 150 | 3.6 | <1.5 |
| −2400 | 273 | 51.7 | 56.1 | 0.0 | 119 | −4.1 | 150 | 4.7 | <1.5 |
| −2401 | 8 | 52.6 | 57.6 | 0.0 | 124 | −1.9 | 150 | 2.3 | <1.5 |
| −2410 | 8 | 53.7 | 58.3 | 0.0 | 122 | −2.8 | 151 | 3.3 | <1.5 |
| −2411 | 8 | 53.6 | 58.2 | 0.0 | 125 | −2.0 | 151 | 2.3 | <1.5 |
| −2411 | 273 | 51.5 | 56.2 | 0.0 | 125 | −2.6 | 151 | 3.5 | <1.5 |
Publisher’s Note: MDPI stays neutral with regard to jurisdictional claims in published maps and institutional affiliations. |
© 2022 by the authors. Licensee MDPI, Basel, Switzerland. This article is an open access article distributed under the terms and conditions of the Creative Commons Attribution (CC BY) license (https://creativecommons.org/licenses/by/4.0/).
Share and Cite
MDPI and ACS Style
Orellana-Barrasa, J.; Ferrández-Montero, A.; Ferrari, B.; Pastor, J.Y. Natural Ageing of PLA Filaments, Can It Be Frozen? Polymers 2022, 14, 3361. https://doi.org/10.3390/polym14163361
AMA Style
Orellana-Barrasa J, Ferrández-Montero A, Ferrari B, Pastor JY. Natural Ageing of PLA Filaments, Can It Be Frozen? Polymers. 2022; 14(16):3361. https://doi.org/10.3390/polym14163361
Chicago/Turabian StyleOrellana-Barrasa, Jaime, Ana Ferrández-Montero, Begoña Ferrari, and José Ygnacio Pastor. 2022. "Natural Ageing of PLA Filaments, Can It Be Frozen?" Polymers 14, no. 16: 3361. https://doi.org/10.3390/polym14163361
Note that from the first issue of 2016, this journal uses article numbers instead of page numbers. See further details here.