3.1. Biodegradability Tests
According to the results, the highest weight loss was obtained by the PLA/PBAT/PPF/CO/AA with and without temperature after 6 months. For neat polymers, after 3 months, PLA showed a higher weight loss compared to PBAT. This could be attributed to the ease of degradation of the aliphatic backbone of PLA compared to the aromatic component in the backbone of PBAT [
15]. This behavior was reported by Carbonell-Verdu et al. [
16] for PLA in PLA/PBAT films. However, the final value (6 months) was almost the same for both polymers. PLA and PBAT degradation efficiency is related to the difference in polymer structure and the action of microorganisms in the soil [
17]. Some authors have demonstrated for PLA/PBAT blends that, during composting, there is a selectivity to degrade the PLA phase with the formation of a porous 3D network [
18] as will be discussed in the
Section 3.2. In the literature, it has been reported that the lower weight loss of PBAT can be attributed to the presence of benzene rings [
19]. During degradation, microorganisms attack the ester bond in PLA and PBAT, with the generation of small molecules or oligomers, which are subsequently metabolized by these microorganisms [
17]. The 60/40 PLA/PBAT blend has a higher composition of PLA than PBAT and more ester bonds are available, favoring microorganism attacks, as observed in the higher weight loss of the blend compared to the neat polymers. On the other hand, weight loss was higher for the blends with and without canola oil compared to the neat polymers after the 3 and 6 months. Significant statistical differences (
p < 0.05) were found between the fibers. The weight loss of the fibers after 3 and 6 months of composting is shown in
Table 2.
According to ASTM 6400 [
20] for an aerobically composted plastic, 90% of film degradation must be achieved in 180 days (6 months). According to the results, the PLA/PBAT/PPF/CO/AA with and without temperature reached this percentage (92 ± 7 and 87 ± 11%, respectively). In a previous study with PLA/PBAT nets with and without cinnamon essential oil (CEO), weight loss of 15, 7, 3, and 5% was observed for PLA, PBAT, PLA/PBAT 60/40, and PLA/PBAT/CEO, respectively, with 6.1% of CEO after 3 months of composting. At the end of the composting time (6 months) these percentages were 15, 5, 4, and 6% for PLA, PBAT, PLA/PBAT 60/40, and PLA/PBAT/CEO, respectively. After 3 months, the values were similar for neat polymers (PLA and PBAT) [
21]. However, the weight loss values for PLA/PBAT were higher in this work. Among the factors that affect composting are aeration, moisture, nutrients, temperature, lignin content, polyphenols, and pH [
22]. These factors could influence the kinetics of aerobic composting [
23].
Ruggero et al. [
24] reported a weight loss of 8% and 3% for pure PBAT and PLA films, respectively, under soil and composting conditions for 60 days. The PBAT value was similar to that found in this work after 3 months. However, the authors mentioned that the degradation of PLA increased depending on the thermophilic and mesophilic conditions, and on film thickness.
Moreover, depending on the biopolymer, lower or faster degradation can be found in soil. For example, starch degradation is faster than PLA because PLA maintains its weight for a period of 3 weeks [
25]. On the other hand, a higher biodegradation rate between 80–100% has been found for cellulose-based biopolymers after 3 months [
26,
27], similar to the values obtained in this work for the PPF that contained the fibers. The size and structure of the lignocellulosic filler, such as PPF, influenced the degradation process. It has been reported that for pure cellulose, more accessibility points and microorganism attacks were created due to moisture and adhesion to the polymer [
28].
3.2. Optical and SEM Observations
According to the results, the initial fibers present a smooth surface. However, after 3 months of degradation in soil, the PLA surface became rough. Dark spots could be due to microorganism colonies or residual soil/compost. As composting time increased, a color change to yellowish-brown was observed in the fibers. After 6 months, cracks and a broken fiber surface were observed as a result of biodegradation [
29]. Higher fiber disintegration was observed in the PLA/PBAT/CO fiber after 3 months of decomposition. As the degradation progressed, a loss of transparency of the fibers was observed due to possible loss of crystallinity associated with PLA component hydrolysis and sample biodeterioration, as reported by Brdlík et al. [
30] and Carbonell-Verdu et al. [
15]. PLA/PBAT/PPF/CO/AA fibers with and without temperature showed similar degradation behavior. In
Table 3, the optical surface micrographs of the fibers before and after 3 and 6 months of degradation are shown.
The SEM results (
Table 4 and
Table 5) revealed differences between the initial and degraded fibers. Before degradation, the neat PLA and PBAT fibers showed a smooth and homogeneous surface. As for the blends, a rougher surface can be seen. The appearance of pores or cavities is observed after degradation in all of the fibers due to physicochemical degradation and biological attack by microorganisms [
10]. In PLA it has been found that during chain scission in degradation, lactic acid oligomers are formed, thereby increasing the concentration and catalytic action of carboxylic acid end groups [
31]. For PBAT, chain scission of ester groups and the reaction of carboxylic groups with water in the surrounding medium occurs [
32].
A porous structure with nanometric holes can be seen more clearly for PLA and PLA/PBAT blends after 3 and 6 months of degradation in
Table 5. This was also observed by Ruggero et al. [
24] for PLA/PBAT/starch blends. On the other hand, a “lunar surface” morphology is observed in the PLA/PBAT/CO fibers after 3 months. This can be related to the viscosity of the oil and the miscibility between the CO and the PLA/PBAT matrix [
30].
In general, on the blends, pores and surface erosion are observed during the composting process due to the environmental aging of the fibers. Fiber delamination can be seen due to the progressive erosion of the material, especially in the PLA/PBAT/CO after 6 months of degradation.
In the PLA/PBAT/PPF/CO/AA fibers with and without temperature, the PPF particles are not seen in the micrographs, which is indicative of good adhesion between the PPF and the polymer matrix. Spiridon et al. [
8] found a similar observation for lignin particles in a PLA matrix. Moreover, the delamination of the fiber due to erosion is not observed compared to PLA/PBAT/CO. This could be due to the AA enhancing the phase compatibility between polymers.
Comparing the PLA/PBAT/PPF/CO/AA fibers with and without temperature, higher degradation can be seen in PLA/PBAT/PPF/CO/AA. The temperature in emulsions promotes the kinetic energy and mobility of the particles, thereby increasing the collisions between them with a subsequent improvement in emulsion stability [
33,
34].
The detachment of fragments from the fibers and the formation of pores or cavities contributes to higher weight loss, being more evident after 3 months for the neat polymers. In
Table 5, more cavities can be seen in PLA compared to PBAT, with a weight loss of 19 and 7%, respectively (see
Table 2). The same behavior was found for PLA fibers under composting by Feijoo et al. [
28].
Table 4 and
Table 5 show the SEM micrographs of the surface morphology of the fibers before and after 3 and 6 months of degradation for 100 and 5 k magnification, respectively.
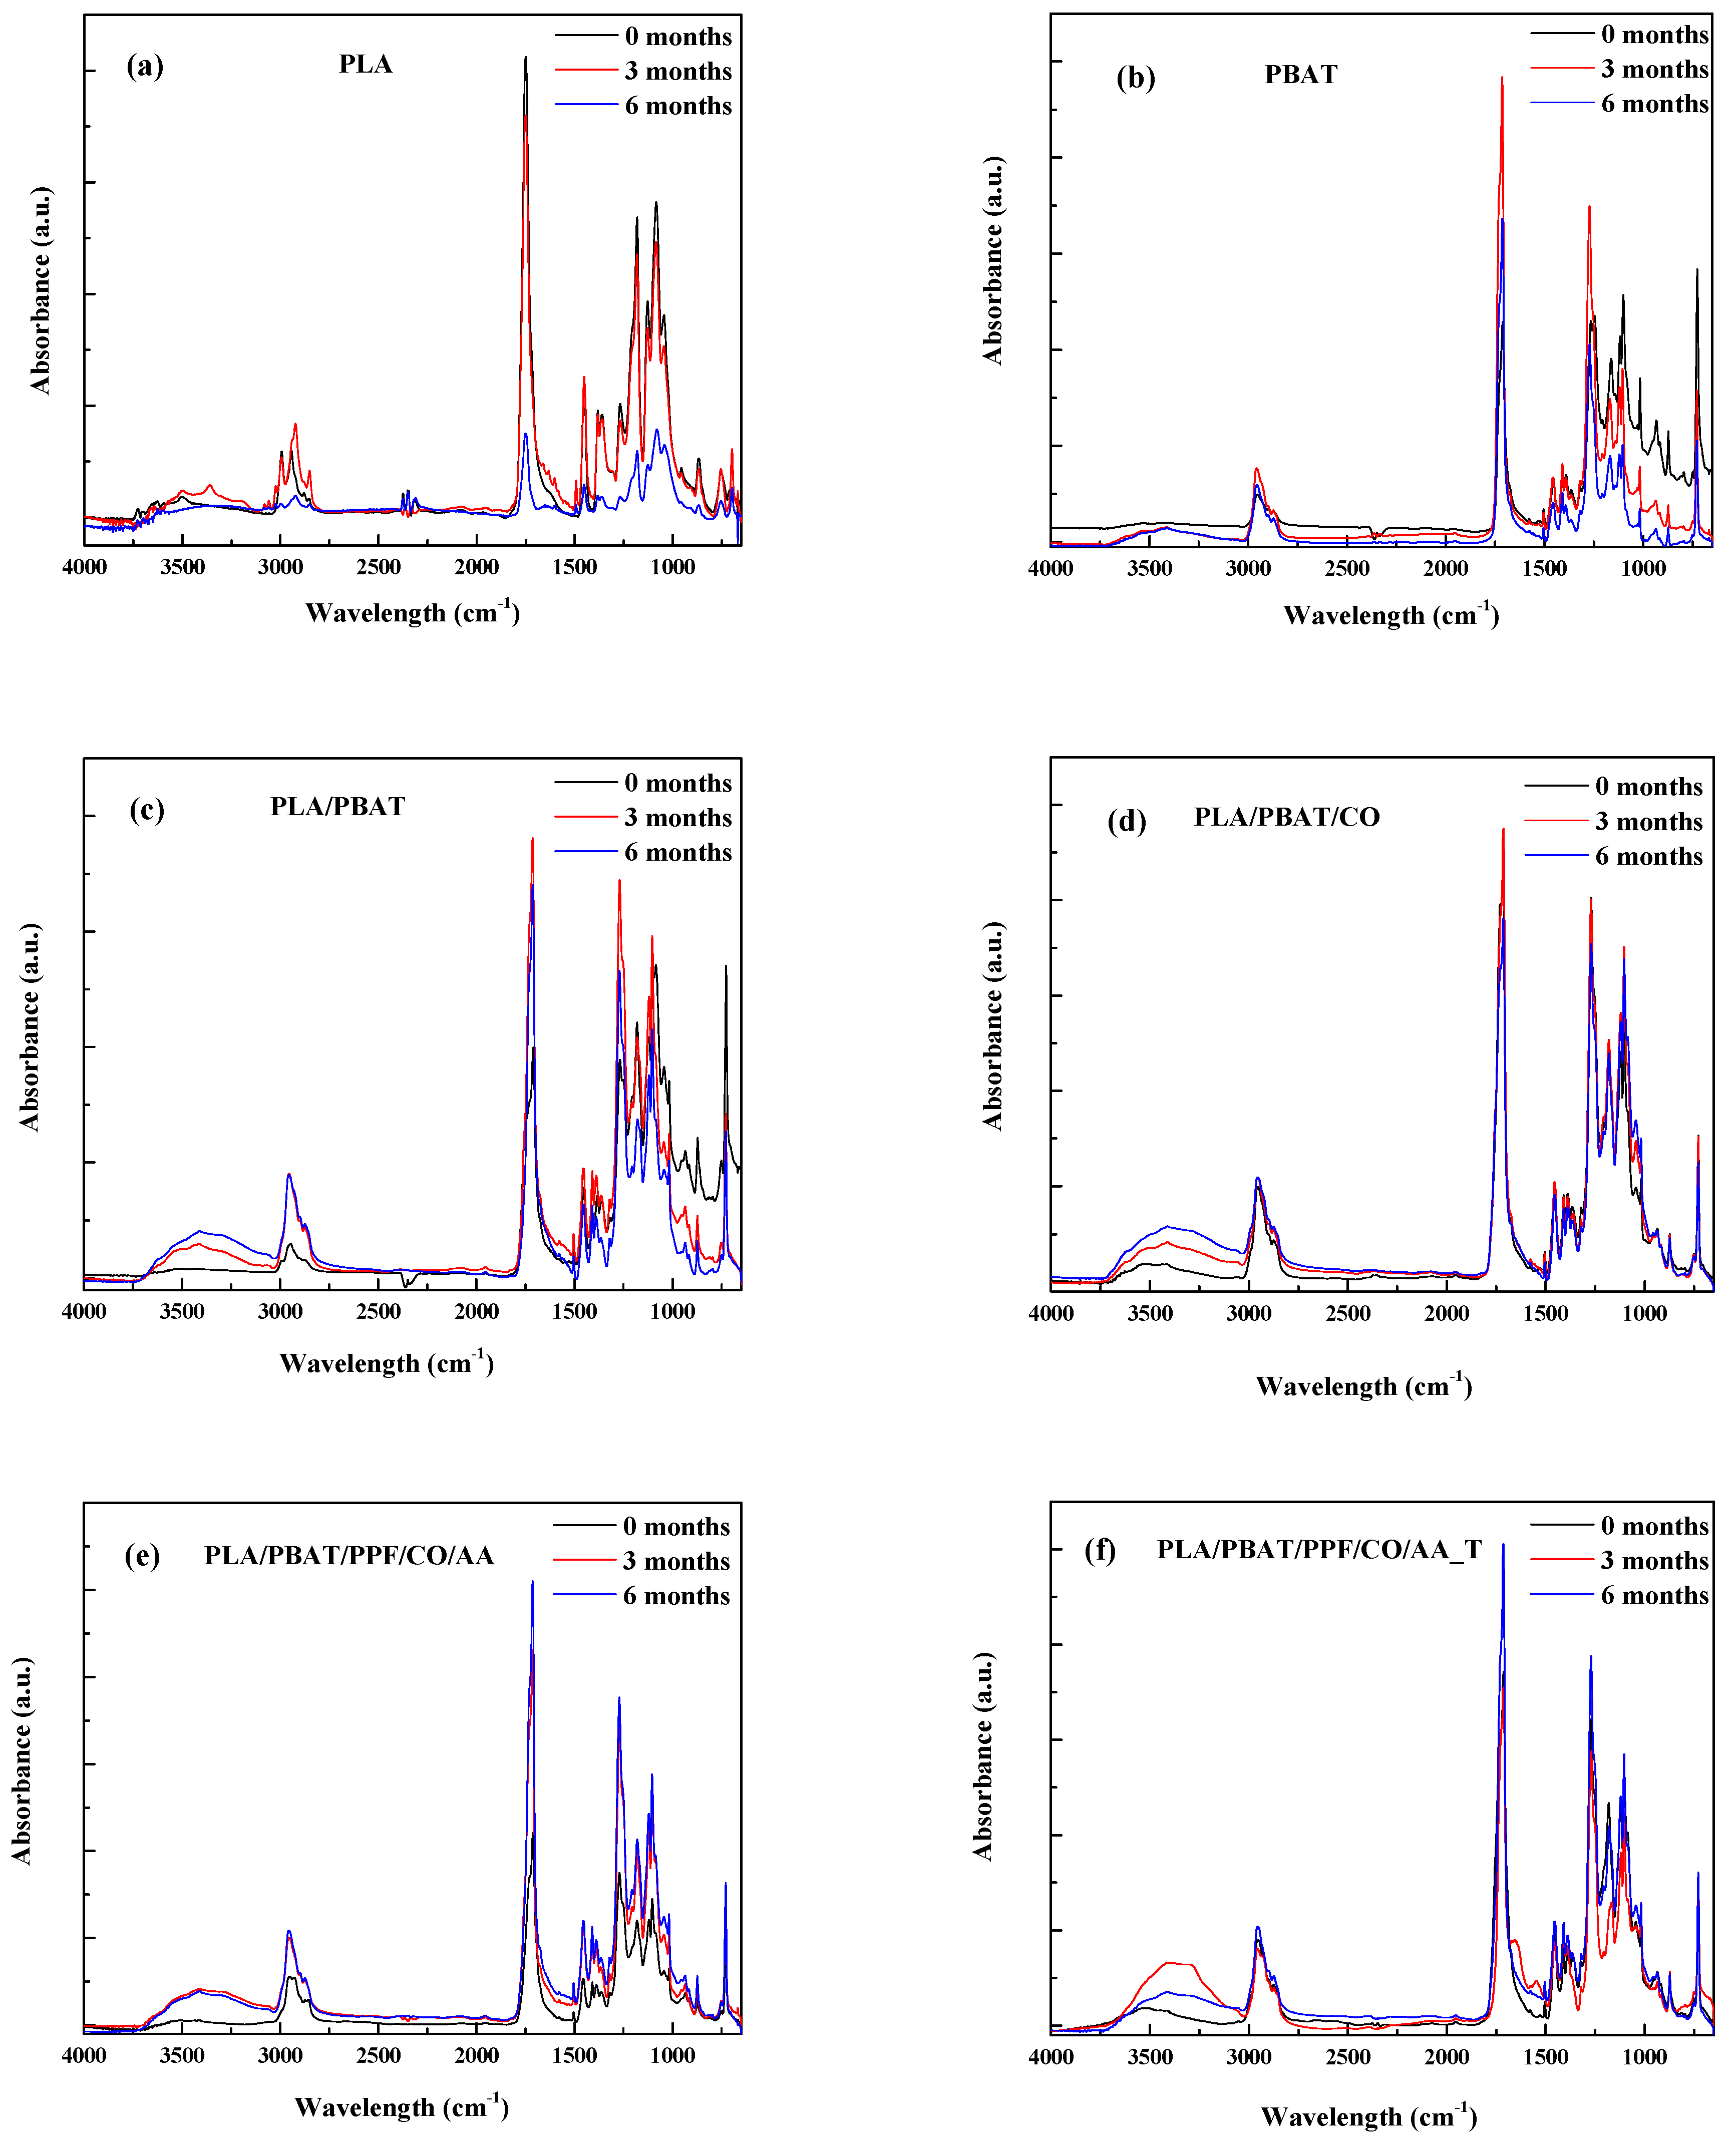
3.3. Fourier Transform Infrared Spectroscopy–Attenuated Total Reflection (FTIR-ATR)
In
Figure 1, the FTIR-ATR spectra of the fibers show the changes that occurred on their surface due to the degradation process.
At the initial time, the main characteristic absorption peaks for PLA, PBAT, and PLA/PBAT have already been reported [
13,
24,
30,
35,
36]. The main PLA bands and peaks (see
Figure 1a) are between 3760 and 3115 cm
−1, assigned to the -OH groups, and between 3000 and 2775 cm
−1, corresponding to -CH deformations (symmetric and asymmetric bends). The sharp peak at 1740 cm
−1 is attributed to C=O from the ester groups; at 1450 cm
−1 to -CH in CH
3; at 1272 cm
−1 it is related to C-O stretching; at 1180 for C-O stretching in the -CH-O group; and at 1079 cm
−1 it is related to C-O-C stretching. For PBAT, the main peaks observed in
Figure 1b are similar to those observed for PLA, due to the similar chemical structure except for the band between 1210 and 1000 cm
−1, which is related to the benzene rings, and the peak at 725 cm
−1, for the bending vibration of CH-plane in the benzene ring [
37]. No differences were observed on the bands for the blends after PBAT incorporation into PLA and the addition of CO, PPF, and the influence of temperature.
After biodegradation, the following changes were observed. In PBAT and the polymer blends, an increase in the band between 3760 and 3115 cm
−1 corresponding to the -OH groups with degradation time was observed (
Figure 1b–f). This is related to bond scission and -OH formation, characteristic of the hydrolysis process that occurs in the fibers during composting [
10,
30].
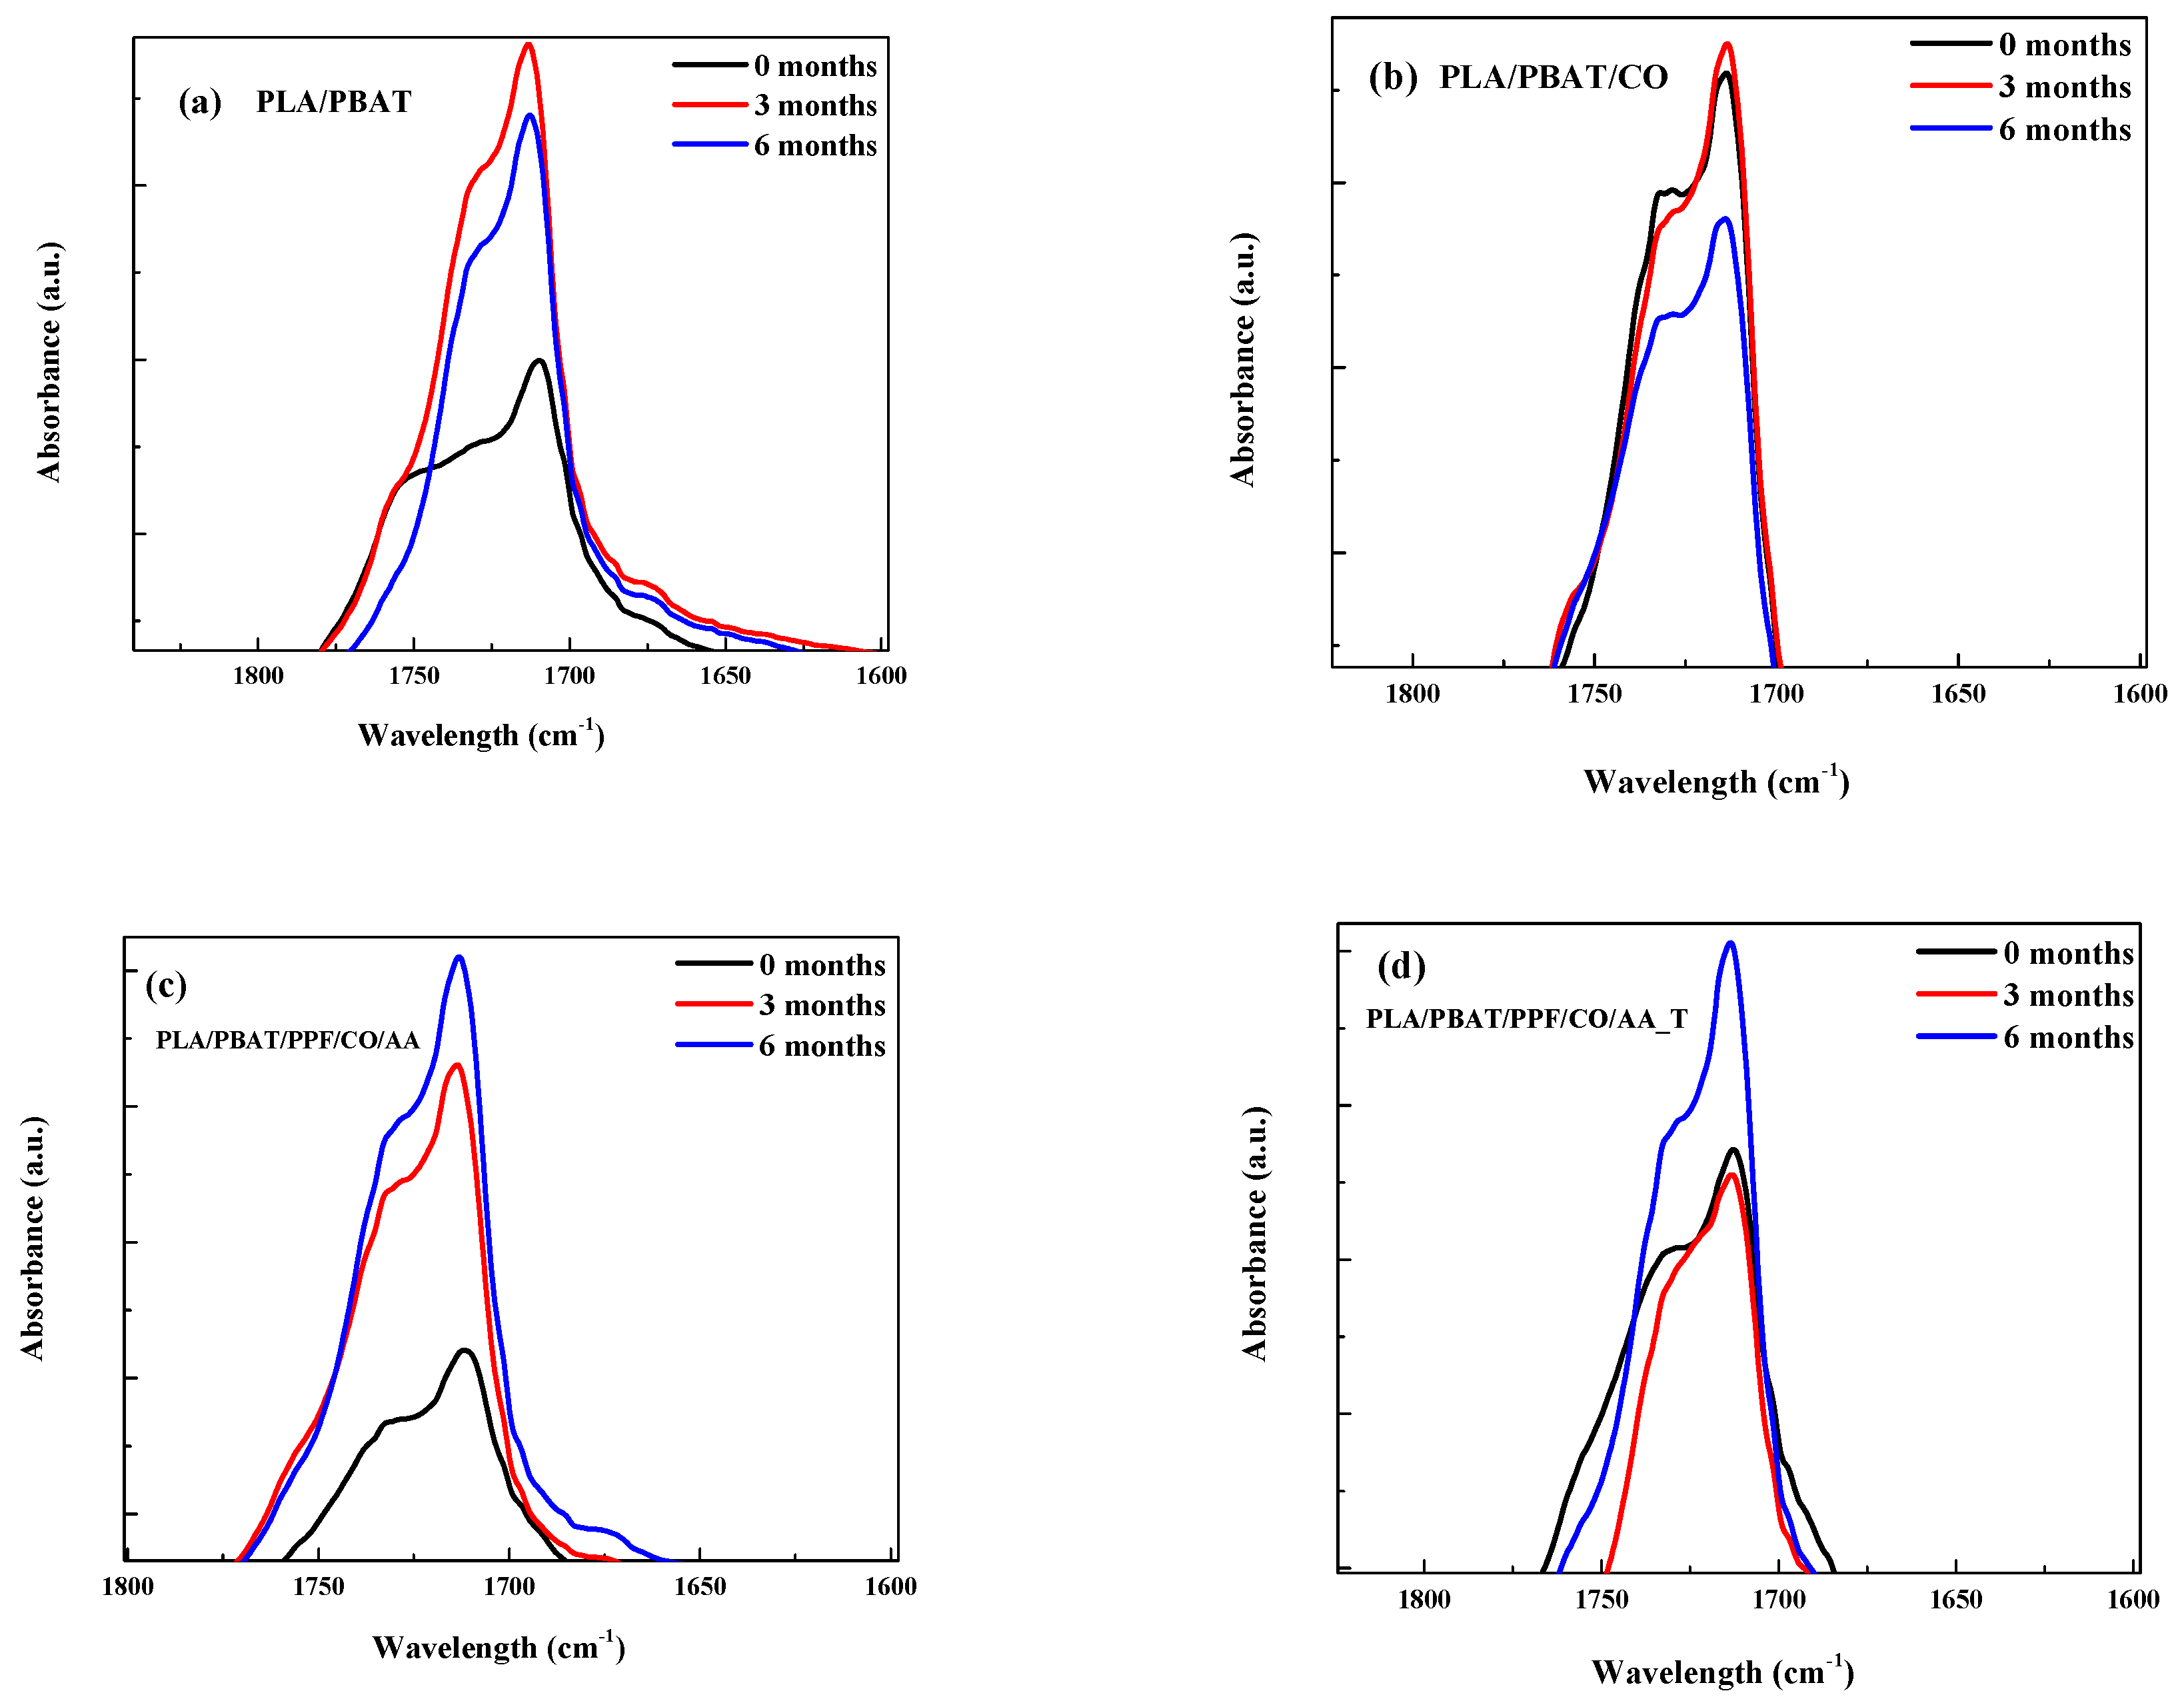
A detail of the FTIR spectra of the carboxyl groups (-C=O) in the region between 1800 and 1600 cm
−1 to trace the degradation process is shown in
Figure 2.
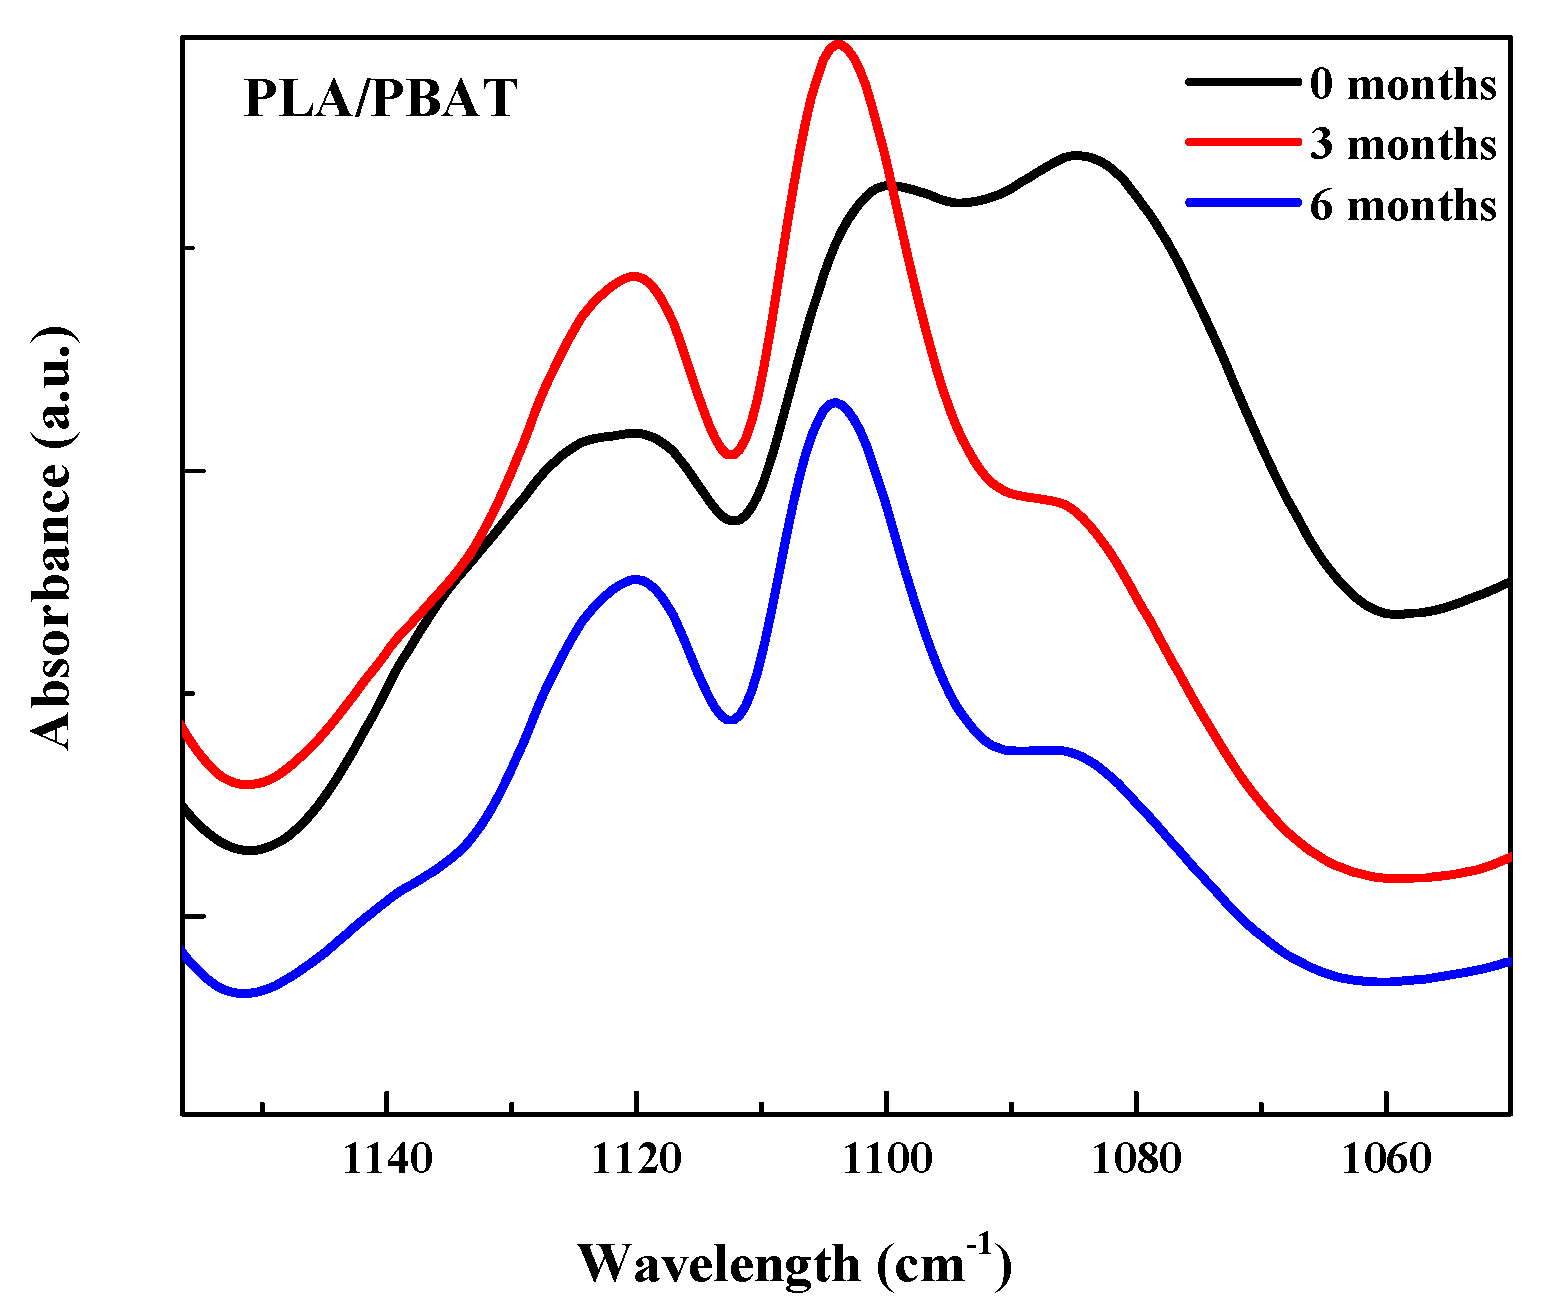
A decrease in the peak at 1740 cm
−1 related to the stretching vibrations of -C=O can be seen as a result of chain scission during degradation [
36,
38] as well as in the band at around 1100 cm
−1, correlated to -C-O groups as shown in
Figure 3 [
36].
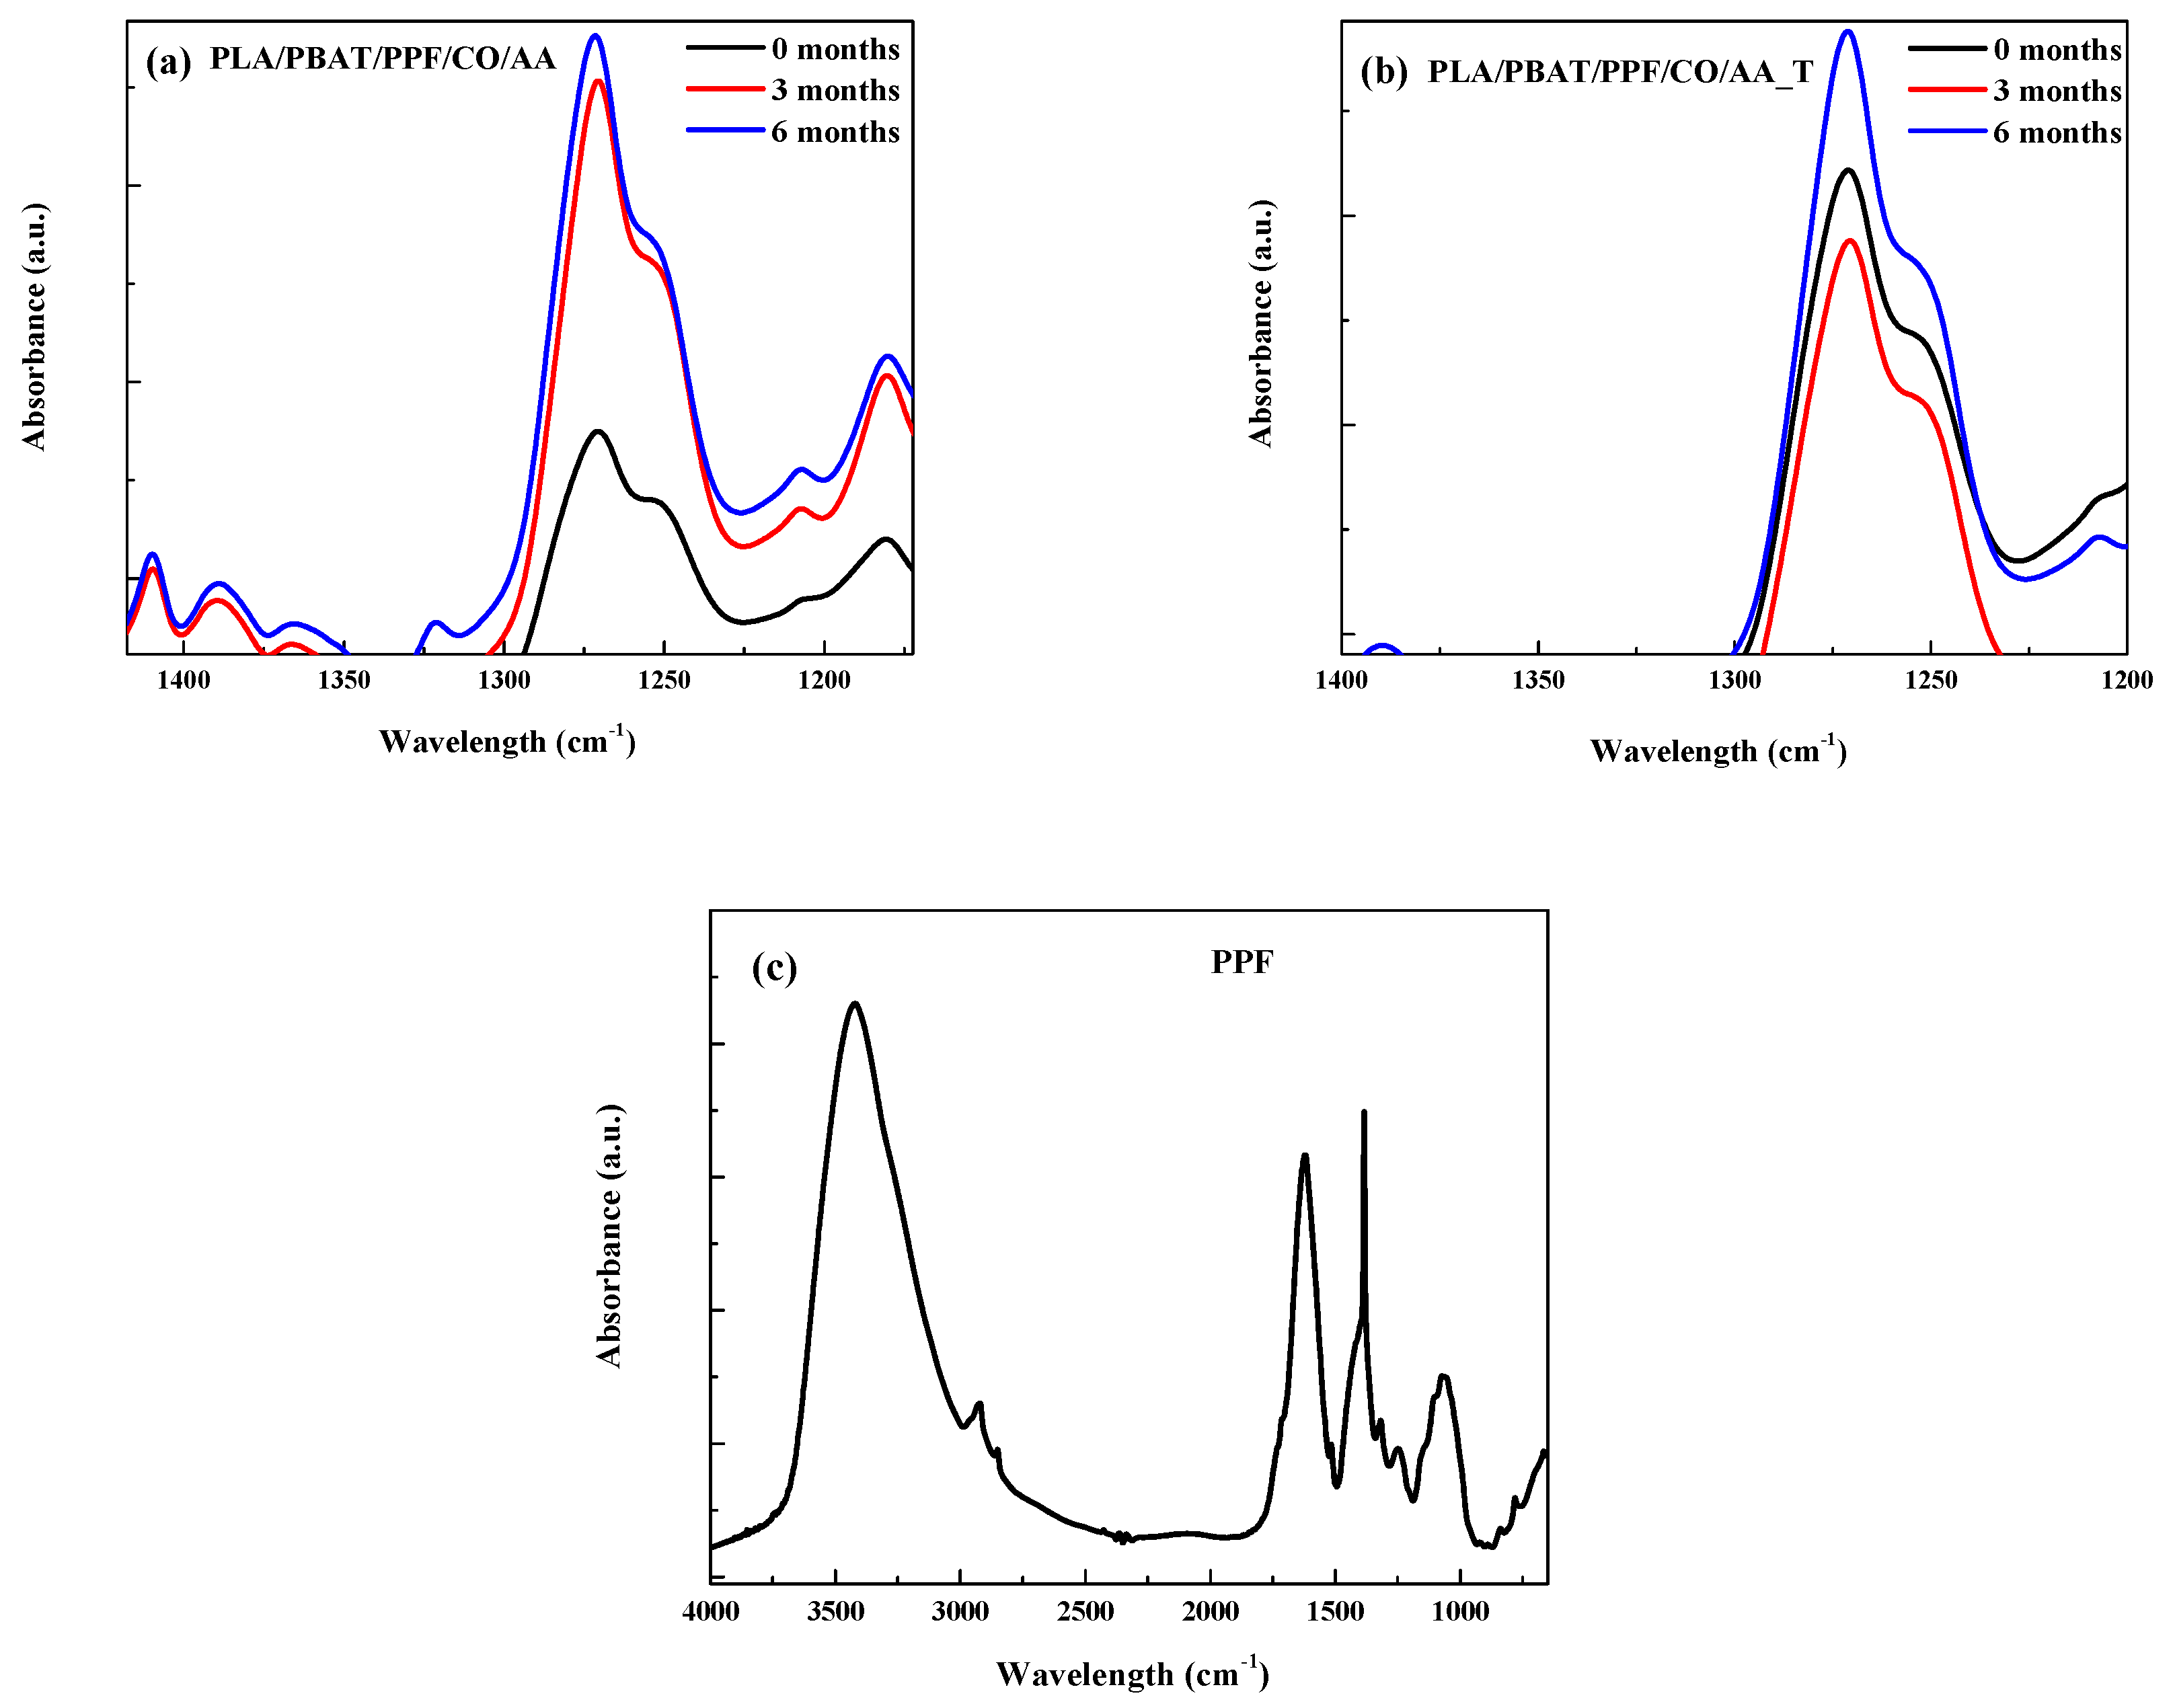
Moreover, the absorption band at 1269 cm
−1 showed a decrease for the PLA/PBAT/PPF/CO/AA with and without temperature as observed in
Figure 4a,b. This band is related to hemicelluloses biodegradation from acetyl and carboxylic vibration of the carbohydrate component of plant cell walls. It has been reported that lignin absorbs at a wavelength near 1269 cm
−1 [
39]. The FTIR-ATR spectrum of PPF is shown in
Figure 4c. The decrease in this peak was only observed in the PLA/PBAT/PPF/CO/AA with and without temperature fibers. The decrease in this absorption band could be related to the higher weight loss observed in
Table 2.
3.4. Differential Scanning Calorimetry (DSC)
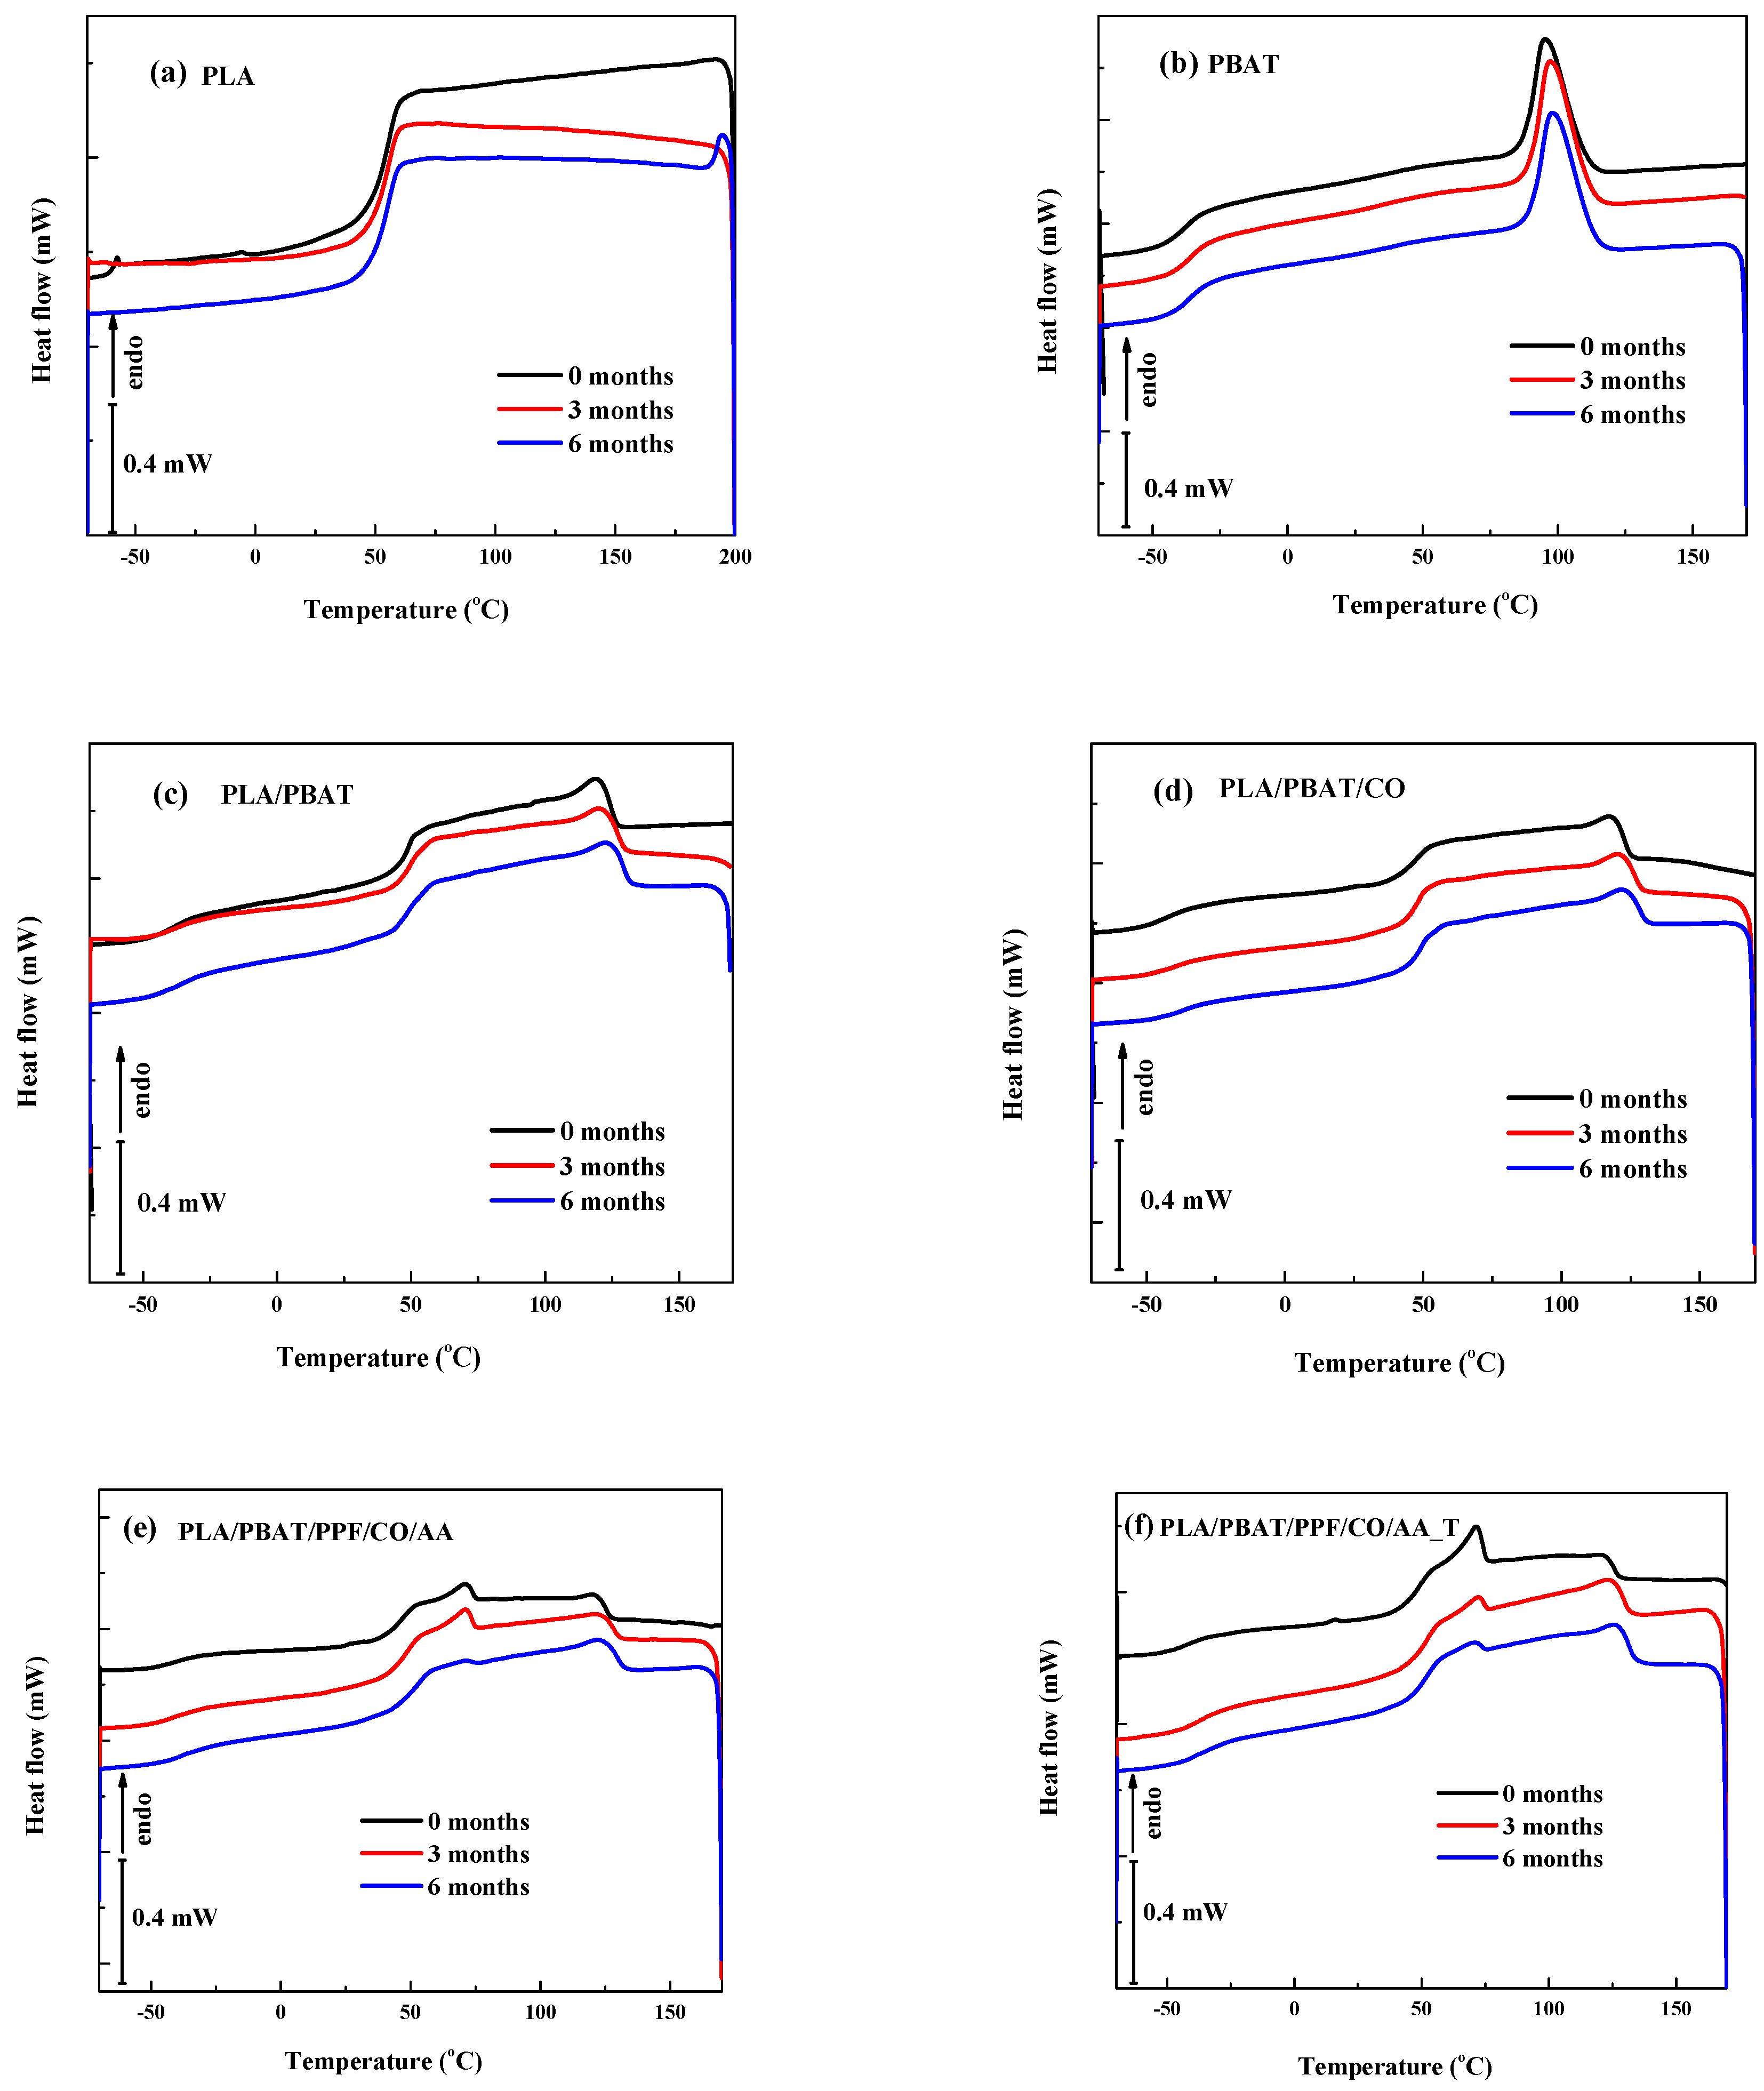
The results of thermal analysis by DSC for the fibers before and after degradation are shown in
Figure 5 and
Figure 6. The cooling and heating thermograms are shown in these two figures, also.
In
Figure 5a, the glass transition temperature (T
g) of PLA can be seen at around 61–62 °C. For PBAT in
Figure 5b, the crystallization temperature (T
c) increased for the fibers as the degradation time progressed with values of 95.6 °C (initial), 97.4 °C (3 months), and 98.1 °C (6 months). For the blends, the same behavior was observed. As the degradation time increased, the T
c increased as well as the PLA T
g (
Figure 5c,d). On the other hand, when PPF and AA were added to the blends, the T
c value shifted to higher values, being highest for the PLA/PBAT/PPF/CO/AA _T fiber. For example, after 6 months of degradation the T
c value of the PLA/PBAT/CO fiber was 122.4 °C and of the PLA/PBAT/PPF/CO/AA _T fiber it was 125.8 °C with a difference of almost 3 °C. For the PLA/PBAT/PPF/CO/AA fiber, a similar value to that of PLA/PBAT/CO was found (122.5 °C). The increase in T
c is associated with interaction between phases in the polymer blends. For the PLA/PBAT/PPF/CO/AA and PLA/PBAT/PPF/CO/AA fibers with and without temperature, the stiffening effect of the PPF and the enhancement of blend compatibility due to AA influenced the crystallization process of the blend. The increase in T
c is indicative of an increase in crystal size [
26].
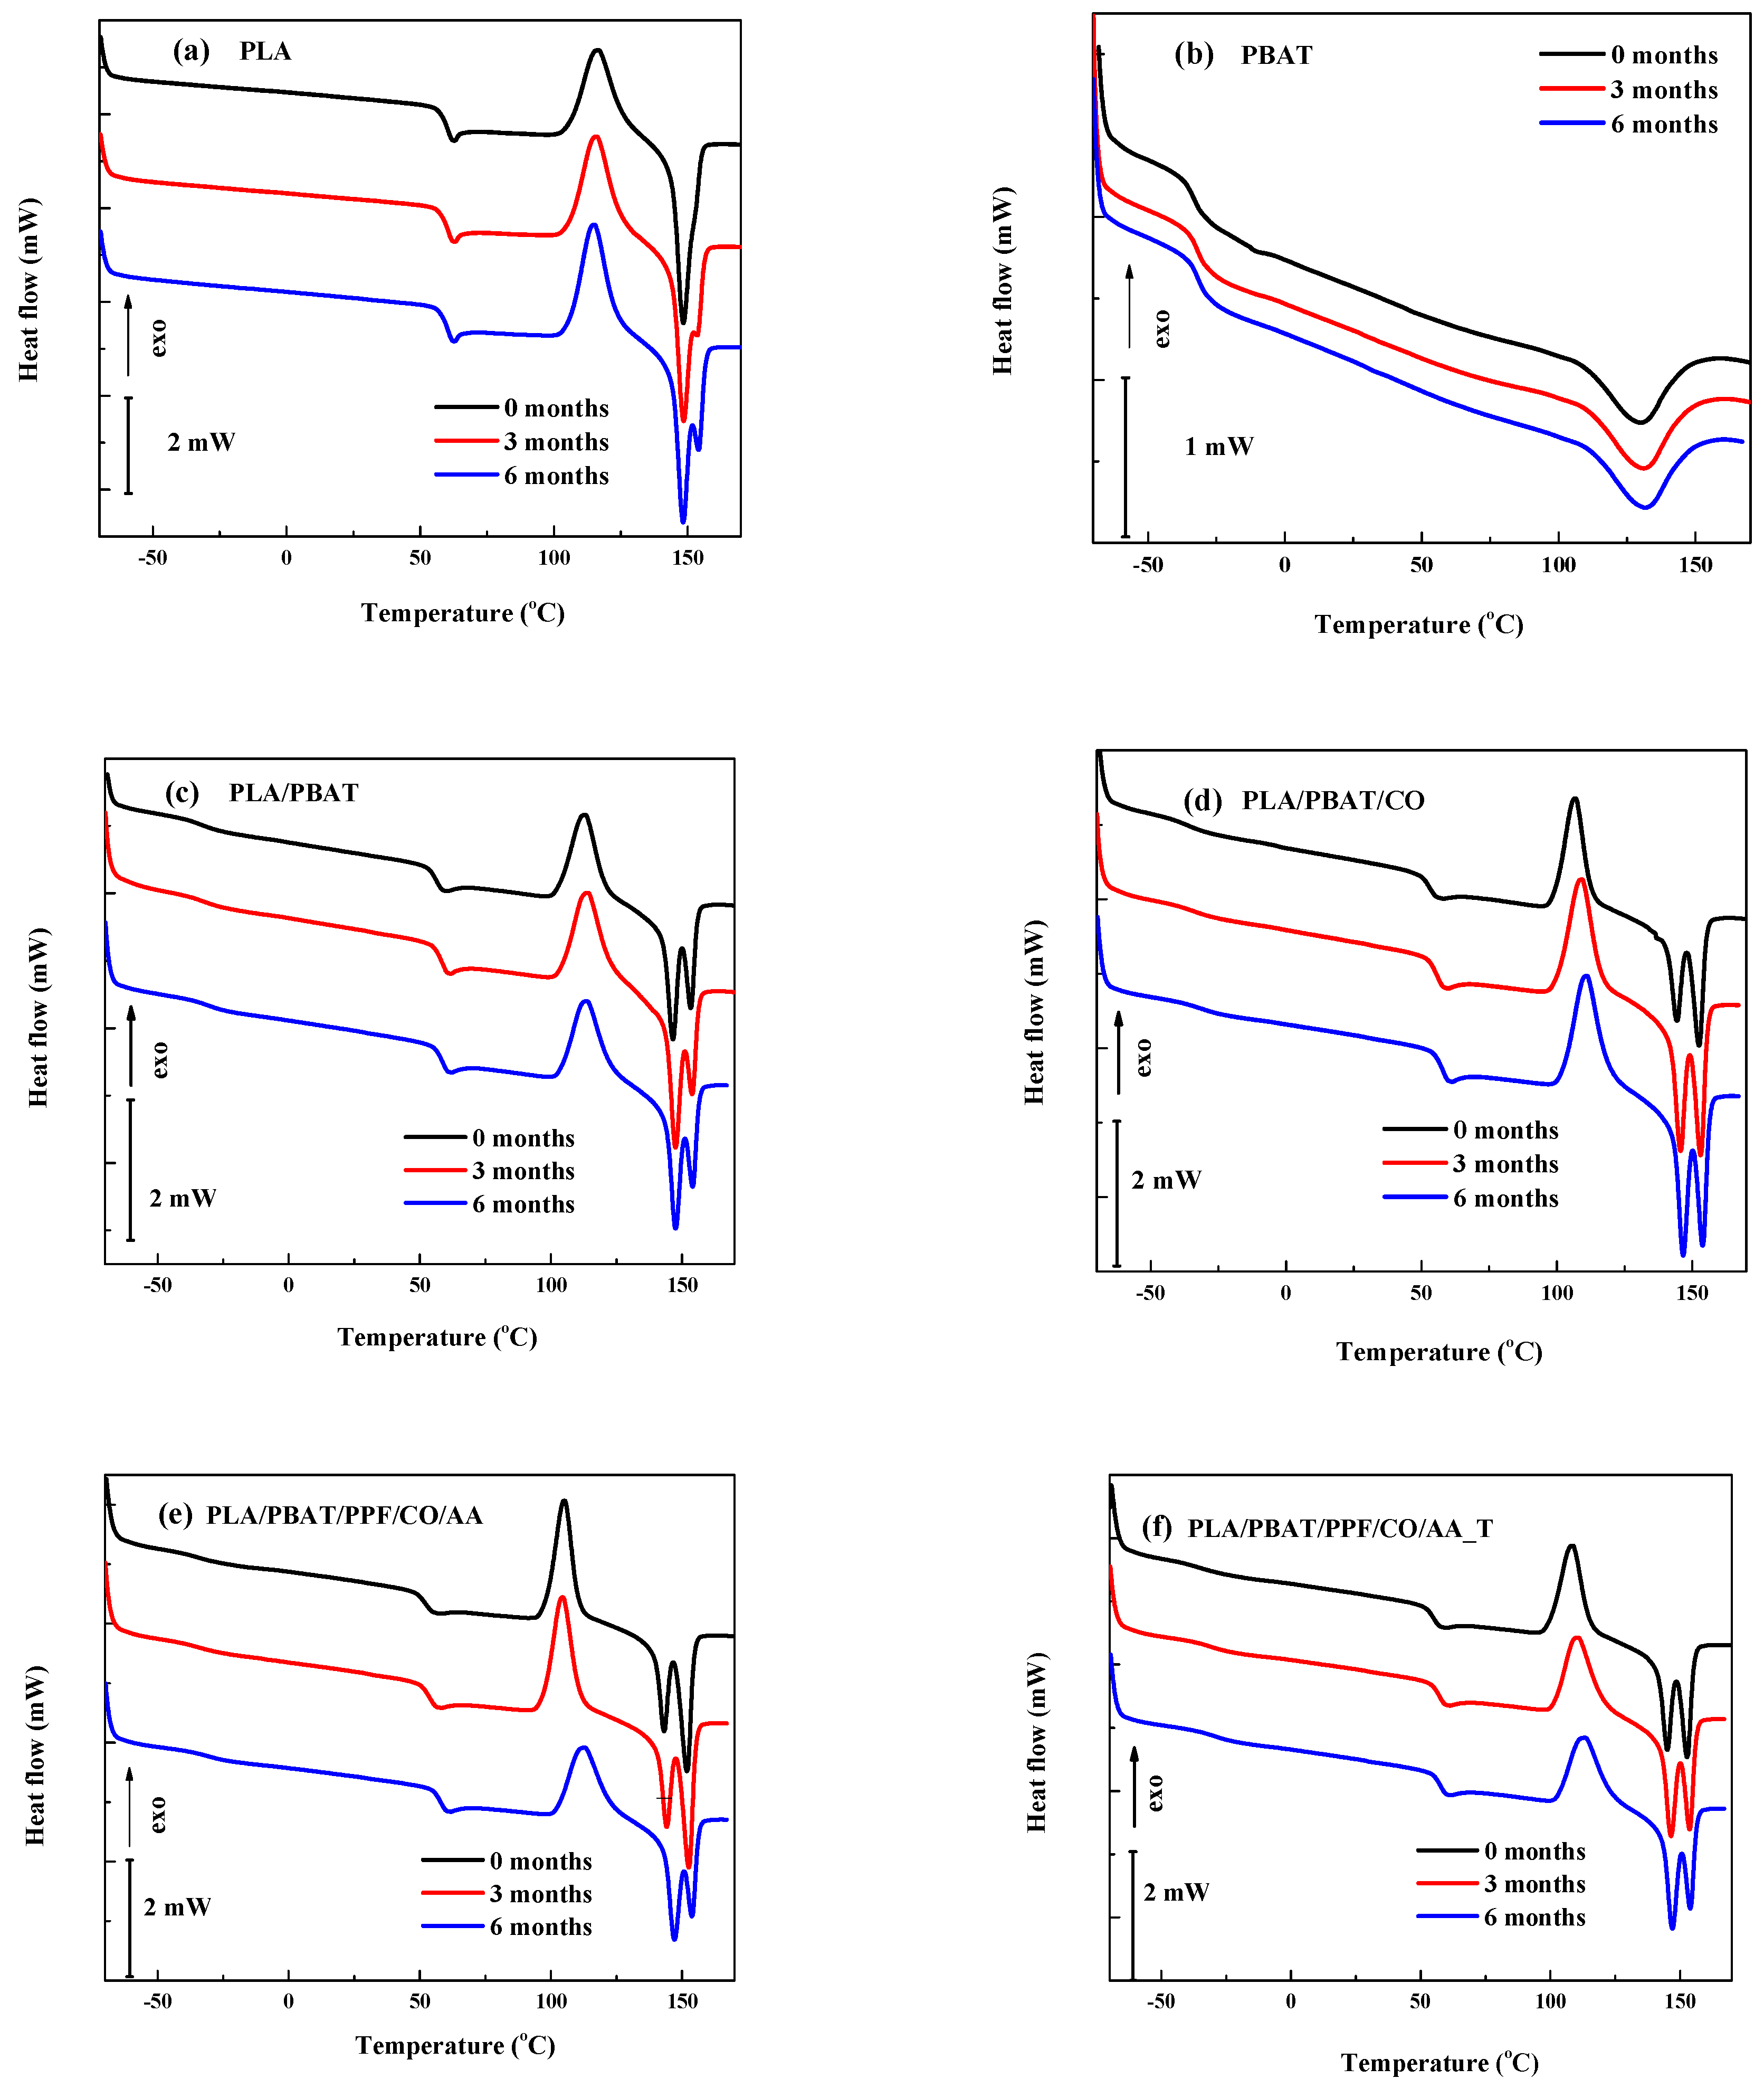
From
Figure 6, the second heating of the fibers before and after degradation can be observed.
The DSC curves corresponding to the second heating can be seen in
Figure 6. In
Figure 6a, the T
g and T
m of neat PLA were observed at 60.5 and 148.4 °C, respectively. Some authors have reported T
g values between 59.1 °C and 62.4 °C and T
m values between 147.8 °C and 154 °C [
13,
16,
37]. While the T
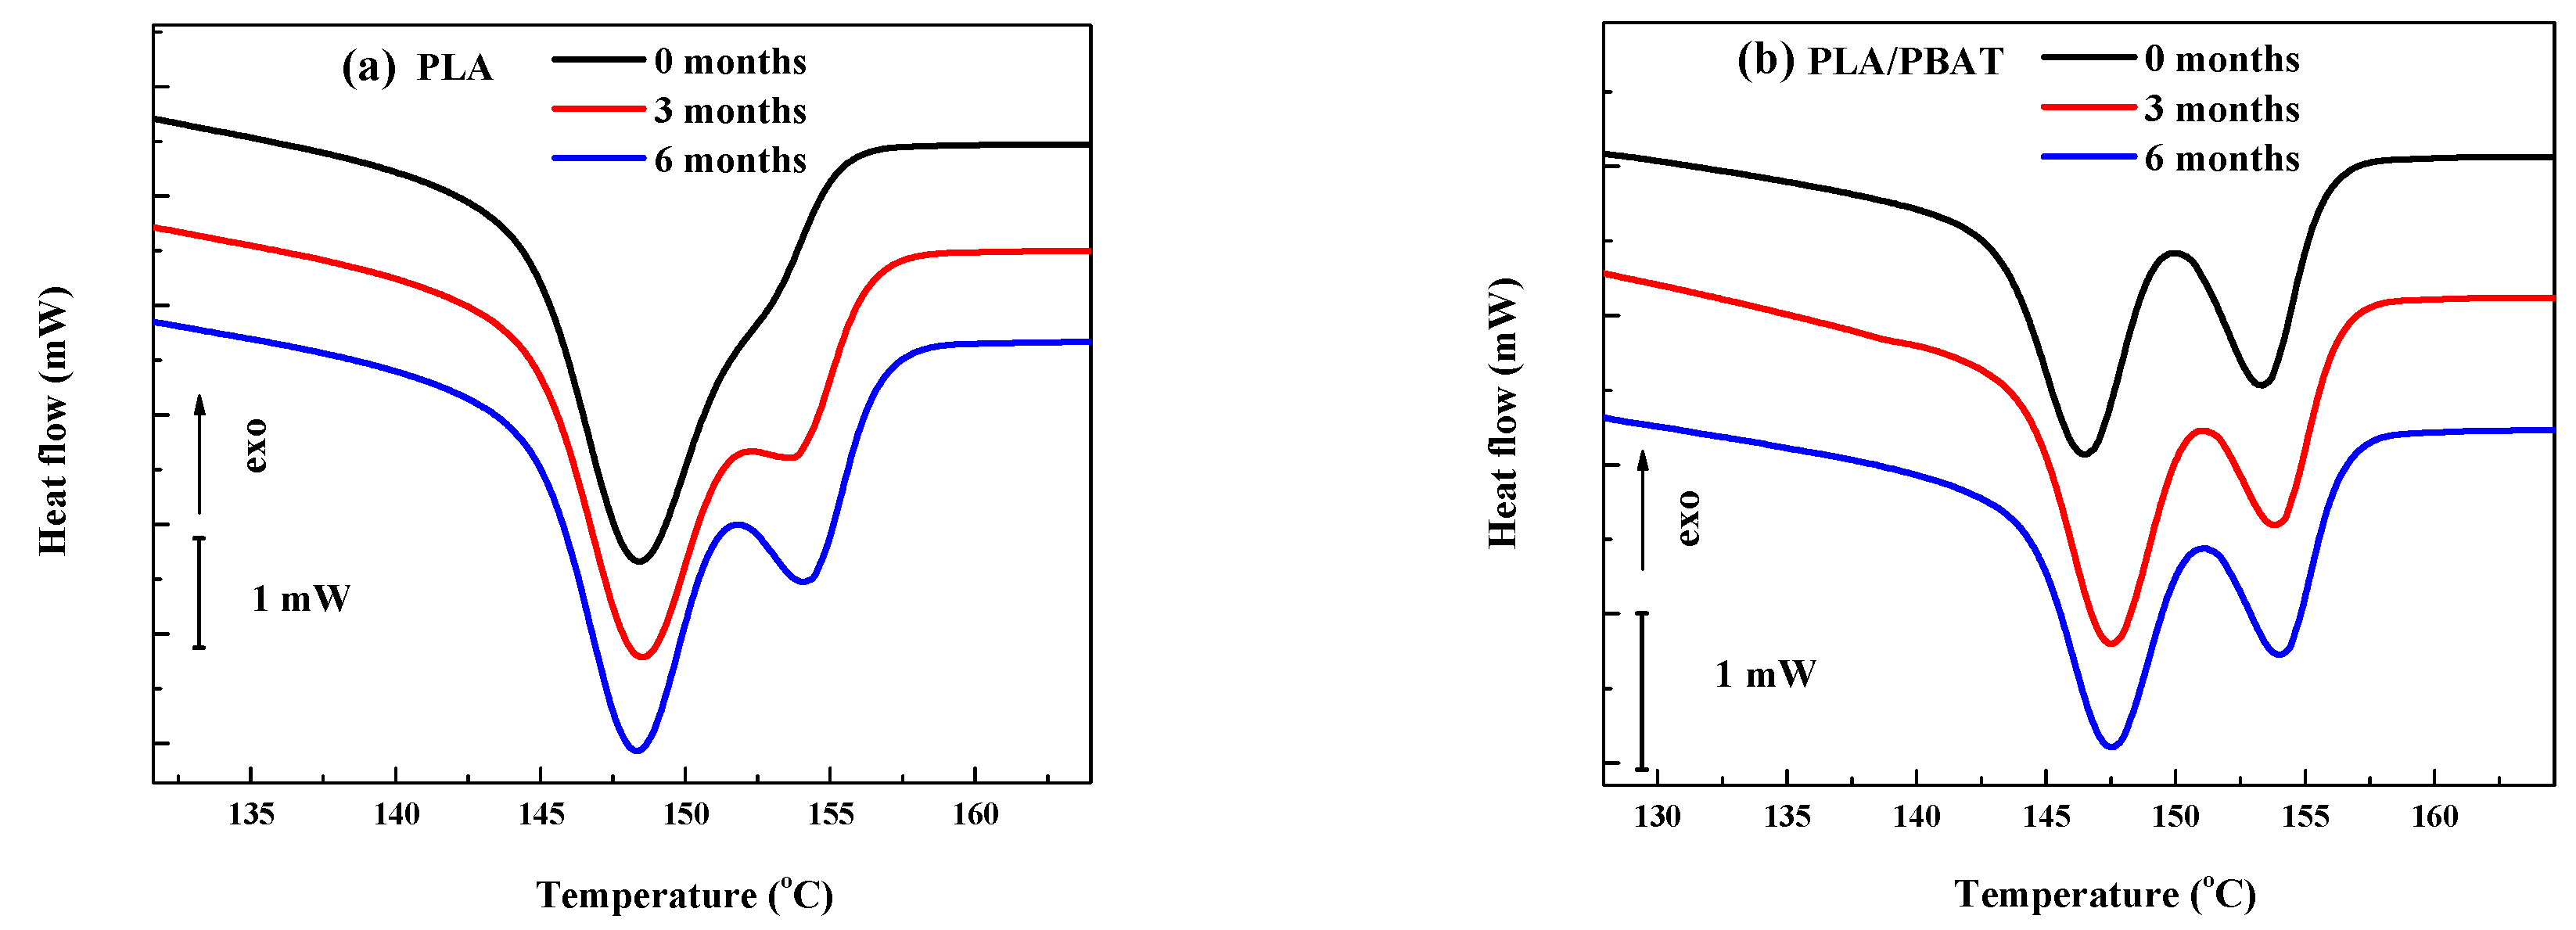
m of PLA before and after degradation remained constant (60.4–60.6 °C), the melting showed some differences. In the detail of
Figure 7a, before degradation, only one peak at 148.4 °C can be seen. After degradation the curve splits into two peaks showing T
m at 148.5 °C and 153.5 °C after 3 months and 148.4 °C and 154.3 °C after 6 months. While the main melting peak (148.4–148.5 °C) remained steady, the area and T
m of the new one increased progressively. This higher temperature component is attributed to new crystalline phases formed by smaller chains resulting from the degradation process [
31,
37].
The T
g value for PBAT was found at −33.1 °C (
Figure 6b), close to the −34 °C reported by Turek et al. [
40]. On the other hand, the T
m (129.8 °C) was slightly above those reported between 120 °C and 124.1 °C [
13,
16,
34]. As for PLA, the T
m of PBAT increased with degradation time (129.8 °C neat, 130.5 °C after 3 months, and 131.2 °C after 6 months).
The thermal behavior of the PLA component in the PLA/PBAT blend (
Figure 6c) is slightly different when compared to that of neat PLA, as shown in
Figure 7a,b. Both T
g and T
m decreased by 4 and 1.9 °C, respectively, and a higher melting temperature (153.2 °C) developed. These findings suggest the interaction between PLA and PBAT in the blend. Additionally, both the T
g and T
m values increased with degradation time: 56.5, 58.7 and 59.1 °C and 146.5, 147.5 and 147.5 °C initially and after 3 and 6 months, respectively, and approached those of neat PLA. This result can be interpreted as the selective degradation of either or both PBAT or PBAT-altered PLA regions.
For the PLA/PBAT/CO, PLA/PBAT/PPF/CO/AA, and PLA/PBAT/PPF/CO/AA_T fibers, a similar behavior was observed, as shown in
Figure 6d–f. First, there was a reduction in T
g for both the PBAT and PLA phases with respect to the PLA/PBAT blend, which is attributable to the plasticizing effect of canola oil. Second, there was a more noticeable increment in T
g values with degradation time, which points to the leaching of the additives along the degradation.
Between the T
g and T
m, a cold crystallization (endothermic peak) is observed for PLA and the blends. The cold crystallization peak for the PLA (
Figure 6a) was at around 115 °C and for the PLA/PBAT blend (
Figure 6c) at around 113 °C. For the other blends, the cold crystallization temperature (T
cc) was lower compared to PLA and, as degradation time increased, the T
cc increased. Values between 117 °C and 120 °C have been reported in the literature [
15,
30]. Nomadolo et al. [
41] and Vasile et al. [
38] found higher values of T
cc for PLA compared to the blends, as shown in this work. This is correlated with the presence of a nucleating agent in the blend composition accelerating the crystallization and decreasing the T
cc [
37,
41].
Comparing the fibers as the degradation process progresses, it has been reported that the crystalline domains increased during degradation. These domains act as networks or cross-linking points, limiting the mobility of PLA. Only amorphous chains with high molecular mobility undergo rearrangement and crystallize at low temperature resulting in cold crystallization. On the other hand, the chains with low mobility also crystallize, but at higher temperatures [
3,
38,
42].
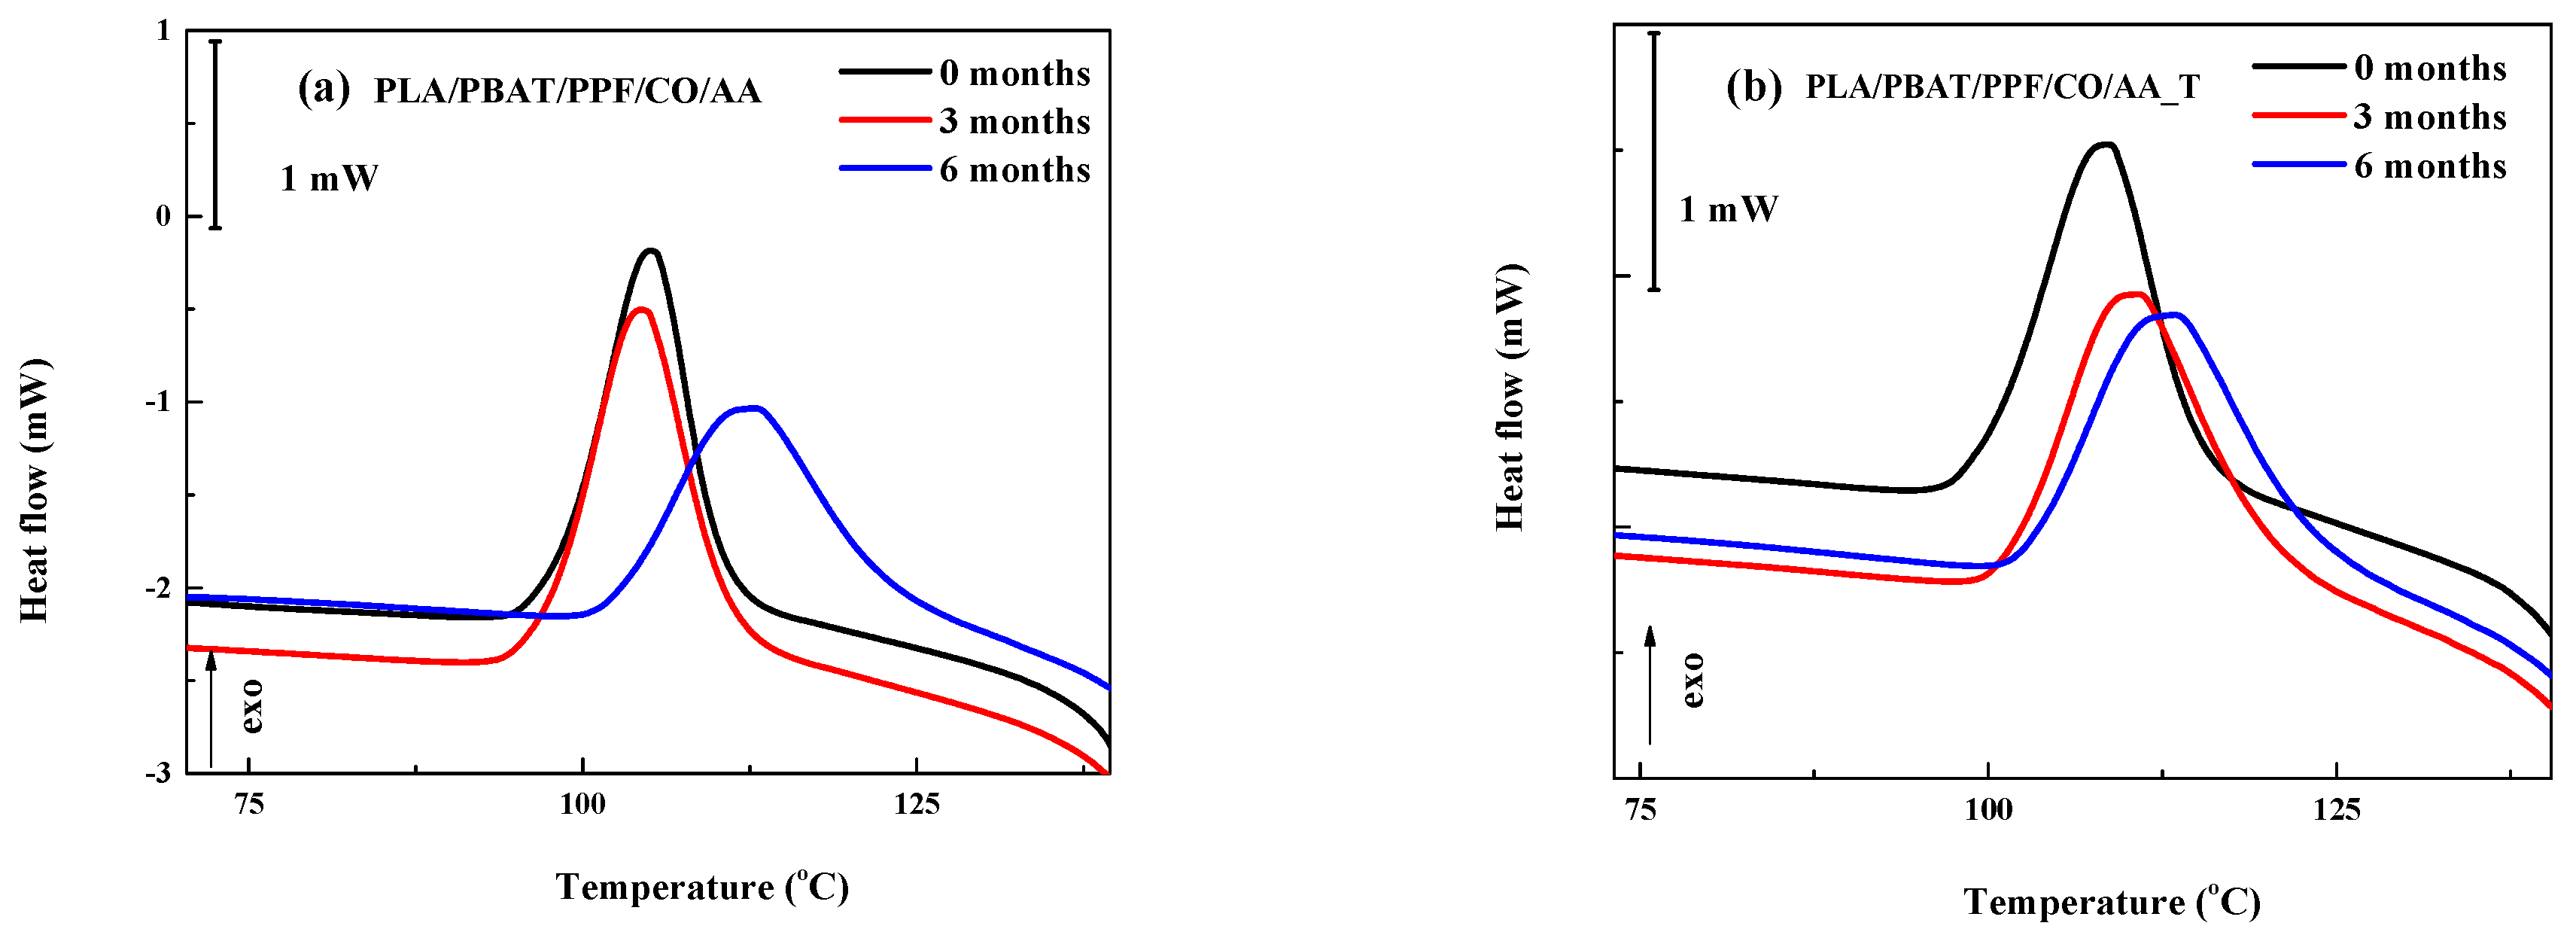
The detail of
Figure 8a shows that for the PLA/PBAT/PPF/CO/AA blend, a similar T
cc value was obtained for the initial fiber and after 3 months of degradation (105.0 °C and 104.3 °C, respectively). After 6 months of degradation, this value increased by 8.5 °C (112.6 °C). For the PLA/PBAT/PPF/CO/AA_T fiber, there was a displacement of T
cc to higher values from 108.5 °C (initial) to 110.5 °C (3 months) and 113.2 °C (6 months). As seen in
Figure 8b, after degradation, a similar T
cc value was reached after both 3 and 6 months. This could be related to the adhesion or uniform dispersion of the PPF with the use of temperature in the emulsion limiting the blend’s segmental motion [
43,
44].
DSC showed that the crystallization temperature (Tc) increased for the fibers as the degradation time progressed, as well as when PPF and AA were incorporated into the blend. For the melting, new crystalline phases resulting from the degradation process were found. Regarding cold crystallization, the most important change was observed for the PLA/PBAT/PPF/CO/AA fiber with an increase in Tcc after 6 months of degradation.
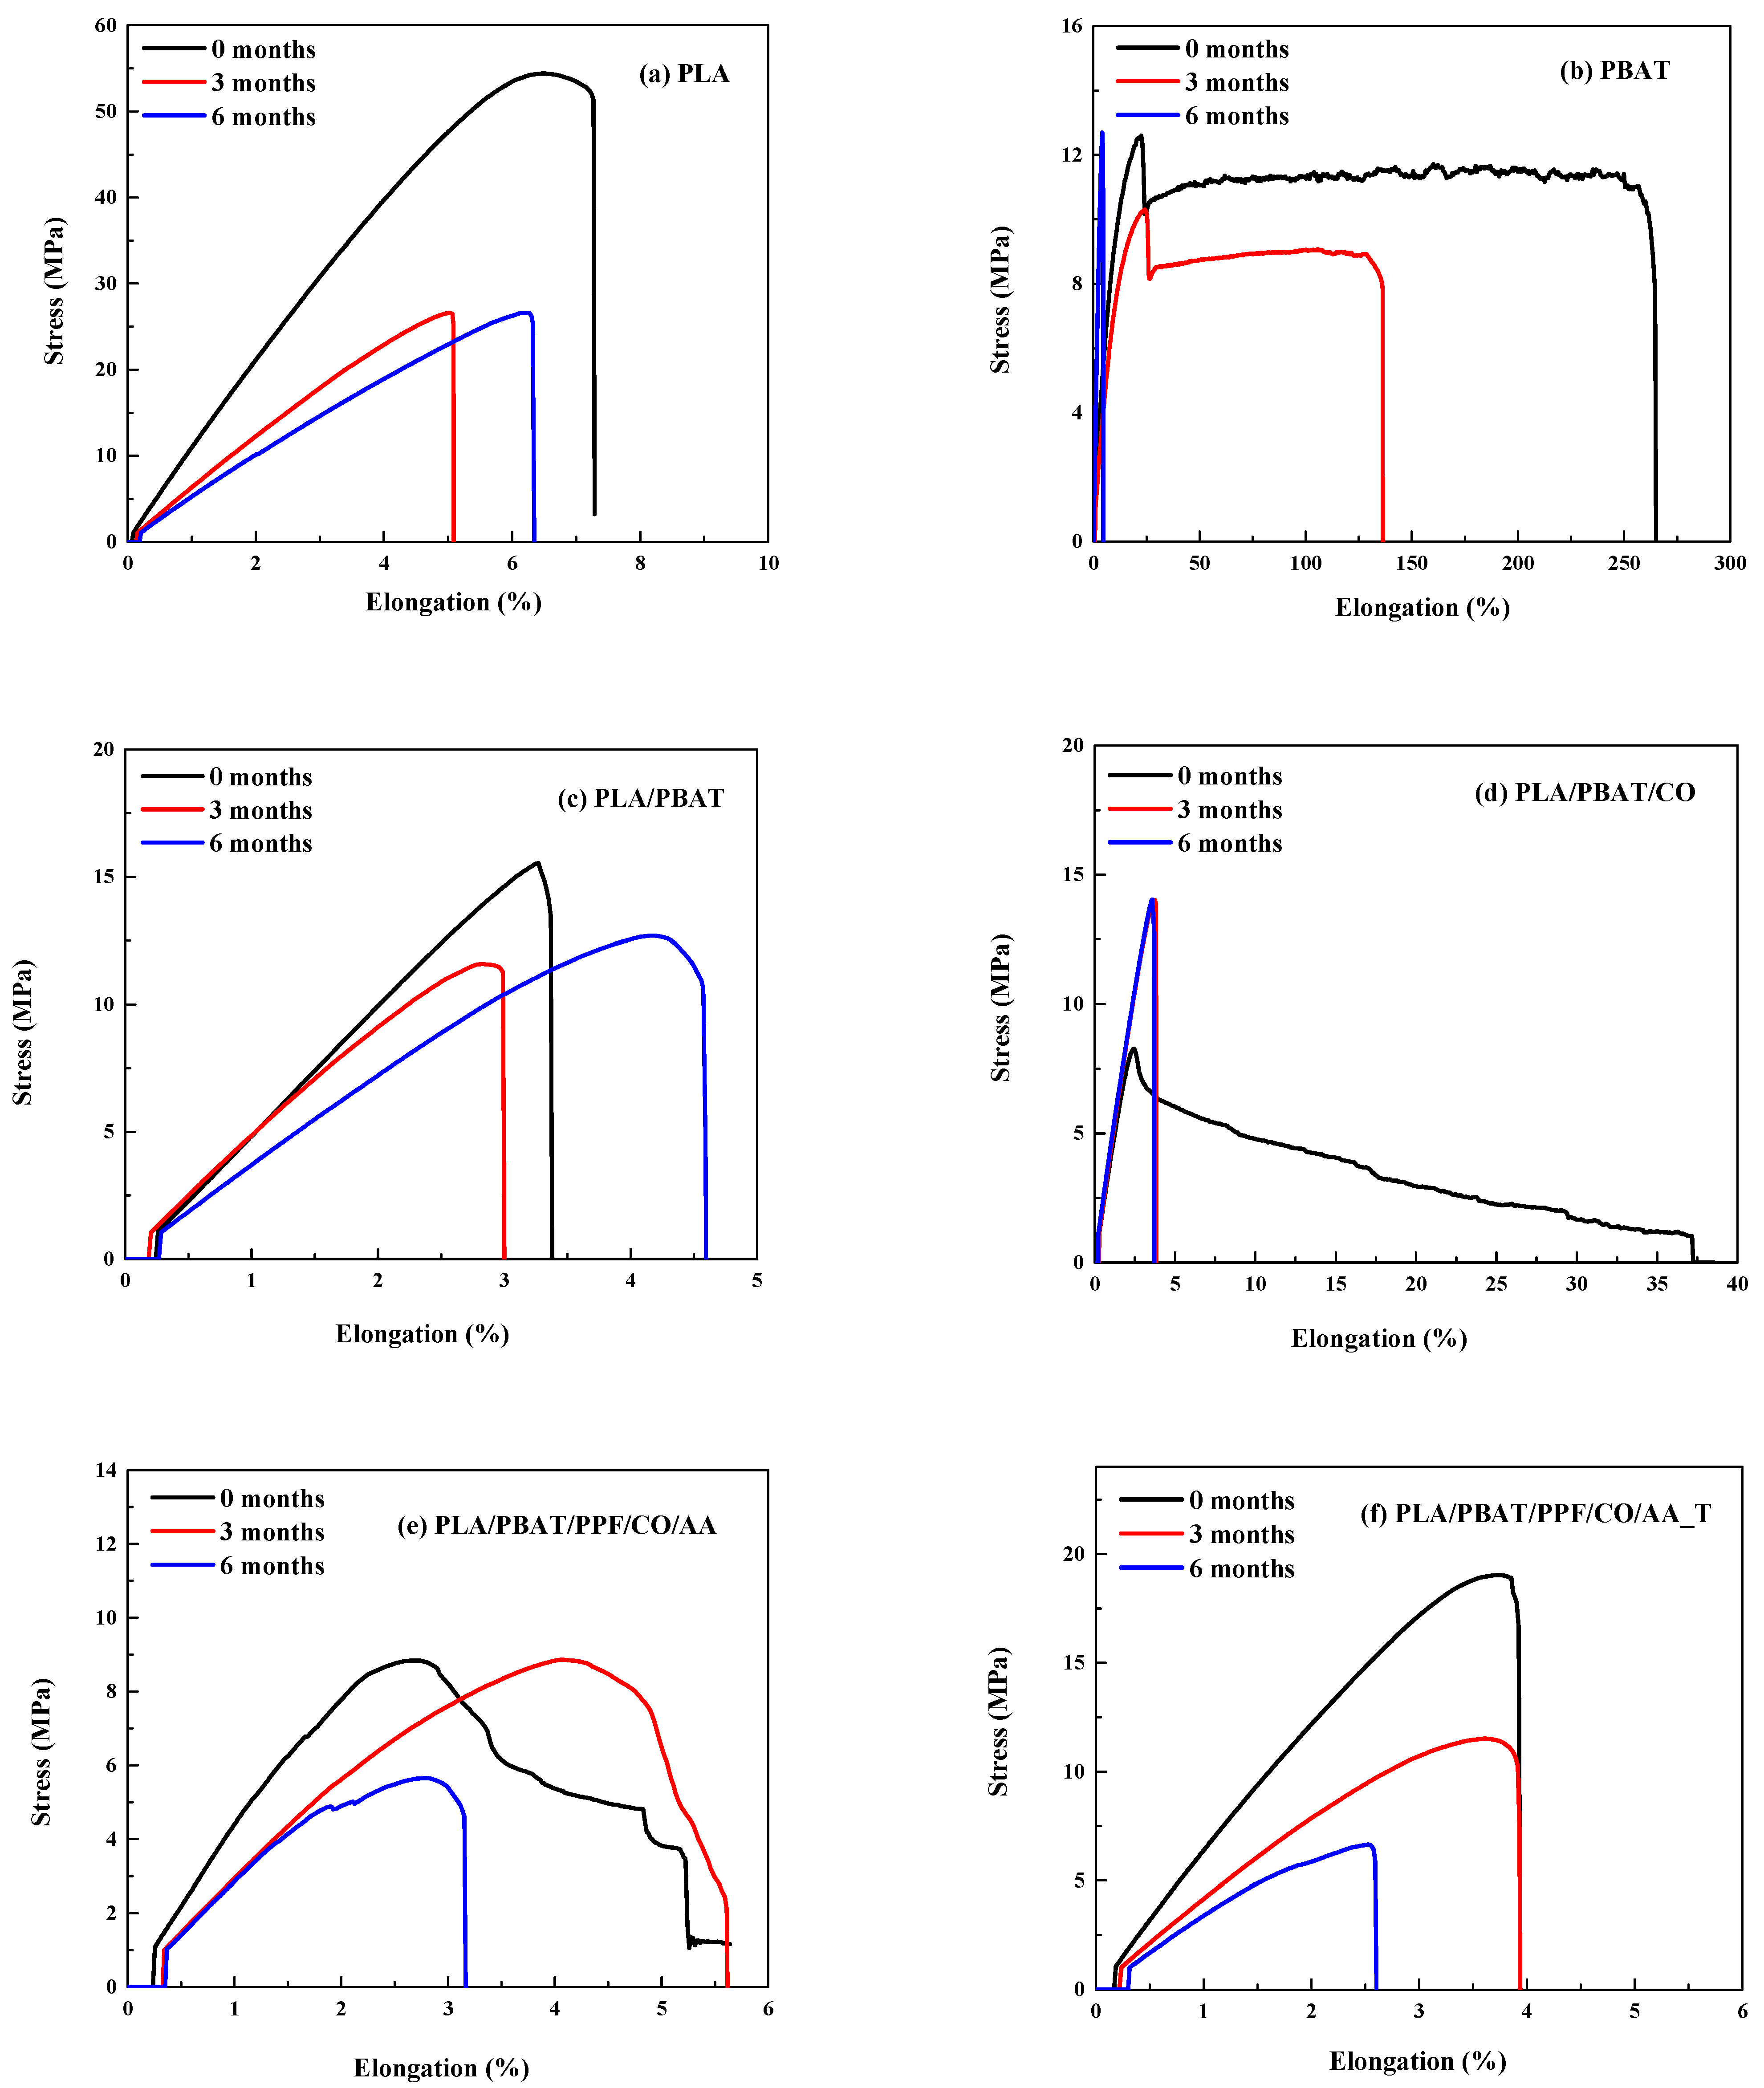
3.5. Mechanical Properties
The mechanical properties of the fibers are reported in
Table 6 and also illustrated in
Figure 9. For the initial fibers, PLA showed a higher Young´s modulus and tensile strength but lower elongation at break than PBAT, as shown in
Table 6. A decrease in the tensile strength of PLA fibers in compost over time has been reported by Borelbach et al. [
10]. In the case of the PLA/PBAT blend, the modulus and tensile strength were close to averages of both components. However, the deformation was similar to that of neat PLA; therefore, the incorporation of PBAT into PLA did not increase the flexibility of PLA. By adding CO, Young´s modulus and tensile strength decreased compared to PLA/PBAT. On the other hand, the elongation at break was improved. It has been reported in the literature that CO improves the elongation at break [
45]. On the other hand, when AA (PLA/PBAT/PPF/CO/AA) and temperature (PLA/PBAT/PPF/CO/AA_T) were used, an increase in Young´s modulus, tensile strength, and a decrease in elongation at break was observed compared to PLA/PBAT/CO. This can be attributed to the stiffness of the PPF and the improvement of the interfacial adhesion and stress transfer between the polymer matrix and the PPF [
44]; therefore, ductility and toughness were enhanced with the addition of PPF [
43]. However, after 3 and 6 months of degradation, those properties decreased, indicating a restriction in segmental mobility [
8] and an increase in crystalline regions with degradation time [
38], as clearly seen in
Figure 9. This was also observed via the increase in T
cc and T
m in the DSC thermograms (
Figure 6).
After 3 and 6 months of degradation, the trend was the same for the initial neat polymers and the PLA/PBAT blend. However, for the PLA/PBAT/CO fibers, Young´s modulus was higher compared to the PLA/PBAT fibers, the opposite of the initial ones. The tensile strength and elongation at break values were similar. After AA incorporation (PLA/PBAT/PPF/CO/AA), Young´s modulus decreased as well as the tensile strength and elongation at break. Finally, for the PLA/PBAT/PPF/CO/AA_T fibers, the modulus decreased and the tensile strength and elongation at break remained almost the same compared to the PLA/PBAT/PPF/CO/AA fibers.
As the degradation time increased, there was a decrease in the mechanical properties of the PLA, PBAT, and PLA/PBAT/PPF/CO/AA_T fibers. This difference was more noteworthy when comparing the initial and degraded fibers, being similar for the 3- and 6-month degraded ones. This decrease in mechanical properties can be seen in SEM micrographs (
Table 5), in which the fiber delamination, holes, and cracks could be observed in the blend fibers, associated with the weight loss (
Table 2). It has been reported by several authors [
46,
47,
48] that the mechanical properties decreased after degradation in PLA, PBAT, and their blends.
The incorporation of PPF and AA into the blends modifies interactions between the components. Moreover, when temperature was used for the emulsion preparation, lower weight loss was observed compared to the PLA/PBAT/PPF/CO/AA fibers, so perhaps the PPF loss was hindered by these interactions [
38]. As can be observed from the results, degradation is a complex process that depends on the environmental conditions [
49,
50,
51].
Statistically, the main significant differences (p ≤ 0.05) between compositions and degradation time were obtained for the mechanical properties of PLA and PBAT.


 ,
, 


