1. Introduction
It has been estimated that the P recovered from municipal wastewater can fulfill around 15–20% of the currently imported mineral phosphorus (P) fertilizer in Europe [
1,
2,
3]. Thermal treatment is the fastest-growing P recovery technology with P recovery potentials of up to 90%. This technology can treat sewage sludge at large scales and turn it into ash with a P content of 5 to 11% [
4,
5,
6,
7]. The precipitation of P is the most widely used technology for P recovery from municipal wastewater, but offers lower P recovery efficiencies of 10–40%. The precipitation of P from sewage sludge or, more often, the liquid phase of sewage sludge leads to the formation of P salts, with a P content up to 28%. In addition, wet chemical leaching using acid or alkaline solutions to transfer P ions from the sludge to the liquid phase is often used as a preceding step that makes P in the sewage sludge more accessible for recovery and increases the P recovery efficiency up to 90% in some cases [
8]. In addition to those established P recovery technologies, there is a rising interest in P recovery from smaller size (PE < 10,000) wastewater treatment plants (WWTPs) using natural, low-cost P removing materials [
9]. For example, microorganisms, algae, and macrophytes can recover P from wastewater with efficiency from 70–90% and P content in biomass from 0.03–3% [
10,
11,
12]. The mechanisms involve the adsorption and assimilation of P in the form of intracellular polyphosphate (poly-P) as an energy source for biomass growth [
13]. In addition, crustacean waste discarded by many marine product manufacturers and restaurants is a large source of natural sorbent [
14]. Crustacean shells are composed mainly of 20–30% protein, 30–50% calcium carbonate and calcium phosphate, and 20–30% chitin, making them suitable for P adsorption and P removal with an efficiency of 70 to 90% [
15].
Secondary (recovered) P fertilizing products are often characterized as slow release with low solubility in water, which is a desirable property as slow assimilation into the substrate solution allows a high application rate without damaging plant roots. Additionally, it reduces losses of P from fertilizing products during rain precipitation and makes a single application sufficient to meet the nutrient demand of the crop throughout the growing season [
16,
17,
18].
Plant growth tests are the most widely used method to assess the P availability of fertilizing products, and therefore their standardization is crucial. One of the prerequisites for plant growth trials that aim to assess the P availability of novel P fertilizing products is defining the properties of the substrate or soil used, as it will have essential impacts on the P efficiency of fertilizing products. The main characteristic should be to find a low P substrate that does not interfere with the P dynamics of the fertilizers. However, there are certain biases to find these types of substrates, such as (i) the low availability of natural low P agricultural soils, or (ii) the use of different chemical extraction methods to measure P concentration that has led to contradictory measurements of available P in the tested substrate, and therefore different conclusions [
19].
For this reason, river sand with low nutrients and a trace element composition might be the most promising substrate to use in standardized P availability tests. On the other hand, there is an increasing development of various growth media, substrates that have physico-chemical properties closer to typical soil characteristics, that may become alternatives for standardized P availability tests if their retention and release of P are comparable to that obtained in river sand [
20]. Moreover, the optimal substrate should avoid fixation of P by calcium (Ca) at high pH, and by iron (Fe) and aluminum (Al) at low pH.
In previous studies, precipitated P salts showed to have a comparable agronomic efficiency to commercial mineral P fertilizing products, independent of the soil type used, while P availability of thermally oxidized materials, having a more complex composition, appeared to be more affected by the soil characteristics [
21]. For instance, it is known that the agronomic efficiency of sewage sludge ashes (SSAs) is highly affected by soil pH, achieving higher efficiency in acidic soils [
22,
23,
24]. However, if the alkaline soil contains high concentrations of clay the results could be different, as observed by Zeggel et al. [
25], who indicated a higher efficiency of SSAs for maize and oilseed rape in alkaline clayey silt compared to acidic silty loam. The use of algae grown in wastewater streams as a fertilizing product is manifested, but not well studied regarding P availability [
26,
27,
28,
29,
30,
31]. Still, some studies have shown that the strong cell wall of algae could delay P release from algal biomass [
32,
33,
34,
35,
36]. Similarly, the application of crustacean waste for plant growth has also improved crop yield [
37,
38,
39]. However, experiments regarding its P availability are scarce and more research is needed to estimate its agronomic efficiency. In our previous study using struvites, ashes, and dry sewage sludge, we identified that a four-month period is a minimum and seven an optimum period for observing the slow P release of secondary P fertilizing products. The current study increased the variety of novel recovered P fertilizing products analyzed, i.e., leached P salts and organic-rich natural P sorbents. Therefore, the timing needed for achieving maximum shoot yields and P release in treatments amended with these novel fertilizing products is evaluated in this study.
In addition, according to the current European fertilizing product regulation (FR) [
40,
41], chemical extractions are recommended methods for the assessment of P availability in fertilizing products. However, the studies that evaluated different chemical extractions for predicting P availability in secondary P fertilizing products have been inconclusive [
21,
42,
43,
44]. In addition to the traditional methods, novel ones that test P in the soil solution (anion exchange resins, iron-coated filter papers, iron bag, Rhizon soil moisture sampler, Diffusive Gradients in Thin Films, etc.) for assessing the P availability of secondary P fertilizing products have indicated a good correlation with the concentration of P in plants [
43,
44,
45,
46,
47,
48]. Still, the number of those studies is limited.
In this study, a pot trial is set to investigate the time and substrate effect on plant P availability from novel secondary P products, i.e., chemically leached P salt, pyrolyzed, and incinerated sewage sludge ash, microalgae, and crab carapace phosphate. To observe the P release pattern of novel secondary P fertilizing products, perennial ryegrass (Lolium perenne, OAKPARK variety) was grown for four months and the shoot yield and P concentrations were measured monthly at each cut. It is hypothesized that the novel secondary P fertilizing products could achieve higher P uptake efficiency (PUE) than the unfertilized treatment (Zero P) and comparable P uptake efficiency (PUE) to commercial mineral fertilizer TSP. To test the substrate effect on P efficiency of novel secondary P products, the pot trial is performed on slightly acidic river sand, previously defined optimal for measuring P availability, as well as two other substrates, alkaline mineral and slightly acidic organic to test if they are equally eligible for standardized P availability tests. In addition, substrate pore water was sampled with Rhizon samplers for four months. The concentration of P in substrate pore water was then compared to P taken up by the plant shoots. It was envisioned that substrate pore water sampling with Rhizons is a quicker, non-invasive method that can be frequently used to assess P availability of novel secondary P fertilizing materials and is equally effective as chemical P extraction from the plant shoots.
2. Materials and Methods
2.1. Fertilizing Products Analysis
To examine the variety of novel P fertilizing products recovered from municipal wastewater (MWW), four different secondary P fertilizing products were selected: (1) a chemically leached P salt (P salt CL) from the PULSE process, University of Liege (ULiège); (2) a microalgae (MA) from Glasgow Caledonian University (GCU); (3) a crab carapace material (CCM) from the Environmental Research Institute (ERI)-Veolia; and (4) a sewage sludge ash (SSA PI) obtained by pyrolysis and incineration using EuPhoRe® process. Additionally, a commercial mineral fertilizing product, triple superphosphate (TSP), obtained from Pillaert Meststoffen NV (Ghent, Belgium) was used as control.
The PULSE process is based on the PASCH process [
49] and adapted to treat dried sewage sludge to recover P. The lab-scale consisted of several steps: sludge drying, sludge leaching using 1–2 mol L
−1 hydrochloric acid (HCl), sludge liquor extraction using several solvents (Alamine, Ketrul, Di-(2-ethylhexyl) phosphoric acid, and tributyl phosphate) for metal removal, and precipitation into P salt using sodium hydroxide (NaOH). The sludge used for P salt CL production was taken from a WWTP that combines biological and chemical P removal. The production of microalgae (MA) from Glasgow Caledonian University (GCU) was based on the growth of extremophilic microalgae
Chlamydomonas acidophila in a photobioreactor under controlled pH and light. The wastewater from the primary settling tank of a WWTP was used as a P source for MA production [
50,
51]. The production of crab carapace material (CCM) from ERI-Veolia employed thermochemical modification using potassium hydroxide (KOH) to deacetylate the chitin chain of crab carapace (
Cancer pagurus) and dry it at 105 °C to create a chitosan-calcite adsorbent [
52,
53]. The absorbent was then applied in Veolia’s pilot reactor FILTRAFLO
TM-P that uses gravitational wastewater filtration through an adsorption media with continuous self-backwashing. The effluent wastewater was used as an inlet to the P recovery plant that produced CCM. The pilot plant of the EuPhoRe process consisted of a two-step thermal treatment of sewage sludge into sewage sludge ash, pyrolysis reduction step (650–750 °C), and incineration oxidation step (up to 1000 °C) [
50,
51]. The additives were not provided to the sludge at this stage of EuPhoRe
® technology development, but are planned for the future optimization of the technology. The sludge used to produce SSA PI was supplied from a WWTP with a chemical P removal treatment.
All fertilizing products were milled to <20 μm, using a Planetary Micro Mill PULVERISETTE 7 classic line (Fritsch GmbH, Idar-Oberstein, Germany) to homogenize the samples and achieve analytical precision as the samples were of different sizes and shapes. The powdered fertilizing products were then stored in a desiccator at room temperature to prevent moisture absorption.
Total carbon (TC), organic carbon (C
org.), and total nitrogen (TN) were measured using a CNS analyzer (Thermo Electron, CN Flash 2000) on the powdered fertilizing product samples. In addition, total mercury (Hg) was also measured on the powdered fertilizing product samples using an automated atomic absorption spectrophotometer, DMA 80 (Milestone), according to EPA method 7473 [
54].
Other elements were analyzed using aqua regia closed microwave digestion (MW AR) (CEM MARS 6 240/50, MJ 1482, Matthews, NC, USA). The AR microwave digestion was conducted as described in Bogdan et al. [
20].
After extraction, the elements of interest were determined using inductively coupled plasma optical emission spectrometry (ICP-OES; Thermo Scientific™ iCAP™ 7400, Thermo Fisher Scientific, Waltham, MA, USA), whose detection and quantification limits (LOD (LOQ), ppb) are provided in the
Supplementary Materials (S1). The standard reference material used for quality control of elements after MW AR and ICP-OES determination method was a multi-nutrient fertilizing product (MNF) from NIST (NIST
®SRM
®695).
In addition, fertilizing products were also characterized using the water extraction method. For each fertilizing product, 0.5 g of sample was agitated with 25 mL of Milli-Q water in 50 mL PP centrifuge tubes, at 170 rpm on an IKA KS 260 mechanical shaker at room temperature for 24 h. The resultant suspension was then centrifuged at 2000 rpm for 10 min. After the filtration of 9 mL of a sample using a 0.45 μm nylon syringe filter (Fisher Scientific, Loughborough, United Kingdom), the solution was acidified with 1 mL of HNO3 and the P concentration of the samples was then determined by ICP-OES (Varian 720ES, Agilent, Santa Clara, CA, USA).
The analysis of persistent organic pollutants (POPs), 25 organochlorines (OC) pesticides, and 7 polychlorinated biphenyls (PCBs) in all P fertilizing products was performed according to NEN 6980 method [
55], and for 10 polycyclic aromatic hydrocarbons (PAHs), according to NEN-ISO 18,287 method [
56].
2.2. Substrates Analysis
Three substrates were tested: river sand substrate (S1), artificial mineral substrate (S2), and organic horticultural substrate (S3). The physico-chemical characteristics of river sand obtained from Kesteleyn nv Zand en Grint, in Ghent, Belgium were already discussed in Bogdan et al. [
20]. The artificial mineral substrate, manufactured at HGoTECH GmbH, Bonn, Germany, contained a mixture of quartz sand (74%), clay (17%), and silt (9%) (ISO 11277 method [
57]). The organic horticultural substrate, manufactured at Greenyard Horticulture Belgium NV, Ghent, Belgium, consisted of a mixture of white peat (H2-H4 on the von Post scale (50%
v/
v) and black peat (50%
v/
v)). The Baltic black peat is a coarse fraction (0–10 mm) and the Baltic white peat is a 4–10 mm fraction. The chemical analysis of S2 and S3 was conducted with the aqua regia (AR) hot plate extraction method [
58] and the ICP-OES instrument as the determination method. Internal laboratory reference soil materials, A and B, were used for validation of analysis and results. Concentrations of TN and TC were measured using a CNS analyzer (Primacs SNC 100-IC-E, Skalar Analytical B.V., Breda, The Netherlands). In addition, the available P was estimated using the calcium acetate lactate method (CAL-P) [
59]. The pH value of the three substrates was measured using an Orion-520A (Orion Research, Inc., Boston, MA, USA) pH meter, after extraction in (i) water (H
2O) (S:L ratio = 1:5 ratio) after equilibrating for 24 h, (ii) in 1 M potassium-chloride (KCl) (S:L ratio = 1:5 ratio) after equilibrating for 18 h, and (iii) in 0.01 M calcium chloride (CaCl
2) (S:L ratio = 1:2.5), after equilibrating for 30 min [
58]. The electrical conductivity (EC, µS cm
−1) of the three substrates was determined using an Orion-520A (USA) meter after dissolving and shaking them in distilled water (S:L ratio = 5:1) for 30 min [
58].
2.3. Experimental Setup
To assess the P availability of the secondary P fertilizing products (P salt CL, MA, CCM, SSA PI), along with a positive (TSP) and a negative (no fertilizing product addition, Zero P) control, a pot trial was established to grow perennial ryegrass (Lolium perenne) on the three studied substrates.
Each pot was filled with substrate up to 2.4 L. The P fertilizing products were spread 2 cm below the surface (each was applied to four pots). Since the typical annual P demand for ryegrass is 60 kg P
2O
5 ha
−1 (for a yield of 10 t ha
−1) [
60] and this amount was also defined optimal in a previous dose–response test [
20], the P fertilizing products were supplied at the rate of 33.7 mg P pot
−1. Ryegrass seeds were sown 1 cm below the surface of each pot at 3.5 g m
−2 or 35 kg seeds ha
−1 [
61], corresponding to a quantity of 44 mg of seeds (20 to 25 seeds per pot).
To provide essential nutrients, other than P, a modified Hoagland solution [
62], formulated based on the nutrient needs of perennial ryegrass [
60,
63,
64,
65,
66] and the concentration of the elements already present in the fertilizing product added, was supplied at the beginning of the pot experiment (
Supplementary Materials, Table S1). The nutrient solutions aimed at providing half of the typical yearly demand for ryegrass, i.e., 136 N, 117 K, 390 Ca, 21.6 Mg, 9 S, 7.1 Mn, 3.6 Zn, and 1.15 Cu (mg pot
−1). The pots were watered 3 times a week using distilled water by weighing the pots and adjusting the weight to reach a WHC of 80%. With every watering, the positions of the pots were randomized.
The pots were placed indoors in a growing chamber at room temperature and under artificial lights (BRITE-GROW tube lamps, 2000 LUX, 36 W) that were placed 40 cm above the pots at cycles of 16 h daytime (light) and 8 h nighttime (dark). The plants were grown for four months. The first cut was conducted after five weeks of growth when the plants had already formed the third leaf. It took one week for plants to reach the level of the pot (mowing height of 4 cm), and therefore all other cuts were performed every four weeks.
2.4. Plant Analysis
Plant shoot yield (g pot
−1) and the plant shoot P concentration (mg P g
−1) were determined after each cut. The shoot yield was measured after drying fresh cuttings for 5 days (prolonged due to COVID-19 measures) at 60 °C. The nutrients in the shoots were then extracted by microwave digestion (ultraWAVE, Milestone Srl, Sorisole, Italy) using a modified aqua regia solution (4 HCl:1 HNO
3) as described in detail in
Supplementary Materials (S2). The P concentrations (as well as other macronutrients) in the shoots were then determined using ICP-OES (Thermo Scientific™ iCAP™ 7400, Thermo Fisher Scientific, Waltham, MA, USA). The concentrations of several trace elements of concern (Cu, Zn, As, Pb, Ni, Cd, Cr, and Co) were analyzed in plant shoots from S1 (substrate with the lowest trace element concentrations) using ICP-MS (iCAP Q Series, Thermo Fisher Scientific, Bremen, Germany). The plant N concentration was determined only for S1 after each cut using a SNC analyzer (Primacs SNC 100-IC-E, Skalar Analytical B.V., Breda, The Netherlands) as the shoot yield on S2 was very limited, and it was used for P analysis only. Nitrogen analysis in shoot yield grown on S3 was also excluded based on plant P results.
The plant P uptake after each cut was calculated as the multiplication of shoot yield (g pot
−1) and shoot P concentration (mg P g
−1) for each fertilizing product:
The cumulative shoot yield (g pot
−1) and cumulative shoot P concentration (mg P g
−1) as the sum of all cuts were calculated using the following equations:
where
I: cut, and further allowed to calculate cumulative shoot P uptake as their multiplication product:
Additionally, P uptake efficiency (PUE) at the end of the experiment was expressed as:
where cumulative shoot P uptake, mg P pot
−1 and P
applied: initial P application dose of fertilizing product, mg P pot
−1.
2.5. Analysis of P in the Substrate Solution Sampled with Rhizon
Substrate pore water (moisture) samplers, Rhizon Soil Moisture Sampler (SMS), type MOM (10 cm male luer, PE/PVC tubing, 9 mL vacuette; Eijkelkamp Agrisearch Equipment, Giesbeek, The Netherlands), were used to examine P availability in the substrate as a fast and non-invasive method. Before installing the Rhizons in the pots, the substrate with plants was watered up to 90% of WHC and the pots were randomized at equal frequency after each watering. The Rhizon samplers were placed diagonally inside the substrate, and a 10 mL syringe was connected to extract the solution via vacuum pressure. The Rhizons were placed in each pot on S1 every two weeks of plant growth and on S2 every four weeks (except the fifth week for the first cut). The substrate solution was collected after 24 h of placing the Rhizon, and samples were acidified with a drop of concentrated nitric acid (20 µL) before analysis at ICP-OES (Thermo Scientific™ iCAP™ 7400, Thermo Fisher Scientific, Waltham, MA, USA). For the MA treatment, the sampled pore water gave a green coloration that was blocking the ICP-OES, so it needed to be additionally filtered using a 0.45 µm filter size and 10 mL syringe.
2.6. Statistical Analysis
The acquired data were statistically analyzed using IBM SPSS Statistics 27 and presented using Minitab statistical software. The general linear model (two-way ANOVA) was used to investigate the effect of substrates (S1, S2, S3) and time (4 cuts) on plant parameters (shoot yield and shoot P concentration) for each fertilizing product (TSP; P salt CL; MA; CCM; SSA PI, Zero P) separately. The general linear model was then used to compare the performance (in terms of shoot yield, shoot P concentration, PUE, and P concentration in substrate pore water) of the fertilizing product types (TSP; P salt CL; MA; CCM; SSA PI, Zero P) on each substrate (S1, S2, S3) over four months. A post hoc Tukey HSD (p < 0.05) test was run to indicate the significant differences within substrates, time, and fertilizing product types.
Additionally, a Pearson correlation test, with a significance of 0.05, was performed to investigate a possible correlation between the P concentration in substrate solution extracted by Rhizon SMSs and (i) the P content of the plant shoots as well as (ii) the P concentration in the water extract.
3. Results
3.1. Fertilizing Products Characteristics
The fertilizing product characteristics are summarized in
Table 1. All except for the SSA PI had higher organic C (C
org) concentrations than TSP. The highest C
org was measured in MA, while lower concentrations were measured in CCM, followed by P salt CL, and none was detected in SSA PI.
All the fertilizing products had lower chemically extracted P concentrations than the TSP. Phosphorus concentration varied widely between the examined products. The highest P concentration determined using MWAR was found in P salt CL, followed by SSA PI, and the lowest was in CCM and MA. Opposite to MWAR-P, the water-soluble P concentration showed larger P availability for MA, almost as high as for P salt CL, lesser for SSA PI, and the lowest for CCM. In addition to the relevant concentrations of P, a significant concentration of N was detected in MA. None of the examined fertilizing products contained relevant concentrations of potassium (K). All the analyzed products had high amounts of several secondary macronutrients. The concentration of calcium (Ca) in P Salt CL was the same as in TSP, while CCM contained double that of TSP. Lower Ca concentrations were found in SSA PI and the least was found in MA. All products had higher concentrations of magnesium (Mg) than the TSP treatment, with the highest in SSA PI and MA and lowest in P salt CL and CCM. Higher sodium (Na) concentrations were detected in MA and P salt CL than in TSP. In contrast, all products were found to have low concentrations of sulfur (S).
Regarding the (potential) inorganic contaminants, SSA PI had higher concentrations of copper (Cu) and zinc (Zn) compared to the other fertilizing products. Moreover, higher concentrations of Cu were detected in MA along with a higher amount of manganese (Mn) in P salt CL and SSA PI. All products, except SSA PI and P salt CL, had lower amounts of arsenic (As) than TSP. A higher concentration of nickel (Ni) was found only in SSA PI, of mercury (Hg) only in MA, and of total chromium (Cr) only in P salt CL. Higher amounts of lead (Pb) and cobalt (Co) were found in all the products, except CCM. Moreover, the amount of iron (Fe) was high in all the products except for CCM and high in aluminum (Al) except for CCM and MA. In contrast to TSP, concentrations of cadmium (Cd) were low in all the products.
The measured and certified values of reference material NIST
®SRM
®695 that were used for verification of the analysis and measurements can be found in
Supplementary Materials (S3).
Regarding organic contaminants, low concentrations of several POPs were detected in the products with high C
org concentration, i.e., CCM and MA, while PCB 53 was found in P salt CL. No POPs were detected in SSA PI (
Supplementary Materials, Tables S2 and S3).
3.2. Substrate Characteristics
The concentrations of chemical elements (mg kg
−1) measured in the substrates (for S1 also reported in Bogdan et al. [
20]) are given in
Table 2.
The measured and certified values of internal laboratory reference soil materials, A and B, that were used for the verification of the substrate analysis and measurements can be found in
Supplementary Materials (Table S4).
Of the AR (aqua regia) extracts, the highest P concentration was measured in the artificial mineral substrate (S2), with one-third of that level in the organic horticultural substrate (S3); and both significantly higher than that in the river sand substrate (S1). However, available P was low in both S1 and S2, and high in S3, according to the CAL extraction method. The comparison between the AR-P and CAL extraction methods showed that the P in S2 was strongly bonded and unavailable, while P in S3 was mobile and at an optimal concentration (12–23 mg P
2O
5 100g
−1) for agricultural applications even without further fertilization [
19]. High concentrations of Fe, Al, and other elements that could impact P release were found in S2 and S3. The highest concentrations of all other elements measured (
Table 2) were detected in S2, except for TC, which was higher in S3.
In addition, the highest pH was measured in S2, while S1 and S3 had a comparable pH (
Table 3). The EC was also highest for S2, and lowest for S1. Although the perennial ryegrass can grow at a wide range of pH values (5.1–8.4), it should be noted that the pH value of S2 was at this plant’s upper tolerance limit, while S1 and S3 were within the optimal range (5.5–7.5) for its growth [
67].
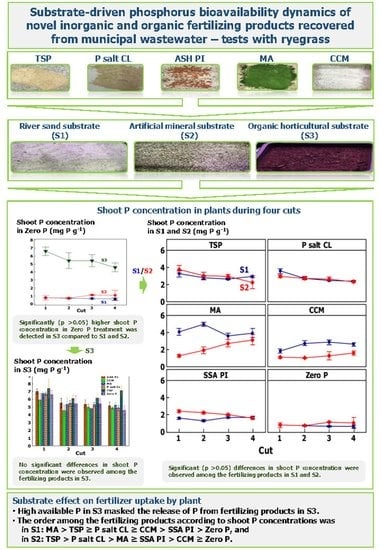
3.3. Shoot P Concentration and Shoot Yield over Four Months
The time for achieving the highest shoot P concentrations and shoot yields varied depending on the substrate and fertilizing product type. The ‘negative control’ treatment, Zero P, achieved a significantly (
p < 0.05) lower shoot yield and P concentration than all the fertilized treatments in S1 and S2. A significantly (
p < 0.05) lower shoot P concentration in Zero P treatments was measured in S1 than in S2 (
Figure 1), but a significantly (
p < 0.05) higher shoot yield in S2 than S1 (
Figure 2). Moreover, the continuous reduction in P in the Zero P treatment led to a reduction in the shoot yield with each cut. In contrast, shoot P concentration in S3 in the Zero P treatment was significantly higher compared to the other substrates, S1 and S2 (
Supplementary Materials, Figure S1), and showed no significant differences with the P concentration in the fertilized plants (
Supplementary Materials, Figure S2). For this reason, S3 was excluded from further evaluation of secondary P fertilizing products.
Furthermore, the interactions between fertilizing product type (TSP, P Salt CL, MA, CCM, SSA PI, and Zero P), time (four months), and substrate (S1 and S2) had a significant (
p < 0.05) effect on shoot P concentration (
Figure 1) and shoot yield (
Figure 2). The shoot P concentration of TSP was not significantly affected by the substrate type. However, time and time–substrate had a significant effect (
p < 0.05) on shoot P concentration. The shoot P concentration obtained in the TSP treatment experienced a continuous slow decrease. At first cut, it was the highest and equal for both substrates, after which it reduced and stabilized in S1, and continuously decreased in S2 (
Figure 1). The shoot yield from TSP treatment was higher in S1 than S2, except for the first cut when they were comparable. In S1, shoot yield in the TSP treatment had an increase followed by stabilization and a slight decrease for the last cut. In S2, the shoot yield in the TSP treatment was stable throughout time (
Figure 2).
A similar pattern to TSP was observed for shoot P concentration in the P salt CL treatment. A slightly higher shoot P concentration was observed when P salt CL was applied to S2 compared to S1 at the first cut. In further cuts, the shoot P concentrations in S1 and S2 become identical and expressed a slow reduction in time (
Figure 1). Similar to TSP, the shoot yield in the P salt CL treatment was higher in S1 than S2, but equal at the first cut. The shoot yield of plants treated with P salt CL increased up to the third cut in S1, and up to the second cut in S2, upon which it slowly decreased (
Figure 2).
In the MA treatment, higher shoot P concentrations were observed in S1 than in S2, but only at the first two cuts. The shoot P concentration in the MA treatment in S1 was stable (except at the second cut), while in S2, it continuously increased (
Figure 1). For shoot yield in the MA treatment, the differences between the substrates were highly pronounced. From the second cut onwards, the shoot yield was higher in S1 (that showed a continuous increase in shoot yield) than S2 (with no significant differences in shoot yield between cuts) (
Figure 2). The MA treatment had a delay in growth attributed to a delay in mineralization of P and achieved a higher shoot yield than TSP from the third cut onwards.
Treatment with CCM achieved a significantly (
p < 0.05) lower shoot yield and shoot P concentration compared to the commercial TSP treatment. However, it was able to increase shoot P concentration over time compared to the unfertilized treatment (Zero P). Treatment with CCM had a comparable pattern of P release to MA. There was an increase in shoot P concentration, followed by stabilization in S1, and a continuous slow increase in S2 (
Figure 1). The shoot P concentration with CCM in S1 was continuously higher than in S2. The shoot yield in the CCM treatment had a continuous slow increase and was higher in S1 than S2 from the second cut onwards (
Figure 2).
The only fertilizing product that had a significantly (
p < 0.05) higher overall shoot P concentration in S2 than in S1 was SSA PI (
Figure 1). In S1, the shoot P concentration of SSA PI exhibited a slight drop at the beginning of the trial, followed by an increase and stabilization. In S2, the shoot P concentration of SSA PI had a rather slow continuous decrease. In contrast, a significantly higher shoot yield was achieved in S1 than S2 (
Figure 2). Moreover, differences between the cuts were more pronounced in S1 than S2. Whilst in S1 there was an increase in shoot yield treated with SSA PI up to the second cut, followed by stabilization at the third cut and decrease at the fourth cut, in S2 there was rather a stabilization and decrease at the fourth cut. However, the differences in shoot yield between the two substrates were lower than for the other tested products. Treatment with SSA PI achieved significantly (
p < 0.05) lower shoot yield results compared to the commercial TSP treatment for all cuts. Still, the SSA PI treatment was able to increase shoot P concentration compared to the unfertilized treatment.
The comparison of all treatments and cuts showed that significantly (
p < 0.05) higher shoot P concentrations and shoot yields were acquired in S1 than in S2. Additionally, the changes in shoot yield over time were more pronounced in S1 than S2. In S1, the ranking order among fertilizing products according to shoot P concentrations was MA > TSP ≥ P salt CL ≥ CCM > SSA PI > Zero P, and in S2 it was TSP > P salt CL > MA ≥ SSA PI > CCM ≥ Zero P. The shoot yield ranking order was P Salt CL ≥ TSP ≥ MA > CCM ≥ SSA PI > Zero P in S1, and P salt CL > SSA PI = TSP > CCM = MA = Zero P in S2. The same was observed for the cumulative shoot dry matter and P concentration (Equations (2) and (3)) (
Supplementary Materials, Figure S3). On average, all the fertilizing products achieved their maximum shoot P concentration and shoot yield by the third cut.
In addition, the total N concentrations in all plant shoot grown in S1 from all tested fertilizing products were comparable throughout the cuts (5.2 ± 0.6%). Similarly, the concentrations of metals in plants in S1 showed not to be significantly higher (
p >0.05) than in Zero P nor TSP (
Supplementary Materials, Table S5).
3.4. Phosphorus Uptake Efficiency (PUE) at the End of the Four-Month Experiment
Phosphorus uptake efficiency (PUE, %), i.e., cumulative P taken up by the shoots (Equation (4)) in fertilized treatments per amount of P from the fertilizing products added to the pot (Equation (5)), was selected as a parameter to assess the efficiency of the novel fertilizing P products at the end of the four-month pot trial. The comparison of PUE has indicated significant differences among the fertilizing products and their interaction with the substrate (
Table 4).
The only fertilizing product for which PUE was comparable on both substrates was SSA PI. For all other fertilizing products, P salt CL, MA, CCM, as well as for TSP, the PUE was significantly (p < 0.05) lower in S2 in comparison to PUE in S1.
The highest PUE in both substrates (S1 and S2) was achieved with P salt CL, which was comparable to the PUE of TSP or even slightly higher than the PUE of TSP in S2. The effect of substrate on the PUE of MA and CCM was strong even after four months. In S1, MA had the highest PUE, comparable to the PUE of P salt CL and TSP, while its PUE in S2 was much lower, just slightly higher than the PUE of Zero P. The PUE of CCM was lower than the PUE of TSP, MA, and P salt CL, but higher than the PUE of SSA PI and Zero P in S1, and comparable to the PUE of Zero P in S2. The PUE of SSA PI in S1 was the lowest among all products, while in S2 it was the second highest.
3.5. Phosphorus Concentration in the Substrate Solution Sampled with Rhizon
The P concentrations in substrate pore water were measured at each cut in two substrates, S1 and S2. The results for P concentration in the substrate pore water sampled from S1 are given in
Figure 3. The P salt CL and TSP had the highest and fastest P release that also decreased over time.
A similar high P concentration was observed in the MA treatments, but with a time delay. On the other hand, P concentration in the SSA PI treatment was rather stable and lower over time, and in the CCM treatment, it was the lowest and close to detection limit. For Zero P, P was under or near the detection limit.
The P concentrations in substrate pore water sampled by Rhizon were overall positively correlated (r = 0.72, p < 0.05) to plant P uptake in S1 over the four months. Furthermore, the correlation coefficients were explicitly high for P salt CL (r = 0.98, p < 0.05) and MA (r = 0.97, p < 0.05), but not significant for SSA PI and CCM.
The P concentrations (mg P dm−3 with standard deviations) measured in substrate pore water from S2 at 1st cut (5th week) were 0.10 ± 0.01 for Zero P, 0.10 ± 01 for CCM, 0.16 ± 0.01 for SSA PI, 0.39 ± 0.06 for P salt CL, 0.72 ± 0.22 for TSP, and 0.23 ± 0.07 for MA. However, no P was detected in S2 from the second cut onwards since the P was possibly under the detection limit of the ICP OES machine. The P concentrations in substrate pore water at the first cut were significantly (p < 0.05) lower in S2 than S1.
4. Discussion
4.1. Substrate Type Affected Shoot Yields and P Concentration in Treatments with the Novel P Fertilizing Products
Low shoot yield and P concentration in Zero P treatments in S1 and S2 indicated the appropriateness of these two substrates for assessing P availability of secondary P fertilizing products in standardized pot trial tests. As that was not the case for S3 (organic horticultural substrate), this substrate cannot be recommended.
The availability of P bonded to Ca in TSP decreased rapidly in S2, similar to calcareous soils, due to the precipitation mechanism. This led to a lower shoot yield in S2 than in S1, as corroborated in previous studies [
68,
69,
70,
71,
72]. Moreover, as shoot yield is involved in the calculation of PUE (Equations (1)–(5)), the PUE of TSP was also dependent on substrate type, more so in S1 than S2. Thus, care should be taken when comparing the PUEs of TSP in different substrate types. Furthermore, the dependency of TSP shoot yield on substrate type affected the comparison of other fertilizing products with TSP. Based on the statistical analysis, the PUE of SSA PI was equally good in S1 as in S2. However, when the PUE of SSA PI was compared to the one of TSP, it appeared that the SSA PI performed worse than the TSP in S1 and equally good to the TSP in S2. This could further lead to the misconception that SSA PI had a different performance among the substrates, while it was only the case for the TSP. Therefore, a comparison of any tested P fertilizing product with TSP is advisable also in relation to the actual substrate type being used.
The shoot dry matter and shoot P concentration, and thus PUE of the P salt CL treatment in both substrates, S1 and S2, were high and comparable to TSP, as seen in a previous study on chemical leached P salts (Wilken and Kabbe) [
73]. The high net PUE achieved in the present study suggests that the secondary P salt CL consisted of soluble primary and/or secondary P forms, which were readily plant available. The higher performance of P salt CL in the slightly acidic (almost neutral) substrate S1, due to the higher dissolution of Ca–P bonds at this pH, corroborates previous studies [
74,
75,
76,
77]. According to Meyer et al. [
78], the higher P availability of calcium phosphate (CaP) in acid compared to alkaline soil is caused by a larger fraction of apatite-like P compounds.
The strong reduction in shoot yield fertilized with MA in S2 compared to S1 is probably caused by higher pH and higher concentrations of P-bonding elements in S2 than S1 and the high C
org concentration in MA. In a study on fenugreek plants treated with an algal extract, plant P concentrations at the vegetative growth stage were comparable among the soil types, most likely because the soils had comparable pH of 7.2 and 7.3, both lower than the pH of S2 (8.5) in the present study [
77]. In addition, Al-Maliki et al. [
79] observed a lower root biomass of onions treated with algae on silty clay soil with a pH of 7.4 compared to sandy loam soil with a pH of 7.1.
Large differences in shoot yield were found between S1 and S2 treated with CCM. The very high pH of S2 (8.5) probably played a major role in the strong bonding of Ca–P in CCM affecting available P concentration and plant growth. At a lower soil pH (7.6), Mosa et al. [
80] obtained higher plant P concentrations in treatments with chitosan. Consequently, since the effect of substrate on the PUE of MA and CCM was strong even after four months, it appears that organic-rich fertilizing products should only be used on acidic substrates.
Furthermore, the complex matrix of SSA PI has possibly buffered the effect of the substrate on its P release [
21]. Optimum Fe:P and Al:P ratios to achieve good fertilizer efficiency were exceeded (>1) in the case of SSA PI [
81,
82], and limited its P availability in the slightly acidic S1. Furthermore, as the ratio of Fe:P in SSA PI was higher than the ratio of Ca:P and Mg:P, it can be speculated that Fe release under higher pH conditions, led to the slightly better performance of SSA PI on S2. In addition, the presence of other elements, such as silica, and their bonding to P, Al, Fe, Ca, and Mg in sewage sludge ashes have been previously discussed as a potential cause of lower P availability [
83]. In a study by Wilken and Kabbe [
73] and Zeggel et al. [
25], sewage sludge ashes achieved a higher PUE in the acidic sand mix than neutral sand mix. However, their tests were not performed on highly alkaline substrate, and those sewage sludge ashes had a less complex matrix than SSA PI, as their P recovery involved additional chemical treatment. Thus, it can be expected that, if SSA PI is further treated (with MgCl
2), a higher P availability may occur in acidic soils [
47,
78,
84].
Overall, the S1 substrate with the lowest available P, optimal plant pH, and the lowest Al and Fe concentrations proved suitable for assessing secondary P fertilizing products, as observed in our previous study [
20]. The slightly acidic pH of S1 enhanced the P efficiency of all Ca and Mg-rich fertilizing P products, including TSP, except for SSA PI. On the other hand, the S2 substrate with low available P, but higher pH and more complex chemical characteristics, may be valuable for agronomic tests in specific regions with similar soil characteristics as this substrate. Still, the high AR-P concentrations in S2, compared to S1, indicated that its P availability should be further examined, especially in circumstances where P could become available to plants and reduce the P uptake from the fertilizing products.
In addition, the P concentrations measured in the three substrates using CAL-P extraction corresponded better to the shoot P concentrations in the Zero P treatments than did the ones measured using AR-P extraction. Thus, CAL-P extraction should be recommended for the estimation of P availability in planting substrates. Eventually, the fertilizing product and agronomic regulations (often EU member state) will become compliable and also include different fertilizing product–soil interactions.
4.2. Release of P Varies over Time Differently Depending on the Tested P Fertilizing Products
The time for achieving the highest shoot P concentrations and shoot yield varied depending on the substrate and fertilizer type. The shoot P concentrations in treatment without fertilizer (Zero P) in S1 and S2 decreased continuously over time; these substrates were deemed suitable for standardized P availability analysis. However, no differences between the shoot P concentrations at different cuts were observed in S3, which is why S3 was disqualified from further assessment of P availability.
The shoot P concentration for TSP exhibited a characteristic continuous slow decrease as expected for a commercial mineral fast release fertilizer [
85]. A fast initial P release was observed for the P salt CL treatment, comparable to TSP. Most likely, the P recovery technology used for producing P salt CL created P in a form that is readily plant available, in agreement with other studies on P availability in chemically leached P salts [
21,
47,
86]. Additionally, the trigger for high P availability for P salt CL could be its high concentration of P, but low concentrations of P bonding elements, e.g., low Ca:P, Mg:P, and Fe:P ratios.
The MA treatment had a delay in plant growth, as a consequence of the high C
org. concentration and complex P forms in MA, most likely polyphosphates [
33,
87,
88]. Similarly, Garcia-Gonzalez and Sommerfeld [
89] found a significant increase in plant dry weight when MA was applied 22 days before seeding of the tomato plants compared to applying it at the moment of plant seeding. Moreover, in Renuka et al. [
32], the highest total P content in wheat roots treated with the MA consortia was acquired at a mid-crop stage of 60 days.
The treatment with CCM was able to increase shoot P concentration over time compared to the unfertilized treatment (Zero P), indicating that it has slow release features. Shoot yield results for CCM were similar to results from Aklog et al. [
90], where a chitin mixture was used as a fertilizing product to grow tomato plants. The chitin mixture performed better compared to the unfertilized treatment, but it was not as efficient as the commercial fertilizing product. Most presumably, the presence of calcium carbonate lowered and slowed down the decomposition rate of the fertilizing product, as crab carapace is known to be composed of 30–50% calcium carbonate [
15] and the CCM used in this study contained around 30% [
53].
Agronomical performance was lower in the SSA PI treatment than the commercial TSP treatment, but higher than the unfertilized treatment at all cuts. These results were similar to Cabeza et al. [
91], Severin et al. [
92], Vogel et al. [
22], Lemming et al. [
46], Wollmann et al. [
93], and Joseph et al. [
71]. The performance over time for SSA PI improved compared to a previously tested sewage sludge ash produced using the same technology, but with a different sludge, as discussed in Bogdan et al. [
20]. Organic C was not present in the sewage sludge ash in the present study, thus allowing the P to be released earlier and equally over time.
Overall, four months proved to be the minimum time needed to observe a slow P release from the studied fertilizing products, while longer trials may show their full P release capacity, especially in the cases of MA and CCM.
4.3. Substrate Pore Water Sampling with Rhizons as an Alternative Method for Measuring the P Availability of Novel Secondary P Fertilizing Products
The P concentrations sampled using Rhizons exhibited a slow-release effect from the studied fertilizing products and their different leaching potentials depending on the substrate type. The overall positive correlation between the P concentrations in substrate pore water sampled by Rhizon and P concentrations taken up by the plant from fertilized treatments in S1 over the four months indicated that the Rhizon extraction of the substrate solution can be recommended as a quick method to assess plant P availability. In the study of Vaneeckhaute et al. [
94], Rhizon extraction also proved to be a good measure for P availability and was suggested to be used as an additional method to better understand the interaction between soil and fertilizing products. This application, however, may be more suitable for P salt CL and MA, than for SSA PI and CCM. In addition, while the P concentrations extracted from fertilizer using water extraction and P concentrations in substrate pore water sampled by Rhizon ranked CCM as the least P available among the tested fertilizing products, this ranking was not observed in the P concentrations taken up by the plant in S1.
Additionally, Rhizon SMSs are easy to handle, do not demand excessive use of chemicals, and can be reused. However, if the P doses of fertilizing products are low or adsorbed by the substrate, the P determination may require the use of a more sensitive ICP-MS technique that can detect lower P concentrations. The method should be further optimized for variable substrate types.
4.4. Implications for the Characterization of Novel Fertilizing Products in the EU Regulation
The novel Fertilizer EU Regulation 1009//2019 should allow the use of novel fertilizing products recovered from MWW on the market [
41]. However, the nutrient requirements and contaminant limits for the novel product categories have not yet been defined. Thus, in the present study, we have (i) compared the nutrient and contaminant concentrations with the limits provided in the Fertilizer EU Regulation 1009//2019 assuming that the novel fertilizing products are considered equal to commercial macronutrient fertilizers; and (ii) provided recommendations for developing minimum nutrient requirements and contaminant limits for the novel fertilizing product categories.
According to the limits for C
org, defined in the EU Fertilizer Product Regulation 2019/1009, MA can be considered as an organic (C
org ≥15%) fertilizing product and CCM as an organo-mineral (C
org ≥7.5%) fertilizing product, while P salt CL and SSA PI can be classified as inorganic (C
org < 7.5%) fertilizing products [
41].
All examined fertilizing products contained relevant concentrations of at least one macronutrient from each of the two groups (primary (N, P, K) and secondary (Ca, Mg, Na, S)) classified in the Fertilizer EU Regulation [
41]. The low P water solubility of the products, compared to the high P solubility of commercial mineral fast release fertilizer TSP, classifies the novel P fertilizing products as slow release. All examined products had sufficient concentrations of P determined by the MW AR extraction method, higher than the minimum required for each category by the Fertilizing Product Regulation 2019/1009 [
41] (P salt CL, SSA PI >3% P
2O
5, CCM >2% P
2O
5, and MA >1% P
2O
5). Furthermore, the new regulation that is under development may declare that P salts should have C
org < 3% and P
2O
5 >16%, as suggested by STRUBIAS, and further restrict the application of some secondary P fertilizing products [
82]. Nevertheless, the validity of imposing such limits should be still carefully investigated for each type of novel P fertilizing product. Furthermore, as MA proved to have a significant concentration of TN (>3%), it could also be considered a compound NP fertilizing product (EC, 20019). What made all the new P fertilizing products more valuable is that they all had more than one primary or secondary macronutrient at concentrations higher than the legislative minimum requirements [
41]. All the analyzed products had higher amounts of the secondary macronutrients, Mg and Ca, than the minimum legislative requirement (>1.5% of MgO and CaO) [
41]. Still, when Ca and Mg concentrations were examined in relation to their P concentration, as in the case of our pot trial, only CCM had optimum Ca:P ratio for ryegrass growth, while MA had almost three times higher Mg than ryegrass requirements. Moreover, when concentrations of S in fertilizing products were compared to its P concentration, MA was identified as having a very high concentration of S, which increases its fertilizer value. The concentrations of Na in MA and P salt CL were also higher than the minimum required (>1.5% of Na
2O) and lower than the maximum allowed (>40% of Na
2O) by the legislation [
41]. Additionally, the Na:P ratio of MA and Psalt CL was within an optimal range for the perennial ryegrass growth [
95] examined in the present study. In addition, an added value of P salt CL was its concentration (>0.5%) of the micronutrient Mn, higher than the minimum required by the legislation [
41], but lower than the requirement of perennial ryegrass in the present study.
The concentrations of Cu in MA and Cu and Zn in SSA PI exceeded the EU legislative limits (>300 mg kg
−1 Cu for organic fertilizers as in MA, >600 mg kg
−1 Cu, and >1500 mg kg
−1 Zn for inorganic fertilizers as in SSA PI) [
41]. However, their respective ratios to P were lower than ryegrass requirements, and thus these elements could be considered micronutrients if applied at a dose that corresponds to the plant needs and soil deposits. A concentration of total chromium (Cr) in P salt CL was higher than the limit suggested by STRUBIAS (200–400 mg kg
−1) [
82]. However, this was because a mixed industrial and MWW sludge was used for the production of the P salt CL and would not be expected if this was performed using the typical MWW sludge.
Overall, all tested fertilizing products can be considered safe in terms of their inorganic contaminants, except for Cu and Zn, according to EU Regulation 2019/1009 [
41]. Moreover, metal availability was not significant or plant available in the present study, but its potential for accumulation should be further tested in longer pot trials. When the metal to P ratio in product is compared to that in TSP, only CCM seems not to be contributing to higher environmental pollution. The higher purity of CCM was an outcome of its production from effluent wastewater from a WWTP, while the lower purity of MA was a consequence of using wastewater from the primary settling tank in a WWTP for its production. To reduce the high concentrations of inorganic contaminants in SSA PI, additives should be added during the thermal process, while for P salt CL heavy metal removal should be further optimized.
The limits for contaminants (as well as Zn and Cu) in novel P fertilizing products should be revised in the EU Fertilizer Regulation once their minimum (or typical) P concentrations have been defined.
The significantly higher concentrations of several POPs in products that had a high organic C concentration (CCM and MA), compared to the products that had a low organic C concentration (P salt CL and SSA PI), were lower than the legislative limits (PAH10 << 6 mg kg
−1 dm (the legislative limit for PAH16); PCB7 << 0.8 mg kg
−1 dm (the legislative limit for dl-PCB14); and OC << 20 ng kg
−1 dm (the legislative limit for WHO toxicity equivalents kg
−1 dm of PCDD/F13) [
41,
82].
5. Conclusions
All tested secondary P fertilizing products had a beneficial effect on plant growth and P concentration in shoots when compared to the unfertilized controls in the river sand substrate (S1) and artificial mineral substrate (S2). In contrast, the high available P for the Zero P treatment in the organic horticultural substrate (S3) masked the effect of fertilization and indicated that this substrate should not be used for the standardized analysis of P availability in fertilizing products. Overall, the slightly acidic S1 substrate resulted in the highest P uptake efficiencies (PUEs) for the tested fertilizing products, while the more alkaline S2 substrate resulted in lower PUEs for all tested products, except for the sewage sludge ash obtained by the pyrolysis and incineration process (SSA PI), a complex matrix that buffered the substrate effect.
The P release and PUE of chemically leached P salt (P salt CL) were comparable to commercial mineral fertilizer triple superphosphate (TSP), indicating that it is made of readily available CaP. The same P release and PUE potential of SSA PI were confirmed in both the S1 and S2 substrates, indicating that both substrates are good for assessing its fertilizer potential. The time and substrate effect on fertilizing product efficiency was more pronounced for the organic-rich fertilizing products, i.e., microalgae (MA) and crab carapace material (CCM). Both products had a delay in their P release compared to TSP. In S2, the PUE of MA and CCM was significantly lower than in S1.
In terms of optimal length in time for pot trials, four months proved a minimum for observing the highest shoot yield in the treatments, while longer trials should show the full P release capacity.
In addition, an alternative method for measuring available P, namely substrate solution sampling using Rhizons, proved to be a sensitive approach that can be used for assessing the P availability of fertilizers, such as P salt CL and MA.
From a legislative point of view, all the tested products can be considered multi-nutrient fertilizers since they contain relevant concentrations of at least one macronutrient in addition to P. Based on the limits (expressed in mg kg−1 dm) for P fertilizers listed in the EU Fertilizer Regulation 1009/2019, the novel fertilizing products could be considered safe in terms of their inorganic contaminants (Zn, Cu, Cr, As, Cd, Co, Ni, Pb, Mn and Hg), except for Cu and Zn in the SSA PI and Cu in the MA. However, compared to the TSP, all novel products, except CCM, exhibited a higher ratio of inorganic contaminants to P. Thus, to avoid the environmental pollution caused by the application of these products, the following should be considered: (i) the legislative criteria for contaminants in these products should be adjusted according to their ratio to P, and (ii) the production of novel products, except CCM, should be further optimized to reduce the levels of the contaminants in these products.


 ,
, 


