Article

Molecular Identification and Phylogenetic Analysis of Cymbidium Species (Orchidaceae) Based on the Potential DNA Barcodes matK, rbcL, psbA-trnH, and Internal Transcribed Spacer

1
College of Life and Environmental Sciences, Hangzhou Normal University, Hangzhou 311121, China
2
Zhejiang Provincial Key Laboratory for Genetic Improvement and Quality Control of Medicinal Plants, Hangzhou Normal University, Hangzhou 311121, China
3
School of Basic Medicine, Hangzhou Normal University, Hangzhou 311121, China
*
Author to whom correspondence should be addressed.
These authors have contributed equally to this work.
Agronomy 2024, 14(5), 933; https://doi.org/10.3390/agronomy14050933
Submission received: 18 March 2024 / Revised: 17 April 2024 / Accepted: 27 April 2024 / Published: 29 April 2024
(This article belongs to the Special Issue Plant Genetic Resources and Biotechnology)

Abstract

:
Numerous Cymbidium species have significant commercial value globally due to their exotic ornamental flowers. Identifying Cymbidium species is challenging due to their similar shapes, which hinders their rational use and the conservation of germplasm resources. In the present study, firstly, four plastid loci (matK, rbcL, psbA-trnH, and atpF-atpH) and a nuclear locus (internal transcribed spacer, ITS) were initially examined to identify Cymbidium species. Secondly, we inferred the interspecific phylogeny of Cymbidium species using ITS sequences. All of these DNA regions, with the exception of atpF-atpH, could be readily amplified from Cymbidium, and the corresponding DNA sequences can be successfully obtained by sequencing. Our research demonstrated that ITS exhibited the highest intra- and interspecific divergences, the greatest barcoding gap, and the highest proportion of species identification. The phylogenetic analysis of Cymbidium species based on the ITS regions primarily corroborated the results obtained using traditional morphological methods. A comparative analysis of candidate DNA barcodes has shown that the ITS can be used not only for barcoding Cymbidium species but also for the phylogenetic analysis of Cymbidium.

1. Introduction

The genus Cymbidium Sw. (Orchidaceae) consists of 48–55 species and is primarily found in tropical and subtropical Asia, as well as northern and eastern Australia [1]. Cymbidium orchids are well known in worldwide horticulture due to their variegated leaves and fragrant flowers, and they have been cultivated for more than ten centuries [2,3]. Due to their significant economic value, large quantities of Cymbidium species were harvested and traded in China. In recent years, natural Cymbidium populations have faced a serious threat of extinction due to overcollection and habitat destruction. All Cymbidium species are included in the Convention on International Trade in Endangered Species of Wild Fauna and Flora (CITES).
The unequivocal identification and examination of the phylogenetic relationships of Cymbidium plants are essential for sustainable conservation and increased utilization. Traditionally, Cymbidium species’ identification and plant phylogeny assessment were primarily conducted through morphological [4] and anatomical analyses [5]. Schlechter (1924) suggests a system for categorizing Cymbidium into eight sections, which forms the foundation of the current infrageneric classification of Cymbidium [6]. Most of these sections are still acknowledged in their original form to some extent. Hunt (1970) incorporated Cyperorchis into Cymbidium and upheld Schlechter’s sectional classifications [7]. Seth and Cribb (1984) initially categorized Cymbidium into three subgenera: subgenus Cymbidium, subgenus Cyperorchis, and subgenus Jensoa [8]. Later, further supplementary studies and improvement in the classification of the genus were conducted by Puy and Cribb (1988) [9] and Liu et al. (2006) [10]. However, morphological and anatomical characteristics are easily influenced by the environmental conditions of plant growth, and it is occasionally challenging to distinguish Cymbidium species based solely on these characteristics [3,11,12]. Consequently, a simple and accurate identification of Cymbidium species is essential.
DNA barcoding is a method of molecular identification that uses brief, standardized DNA sequences to rapidly determine the species of specimens [13,14,15,16]. The mitochondrial cytochrome c oxidase 1 gene (CO1) has been widely accepted as a universal barcode for species identification in many animal groups [17,18,19]. Several regions of chloroplast DNA sequences, such as matK, rbcL, rpoB, rpoC1, psbA-trnH, and atpF-atpH spacers, as well as the internal transcribed spacer (ITS) region of the nuclear ribosomal DNA, have been proposed as potential plant barcodes [20,21,22]. To this day, a universally recognized barcode for plants has yet to be established [21,23]. Four DNA regions—matK, rpoB, rpoC1, and trnH-psbA—were analyzed to discriminate Cymbidium species in Thailand [24]. The phylogenetic relationships of Cymbidium have been preliminarily analyzed using various molecular markers, including RAPD [25], AFLP [26], ISSR [27,28], and SSR [29]. The matK and ITS regions were also employed for assessing the phylogenetic relationships among several Cymbidium species [30,31]. Furthermore, previous studies have suggested that the complete chloroplast genome can serve as an effective tool for identifying Cymbidium species and resolving their phylogenetic relationships [1,32,33]. Although there has been progress in these studies, the genetic relationships between many species of Cymbidium remain controversial [31,34,35]. Therefore, further study is needed using more efficient molecular techniques for Cymbidium species.
Our study aimed at (1) testing the universality of a set of DNA regions in Cymbidium, (2) evaluating the potential of these barcodes for identifying Cymbidium species, and (3) reconstructing the phylogenetic relationships within the genus Cymbidium. We compared the potential of using five different DNA barcodes (ITS, matK, rbcL, psbA-trnH, and atpF-atpH) and four combinations of regions (ITS + matK, ITS + psbA-trnH, ITS + matK + psbA-trnH, and matK + rbcL) for the identification of Cymbidium species. The best DNA barcode sequences were then chosen as genetic markers to analyze the phylogenetic relationships among 29 Cymbidium species.

2. Materials and Methods

2.1. Plant Materials

We collected as many Cymbidium species as possible, and 34 individuals from 18 species were used to assess the success rate of PCR amplification and sequencing. Due to the valuable, rare, and challenging nature of Cymbidium plants, the sample size for each Cymbidium species in this study varied from 1 to 4, with 6 species represented by 2 or more individuals. The specimens were obtained from the primary distribution regions of orchids in China. The species and voucher specimens collected are detailed in Table S1. The samples originated from nine provinces: Yunnan, Zhejiang, Guangdong, Guangxi, Jiangxi, Henan, Fujian, Anhui, and Guizhou. In this study, 34 Cymbidium samples were sequenced, resulting in a total of 136 sequences, comprising 34 ITS, 34 matK, 34 psbA-trnH, and 34 rbcL sequences, respectively (Table S2). Other published ITS sequences for 20 Cymbidium species were downloaded from GenBank for further phylogenetic analysis (Table S3). All pertinent studies involving the gathered samples received approval from Hangzhou Normal University.

2.2. DNA Extraction, Amplification, and Sequencing

We utilized the Plant Genomic DNA Kit (Sangon Co., Shanghai, China) to extract genomic DNA from fresh young leaves following the provided protocol. The nuclear DNA ITS and four chloroplast genome regions, including two coding genes (matK and rbcL) and two intergenic spacer sequences (psbA-trnH and atpF-atpH), were amplified using the specified primer pairs and reaction procedures outlined in Table 1. The PTC-100 thermal cycler (MJ Research, Waltham, MA, USA) was utilized for the amplification process. The purified PCR products were sequenced in both directions using the primers employed for PCR amplification by Shanghai Sunny Biotechnology Co. Ltd. (Shanghai, China). Since the sequencing was unsuccessful, the atpF-atpH region was excluded from further analysis (see results).

2.3. Data Analysis

The assembly of contigs and the generation of consensus sequences were performed using CodonCode Aligner V3.0 (CodonCode Co., Centerville, MA, USA) following established protocols. The DNA barcode candidate sequences, including ITS, matK, rbcL, and psbA-trnH, as well as combinations of these regions (ITS + matK, ITS + psbA-trnH, ITS + matK + psbA-trnH, and matK + rbcL), were aligned using the Clustal W 2.1 software (Informer Technologies, Inc., Los Angeles, CA, USA) [36]. The genetic distances were calculated in MEGA 7.0 using the Kimura 2-Parameter (K2P) model [37]. The dataset was thoroughly reviewed and any positions with gaps or missing data were excluded. The K2P model was utilized to quantify interspecific divergences, with the average and minimum interspecific distances as well as Theta prime serving as representative measures [21,38]. Intraspecific variation was assessed through the calculation of average intraspecific distance, coalescent depth, and theta [21,38]. We compared the differences in variability within and between species by analyzing DNA barcoding gaps [21,38]. Paired Wilcoxon signed-rank tests were conducted as previously described [21]. To further assess the efficacy of barcoding candidates for species identification, we employed the nearest distance method as previously described [21]. The discriminatory ability of barcoding candidates for sister species was assessed using TaxonGap 2.4.1 software [39]. The secondary structure of the ITS2 region of the ITS sequence was predicted according to the ITS2 database (https://its2.bioapps.biozentrum.uni-wuerzburg.de/, accessed on 15 December 2023).
All Cymbidium species included in our study (Tables S1 and S3) were categorized into three subgenera: Cymbidium, Cyperorchis, and Jensoa [8,40]. These included nine sections (sect.): Cymbidium Lindl, Himentophyllum Schltr, Floribunda Seth et Cribb, Iridorchis (Bl.) P. F., Eburnea Seth et Cribb, Cyperorchis (Bl.) P. F., Parishiella (Schltr.) P. F., Jensoa (Rafin.) Schltr., and Geocymbidium Schltr. The maximum likelihood (ML) method in MEGA 7.0 was utilized to build the phylogenetic tree [37]. For ML analysis, we utilized the Tamura-Nei model as the best model. The bootstrap support (BS) values for particular clades were calculated by running 1000 bootstrap replicates of the dataset. Four Pholidota species were used as outgroups: P. bulbocodioides, P. praecox, P. formosana, and P. albiflora. The GenBank accession numbers of their ITS sequences are AF302739, JN114695, AF302740, and AY101967, respectively.

3. Results

3.1. PCR Amplification Success Rate and Sequence Characteristics

The PCR amplification and sequencing success rates for ITS, matK, rbcL, and psbA-trnH sequences were all 100%. However, the atpF-atpH sequence could not be successfully amplified and sequenced; so, it was excluded from subsequent analyses. The accession numbers for GenBank can be found in Table S2. The lengths of the ITS and psbA-trnH sequences showed significant variation across different Cymbidium species, whereas the coding regions, such as matK and rbcL, exhibited a relatively consistent length. The ITS had the highest proportion of variable nucleotides at 11.2%, while the rbcL had the lowest at 5.0%. ITS showed the highest mean GC content (68.4%), followed by rbcL (42.9%) and psbA-trnH (34.0%); meanwhile, matK had the lowest mean GC ratio (32.1%) (Table 2).

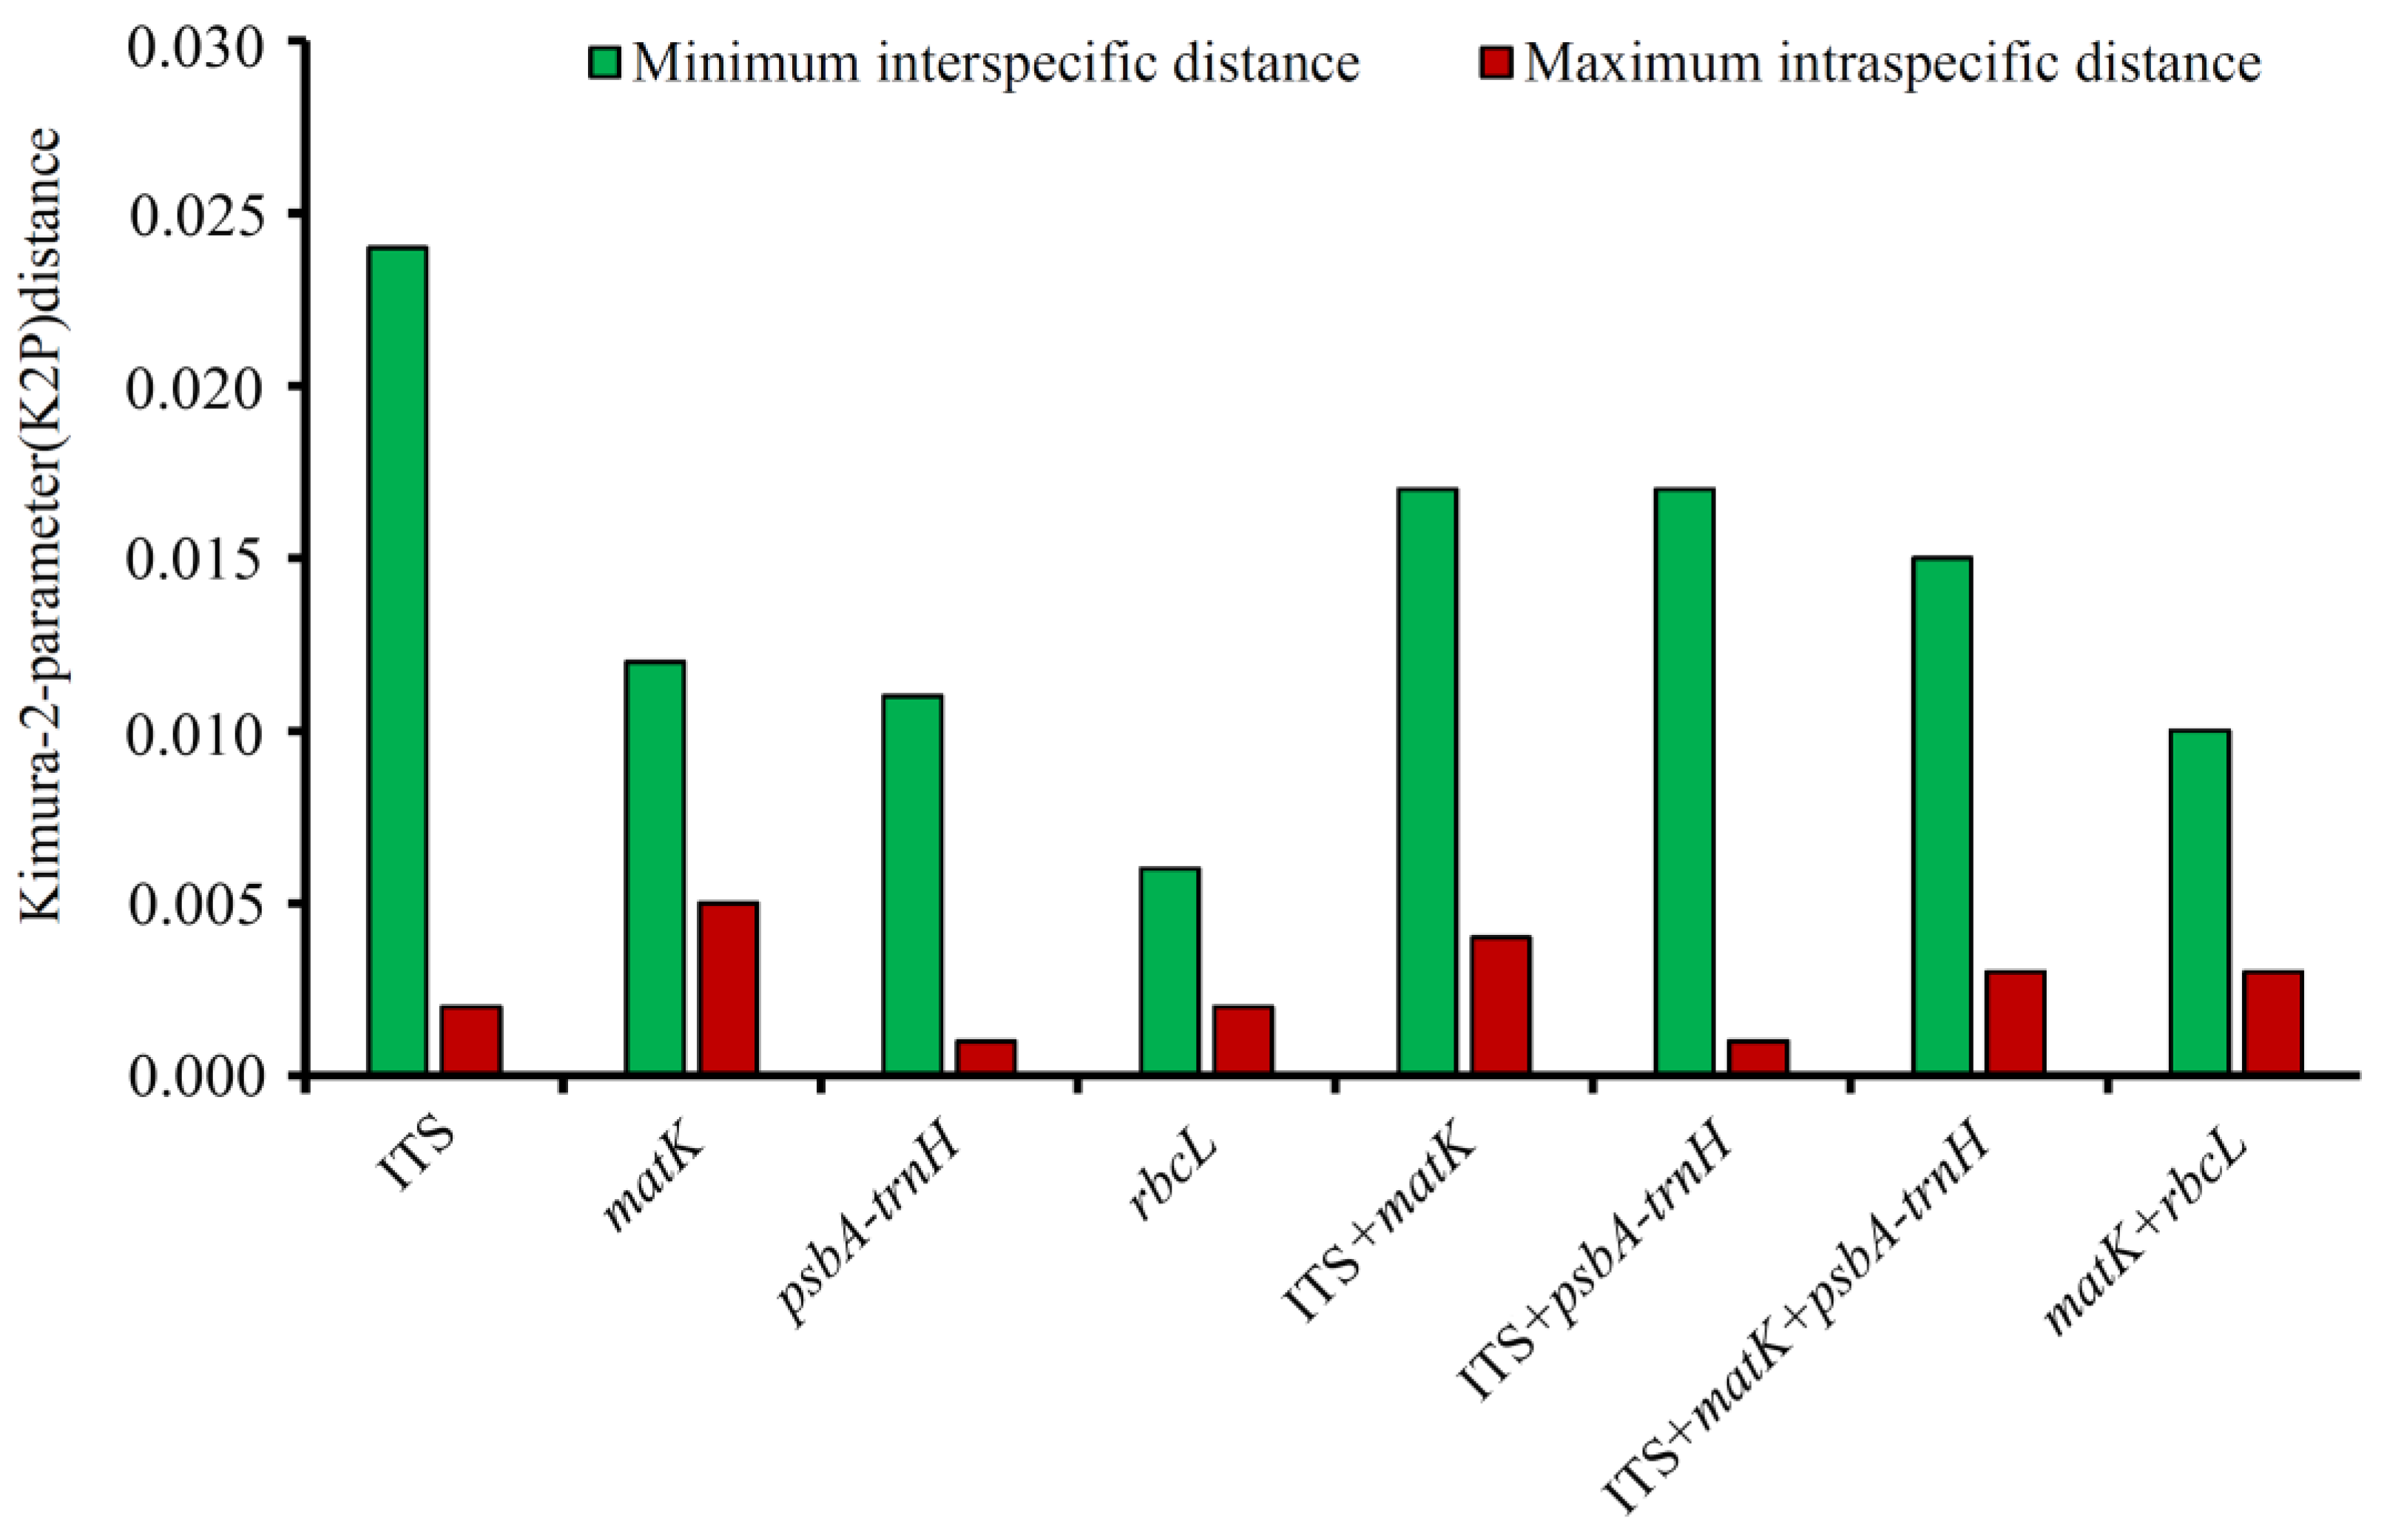
3.2. Genetic Divergence within and between Species

ITS exhibited significantly higher divergence compared to matK, psbA-trnH, and the combinations of regions (ITS + matK, ITS + psbA-trnH, ITS + matK + psbA-trnH, and matK + rbcL) at the interspecific level (Figure 1 and Figure 2). The rbcL region showed the lowest divergence in all interspecific calculations, while the ITS region exhibited the highest level of divergence at the interspecific level, as confirmed by Wilcoxon signed-rank tests (Table 3). At the intraspecific level, the lowest divergence was for psbA-trnH (Figure 1 and Figure 2). Comparable results were achieved when employing Wilcoxon signed-rank tests (Table 4).

3.3. Assessment of the Barcoding Gap

No discrepancies in barcoding were observed in any of the four potential loci or their combinations. Compared to matK, psbA-trnH, and rbcL, ITS exhibited only a slight difference in both inter- and intraspecific variation (Figure 3). In terms of the combined regions, the variations in ITS + psbA-trnH were the most significant, while the overlap in matK + rbcL was the largest (Figure 3).

3.4. Applicability for Species Authentication

Among the four candidate loci, ITS provided 93.2% species resolution, followed by matK with 75.8%, rbcL with 54.2%, and psbA-trnH with 87.1%. The species identification rates for the combined regions were 88.5%, 90.9%, 93.2%, and 67.0% for ITS + matK, ITS + psbA-trnH, ITS + matK + psbAtrnH, and matK + rbcL, respectively (Table 2). The ITS method was simpler and more cost-effective, even though both the ITS sequences and the combination of ITS + matK + psbA-trnH yielded the same species resolution.

3.5. Evaluation of the Discriminatory Power of Candidate Barcoding

The ability of barcoding to distinguish potential sister species in gathered samples was assessed (Figure 4 and Figure 5). The interspecific diversity was greater than the intraspecific diversity for more than 72.2% of species in ITS sequences and the combined regions of ITS + matK, ITS + psbA-trnH, and ITS + matK + psbA-trnH. The percentage of species with greater interspecific diversity than intraspecific diversity in the remaining loci were 61.1%, 50.0%, 33.0%, and 66.7% for matK, psbA-trnH, rbcL, and matK + rbcL, respectively. The results also showed that ITS could be a powerful tool for distinguishing the tested Cymbidium species. However, even for ITS sequences, there were still some cases, 22.2% of the species (as shown by the dark gray bar in Figure 4 and Figure 5), that had almost identical sequences with their sister species for C. georingii compared to C. georingii var. longibracteatum and C. kanran compared to C. sinense.

3.6. Analysis of ITS2 Secondary Structure

The secondary structure of the ITS2 regions within the ITS sequences were analyzed for species differentiation between closely related species, specifically C. georingii and C. georingii var. longibracteatum, as well as C. kanran and C. sinense. All species share a similar secondary structure consisting of four stem-loops, labeled as I, II, III, and IV. The ITS2 secondary structure can be used to directly distinguish between C. kanran and C. sinense. Although the secondary structures of C. georingii and C. georingii var. longibracteatum are highly conserved in stem-loops II, III, and IV, some differences in stem-loop I can be utilized for species differentiation (Figure 6).

3.7. Phylogenetic Analysis

The maximum likelihood phylogenetic tree was constructed based on ITS sequences (Figure 7) to explore the phylogenetic relationships among Cymbidium species. All Cymbidium species were classified into five primary clusters.
Cluster I comprised 11 species, all belonging to the sect. Jensoa of the subgenus Jensoa. Cluster II consisted of two species from sect. Cymbidium of the subgenus Cymbidium. Cluster III was the most complex, with 13 species, including 12 from the subgenus Cyperorchis (1 species from sect. Parishiella, 1 from sect. Cyperorchis, 2 from sect. Eburnea, and 8 from sect. Iridorchis), and 1 from the subgenus Cymbidium (C. dayanum from sect. Himentophyllum). Cymbidium lancifolium is a species from the sect. Geocymbidium of the subgenus Jensoa was grouped into Cluster IV. Two species (C. floribundum and C. suavissimum) from the same sect. Floribunda of the subgenus Cymbidium were distinct from all other Cymbidium species and formed a separate Cluster V (Figure 7).

4. Discussion

The ideal DNA barcodes should exhibit high interspecific variation and low intraspecific variation in order to achieve interspecific discrimination [21,37]. The disparity between intraspecific and interspecific values was termed as the ‘barcode gap’ [41]. As reported in a previous study [42], we encountered difficulty in directly sequencing the atpFatpH region using PCR. Currently, the chloroplast genomes of certain Cymbidium species have been sequenced [1,43,44]. The primers for the atpF–atpH region can be redeveloped using this chloroplast genome information, which is expected to enhance and improve the sequencing success rate of this region. Many studies have shown that rbcL exhibits very low interspecific variation [42,45]. Our findings indicated that rbcL exhibited the lowest interspecific variance and species identification efficiency compared to the other four DNA regions, making it unsuitable for the DNA barcoding of Cymbidium species. The matK locus was recommended as a core plant barcode by the CBOL plant working group. However, it exhibited a significant overlap, and its success rate in discriminating between species was only 75.8% in our study. Previous research has indicated that psbA-trnH could serve as a promising plant barcode [21,41,46,47]. Our findings revealed that the interspecific variation in the psbA-trnH region exceeded that of other examined regions within the chloroplast genome. Despite some limitations in using the ITS sequence as a universal barcode [48,49], we found that the ITS possessed the highest interspecific divergence and species resolution rate (93.2%) compared with all plastid regions in our study (Table 2).
Multi-locus combinations may be more preferable than using a single locus for species discrimination [20,48,50]. We found that the species identification rates were significantly higher when using combinations of ITS + matK, ITS + psbA-trnH, and ITS + matK + psbA-trnH compared to the investigated plastid regions. However, the results also showed that not all combinations outperformed the ITS region in identifying the tested samples. Notably, the species resolution rate of the matK + rbcL combination was only 67.0% (Table 2), despite being suggested as a plant barcode by the CBOL plant working group. In fact, several previous studies have reported that combinations of multiple loci are not superior to a single one locus alone for species identification [21,42,51]. Thus, ITS was the best choice for barcoding Cymbidium species from the candidate barcode sequences. The variable ITS region based on nuclear DNA provides far more information than certain candidate chloroplast DNA barcode sequences, such as trnH-psbA, matK, and rbcL [52,53]. However, the ITS sequence is not always sufficient for resolving all species identification issues in Cymbidium, such as differentiating between C. georingii and C. georingii var. longibracteatum as well as between C. kanran and C. sinense (Figure 4 and Figure 5). The ITS2 region in the ITS sequence displays significant variability in its sequence, while maintaining a conserved core secondary structure. It also demonstrates similar effectiveness in distinguishing closely related species [54]. Our findings indicated that C. georingii, C. georingii var. longibracteatum, C. kanran, and C. sinense were distinguishable using the ITS2 secondary structure (Figure 6).
The ITS region proved to be valuable not only for the identification of Cymbidium but also as a significant phylogenetic marker. The taxonomy of Cymbidium presents a particularly complex puzzle within the Orchidaceae family, as noted in previous studies [1,27,31,33,34]. Our study also revealed a complex taxonomy of the infrageneric taxa of Cymbidium. Zhang et al. (2021) also identified inconsistencies between their findings and the conventional categorization of subgenera and sections within Cymbidium [35]. At the section level, Jensoa, Cymbidium, Parishiella, Floribunda, and Geocymbidium were well supported as monophyletic (Figure 7). Species from these sections were grouped into Clusters I (BS = 73), II (BS = 98), III (BS = 100), IV (BS = 82), and V (BS = 95). However, some of the currently defined infrageneric taxa of Cymbidium are polyphyletic. For example, the taxonomic status of sect. Iridorchis, Himentophyllum, Eburnea, and Cyperorchis requires reassessment and redefinition. However, the samples of sect. Himentophyllum and Cyperorchis are rarely collected, making it difficult to accurately assess their classification issues. As a type of section of Cymbidium, the delimitation of sect. Iridorchis has nomenclatural implications for the entire infrageneric system. Van den Berg et al. reported that sect. Iridorchis is not monophyletic [30], and Sharma et al. also argued that the currently defined sect. Iridorchis is paraphyletic [31]. Our results indicated that sect. Iridorchis was paraphyletic, and some species belonged to several other sections, such as sect. Himentophyllum, Eburnea, and Cyperorchis which were grouped in separate subclades within Cluster III.
At the subgenus level, our results showed that the subgenus Cyperorchis was well supported as monophyletic, and all species within this subgenus were grouped into Cluster III. In our study, the subgenus Jensoa was mostly monophyletic, as previously reported [33]. This shows that all species from the subgenus Jensoa, except C. lancifolium (sect. Geocymbidium), were grouped into Cluster I. Compared to the subgenera Cyperorchis and Jensoa, subgenus Cymbidium exhibited more intricacies, with species such as C. aloifolium and C. bicolor from sect. Cymbidium included in Cluster II; C. floribundum and C. suavissimum from sect. Floribunda were grouped into Cluster V; and the species belonging to sect. Himentophyllum (C. dayanum) was grouped into Cluster III along with other species from the subgenus Cyperorchis. Hence, it is more favorable to employ a comprehensive and general notion of Cymbidium for the purpose of refining the infrageneric classification at the subgenus level, specifically in relation to subgenus Cymbidium. Because the Geocymbidium and Floribunda sections were distant from any other Cymbidium species and constituted the separate Clusters IV and V, respectively, we suggest creating two new subgenera for these species.

5. Conclusions

Four plastid loci (matK, rbcL, psbA-trnH, and atpF-atpH) and a nuclear locus (ITS) were examined to barcode Cymbidium species. The ITS region exhibited a significant difference in genetic distances between inter- and intraspecific variations, and its barcoding gap was more pronounced compared to plastid regions and the four regional combinations studied. Therefore, the ITS region can serve as a reliable barcode for the identification of Cymbidium species. Cluster analysis has presented compelling evidence for the potential of the ITS region in contributing to the phylogenetic investigation of the genus Cymbidium.

Supplementary Materials

The following supporting information can be downloaded at https://www.mdpi.com/article/10.3390/agronomy14050933/s1, Table S1: Sampled Cymbidium species and their voucher information used in this study. Voucher samples were deposited in the Zhejiang Provincial Key Laboratory for Genetic Improvement and Quality Control of Medicinal Plants, Hangzhou Normal University, China. Table S2: GenBank accession numbers of the four loci sequences for Cymbidium species examined in this study. Table S3: Accession numbers of the ITS sequences of Cymbidium species from GenBank.

Author Contributions

S.F. conceived and designed the experiments, participated in the analysis, and drafted the manuscript. Z.C. and L.G. performed the experiments and statistical analysis. S.F. and H.W. collected the plant samples and revised the paper. All authors have read and agreed to the published version of the manuscript.

Funding

This study was supported in part by the National Natural Science Foundation of China (31970346); the Zhejiang Provincial Natural Science Foundation of China (LY20H280012); and the Zhejiang Provincial Key Research & Development Project Grants (2018C02030).

Data Availability Statement

The datasets presented in this study can be found in online repositories. The names of the repository/repositories and accession numbers can be found in the article/Supplementary Materials.

Acknowledgments

Thanks to the staff of the Hangzhou Key Laboratory for Systems Biology of Medicinal and Ornamental Plants, Hangzhou Normal University, for helping to manage and collect experimental materials. Thanks to Guanzhou Chen (NorthCross Shanghai School, Shanghai 200436, China) for his assistance in the data analysis of this study.

Conflicts of Interest

The authors declare no conflicts of interest.

References

  1. Yang, J.B.; Tang, M.; Li, H.T.; Zhang, Z.R.; Li, D.Z. Complete chloroplast genome of the genus Cymbidium: Lights into the species identification, phylogenetic implications and population genetic analyses. BMC Evol. Biol. 2013, 13, 84. [Google Scholar] [CrossRef] [PubMed]
  2. Yang, F.X.; Gao, J.; Wei, Y.L.; Ren, R.; Zhang, G.Q.; Lu, C.Q.; Jin, J.P.; Ai, Y.; Wang, Y.Q.; Chen, L.J.; et al. The genome of Cymbidium sinense revealed the evolution of orchid traits. Plant Biotechnol. J. 2021, 19, 2501–2516. [Google Scholar] [CrossRef] [PubMed]
  3. Kim, H.T.; Chase, M.W. Independent degradation in genes of the plastid ndh gene family in species of the orchid genus Cymbidium (Orchidaceae; Epidendroideae). PLoS ONE 2017, 12, e0187318. [Google Scholar] [CrossRef] [PubMed]
  4. Sharma, S.K.; Rajkumari, K.; Kumaria, S.; Tandon, P.; Rao, S.R. Karyo-morphological characterization of natural genetic variation in some threatened Cymbidium species of Northeast India. Caryologia 2010, 63, 99–105. [Google Scholar] [CrossRef]
  5. Yukawa, T.; Stern, W.L. Comparative vegetative anatomy and systematics of Cymbidium (Cymbidieae: Orchidaceae). Bot. J. Linn. Soc. 2002, 138, 383–419. [Google Scholar] [CrossRef]
  6. Schlechter, R. Die Gattungen Cymbidium Sw. und Cyperorchis Bl. Repert. Sp. Nov. Regni. 1924, 20, e96–e110. [Google Scholar] [CrossRef]
  7. Hunt, P.F. Notes on Asiatic orchis 5. Kew Bull. 1970, 24, e93–e94. [Google Scholar] [CrossRef]
  8. Seth, C.J.; Cribb, P.J. A reassessment of the sectional limits in the genus Cymbidium Swartz. In Orchid Biology, Reviews and Prospectives 3; Cornell University Press: Ithaca, NY, USA; London, UK, 1984. [Google Scholar]
  9. Puy, D.D.; Cribb, P. The Genus Cymbidium; Helm, C., Ed.; The University of Chicago Press: Chicago, IL, USA, 1988. [Google Scholar]
  10. Liu, Z.J.; Chen, X.Q.; Ru, Z.Z. The Genus Cymbidium in China; Science Press: Beijing, China, 2006. [Google Scholar]
  11. Wang, H.Z.; Wu, Z.X.; Lu, J.J.; Shi, N.N.; Zhao, Y.; Zhang, Z.T.; Liu, J.J. Molecular diversity and relationships among Cymbidium goeringii cultivars based on inter-simple sequence repeat (ISSR) markers. Genetica 2009, 136, 391–399. [Google Scholar] [CrossRef]
  12. Chen, J.; Chen, M.K.; Zheng, Q.D.; Ma, S.H.; Liu, Z.J.; Ai, Y. Chloroplast characterization and phylogenetic relationship of Cymbidium aloifolium (Orchidaceae). Mitochondrial. DNA B Resour. 2020, 5, 478–479. [Google Scholar] [CrossRef]
  13. Hollingsworth, P.M. Refining the DNA barcode for land plants. Proc. Natl. Acad. Sci. USA 2011, 108, 19451–19452. [Google Scholar] [CrossRef]
  14. Li, D.Z.; Gao, L.M.; Li, H.T.; Wang, H.; Ge, X.J.; Liu, J.Q.; Chen, Z.D.; Zhou, S.L.; Chen, S.L.; Yang, J.B.; et al. Comparative analysis of a large dataset indicates that internal transcribed spacer (ITS) should be incorporated into the core barcode for seed plants. Proc. Natl. Acad. Sci. USA 2011, 108, 19641–19646. [Google Scholar]
  15. Schindel, D.E.; Miller, S.E. DNA barcoding a useful tool for taxonomists. Nature 2005, 435, 17. [Google Scholar] [CrossRef]
  16. Zhang, Z.H.; Jin, Y.Y.; Gao, Y.D.; Zhang, Y.; Ying, Q.C.; Shen, C.J.; Lu, J.J.; Zhan, X.R.; Wang, H.Z.; Feng, S.G. The Complete chloroplast genomes of two Physalis species, Physalis macrophysa and P. ixocarpa: Comparative genomics, evolutionary dynamics and phylogenetic relationships. Agronomy 2023, 13, 135. [Google Scholar] [CrossRef]
  17. Bergmann, T.; Rach, J.; Damm, S.; Desalle, R.; Schierwater, B.; Hadrys, H. The potential of distance-based thresholds and character-based DNA barcoding for defining problematic taxonomic entities by CO1 and ND1. Mol. Ecol. Resour. 2013, 13, 1069–1081. [Google Scholar] [CrossRef]
  18. Karamat, S.; Ashraf, N.; Akhtar, T.; Rahim, F.; Shafi, N.; Khalid, S.; Shahid, B.; Khawaja, S.; Rahim, J.; Majeed, Z.; et al. CO1-Based DNA barcoding for assessing diversity of Pteropus giganteus from the state of Azad Jammu Kashmir, Pakistan. Braz. J. Biol. 2021, 81, 584–591. [Google Scholar] [CrossRef]
  19. Larranaga, N.; Hormaza, J.I. DNA barcoding of perennial fruit tree species of agronomic interest in the genus Annona (Annonaceae). Front. Plant Sci. 2015, 6, 589. [Google Scholar] [CrossRef] [PubMed]
  20. Cbol Plant Working Group. A DNA barcode for land plants. Proc. Natl. Acad. Sci. USA 2009, 106, 12794–12797. [Google Scholar] [CrossRef]
  21. Chen, S.L.; Yao, H.; Han, J.P.; Liu, C.; Song, J.Y.; Shi, L.C.; Zhu, Y.J.; Ma, X.Y.; Gao, T.; Pang, X.H.; et al. Validation of the ITS2 region as a novel DNA barcode for identifying medicinal plant species. PLoS ONE 2010, 5, e8613. [Google Scholar] [CrossRef] [PubMed]
  22. Li, X.W.; Yang, Y.; Henry, R.J.; Rossetto, M.; Wang, Y.T.; Chen, S.L. Plant DNA barcoding: From gene to genome. Biol. Rev. Camb. Philos. Soc. 2015, 90, 157–166. [Google Scholar] [CrossRef] [PubMed]
  23. Xiong, C.; Sun, W.; Wu, L.; Xu, R.; Zhang, Y.; Zhu, W.; Panjwani; Liu, Z.; Zhao, B. Evaluation of four commonly used DNA barcoding loci for Ardisia species identification. Front. Plant Sci. 2022, 13, 860778. [Google Scholar] [CrossRef]
  24. Siripiyasing, P.; Kaenratana, K.; Mokkamul, P.; Tanee, T.; Sudmoon, R.; Chaveerach, A. DNA barcoding of the Cymbidium species (Orchidaceae) in Thailand. Afr. J. Agric. Res. 2012, 7, 393–404. [Google Scholar]
  25. Obara-Okeyo, P.; Kako, S. Genetic diversity and identification of Cymbidium cultivars as measured by random amplified polymorphic DNA (RAPD) markers. Euphytica 1998, 99, 95–101. [Google Scholar] [CrossRef]
  26. Wang, H.Z.; Wang, Y.D.; Zhou, X.Y.; Ying, Q.C.; Zheng, K.L. Analysis of genetic diversity of 14 species of Cymbidium based on RAPDs and AFLPs. Shi Yan Sheng Wu Xue Bao 2004, 37, 482–486. [Google Scholar] [PubMed]
  27. Wu, Z.X.; Wang, H.Z.; Shi, N.N.; Zhao, Y. The genetic diversity of Cymbidium by ISSR. Yi Chuan 2008, 30, 627–632. [Google Scholar] [CrossRef] [PubMed]
  28. Sharma, S.K.; Kumaria, S.; Tandon, P.; Rao, S.R. Assessment of genetic variation and identification of species-specific ISSR markers in five species of Cymbidium (Orchidaceae). J. Plant Biochem. Biot. 2013, 22, 250–255. [Google Scholar] [CrossRef]
  29. Moe, K.T.; Zhao, W.; Song, H.S.; Kim, Y.H.; Chung, J.W.; Cho, Y.I.; Park, P.H.; Park, H.S.; Chae, S.C.; Park, Y.J. Development of SSR markers to study diversity in the genus Cymbidium. Biochem. Syst. Ecol. 2010, 38, 585–594. [Google Scholar] [CrossRef]
  30. Van den Berg, C.; Ryan, A.; Cribb, P.; Chase, M. Molecular phylogenetics of Cymbidium (Orchidaceae: Maxillarieae) sequence data from internal transcribed spacers (ITS) of nuclear ribosomal DNA and plastid matK. Lindleyana 2002, 17, 102–111. [Google Scholar]
  31. Sharma, S.K.; Dkhar, J.; Kumaria, S.; Tandon, P.; Rao, S.R. Assessment of phylogenetic inter-relationships in the genus Cymbidium (Orchidaceae) based on internal transcribed spacer region of rDNA. Gene 2012, 495, 10–15. [Google Scholar] [CrossRef]
  32. Zhang, L.; Huang, Y.W.; Huang, J.L.; Ya, J.D.; Zhe, M.Q.; Zeng, C.X.; Zhang, Z.R.; Zhang, S.B.; Li, D.Z.; Li, H.T.; et al. DNA barcoding of Cymbidium by genome skimming: Call for next-generation nuclear barcodes. Mol. Ecol. Resour. 2022, 23, 424–439. [Google Scholar] [CrossRef]
  33. Wang, X.M.; Cheng, L.J.; Li, Z.L.; Zhang, Z.C.; Wang, Y.Y. Characterization of the complete chloroplast genome of a Chinese endangered species Cymbidium wenshanense Y. S. Wu et F. Y. Liu. Mitochondrial. DNA B Resour. 2023, 8, 815–818. [Google Scholar] [CrossRef]
  34. Choi, S.; Kim, M.; Lee, J.; Ryu, K. Genetic diversity and phylogenetic relationships among and within species of oriental Cymbidiums based on RAPD analysis. Sci. Hortic. 2006, 108, 79–85. [Google Scholar] [CrossRef]
  35. Zhang, G.Q.; Chen, G.Z.; Chen, L.J.; Zhai, J.W.; Huang, J.; Wu, X.Y.; Li, M.H.; Peng, D.H.; Rao, W.H.; Liu, Z.J.; et al. Phylogenetic incongruence in Cymbidium orchids. Plant Divers. 2021, 43, 452–461. [Google Scholar] [CrossRef]
  36. Thompson, J.D.; Gibson, T.J.; Higgins, D.G. Multiple Sequence Alignment Using ClustalW and ClustalX. Curr. Protoc. Bioinform. 2002, 1, 2–3. [Google Scholar] [CrossRef]
  37. Kumar, S.; Stecher, G.; Tamura, K. MEGA7: Molecular Evolutionary Genetics Analysis Version 7.0 for Bigger Datasets. Mol. Biol. Evol. 2016, 33, 1870–1874. [Google Scholar] [CrossRef]
  38. Feng, S.G.; Jiang, M.Y.; Shi, Y.J.; Jiao, K.L.; Shen, C.J.; Lu, J.J.; Ying, Q.C.; Wang, H.Z. Application of the ribosomal DNA ITS2 region of Physalis (Solanaceae): DNA barcoding and phylogenetic study. Front. Plant Sci. 2016, 7, 1047. [Google Scholar] [CrossRef]
  39. Slabbinck, B.; Dawyndt, P.; Martens, M.; De Vos, P.; De Baets, B. TaxonGap: A visualization tool for intra- and inter-species variation among individual biomarkers. Bioinformatics 2008, 24, 866–867. [Google Scholar] [CrossRef]
  40. Chinese Academy of Sciences. Flora of China; Science Press: Beijing, China, 1999; Volume 18, p. 191. [Google Scholar]
  41. Lahaye, R.; Van der Bank, M.; Bogarin, D.; Warner, J.; Pupulin, F.; Gigot, G.; Maurin, O.; Duthoit, S.; Barraclough, T.G.; Savolainen, V. DNA barcoding the floras of biodiversity hotspots. Proc. Natl. Acad. Sci. USA 2008, 105, 2923–2928. [Google Scholar] [CrossRef]
  42. Xiang, X.G.; Hu, H.; Wang, W.; Jin, X.H. DNA barcoding of the recently evolved genus Holcoglossum (Orchidaceae: Aeridinae): A test of DNA barcode candidates. Mol. Ecol. Resour. 2011, 11, 1012–1021. [Google Scholar] [CrossRef]
  43. Wang, Y.Y.; Cheng, L.J.; Zhao, Y.R.; Li, Y.F.; He, F.M.; Li, Z.L. Characterization of the complete chloroplast genome of a Chinese endangered species Cymbidium mannii. Mitochondrial. DNA B Resour. 2020, 5, 3199–3200. [Google Scholar] [CrossRef]
  44. Du, Z.H.; Yang, X.Y.; Tan, G.F.; Chen, Z.L. The complete chloroplast genome of Cymbidium dayanum (Orchidaceae). Mitochondrial. DNA B Resour. 2021, 6, 1897–1898. [Google Scholar] [CrossRef]
  45. Newmaster, S.G.; Fazekas, A.J.; Steeves, R.A.; Janovec, J. Testing candidate plant barcode regions in the Myristicaceae. Mol. Ecol. Resour. 2008, 8, 480–490. [Google Scholar] [CrossRef] [PubMed]
  46. Feng, S.G.; Jiao, K.L.; Zhu, Y.J.; Wang, H.H.; Jiang, M.Y.; Wang, H.Z. Molecular identification of species of Physalis (Solanaceae) using a candidate DNA barcode: The chloroplast psbA-trnH intergenic region. Genome 2018, 61, 15–20. [Google Scholar] [CrossRef]
  47. Fujii, T.; Mori, T.; Tatsuo, Y.; Takao, Y.; Fujino, H.; Tsuchida, T.; Minami, M. Identification of Valeriana fauriei and other Eurasian medicinal valerian by DNA polymorphisms in psbA-trnH intergenic spacer sequences in chloroplast DNA. J. Nat. Med. 2021, 75, 699–706. [Google Scholar] [CrossRef] [PubMed]
  48. Kress, W.J.; Erickson, D.L. A two-locus global DNA barcode for land plants: The coding rbcL gene complements the non-coding trnH-psbA spacer region. PLoS ONE 2007, 2, e508. [Google Scholar] [CrossRef] [PubMed]
  49. Sass, C.; Little, D.P.; Stevenson, D.W.; Specht, C.D. DNA barcoding in the cycadales: Testing the potential of proposed barcoding markers for species identification of cycads. PLoS ONE 2007, 2, e1154. [Google Scholar] [CrossRef]
  50. Newmaster, S.; Fazekas, A.; Ragupathy, S. DNA barcoding in land plants: Evaluation of rbcL in a multigene tiered approach. Botany 2006, 84, 335–341. [Google Scholar] [CrossRef]
  51. Starr, J.R.; Naczi, R.F.; Chouinard, B.N. Plant DNA barcodes and species resolution in sedges (Carex, Cyperaceae). Mol. Ecol. Resour. 2009, 9 (Suppl. S1), 151–163. [Google Scholar] [CrossRef]
  52. Gao, T.; Yao, H.; Song, J.Y.; Zhu, Y.J.; Liu, C.; Chen, S.L. Evaluating the feasibility of using candidate DNA barcodes in discriminating species of the large Asteraceae family. BMC Evol. Biol. 2010, 10, 324. [Google Scholar] [CrossRef] [PubMed]
  53. Thomas, C. Plant Bar Code Soon to Become Reality; Science: New York, NY, USA, 2009; Volume 325, p. 526. [Google Scholar]
  54. Samanta, B.; Ehrman, J.M.; Kaczmarska, I. A consensus secondary structure of ITS2 for the diatom Order Cymatosirales (Mediophyceae, Bacillariophyta) and reappraisal of the order based on DNA, morphology, and reproduction. Mol. Phylogenet. Evol. 2018, 129, 117–129. [Google Scholar] [CrossRef]
Figure 1. Analyses of intra- and interspecific divergence of four loci and four regional combinations based on six metrics.
Agronomy 14 00933 g001
Figure 2. Analyses of the minimum interspecific distance and the maximum intraspecific distance of four loci and four regional combinations.
Agronomy 14 00933 g002
Figure 3. Distribution of the intra- and interspecific variations of the four loci and four regional combinations in Cymbidium species.
Agronomy 14 00933 g003
Figure 4. Species identification capability of four loci sequences of 18 Cymbidium species using TaxonGap. The complete list of species utilized in this study is presented in the left panel. In the right panel, the horizontal light grey and dark grey bars illustrate the within-species diversity and between-species distinguishability, respectively. Additionally, the right panel displays the names of the most closely related species identified using a similarity-based approach.
Agronomy 14 00933 g004
Figure 5. Species identification capability of four regional combinations of 18 Cymbidium species using TaxonGap. The complete list of species utilized in this study is presented in the left panel. In the right panel, the horizontal light grey and dark grey bars illustrate the within-species diversity and between-species distinguishability, respectively. Additionally, the right panel displays the names of the most closely related species identified using a similarity-based approach.
Agronomy 14 00933 g005
Figure 6. Secondary structures of ITS2 region within ITS sequence of four Cymbidium species. The stem-loop domains are labeled as I–IV, and bulges can be seen on each of them.
Agronomy 14 00933 g006
Figure 7. Maximum likelihood (ML) tree based on ITS sequences for Cymbidium species collected in this study. Numbers above branches indicate bootstrap (BS ≥ 50) values. The ML analysis was performed using the MEGA 7 program under the Tamura-Nei model and assessed by 1000 bootstrapping replicates. All Cymbidium species were classified into five primary clusters: I–V.
Agronomy 14 00933 g007
Table 1. PCR primers and reaction procedures of five DNA regions.
DNA RegionPrimer NameSequence (5′-3′)Amplication Protocol
ITSITS4TCCTCCGCTTATTGATATGC94 °C 5 min; 94 °C 1 min, 55 °C 1 min;
ITS5GGAAGGAGAAGTCGTAACAAGG72 °C 1.5 min, 35 cycles; 72 °C 10 min
matKmatK-1FCGTACAGTACTTTTGTGTTTACGAG94 °C 5 min; 94 °C 1 min, 60 °C 1 min;
matK-1RACCCAGTCCATCTGGAAATCTTGGTTC72 °C 1.5 min, 30 cycles; 72 °C 10 min
rbcLrbcL-IFATGTCACCACAAACAGAGACTAAAGC95 °C 2 min; 94 °C 1 min, 55 °C 1 min;
rbcL-1RGTAAAATCAAGTCCACCRCG72 °C 1.5 min, 35 cycles; 72 °C 10 min
psbA-trnHpsbA-3FGTTATGCATGAACGTAATGCTC94 °C 5 min; 94 °C 1 min, 55 °C 1 min;
trnHFCGCGCATGGTGGATTCACAATCC72 °C 1.5 min, 32 cycles; 72 °C 10 min
atpF-atpHatpF-H/fACTCGCACACACTCCCTTTCC94 °C 5 min; 94 °C 1 min, 50 °C 1 min;
atpF-H/RGCTTTTATGGAAGCTTTAACAAT72 °C 1.5 min, 35 cycles; 72 °C 10 min
Table 2. Evaluation of five DNA regions and combinations of the regions.
No. of Samples/SpeciesPCR Success (%)Sequencing Success (%)Aligned Length (bp)N Variable Characters (%Variable Characters)G+C Ratio (%)Ability to Discriminate
ITS34/1810010066174 (11.2)68.493.20%
matK34/1810010084859 (7.0)32.175.80%
psbA-trnH34/1810010084587 (10.3)3487.10%
rbcL34/1810010057528 (5.0)42.954.20%
atpF-atpH34/18lowlow----
ITS + matK34/18--1509131 (8.7)47.988.50%
ITS + psbA-trnH34/18--1510159 (10.5)5090.90%
ITS + matK + psbA-trnH34/18--2362213 (9.0)42.193.20%
matK + rbcL34/18--1686162 (9.6)3367.00%
Table 3. Wilcoxon signed-rank tests of interspecific divergence among loci.
W+W−Relative Ranks, n, p ValueResult
ITSmatKW+ = 122,851.5, W− = 12,088.5, n = 519, p ≤ 5.144 × 10−59ITS > matK
ITSpsbA-trnHW+ = 119,137, W− = 8123, n = 504, p ≤ 1.492 × 10−64ITS > psbA-trnH
ITSrbcLW+ = 126,189, W− = 2082, n = 506, p ≤ 2.735 × 10−79ITS > rbcL
ITSITS + matKW+ = 124,066.5, W− = 7774.5, n = 513, p ≤ 4.208 × 10−67ITS > ITS + matK
ITSITS + psbA-trnHW+ = 127,702.5, W− = 3113.5, n = 511, p ≤ 1.259 × 10−77ITS >TS + psbA-trnH
ITSITS + matK + psbA-trnHW+ = 122,080, W− = 4173, n = 502, p ≤ 1.982 × 10−73ITS > ITS + matK + psbA-trnH
ITSmatK + rbcLW+ = 129,347, W− = 4039, n = 516, p ≤ 2.675 × 10−76ITS > matK + rbcL
matKpsbA-trnHW+ = 71,961, W− = 55,804, n = 505, p ≤ 0.01381matK > psbA-trnH
matKrbcLW+ = 107,518, W− = 18,233, n = 501, p ≤ 4.034 × 10−43matK > rbcL
matKITS + matKW+ = 20,587.5, W− = 103,663.5, n = 498, p ≤ 3.24 × 10−38matK< ITS + matK
matKITS + psbA-trnHW+ = 33,000.5, W− = 93,755.5, n = 503, p ≤ 1.251 × 10⁻²⁰matK< ITS + psbA-trnH
matKITS + matK + psbA-trnHW+ = 37,713, W− = 87,037, n = 499, p ≤ 1.988 × 10⁻¹⁴matK < ITS + matK + psbA-trnH
matKmatK + rbcLW+ = 76,946, W− = 30,007, n = 462, p ≤ 3.024 × 10⁻¹⁶matK > matK + rbcL
psbA-trnHrbcLW+ = 80,886, W− = 15,255, n = 438, p ≤ 3.479 × 10⁻³⁵psbA-trnH > rbcL
psbA-trnHITS + matKW+ = 25,876.5, W− = 106,993.5, n = 515, p ≤ 3.492 × 10⁻³³psbA-trnH < ITS + matK
psbA-trnHITS + psbA-trnHW+ = 22,874, W− = 100,879, n = 497, p ≤ 4.331 × 10⁻³⁴psbA-trnH < ITS + psbA-trnH
psbA-trnHITS + matK + psbA-trnHW+ = 35,329.5, W− = 93,448.5, n = 507, p ≤ 1.329 × 10⁻¹⁸psbA-trnH < ITS + matK + psbA-trnH
psbA-trnHmatK + rbcLW+ = 70,183.5, W− = 56,069.5, n = 502, p ≤ 0.03psbA-trnH > matK + rbcL
rbcLITS + matKW+ = 7126, W− = 129,900, n = 523, p ≤ 1.721 × 10−70rbcL< ITS + matK
rbcLITS + psbA-trnHW+ = 4827.5, W− = 120,422.5, n = 500, p ≤ 1.772 × 10−71rbcL< ITS + psbA-trnH
rbcLITS + matK + psbA-trnHW+ = 11,060, W− = 121,810, n = 515, p ≤ 2.417 × 10−60rbcL< ITS + matK + psbA-trnH
rbcLmatK + rbcLW+ = 16,738.5, W− = 102,089.5, n = 487, p ≤ 6.601 × 10−43rbcL< matK + rbcL
ITS + matKITS + psbA-trnHW+ = 69,846, W− = 40,369, n = 469, p ≤ 5.215 × 10 −7ITS + matK > ITS + psbA-trnH
ITS + matKITS+ matK + psbA-trnHW+ = 112,461.5, W− = 5879.5, n = 486, p ≤ 2.658 × 10−66ITS + matK > ITS + matK + psbA-trnH
ITS + matKmatK + rbcLW+ = 117,120.5, W− = 2195.5, n = 488, p ≤ 7.187 × 10−76ITS + matK> matK + rbcL
ITS + psbA-trnHmatK + psbA-trnHW+ = 118,283, W− = 9988, n = 506, p ≤ 8.182 × 10−61ITS + psbA-trnH > matK+psbA-trnH
ITS + psbA-trnHmatK + rbcLW+ = 118,735.5, W− = 8020.5, n = 503, p ≤ 1.376 × 10−64ITS + psbA-trnH > matK + rbcL
ITS+ matK + psbA-trnHmatK +rbcLW+ = 115,863, W− = 6402, n = 494, p ≤ 1.386 × 10−66ITS + matK + psbA-trnH > matK + rbcL
Table 4. Wilcoxon signed-rank tests of intraspecific divergence among loci.
W+W−Relative Ranks, n, p ValueResult
ITSmatKW+ = 161, W− = 217, n = 27, p ≤ 0.5088ITS = matK
ITSpsbA-trnHW+ = 225, W− = 51, n = 23, p ≤ 0.008516ITS > psbA-trnH
ITSrbcLW+ = 182, W− = 94, n = 23, p ≤ 0.1858ITS = rbcL
ITSITS + matKW+ = 161, W− = 217, n = 27, p ≤ 0.5088ITS = ITS + matK
ITSITS + psbA-trnHW+ = 225, W− = 51, n = 23, p ≤ 0.008516ITS > ITS + psbA-trnH
ITSITS + matK + psbA-trnHW+ = 151, W− = 102, n = 22, p ≤ 0.4359ITS = ITS + matK + psbA-trnH
ITSmatK + rbcLW+ = 169, W− = 209, n = 27, p ≤ 0.6394ITS = matK + rbcL
matKpsbA-trnHW+ = 231, W− = 0, n = 21, p ≤ 6.414× 10⁻⁵matK > psbA-trnH
matKrbcLW+ = 191, W− = 62, n = 22, p ≤ 0.03773matK > rbcL
matKITS + matKW+ = 186, W− = 67, n = 22, p ≤ 0.05543matK = ITS + matK
matKITS + psbA-trnHW+ = 228.5, W− = 47.5, n = 23, p ≤ 0.006194matK > ITS + psbA-trnH
matKITS + matK + psbA-trnHW+ = 192.5, W− = 17.5, n = 20, p ≤ 0matK > ITS + matK + psbA-trnH
matKmatK + rbcLW+ = 111.5, W− = 24.5, n = 16, p ≤ 0matK > matK + rbcL
psbA-trnHrbcLW+ = 3.5, W− = 51.5, n = 10, p ≤ 0psbA-trnH < rbcL
psbA-trnHITS + matKW+ = 13, W− = 393, n = 28, p ≤ 1.596× 10⁻⁵psbA-trnH < ITS + matK
psbA-trnHITS + psbA-trnHW+ = 36, W− = 264, n = 24, p ≤ 0.001183psbA-trnH < ITS + psbA-trnH
psbA-trnHITS + matK + psbA-trnHW+ = 18, W− = 333, n = 26, p ≤ 6.681× 10⁻⁵psbA-trnH < ITS + matK + psbA-trnH
psbA-trnHmatK + rbcLW+ = 0, W− = 276, n = 23, p ≤ 2.891× 10⁻⁵psbA-trnH < matK + rbcL
rbcLITS + matKW+ = 134.5, W− = 330.5, n = 30, p ≤ 0.04492rbcL < ITS + matK
rbcLITS + psbA-trnHW+ = 150, W− = 175, n = 25, p ≤ 0.7468rbcL = ITS + psbA-trnH
rbcLITS + matK + psbA-trnHW+ = 148.5, W− = 229.5, n = 27, p ≤ 0.3366rbcL = ITS + matK + psbA-trnH
rbcLmatK + rbcLW+ = 59.5, W− = 193.5, n = 22, p ≤ 0.03085rbcL < matK +rbcL
ITS + matKITS + psbA-trnHW+ = 128.5, W− = 7.5, n = 16, p ≤ 0ITS + matK > ITS + psbA-trnH
ITS + matKITS + matK + psbA-trnHW+ = 171, W− = 0, n = 18, p ≤ 0ITS + matK > ITS + matK + psbA-trnH
ITS + matKmatK + rbcLW+ = 114, W− = 96, n = 20, p ≤ 0ITS + matK > matK + rbcL
ITS + psbA-trnHITS + matK + psbA-trnHW+ = 72, W− = 138, n = 20, p ≤ 0ITS + psbA-trnH < ITS + matK + psbA-trnH
ITS + psbA-trnHmatK + rbcLW+ = 76, W− = 224, n = 24, p ≤ 0.03573ITS + psbA-trnH < matK + rbcL
ITS + matK + psbA-trnHmatK + rbcLW+ = 30, W− = 141, n = 18, p ≤ 0ITS + matK + psbA-trnH < matK + rbcL
Disclaimer/Publisher’s Note: The statements, opinions and data contained in all publications are solely those of the individual author(s) and contributor(s) and not of MDPI and/or the editor(s). MDPI and/or the editor(s) disclaim responsibility for any injury to people or property resulting from any ideas, methods, instructions or products referred to in the content.

