
The Dependence of the Strength of a Carbon Fiber/Aluminum Matrix Composite on the Interface Shear Strength between the Matrix and Fiber


Osipyan Institute of Solid State Physics RAS, 142432 Chernogolovka, Russia
*
Author to whom correspondence should be addressed.
Metals 2022, 12(10), 1753; https://doi.org/10.3390/met12101753
Submission received: 29 August 2022
/
Revised: 11 October 2022
/
Accepted: 13 October 2022
/
Published: 19 October 2022
(This article belongs to the Special Issue Advances in Preparation Methods and Numerical Simulation of Composites: Formation and Properties)
Abstract
:Taking the example of a composite wire with an Al-25% Sn alloy matrix reinforced with carbon fiber, the dependence of composite bending strength on interface shear strength was determined. Samples of the composite wire with different interface shear strengths were obtained by heat treatment at temperatures from 300 to 600 °C. The highest bending strength of 2450 MPa was observed for composite wire samples with the lowest interface shear strength. With an increase in the shear strength of the interface, a decrease in the strength was observed. The study of the surface of carbon fiber extracted from the composite showed that heat treatment led to the formation of aluminum carbide crystals on the fiber surface, the size and number of which increased with increasing temperature. As a result, there was an increase in the shear strength of the interface. The evaluation of the work of fracture of a composite with different strengths of the interface between the matrix and the fiber demonstrated that as the strength of the interface increases, the work of fracture decreases, due to the premature fracture of the composite through crack propagation in one plane. Based on the experimental data, the refined mixture rule according to the Weibull distribution, and an assessment of the critical stress of crack propagation according to the Griffith–Orowan–Irwin concept, the dependence of composite strength on the shear strength of the interface was estimated. Due to this, the critical shear strength was calculated at which the greatest strength of the composite can be achieved, these values being 107 MPa and 2675 MPa, respectively. It is shown that the contribution of the work of overcoming the friction force to the total work of fracture at relatively small values of shear strength can be several times greater than the total contribution of all other types of energy.
1. Introduction
The strength of a fibrous composite largely depends on the mechanical characteristics of the fiber and the matrix; however, an equally important parameter is the shear strength of the interface between them. This parameter is of particular importance in metal matrix composites, which is demonstrated convincingly in the reviews [1,2,3].
In the review [1], the author derives a refined mixture rule for calculating the strength of fibrous composites with “weak” interfaces in the direction of reinforcement. The strength of the fiber inside the composite is refined according to the premise that there is a global distribution of the load between all unbroken fibers in the process of fracture. Based on this refinement and experimental data for at least 18 different composites, the author shows that as the shear strength of the interface decreases, the strength of the composite decreases. This happens for two reasons. The first is that a decrease in the shear strength of the interface increases the critical length of the fiber. The second is that, according to the Weibull distribution, the strength of the fiber decreases with an increase in its length.
In the review [3], using eight types of composites with metal and ceramic matrices as examples, and in the review [2], using the example of a composite with an aluminum matrix reinforced with oxide fiber, it is shown that a “weak” interface between the matrix and the fiber leads to the inhibition of the main crack propagation in the plane perpendicular to the reinforcement. As a result, the strength of the composite is significantly higher than that with a “strong” interface.
Thus, on the one hand, according to [1], a decrease in shear strength reduces the composite strength, and, on the other hand, according to [2,3], the opposite is the case. A qualitative model that takes into account both of these factors is described in [4]. According to this model, the greatest strength of a composite is to be achieved at the critical shear strength between the matrix and the fiber. In this case, if the shear strength of the interface is less than the critical value, the composite strength is determined according to the refined mixture rule [1]. Otherwise, the strength is determined by the critical stress of crack propagation.
The present work attempts to numerically express the qualitative model proposed in [4] taking the example of a composite with an aluminum matrix reinforced with carbon fiber. In this regard, it seems necessary to consider some features of this type of composite.
There are several ways to control the shear strength of the interface in such composites. One is through the application of barrier carbon fiber coatings, such as pyrolytic carbon [5], the functional gradient coating C/SiC/Si [6], and oxide coating based on alumina [7], titanium dioxide [8], or silica [9]. Other ways to control the shear strength of the interface include doping the aluminum matrix with tin [4] or magnesium [10], heat treatment [5], changing the brand of fiber [11], and optimizing the production mode, specifically the melt temperature of the matrix and the time of its contact with the fiber [12,13]. Note that each of the mentioned methods has its own individual limit with respect to the lowest value of the shear strength between the matrix and the fiber.
The highest strength of composites with an aluminum matrix reinforced with carbon fiber is achieved due to the creation of “weak” interfaces (regardless of the creation method) and is about 1200 MPa under tension. This is indicated by the results of [5,6,10], namely, images of the fracture surfaces of composites with the highest strengths. The fracture surfaces showed developed relief; some of the fibers were pulled out of the matrix. In contrast, the formation of a “strong” interface led to a decrease in the indicated strength value by several times, and crack propagation during fracture occurred almost in the same plane.
To create “weak” interfaces in a composite with an aluminum matrix reinforced with carbon fiber, matrix doping was used in this work. The change in the shear strength of the interface was effected by heat treatment at different temperatures. Based on the results of studying a composite with different interface shear strengths, the factors affecting the strength of the composite were assessed, namely, a decrease in the strength of the fiber in the composite, according to the Weibull distribution and the critical stress of crack propagation.
2. Materials and Methods
As a reinforcing agent, a commercially available continuous carbon fiber thread (UMT40-3K-EP, manufactured by the UMATEX Group, Moscow, Russia) was used; it was thermally cleaned from the sizing in a vacuum at 400 °C for 15 min (according to ISO 11566:1996). According to the manufacturer, the tensile strength and tensile modulus of the carbon fiber were 4.0 GPa and 260 GPa, respectively. An alloy of the Al-Sn system with a tin content of 25 at.%. was used as the matrix material.
2.1. Production of a Composite Carbon–Aluminum Wire
2.2. Determination of Mechanical Properties
The strength of the composite wire was determined at three-point bending. The cross-sectional shape of the wire was taken to be ellipsoidal. The flexural modulus was determined using a method similar to ISO 178:2010. The fracture energy of the composite was estimated from the area under the strain curve in the load–displacement axes. The loading rate was 5 mm/min. All tests were carried out at 20 ± 2 °C.
Samples for each experimental point were taken from a segment of the composite wire with a length of at least 1 m. The specified segment was tested for flexural strength in different sections equidistant from each other. The distance between adjacent points of load application was at least 50 mm. Each experimental point was plotted from at least 5 trials.
2.3. Scanning Electron Microscopy and Elemental Analysis
The fiber surface, fracture surfaces, and the microstructure of the composite wire were investigated using a SUPRA 50VP high-resolution scanning electron microscope (Zeiss AG, Oberkochen, Germany). The images were obtained in the secondary electron mode with an accelerating voltage of 10 kV at magnifications up to 50,000×.
The fiber was extracted from the composite by etching the matrix in a mixture of concentrated hydrochloric and nitric acids (aqua regia).
2.4. X-ray Diffraction Analysis
X-ray diffraction patterns were recorded with a Siemens D500 diffractometer (Siemens AG, Munich, Germany) using CuKα1 radiation in the angle range of 10–60° with a step of 0.02°.
2.5. Strength of the Interface between the Matrix and the Fiber
Since the shear strength of the interface between the matrix and the fiber depends on their chemical interaction [5,12], this parameter was changed by heat treatment in a muffle furnace at 300, 400, 500, 550, and 600 °C for 5 min. The interface strength was assessed by the length of the pulled-out part of the fiber on the fracture surface.
3. Results
3.1. Microstructure
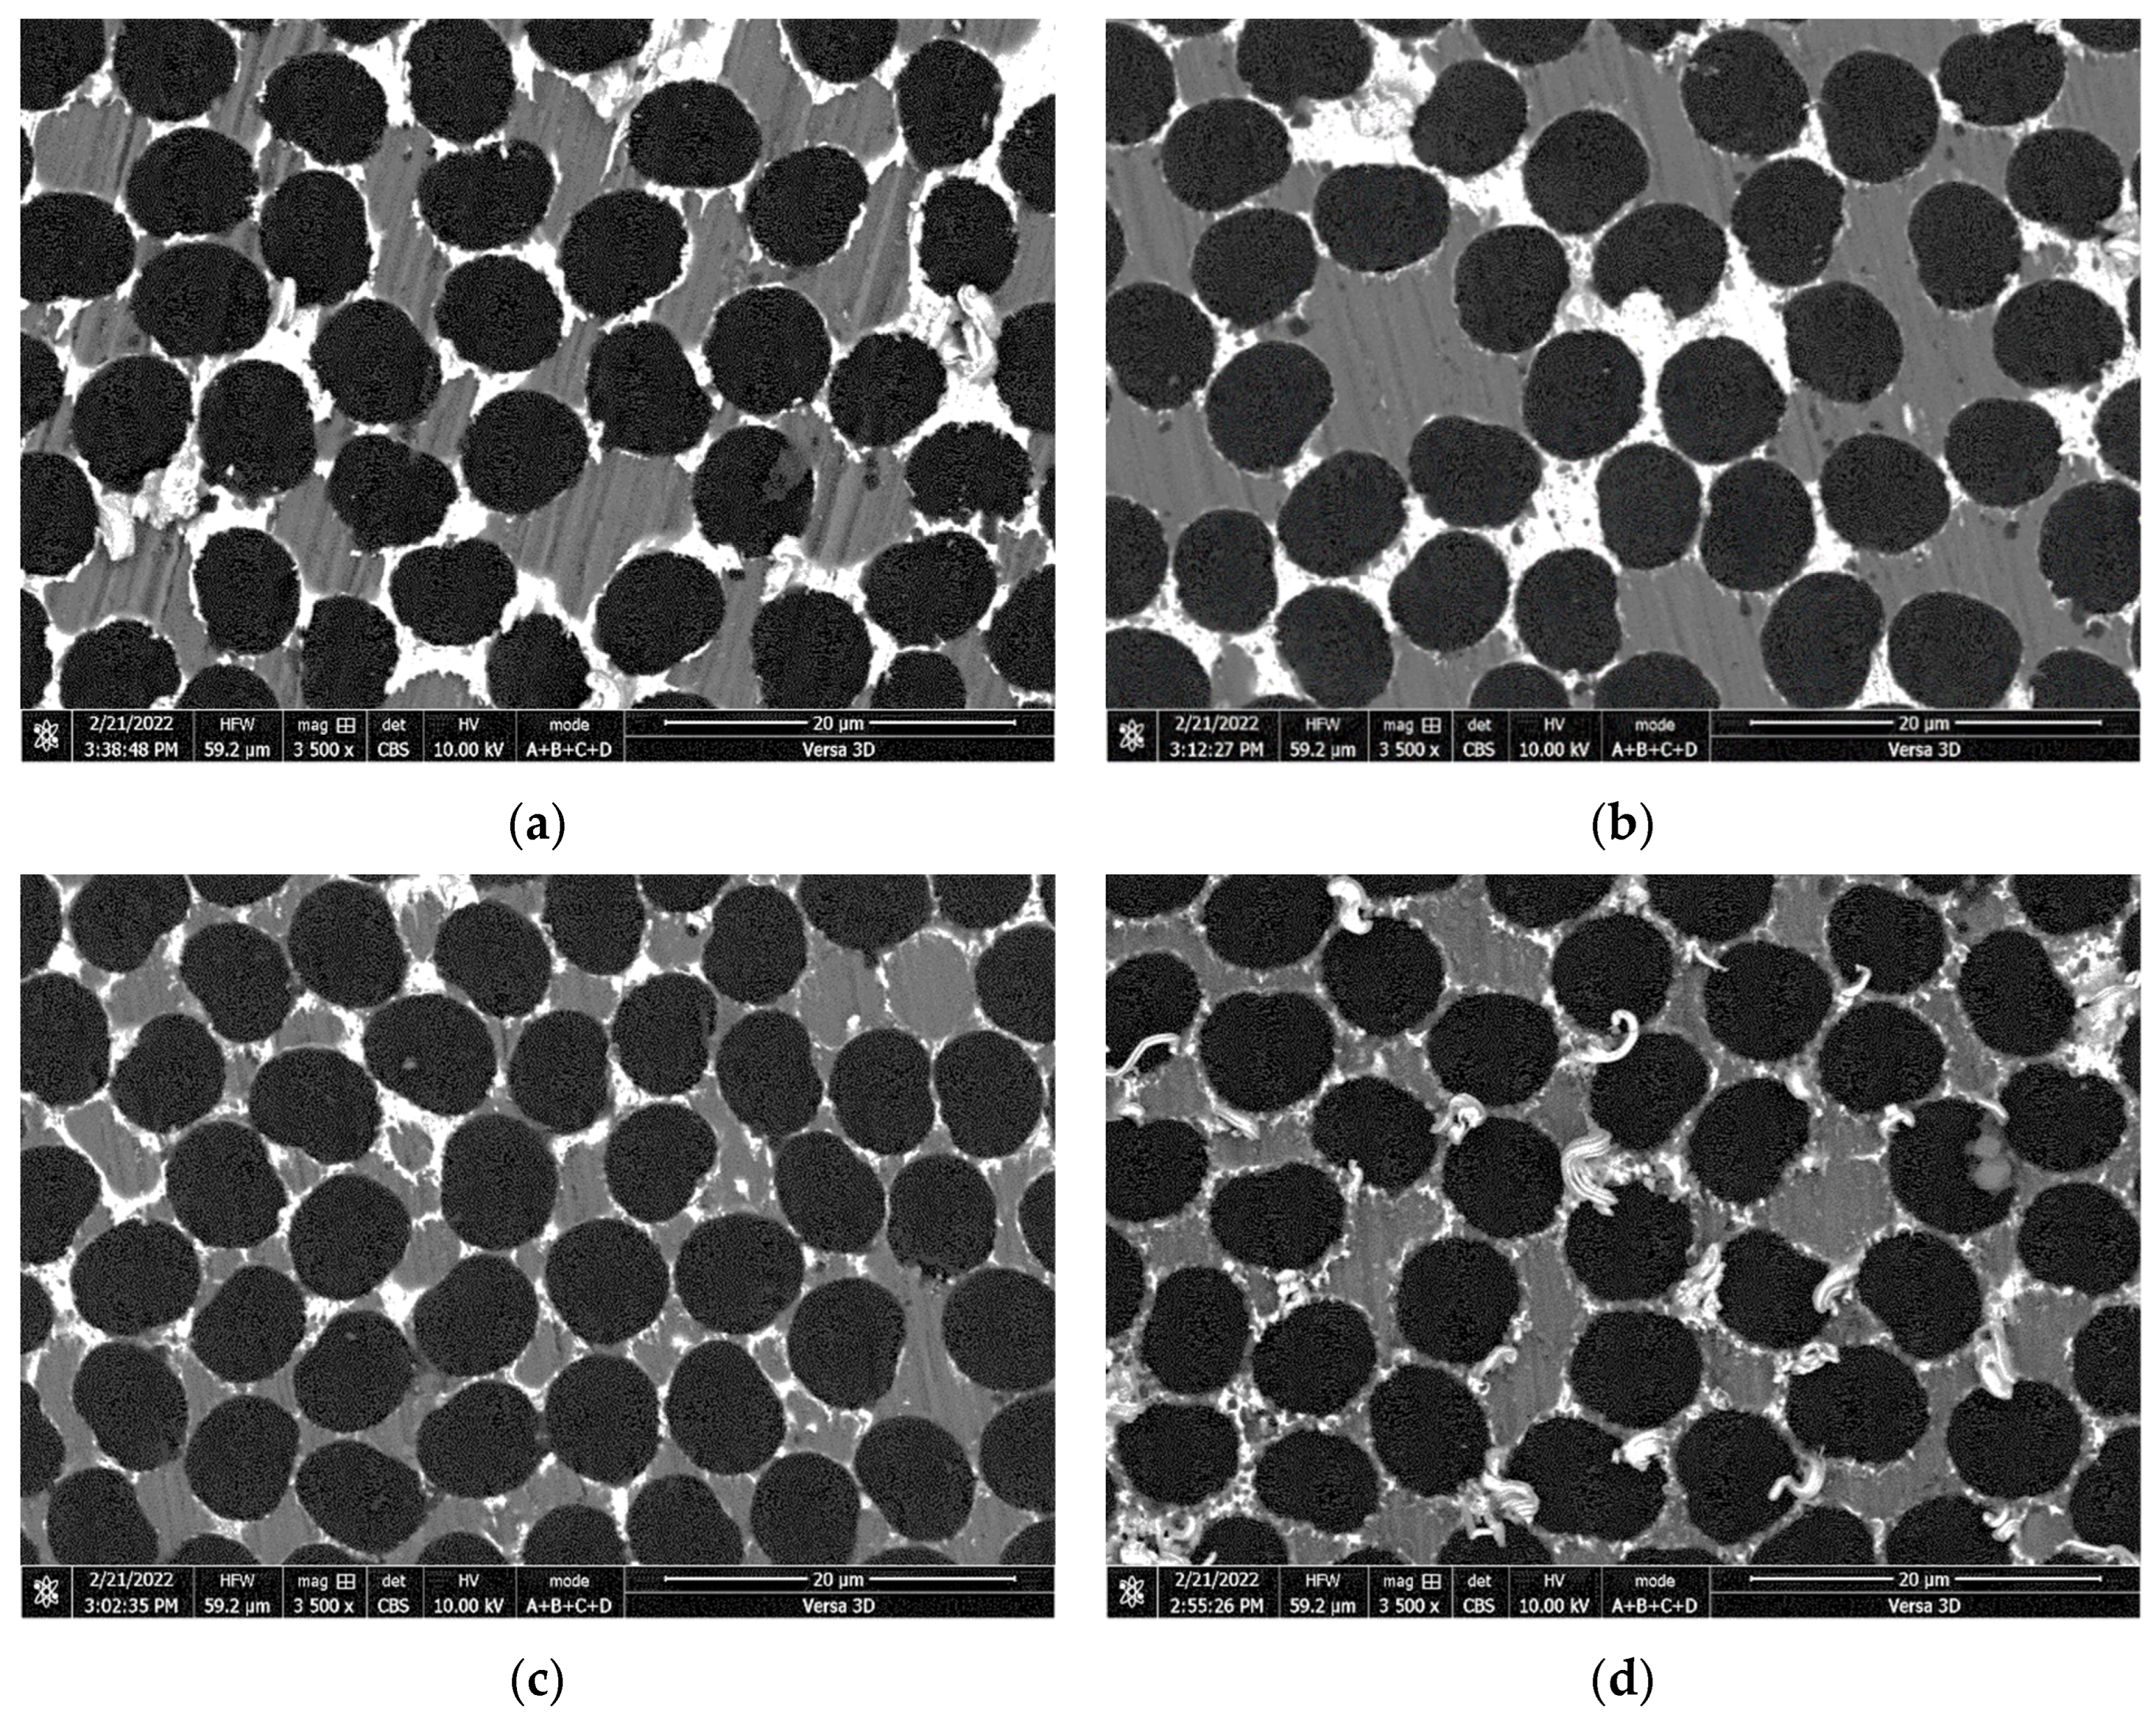
The microstructure of the composite wire in an initial state and after heat treatment is shown in Figure 1.
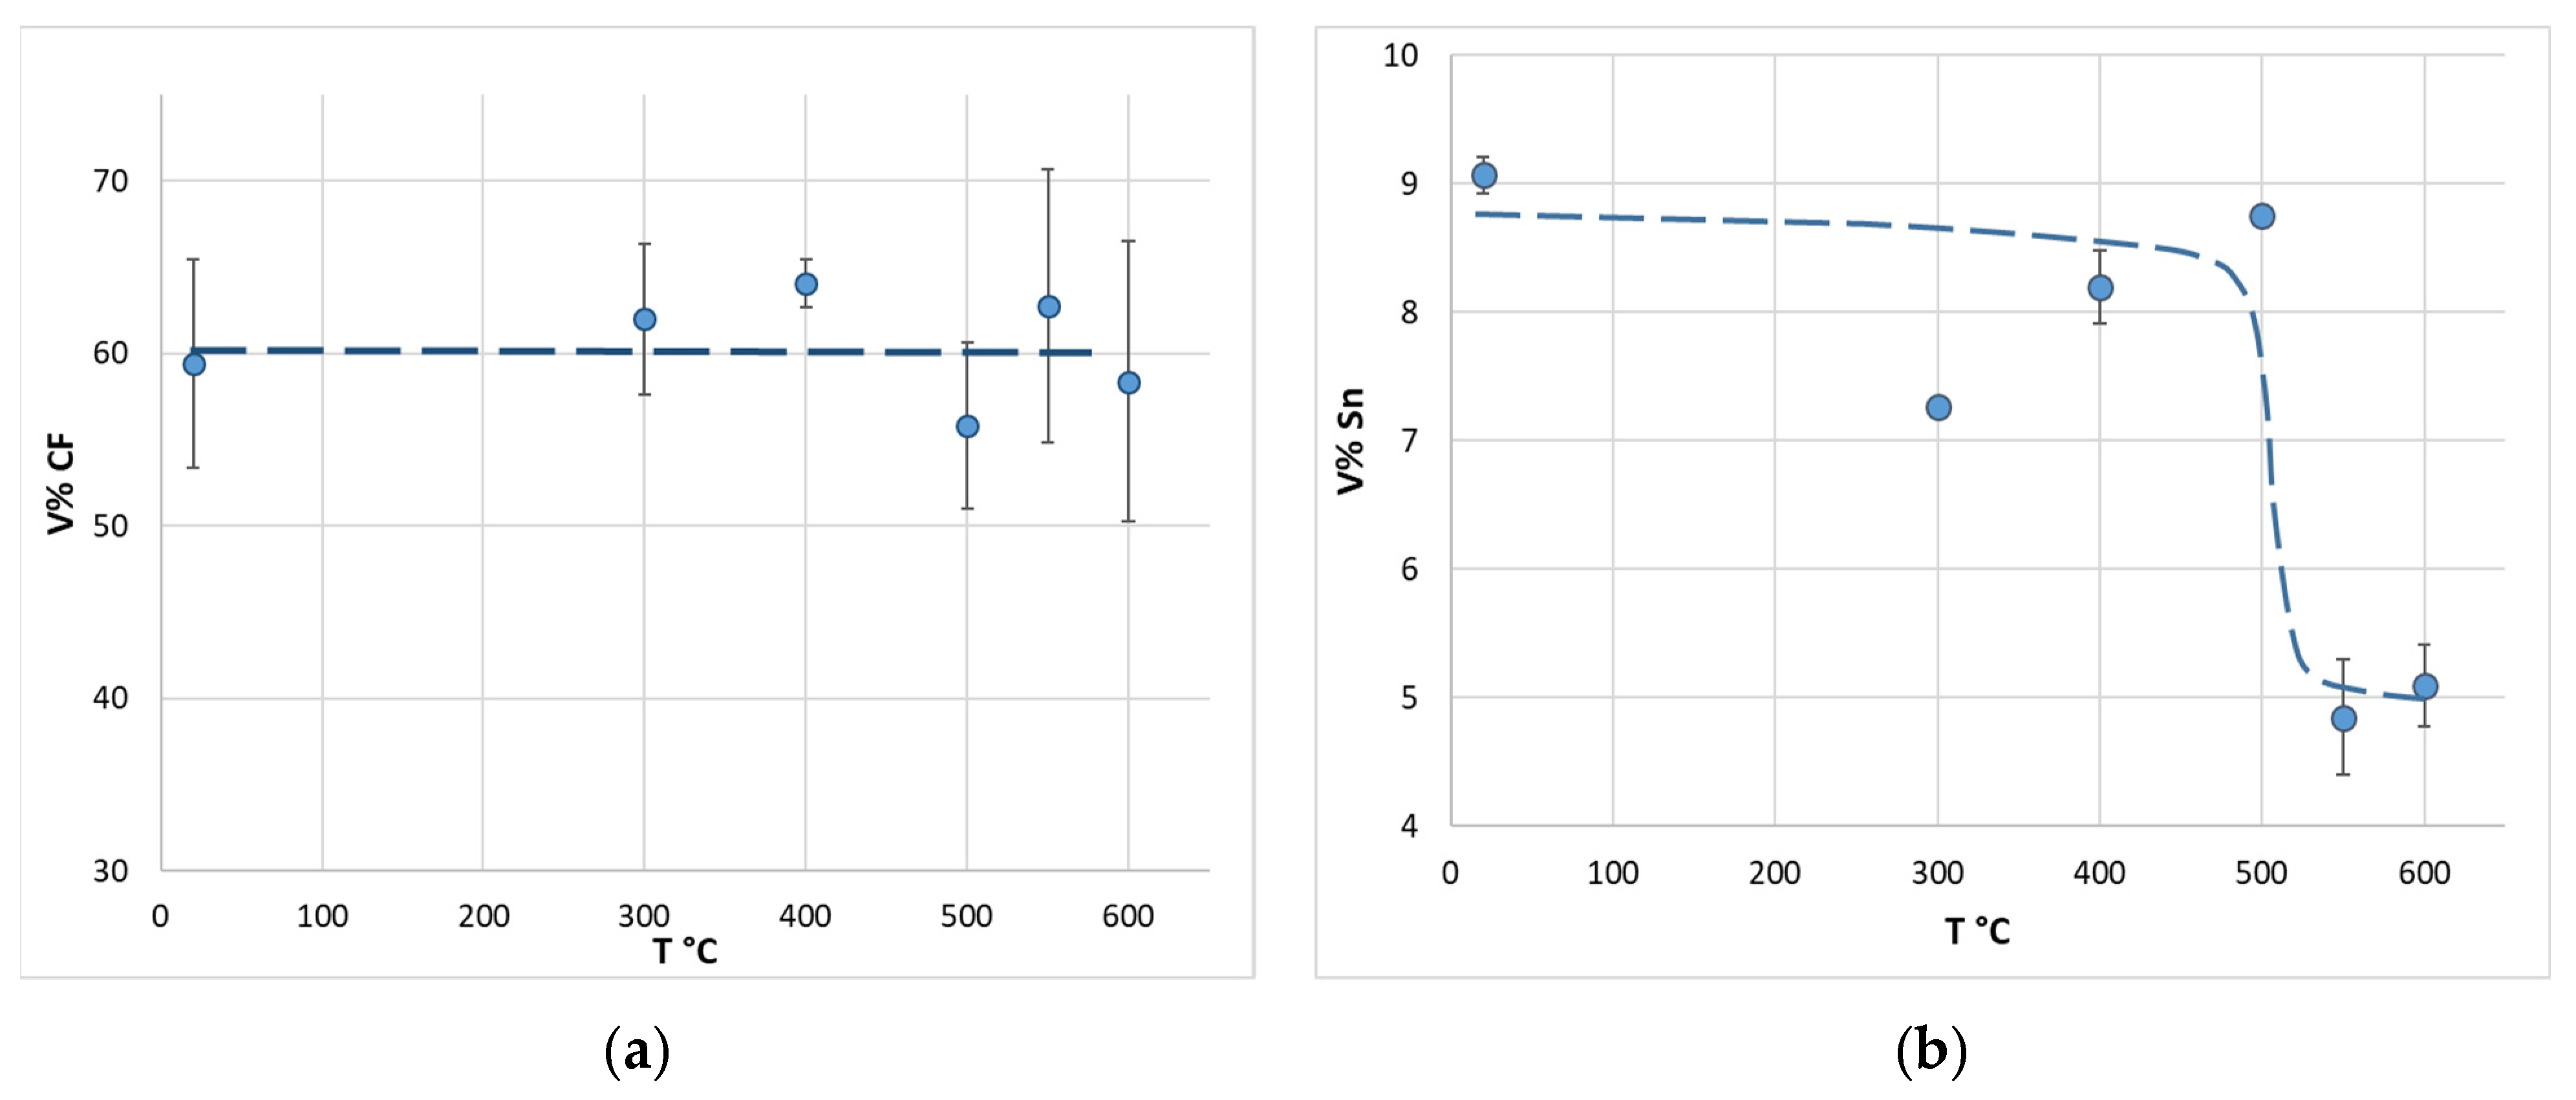
The microstructure of the composite consists of three structural components: aluminum, tin, and carbon fiber. According to the images of the microstructure of transverse sections, the carbon fiber almost did not change; its volume fraction almost did not change either, being in the range of 60 ± 5%. The change in the volume fraction of the carbon fiber is illustrated in Figure 2a.
The tin structural component is located mainly between aluminum inclusions and individual carbon fiber filaments. Its volume fraction at a heat-treatment temperature of up to 500 °C, inclusive, almost did not change and was in the range of 8 ± 1%. At 550 °C, a decrease in the average value of this parameter to 5 ± 0.5% was observed.
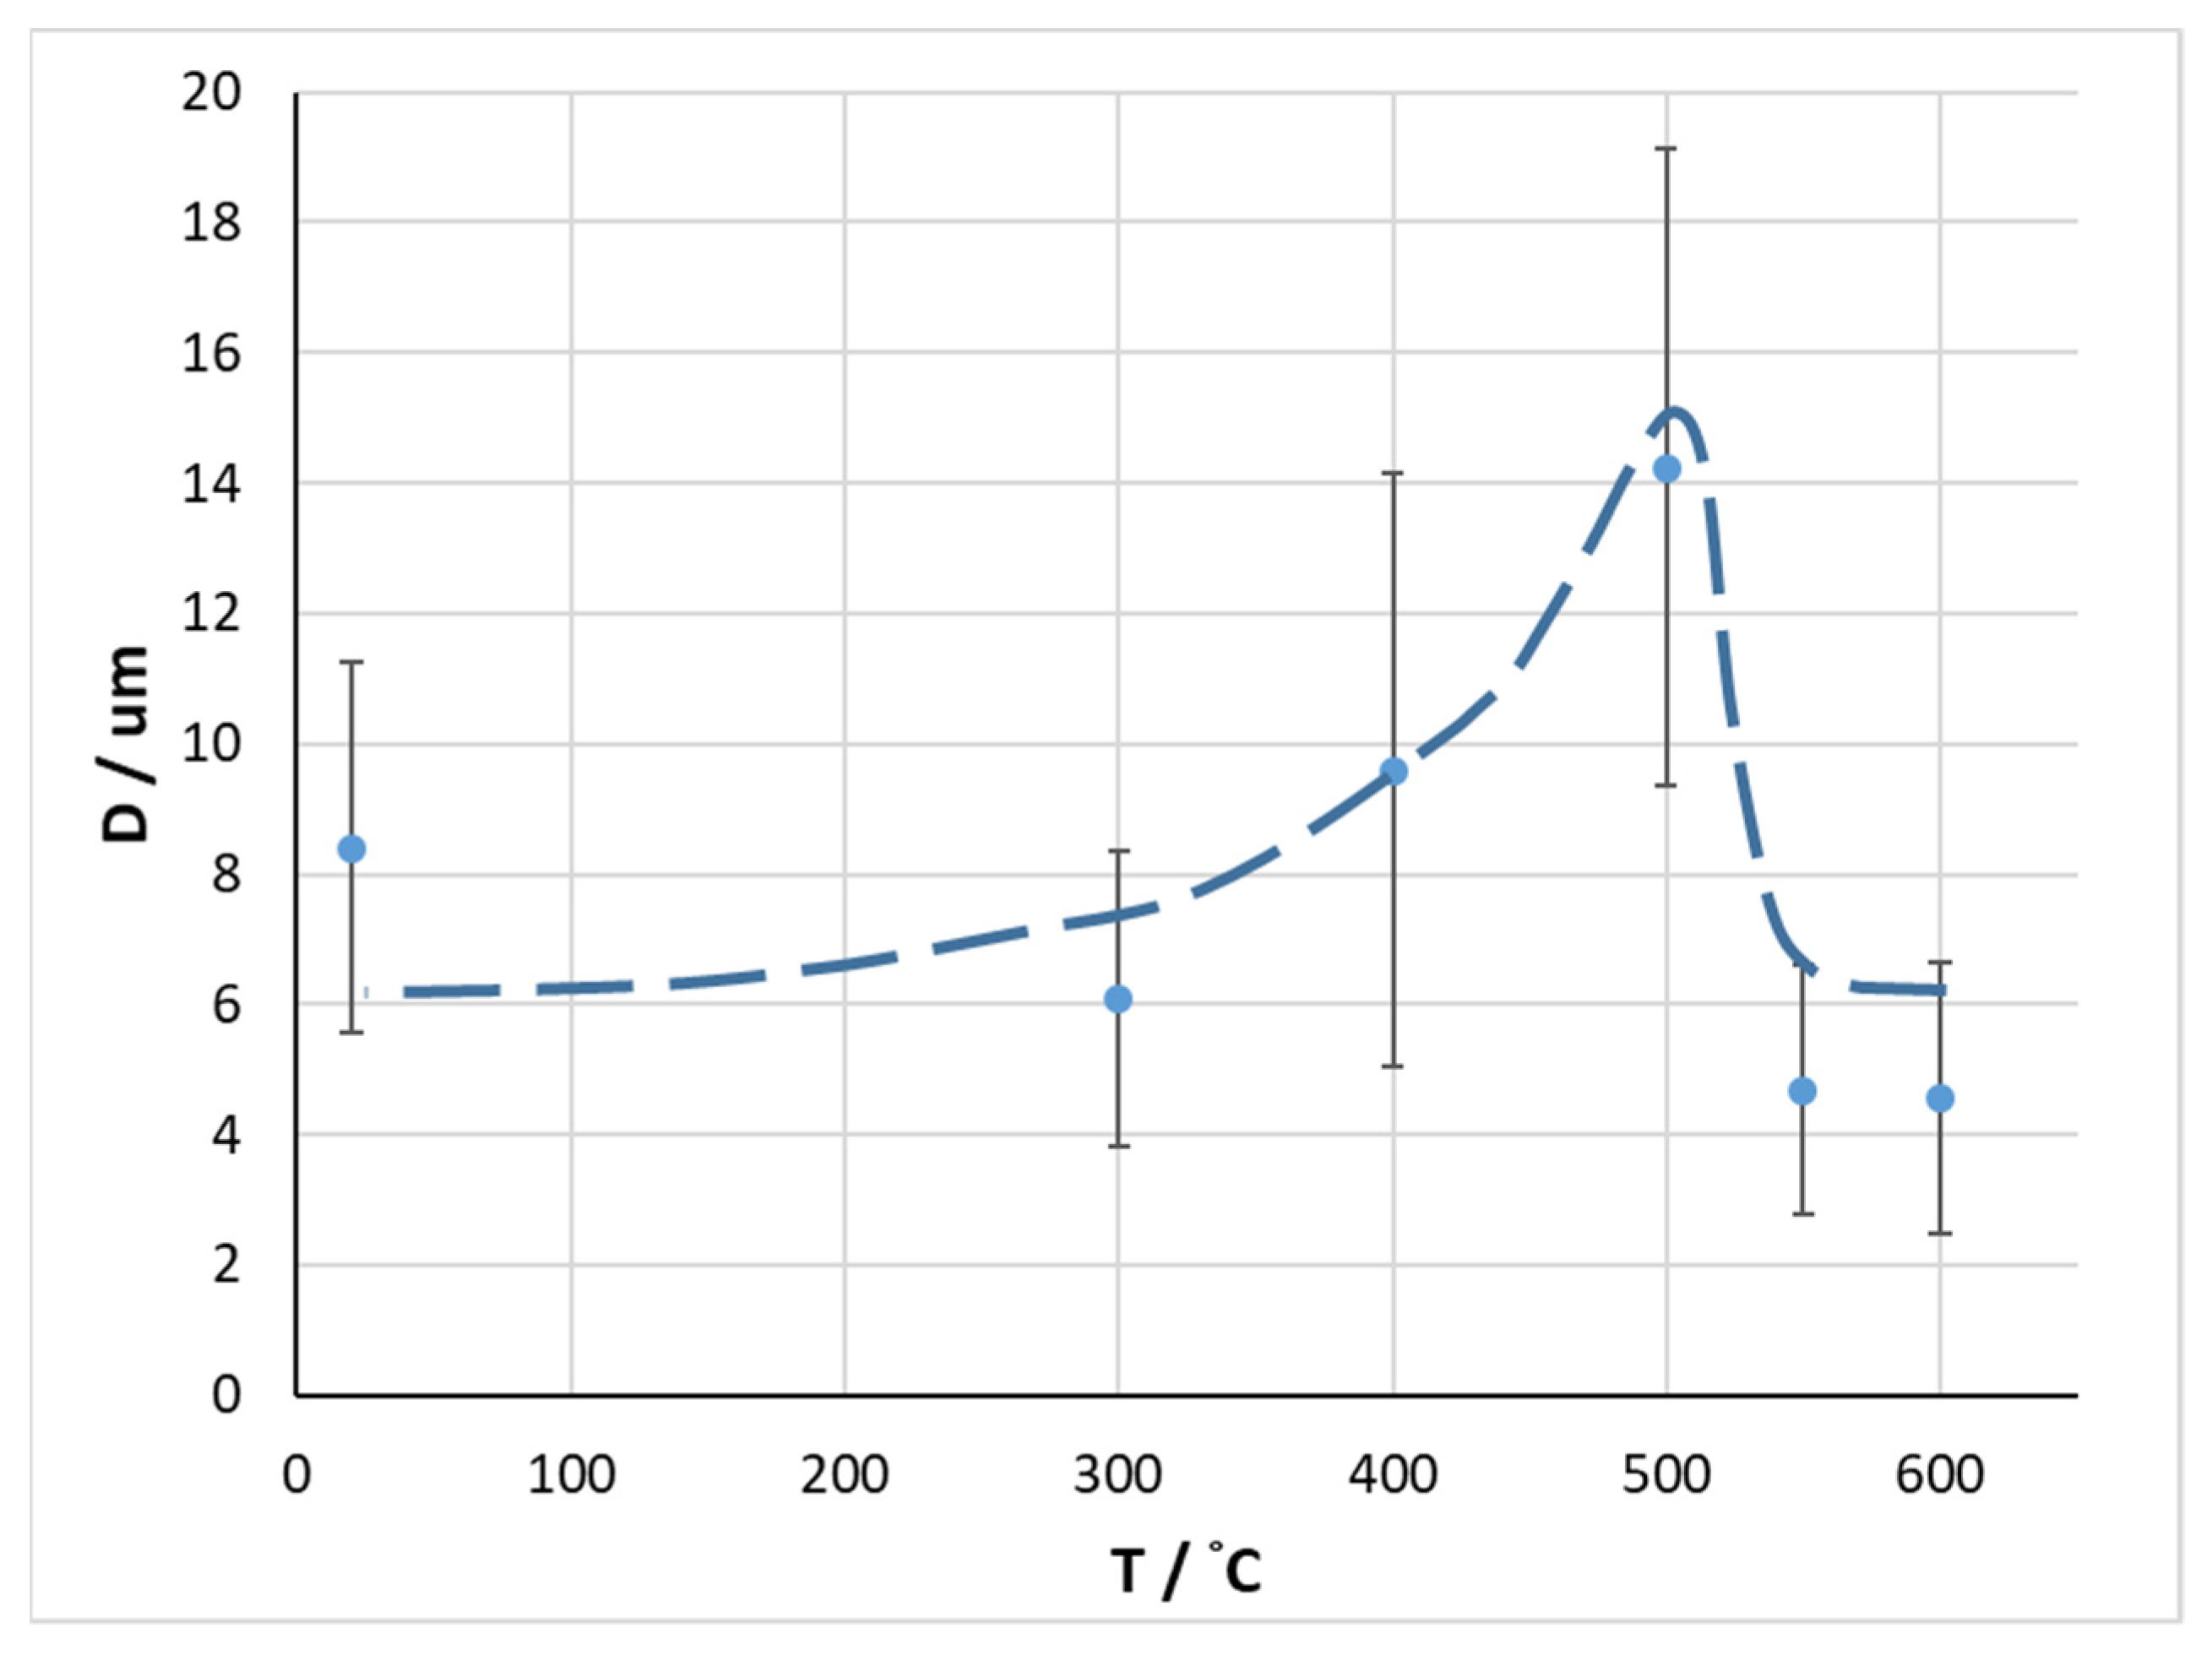
The volume fraction of aluminum inclusions did not depend on the treatment temperature; the average value was 32 ± 12%. However, with an increase in the heat-treatment temperature up to 500 °C, inclusive, there was a monotonic increase in the average size of aluminum inclusions from 7 to 14 µm. At a heat-treatment temperature above 550 °C, inclusive, the average inclusion size decreased to 5 µm. The dependence of the size of aluminum inclusions on the heat-treatment temperature is shown in Figure 3.
3.2. Fiber Surface
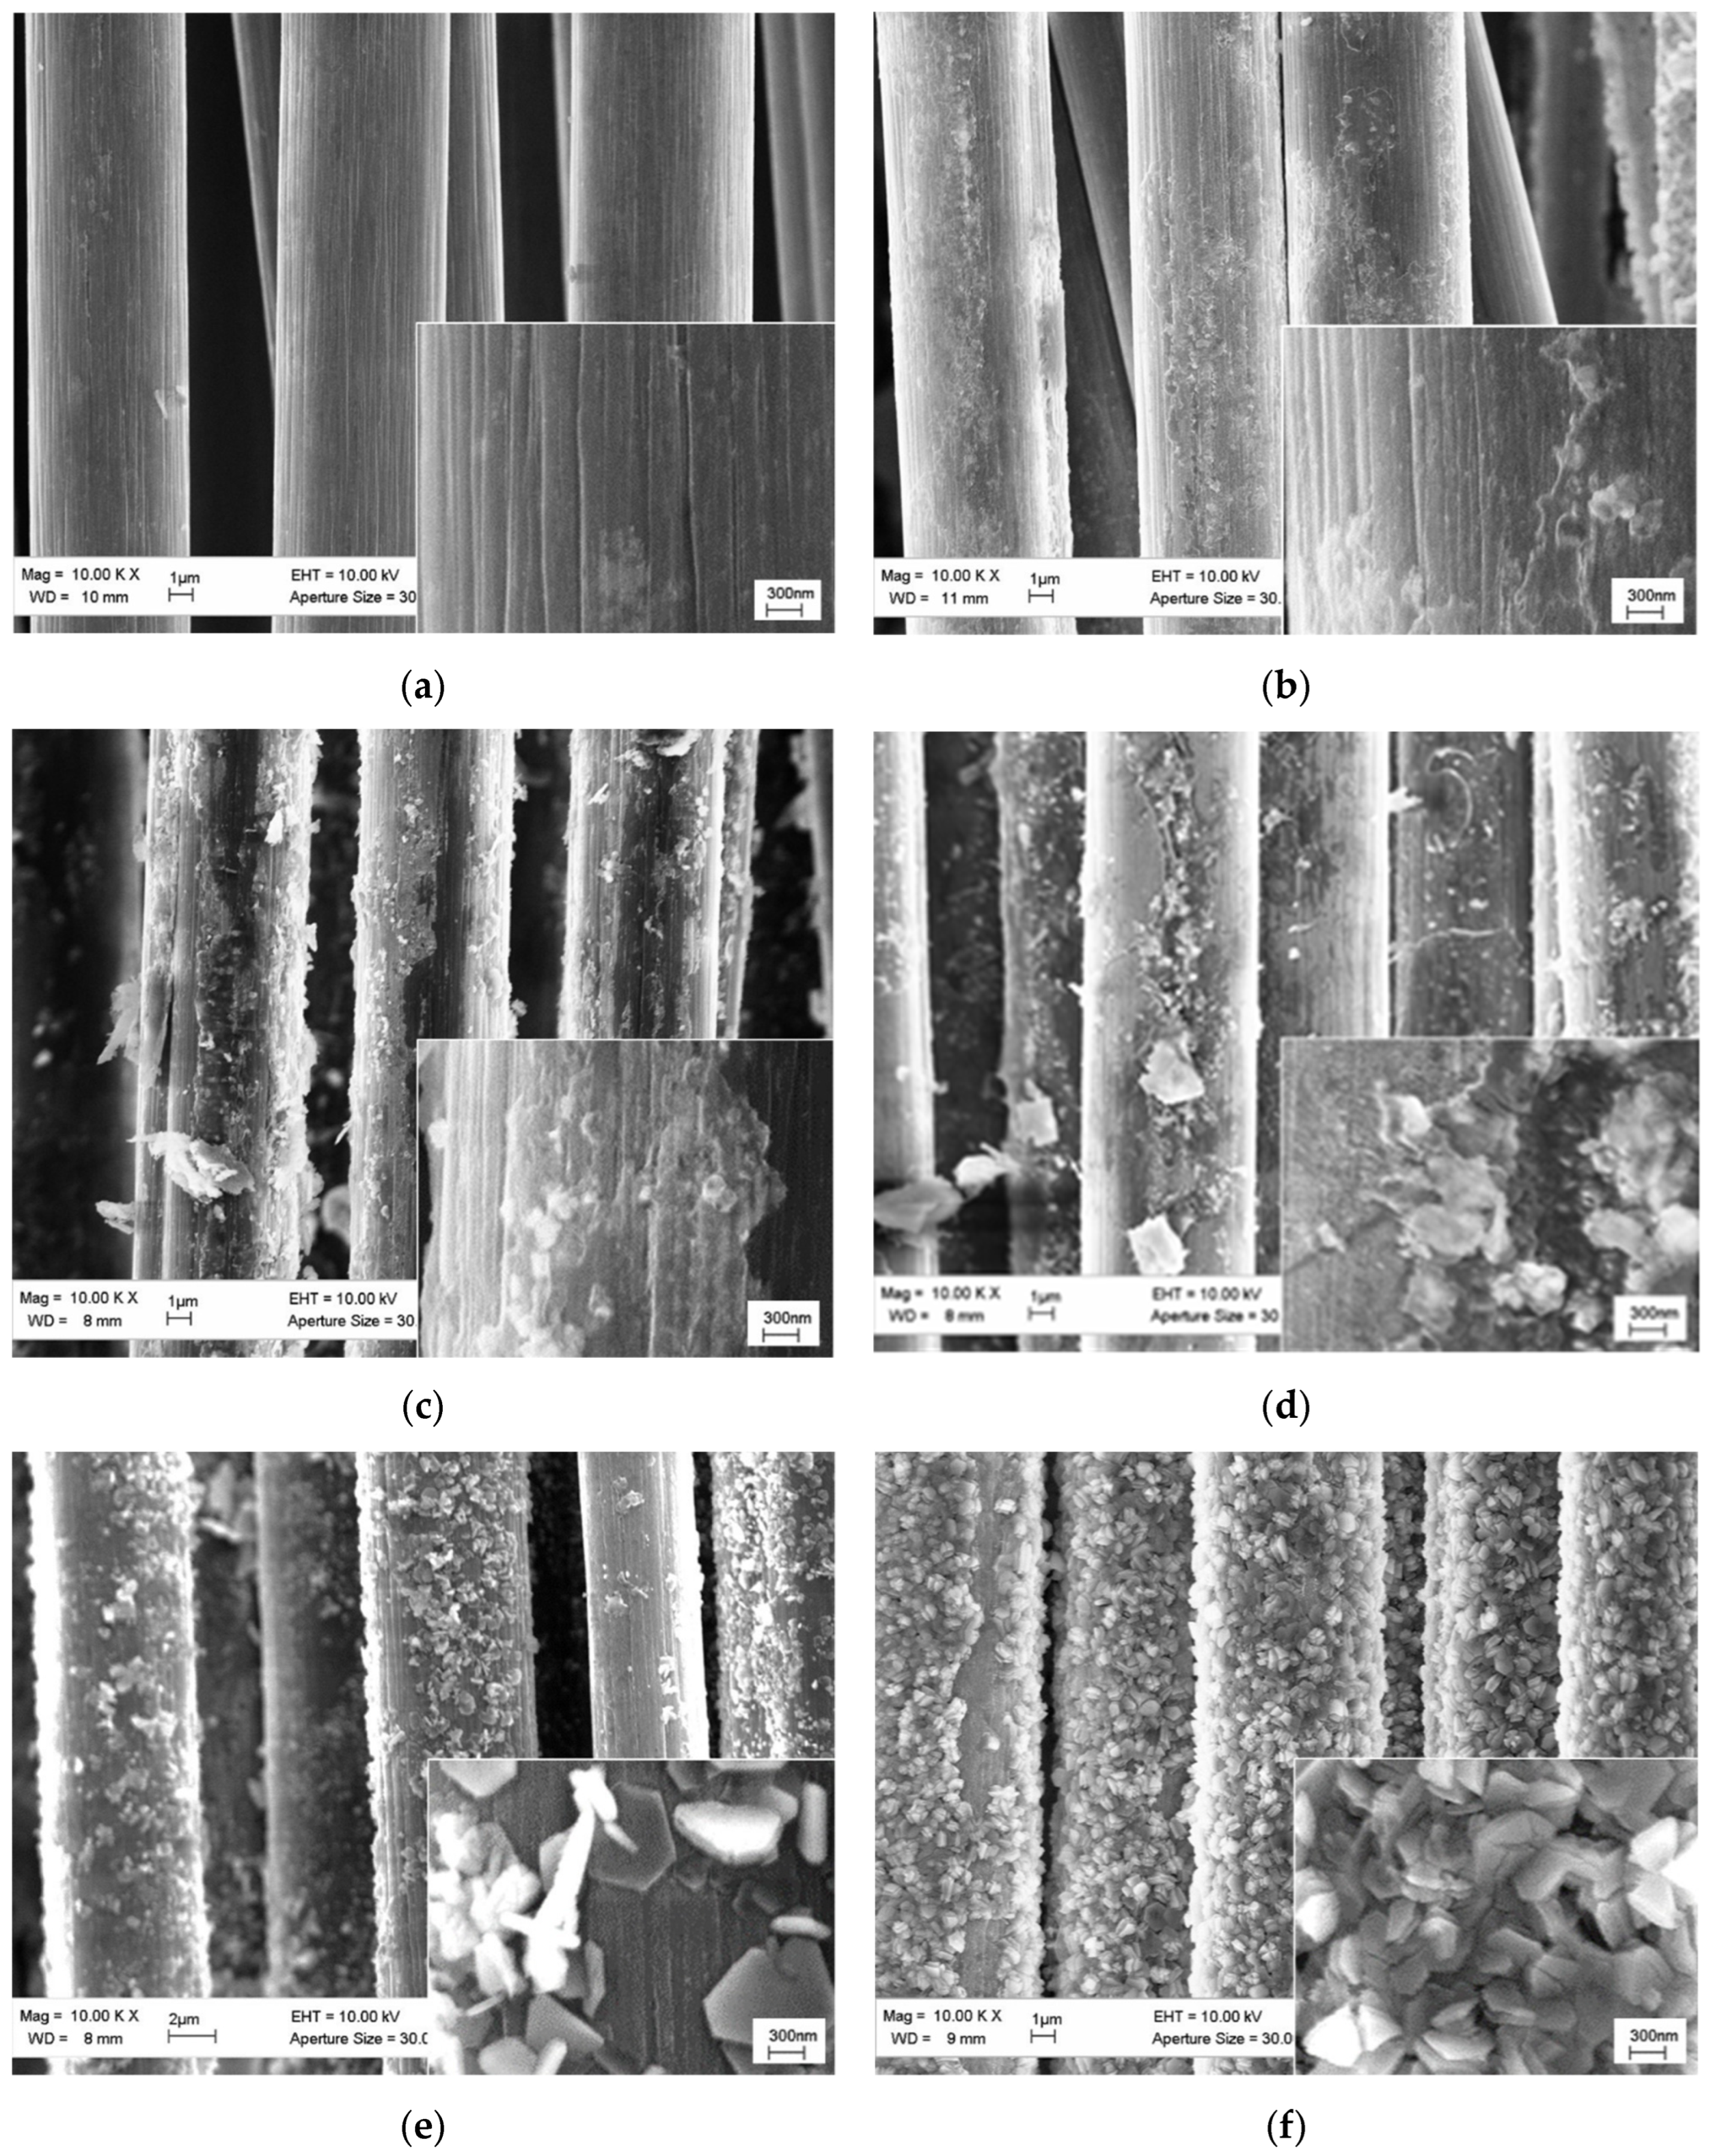
Images of the carbon fiber surface after the extraction from the matrix of the composite in an initial state and after heat treatment at different temperatures are presented in Figure 4. The fiber from the composite, not subjected to heat treatment, almost did not differ from the fiber in the delivered state. The fiber from the composite treated at 300 °C had a rougher surface. After treatment at 400 °C, small crystals could be seen on the fiber surface, the size and number of which increased as the treatment temperature increased. At 600 °C, almost the entire surface of the fiber was covered with large crystals.
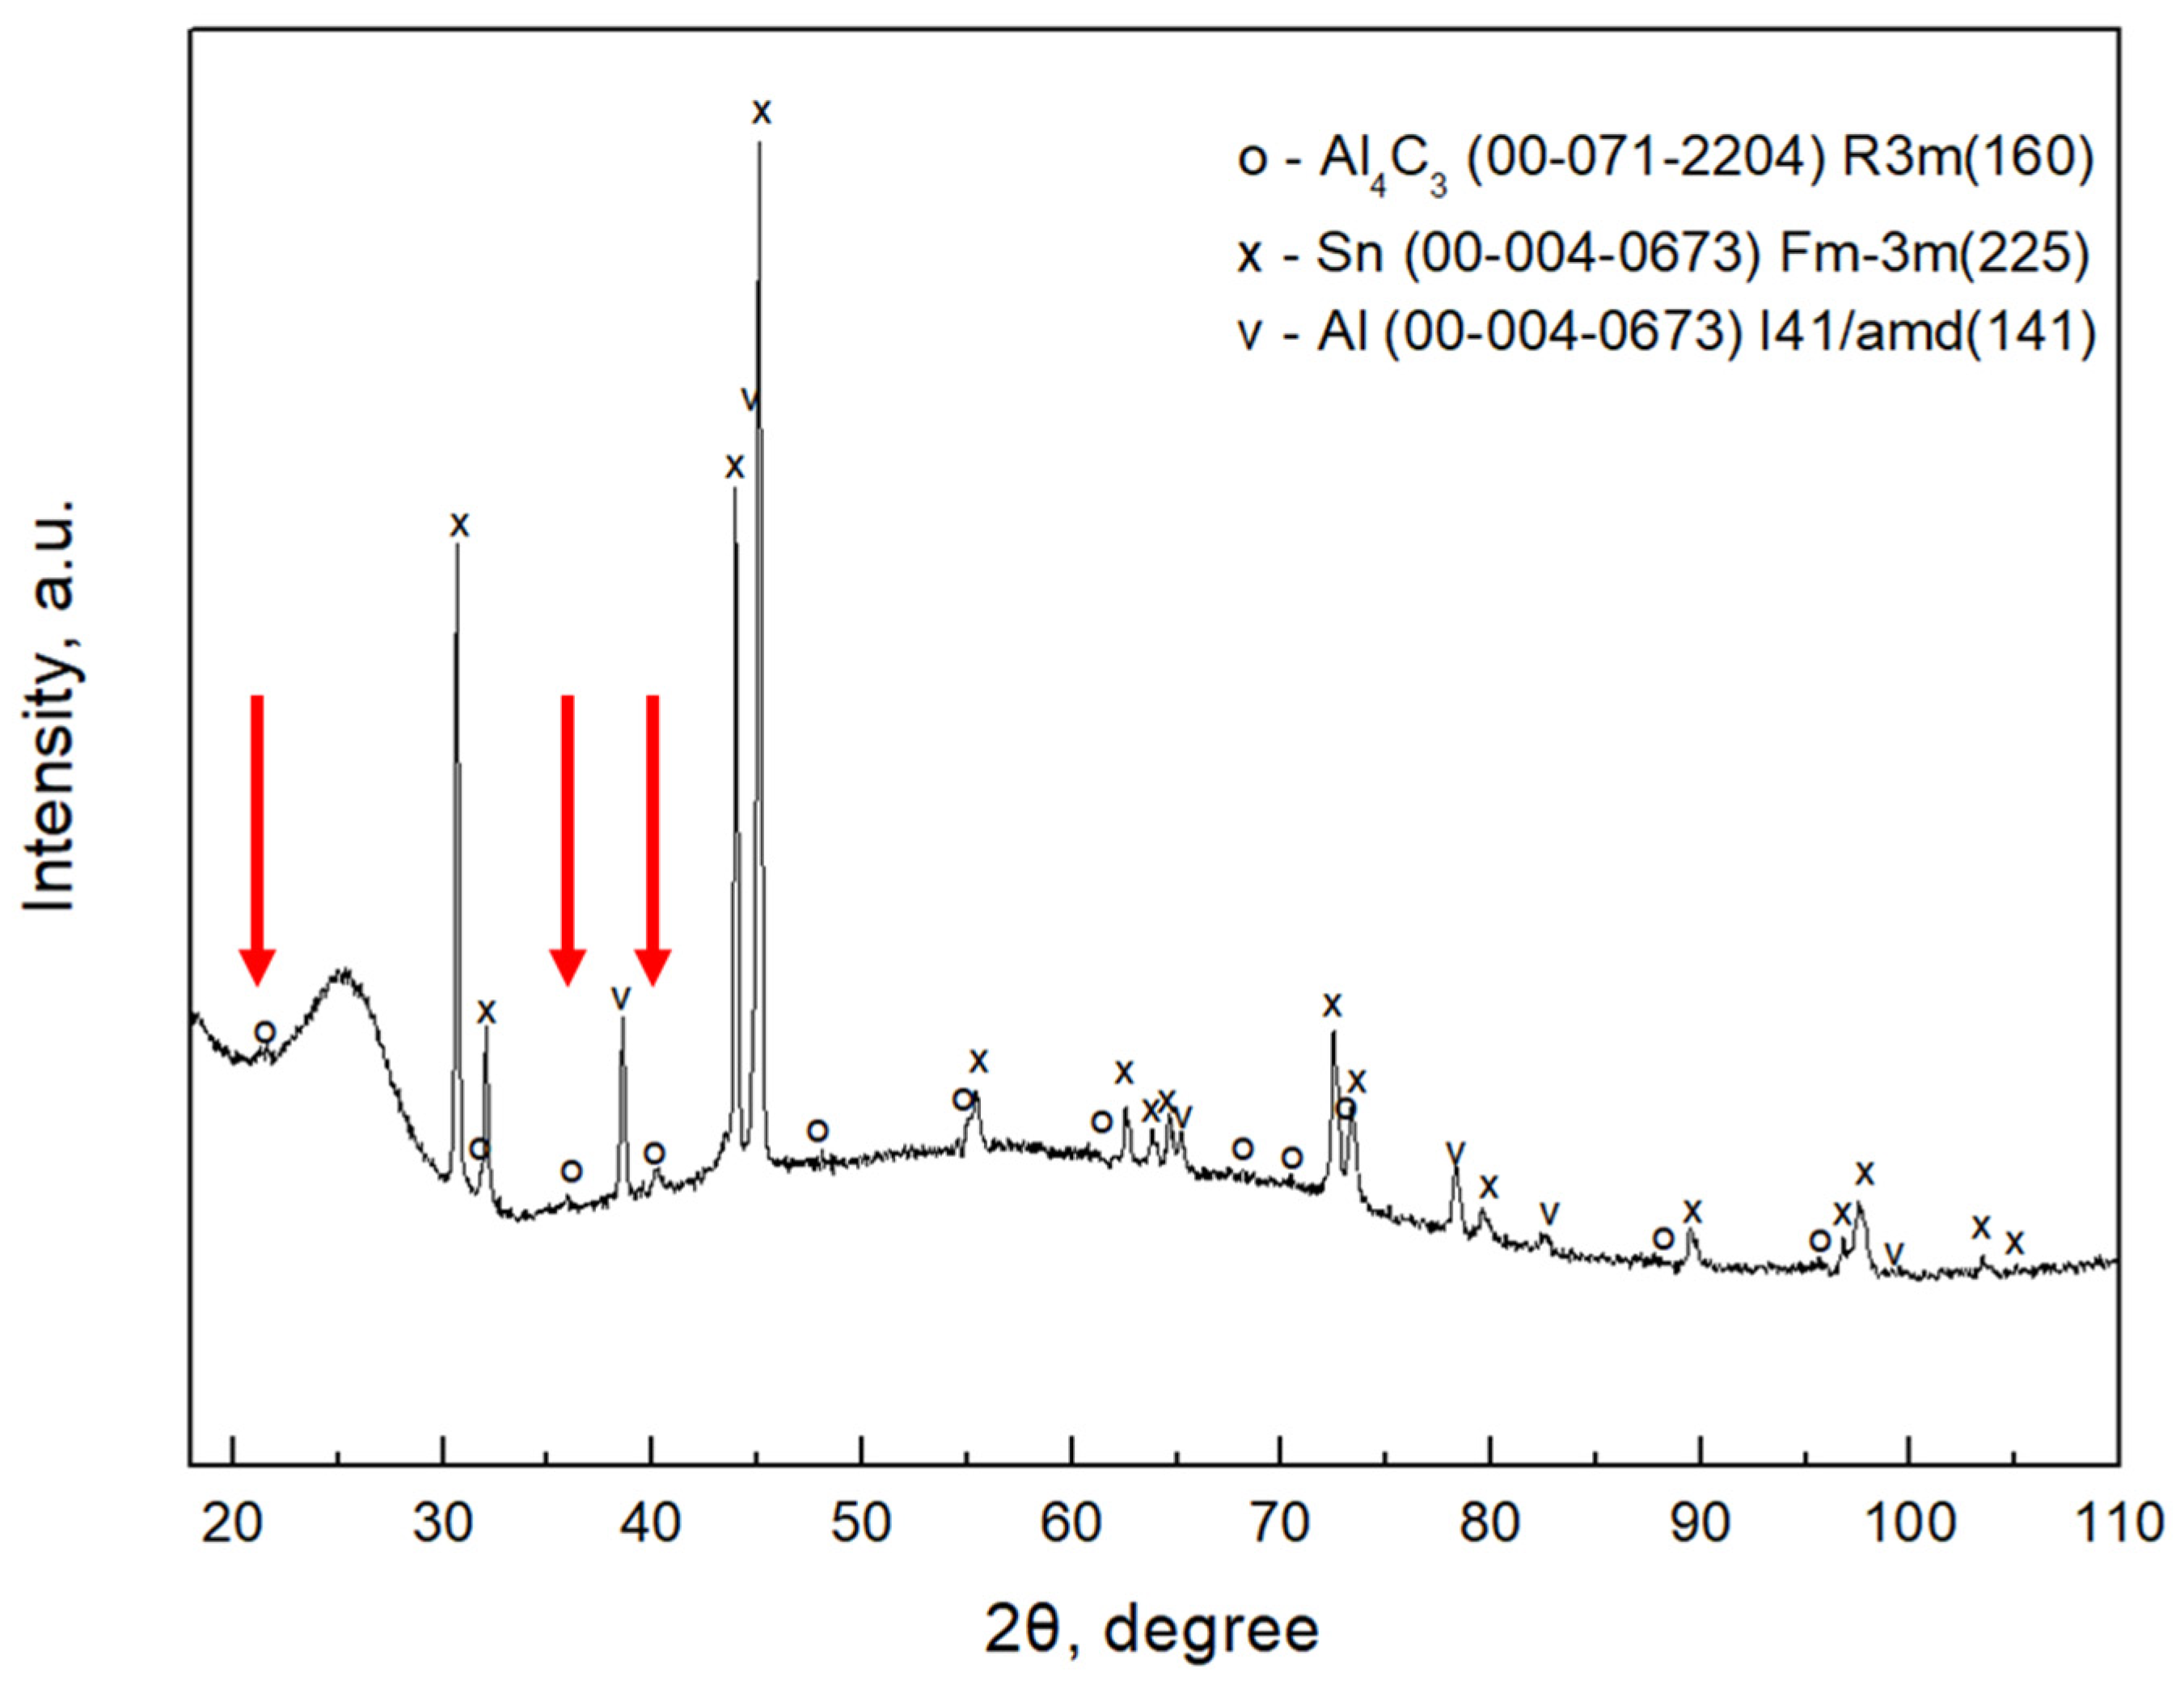
In the X-ray diffraction pattern for the fiber (Figure 5) extracted from the composite after heat treatment at 600 °C, in addition to a halo of amorphous carbon and peaks of residual aluminum and tin, there were peaks of trigonal aluminum carbide (marked with red arrows). These confirmed that the crystals observed on the fiber surface were aluminum carbide crystals.
3.3. Strength and the Fracture Energy
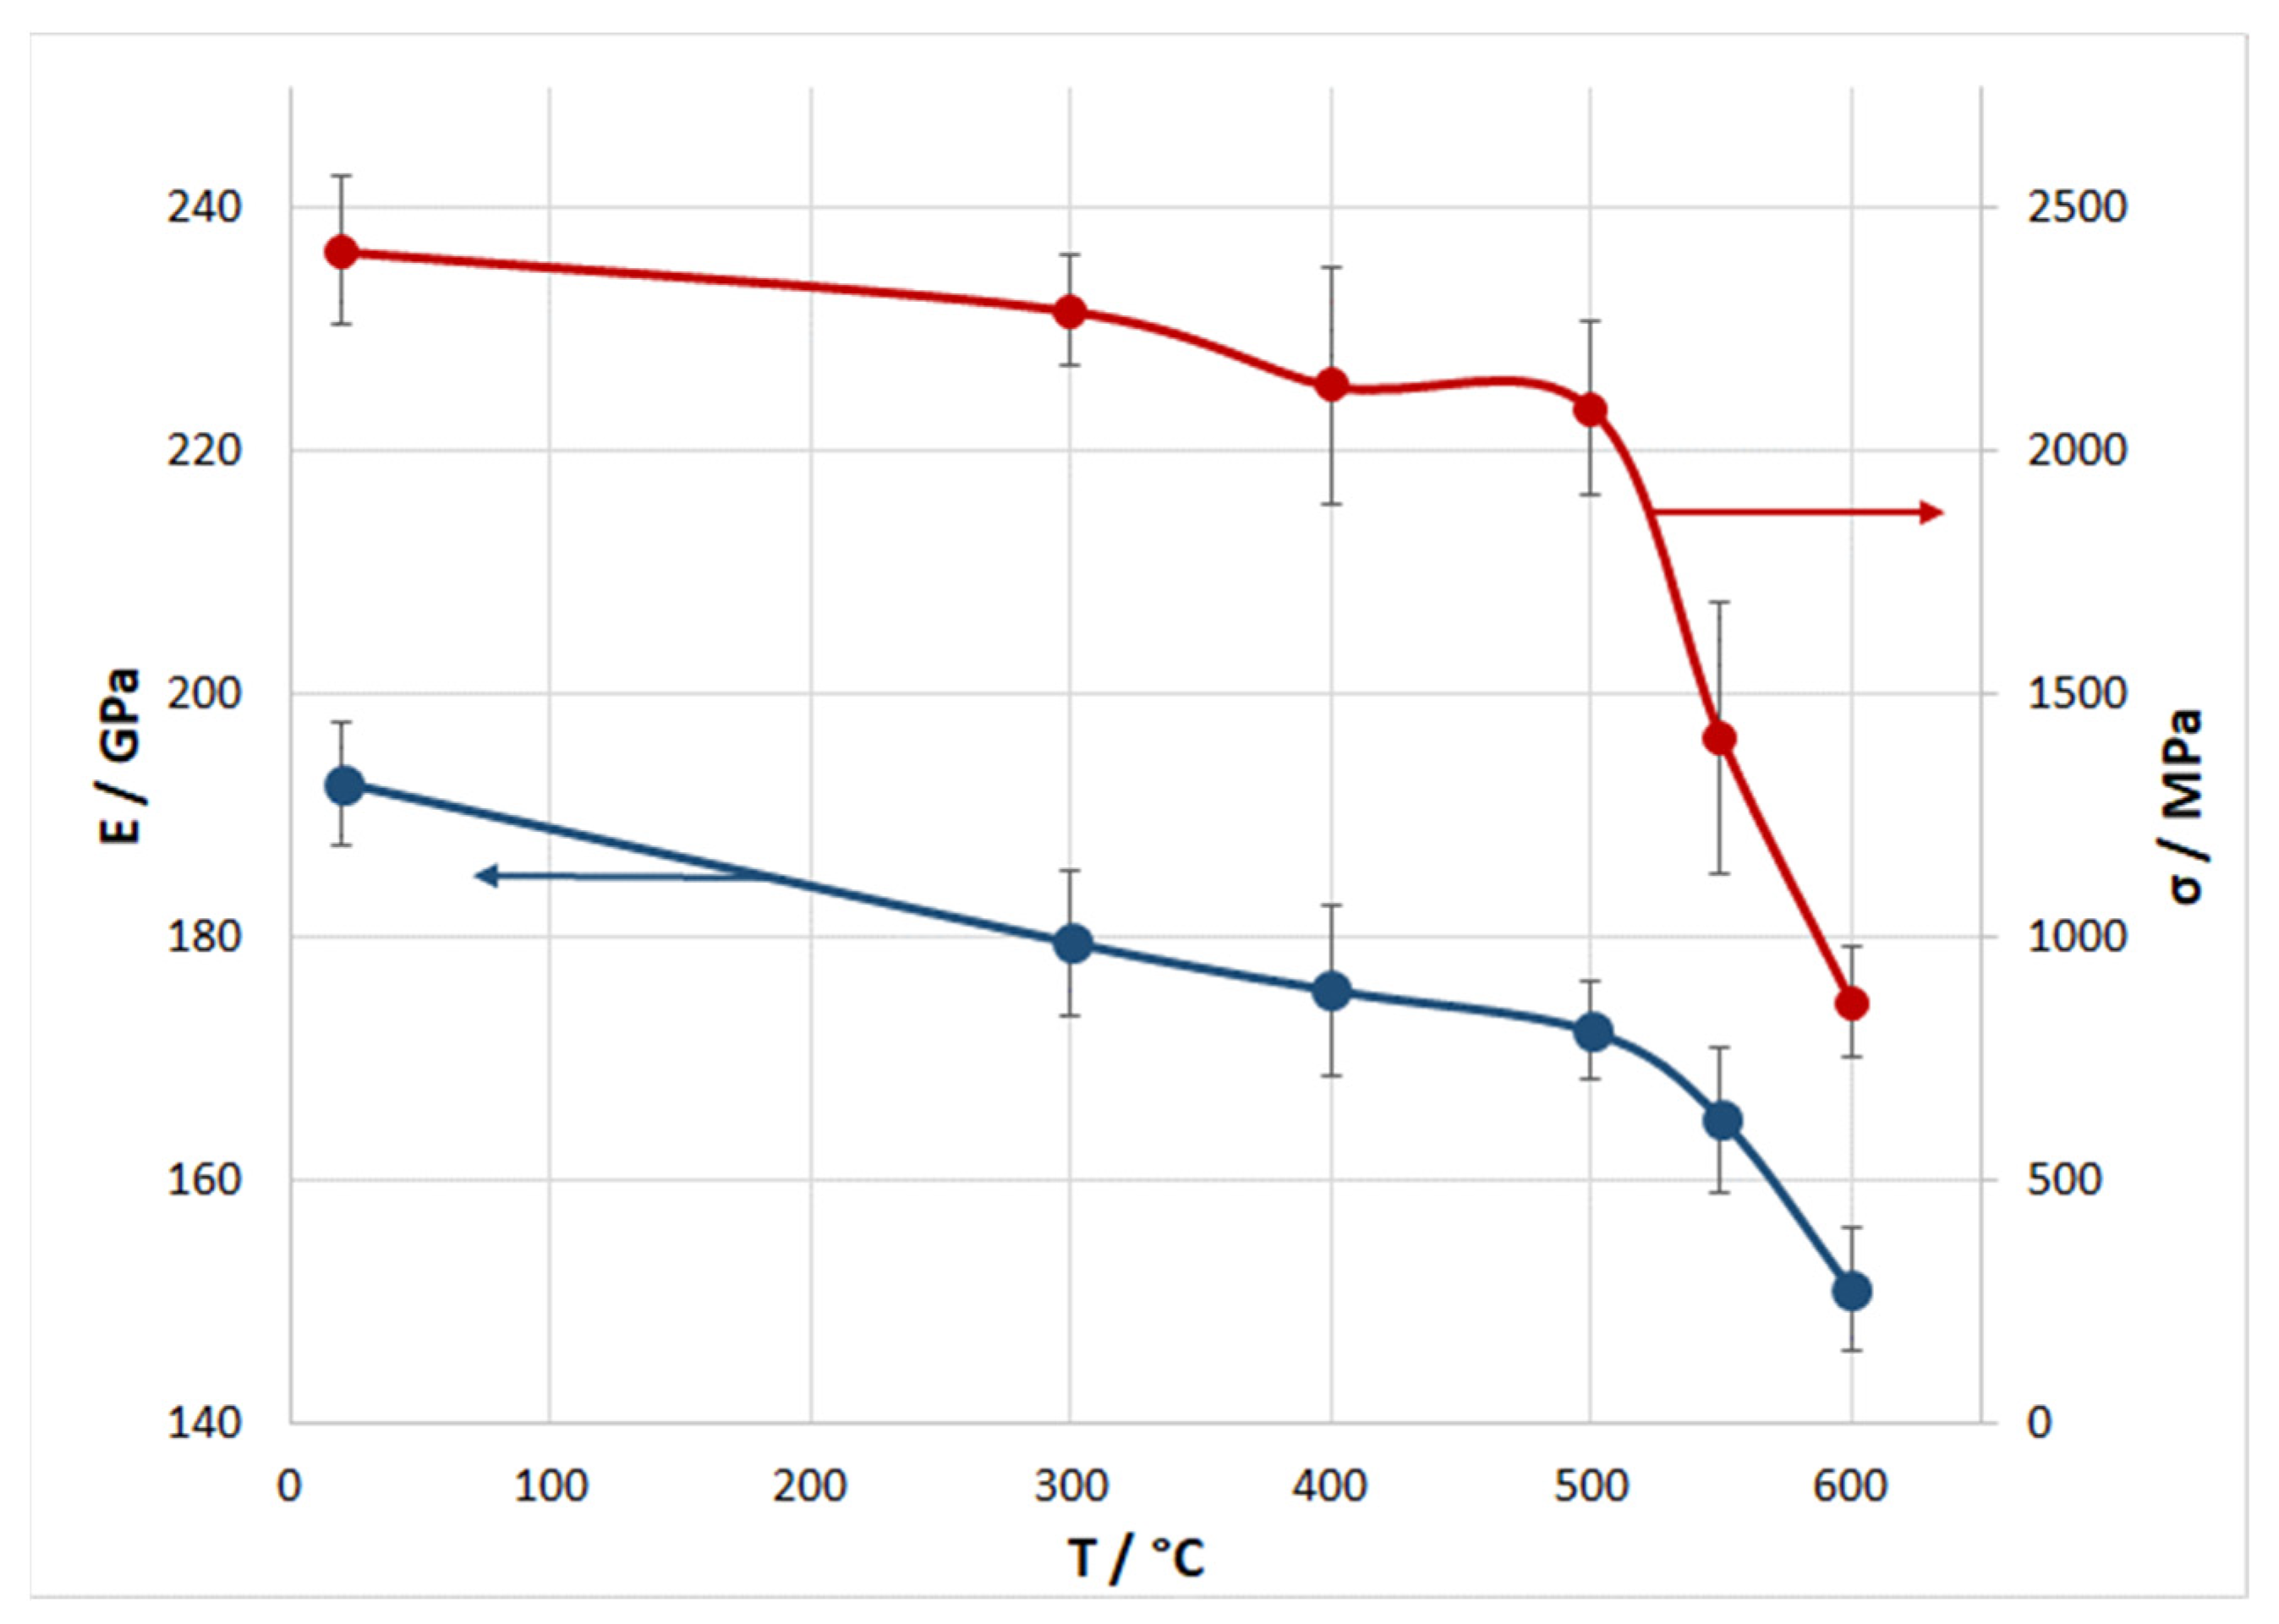
The dependence of the strength and elastic modulus of the composite wire at three-point bending on the heat-treatment temperature is shown in Figure 6.
The average strength of the composite wire in an initial state was 2450 MPa. Heat treatment led to a decrease in the strength. With an increase in the temperature up to 500 °C, inclusive, the strength decreased monotonically to 2250 MPa. The subsequent increase in temperature led to a significant drop in the strength. After treatment at 600 °C, the average strength of the wire was 860 MPa. Along with the strength, as the treatment temperature increased, the flexural modulus also decreased from 190 to 150 GPa.
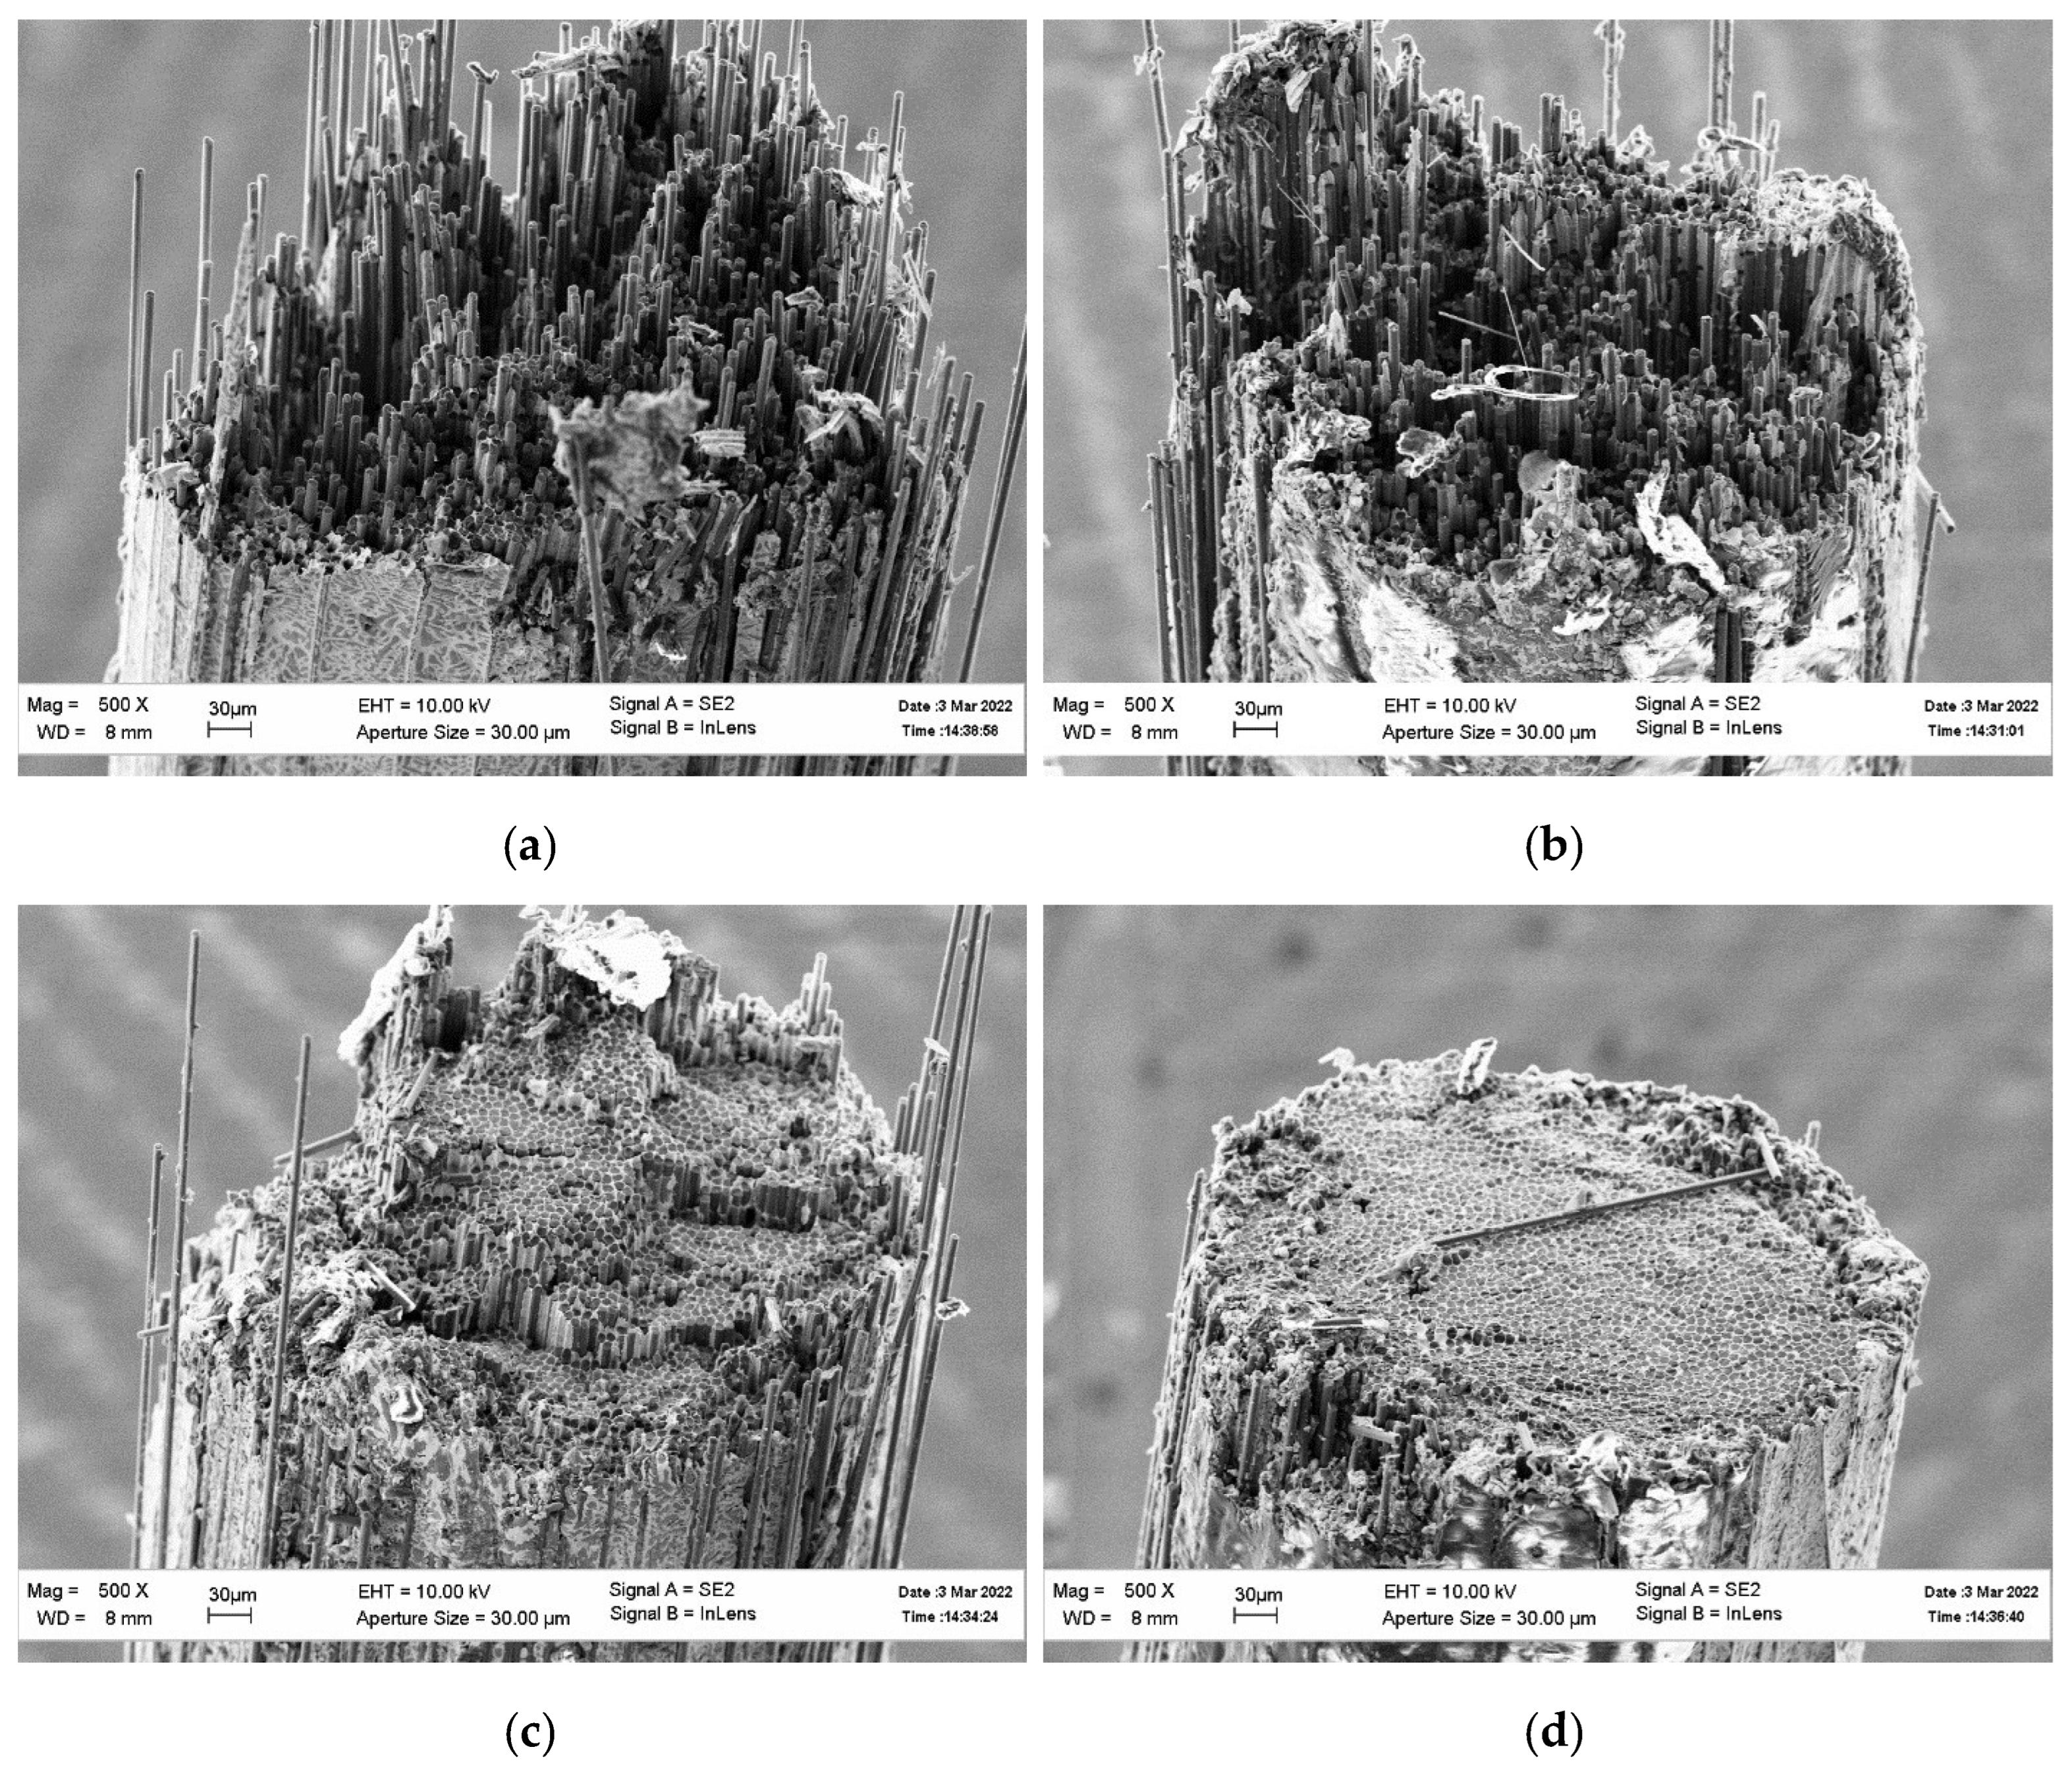
The dependence of the composite wire strength on the treatment temperature was in good agreement with the results obtained in the study of the fracture surfaces, which are shown in Figure 7. In an initial state and after heat treatment at temperatures up to 500 °C, inclusive, the fracture surfaces of the composite wire had a similar appearance. They showed developed relief and the presence of individual pulled-out fibers. At 550 °C, the fracture surface became much less prominent and consisted of several stepped, flat sections; there were almost no individual pulled-out fibers. At 600 °C, the fracture occurred in one plane; there were no pulled-out fibers.
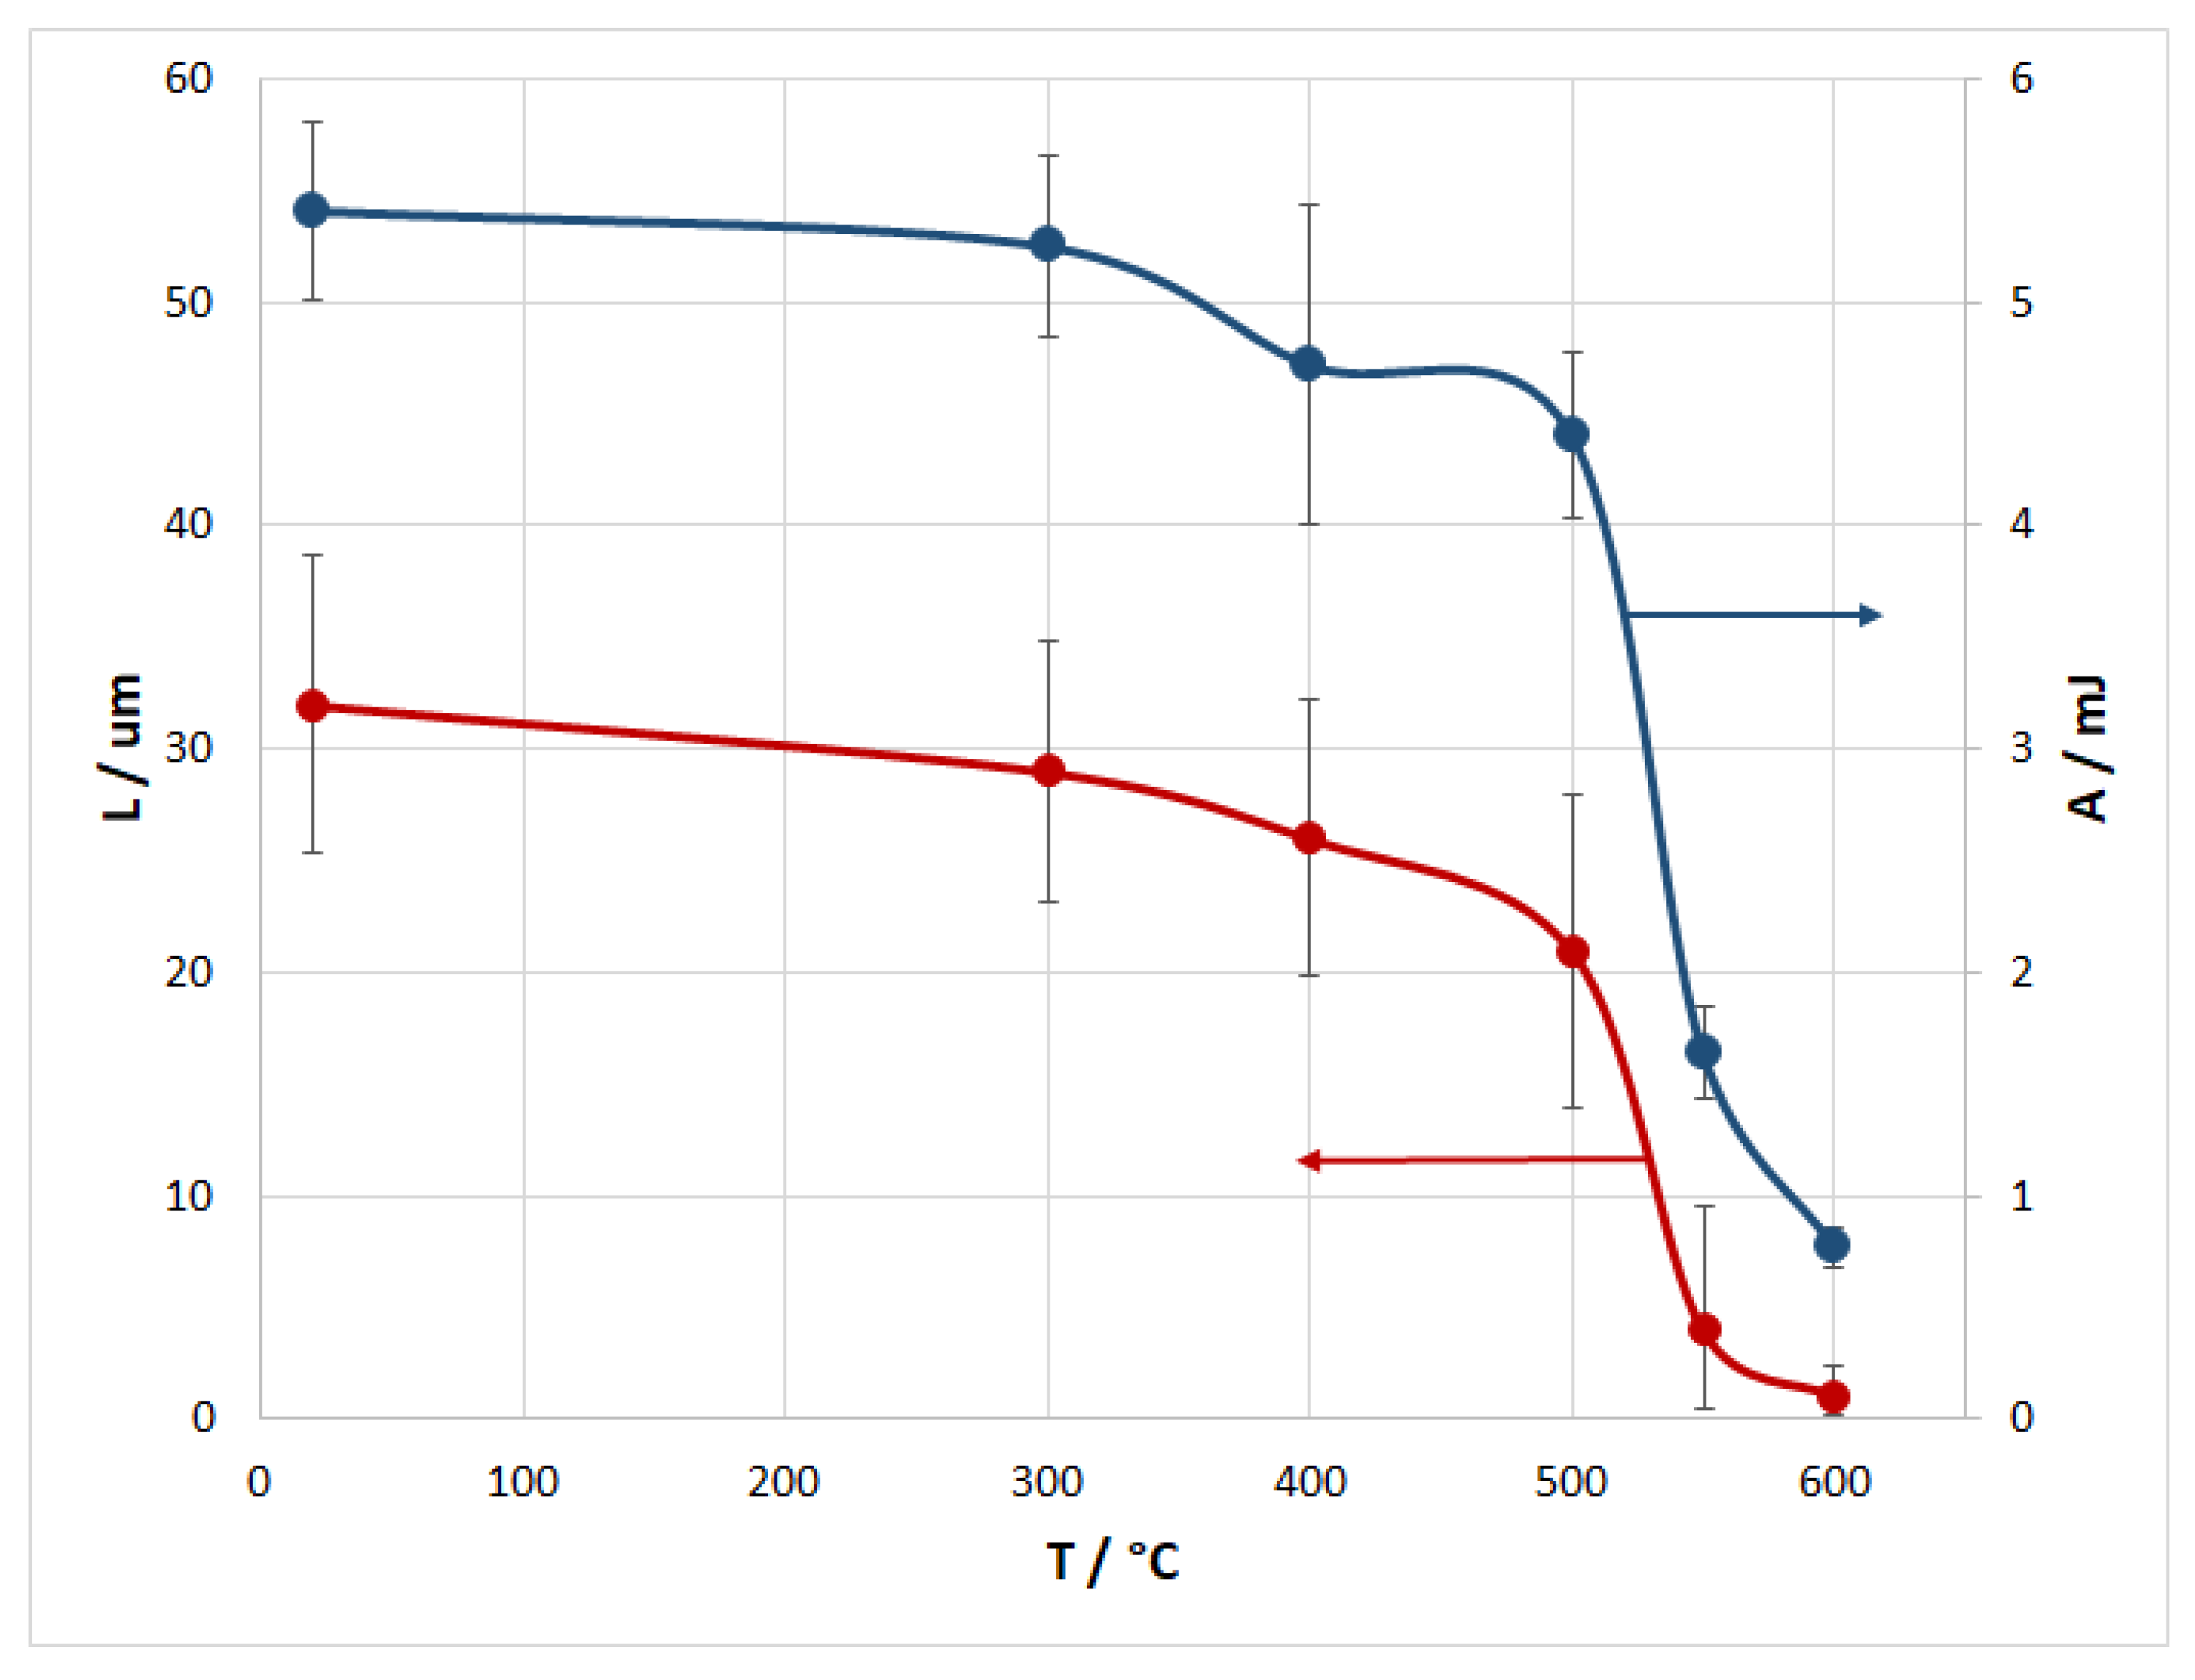
The dependence of the length of the pulled-out fiber part on the treatment temperature is illustrated in Figure 8.
The work of fracture also depends on the treatment temperature; the relationship between these parameters is shown in Figure 8. Both the work of fracture and the length of the pulled-out fiber part decreased monotonically with an increase in the heat-treatment temperature. At treatment temperatures up to 500 °C, inclusive, these parameters slowly decreased as compared with the initial values. A further increase in temperature led to their rapid decrease.
4. Discussion
4.1. Microstructure
The structure of the matrix almost did not undergo any significant change that could affect the composite strength. A slight decrease in the content of the tin structural component at a treatment temperature above 550 °C can be explained by the displacement of a tin-rich liquid from the bulk of the material onto its surface during crystallization. Small drops with a characteristic tin luster were observed on the wire surface after heat treatment. This is most likely due to thermal shrinkage, with the tin-rich liquid crystallizing last at about 230 °C. Despite a noticeable change in the content of the tin structural component, this was not large and did not exceed the error limits of the content of the other two components.
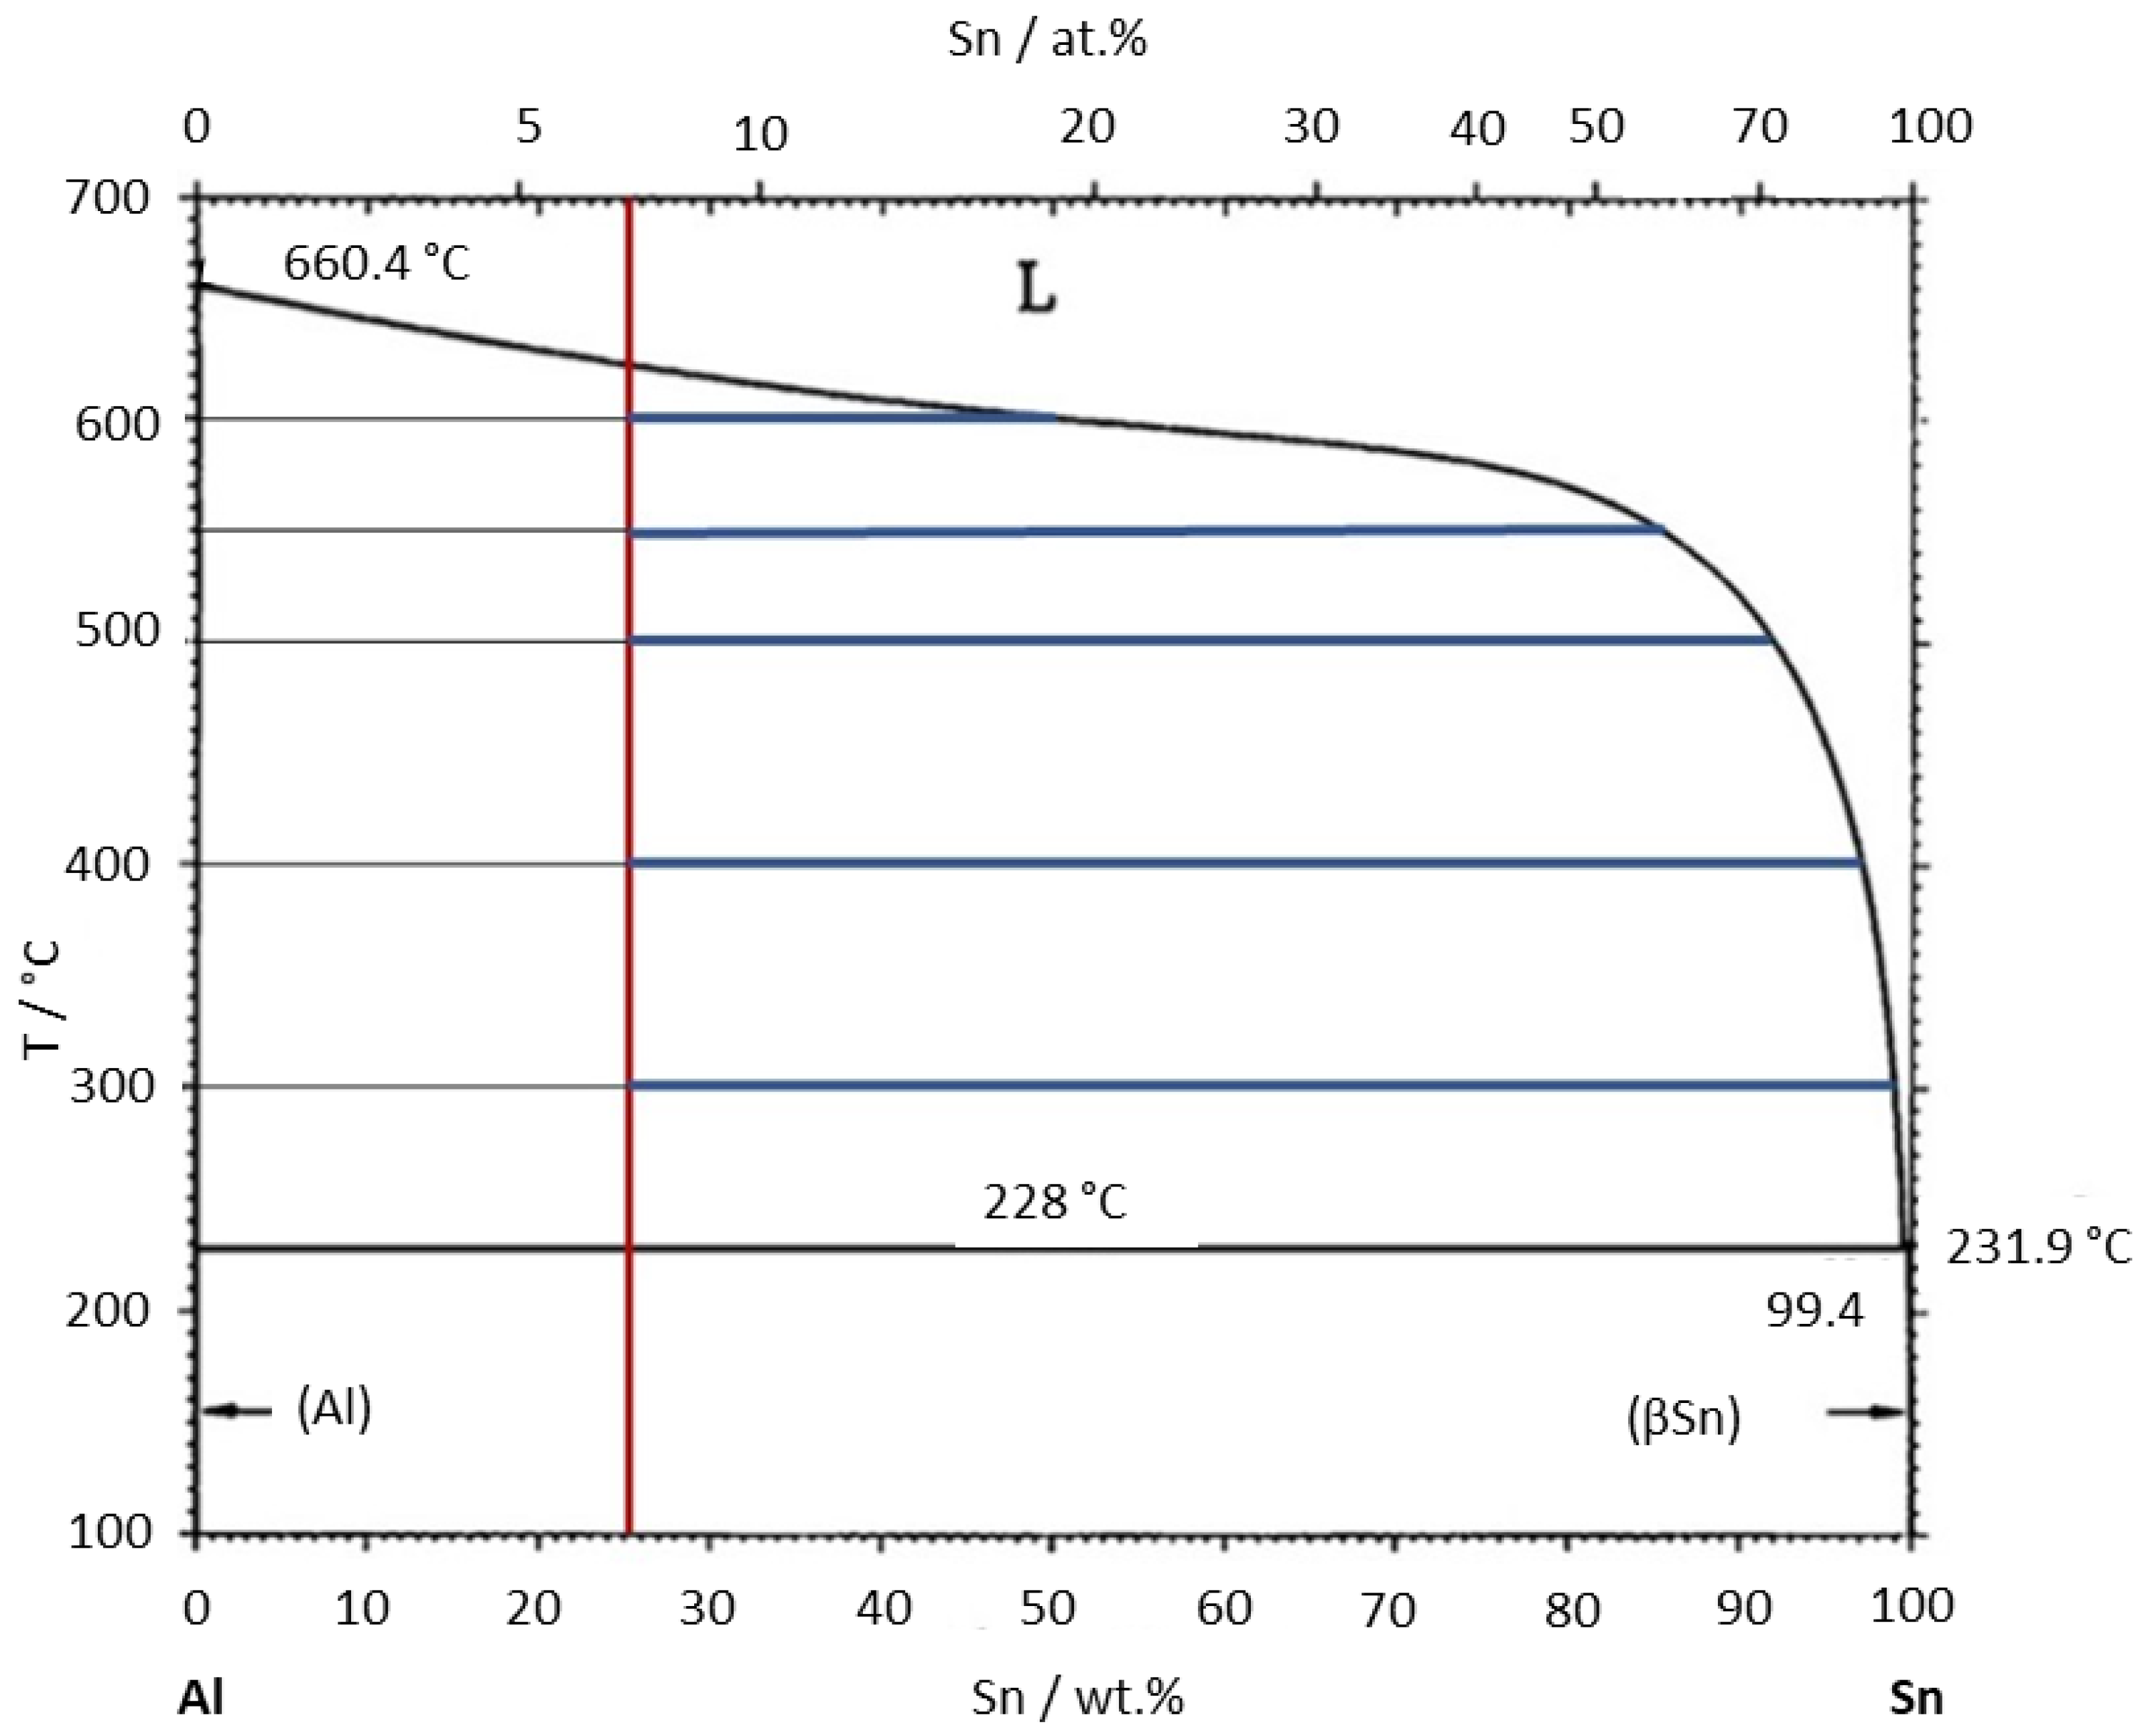
A monotonic increase in the average inclusion size with an increase in the treatment temperature up to 500 °C and a subsequent sharp drop in this parameter may have been due to the occurrence of two competing processes. On the one hand, an increase in temperature led to the growth of aluminum inclusions. On the other hand, this led to the dissolution of aluminum inclusions in the tin-rich liquid phase, according to the state diagram in Figure 9 [15]. With an increase in the temperature up to 500 °C, inclusive, the amount of aluminum in the solid phase (blue segments in the diagram) decreased insignificantly, which indicated the predominance of the inclusion growth process in this temperature range. From 550 °C and above, the proportion of aluminum in the solid phase was reduced significantly, which indicated an active process of the dissolution of aluminum inclusions in the liquid phase. Thus, at a treatment temperature of up to 500 °C, the process of aluminum inclusion growth predominated in the composite. A further increase in the temperature led to the predominance of the process of their dissolution, and subsequent rapid crystallization in the air formed new aluminum inclusions, the sizes of which were comparable to those of the initial ones.
It is well known that in the temperature range under study there are no phase transformations in aluminum, tin, or carbon fiber. In addition, it is known that aluminum and tin do not form any compounds and that their mutual solubility in the solid state is negligible. The Al-Sn-C system [16] indicates that, in this system, the only chemical reaction that occurs is between aluminum and carbon to form aluminum carbide. Considering that aluminum, tin, and carbon atoms have different masses, it can be argued that the light areas in the microstructure images are tin, the gray areas aluminum, and the dark areas carbon fiber. At the same time, the only change in the composite during heat treatment was the formation of aluminum carbide at the interface between the matrix and the fiber, which is shown in Figure 4 and Figure 5. Thus, all qualitative changes that take place during heat treatment occur at this interface.
4.2. Fiber Surface
Degradation of the carbon fiber surfaces in carbon–aluminum composites as a result of chemical interactions between the matrices and fibers was observed in [11,12,13]. Such degradation is due to chemical interaction between aluminum and carbon, resulting in the formation of aluminum carbide, as shown in in the mentioned publications.
The condition of the fiber surface obviously affected the shear strength of the interface between the matrix and the fiber, which was confirmed by the dependence of the critical length of the fiber on the treatment temperature (Figure 8). An increase in the treatment temperature up to 500 °C, inclusive, led to a slight decrease in the length of the pulled-out part of the fiber, which corresponded to the appearance of roughness and small aluminum carbide crystals on the surface of the carbon fiber extracted from the composite (Figure 4). The emergence of large carbide crystals on the fiber surface at a treatment temperature above 550 °C, inclusive, led to a significant decrease in the length of the pulled-out part of the fiber, which was associated with an increase in the shear strength of the interface.
4.3. Strength and the Fracture Energy
A significant drop in strength was observed at treatment temperatures above 500 °C. As shown above, the only qualitative change in the composite during heat treatment was the formation of aluminum carbide at the interface between the matrix and the fiber. However, the matrix underwent quantitative changes (Figure 2b); in particular, an increase in the treatment temperature reduced the volume fraction of tin from 9 to 5%. This change in the tin volume fraction in the matrix led to a change in its mechanical properties. This certainly affected the composite strength. However, as shown in [4], firstly, such change does not lead to a significant change in the mechanical properties of the matrix, and, secondly, this effect is insignificant as compared to the effect of the interface shear strength. An increase in the shear strength between the matrix and the fiber occurred as a result of a more intense chemical interaction between the matrix and the fiber (Figure 4). In turn, this was due to an increase in the aluminum concentration in the liquid phase (Figure 9) with increasing temperature.
It was shown in [1,2,3,4] that the strength of a composite is directly related to the strength of the interfaces. The strength of the interfaces can be judged by the average length of the pulled-out part of the fiber, which is approximately equal to half the critical length [17]. The longer the pulled-out part of the fiber, the weaker the interface (Figure 7). The results of a comparison of the dependencies of composite strength on the length of the pulled-out part of the fiber (Figure 6 and Figure 8) were in good agreement with the data of other authors.
The value of the flexural modulus for an initial state exceeds the value of the modulus calculated according to the mixture rule by around 15–20%. This fact indicates that the value of the flexural modulus tends to be somewhat overestimated, which is also mentioned in ISO 178:2010.
An assessment of the fracture work demonstrated that an increase in the treatment temperature led to a decrease in this parameter, which can be explained by an increase in the shear strength of the interfaces. This, along with a decrease in the strength of the composite, led to a decrease in the work required for its fracture. In turn, this is related to the trajectory of crack propagation, which, in the case of “weak” interfaces, is forced to constantly change direction due to an inability to propagate in one plane (in the case of “strong” interfaces). This leads, in the case of “weak” interfaces, to crack propagation consuming much more energy than in the case of “strong” interfaces. In addition, in the case of weak interfaces, part of the fracture work is spent overcoming the friction force between the matrix and the fiber, and the weaker the interface, the greater this part of the work.
Similar results were obtained in a recent study [18] which considered the effect of carbon fiber surface modification with carbon nanotubes on the strength and fracture work of a composite with an aluminum matrix reinforced with carbon fiber.
The results of the present work allowed the plotting of the experimental dependence of the strength of the composite on the strength of the interfaces, the properties of the matrix and fiber being approximately the same, with only one parameter, the strength of the interfaces, being subject to change. This made it possible to numerically estimate the critical stress required for crack propagation, which is one of the two parameters that determine composite strength, according to [4].
5. Numerical Calculations
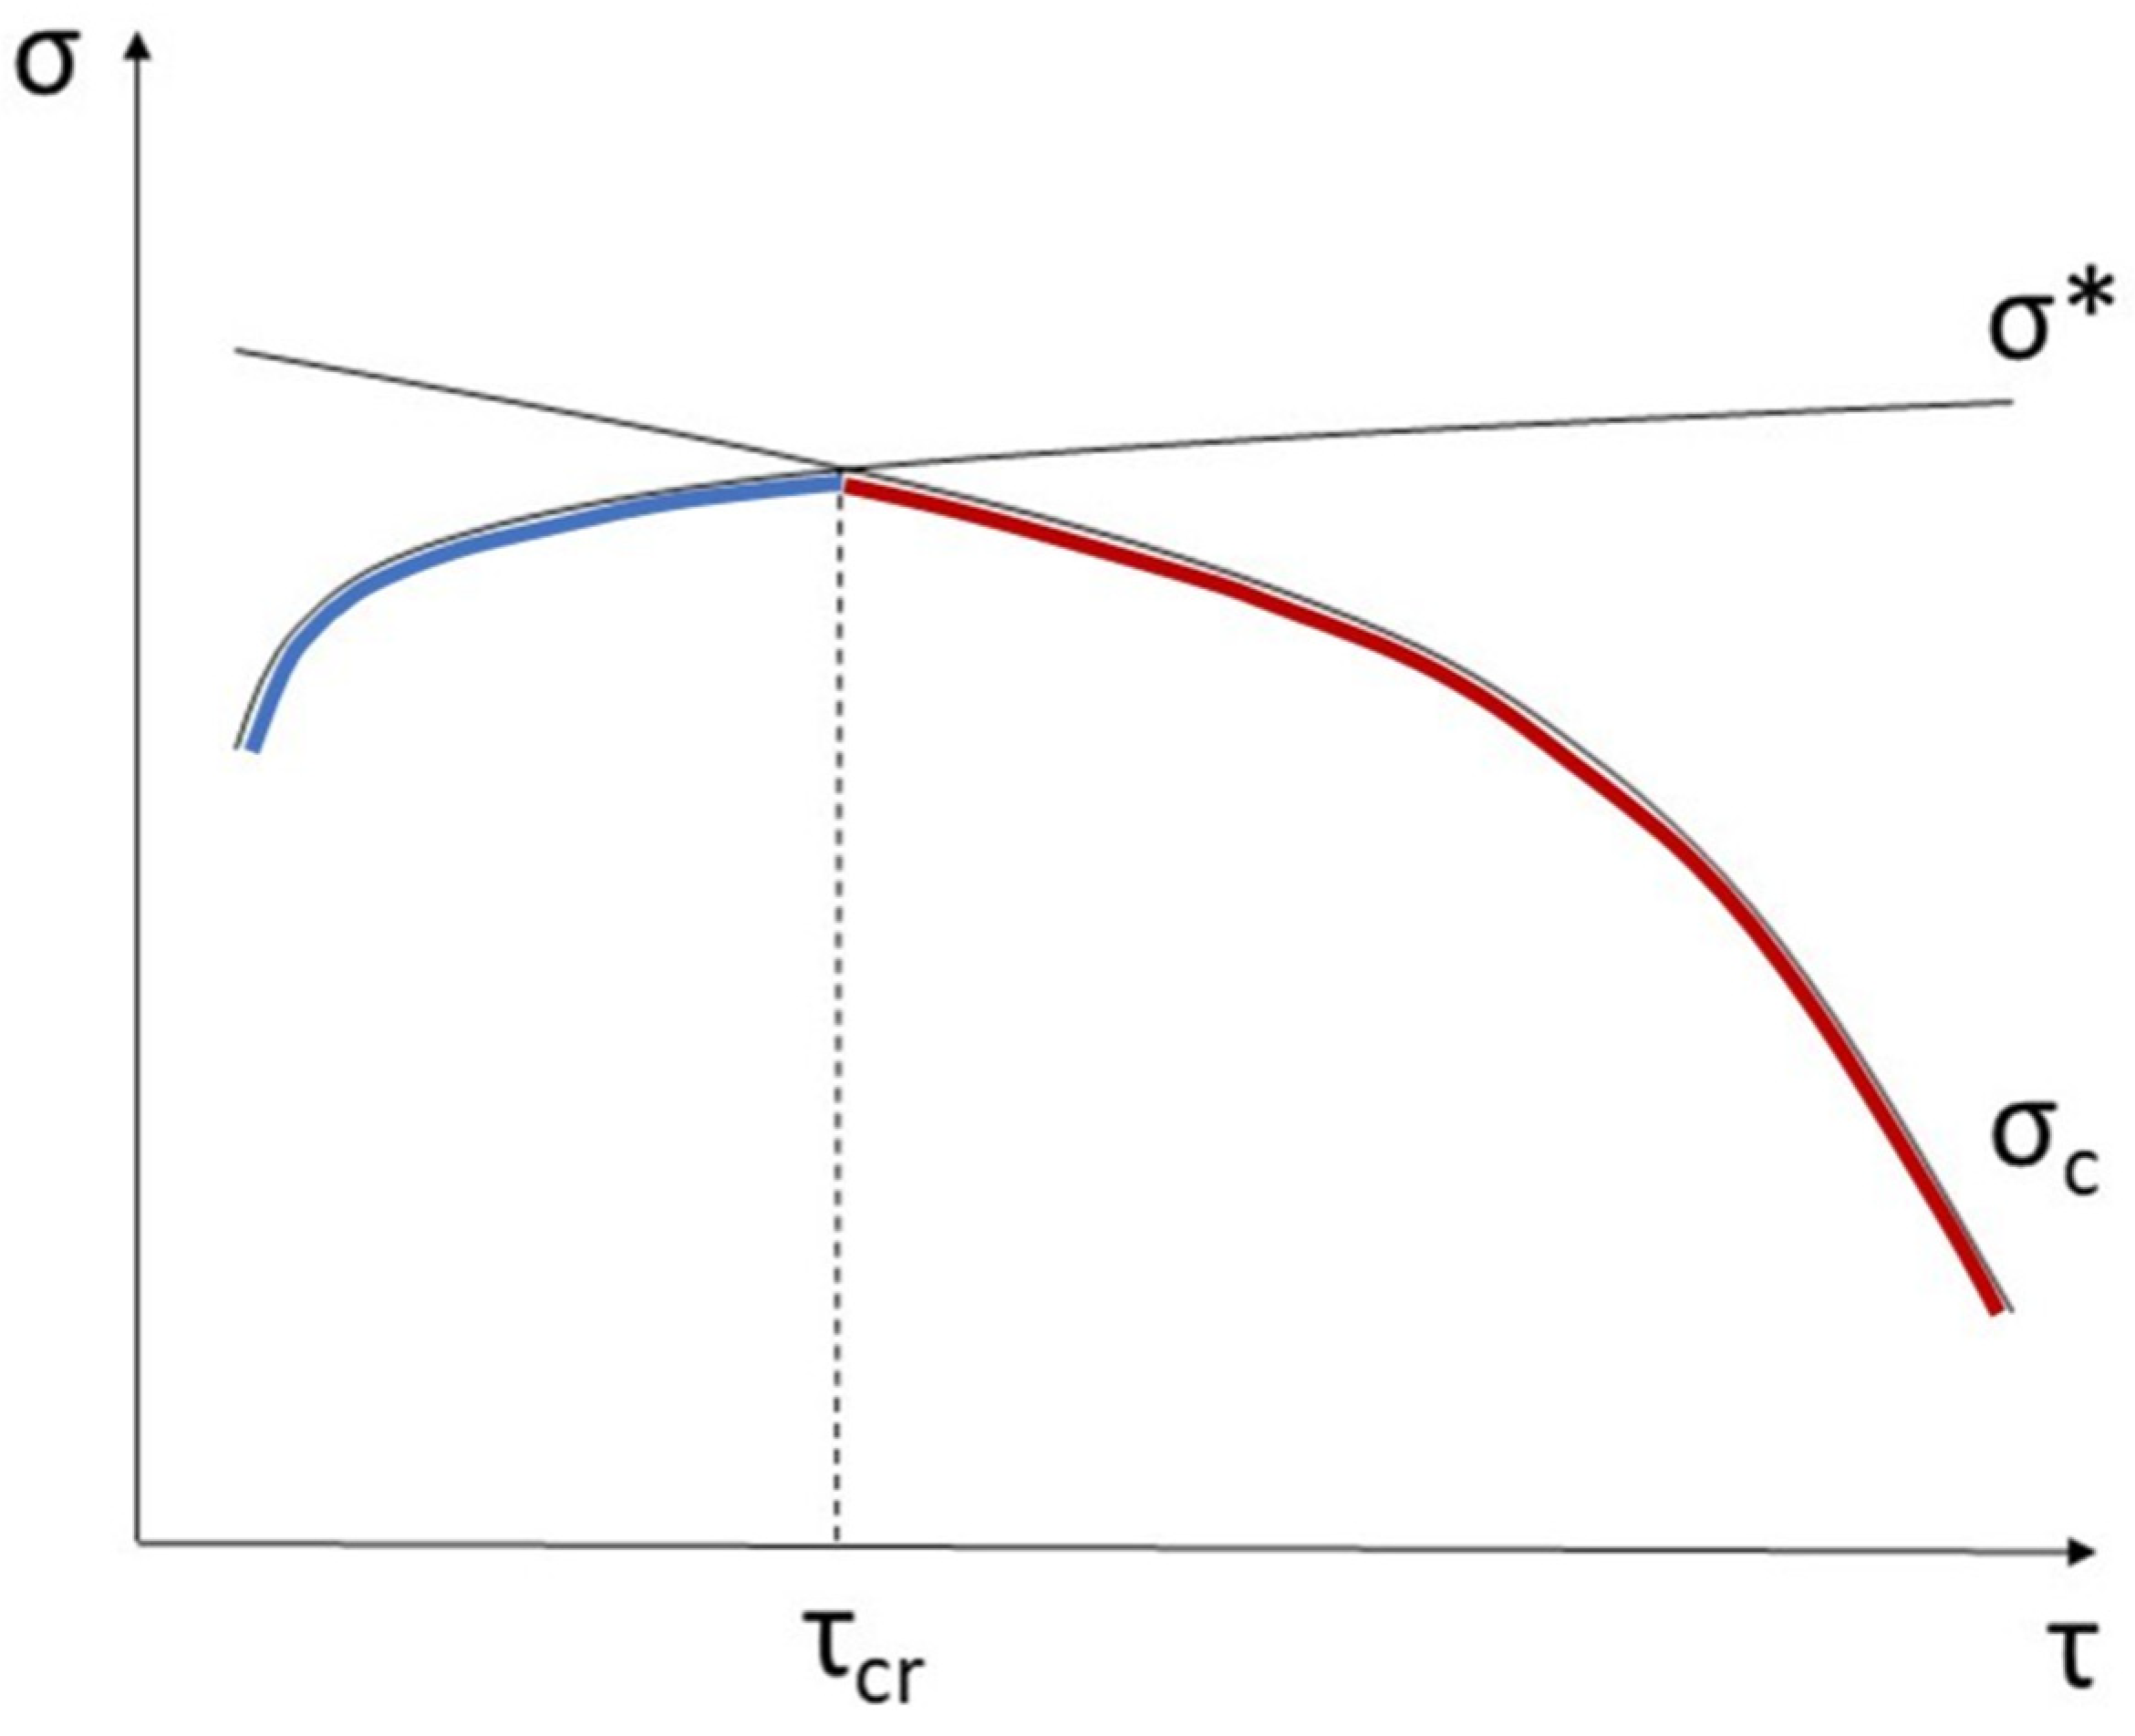
In [4], the schematic dependence of composite strength on the shear strength of the interface between the matrix and the fiber was shown. This dependence (Figure 10) is determined by two partial dependencies. On the one hand, when the shear strength of the interface is less than the critical value τcr, the composite strength is determined by the strength of the fiber with a critical length, which increases with decreasing shear strength of the interface. This increase leads to a decrease in fiber strength according to the Weibull distribution and, as a result, in the composite strength (blue part of the curve σ* in Figure 10).
On the other hand, when the shear strength of the interface is greater than the critical value τcr, the composite strength is determined by the critical stress σC required for crack propagation, which, in contrast to σ*, decreases with the increasing shear strength of the interface (the red part of the curve σC in Figure 10). This is because the shorter the critical length of the fiber, the less stress is required for crack propagation.
The greatest composite strength is achieved at the shear strength τcr, which is determined by the intersection of the two above-mentioned curves σC and σ*.
5.1. Expression of the σ* Curve
The σ* curve can be expressed using a refined mixture rule, as it was in [1] for metal and ceramic matrix composites. The refinement in the mixture rule is made for the strength of the fiber in the composite, which, according to the Weibull distribution, depends on the length. In this case, the length means the critical length of the fiber that is determined from the condition of the equal strength of the fiber and the interface [17] and is expressed as follows:
where σ is the fiber strength, R is the fiber radius, and τ is the interface shear strength.
The dependence of the fiber strength on the length, according to the Weibull distribution, is cut out [17]:
where σf is the strength of the fiber at the length l, σ0 is the strength of the fiber at the length l0, m is the Weibull modulus, e is the base of the natural logarithm, and k is the refinement factor.
Substitution of the expression lcr from Equation (1) into Equation (2) as the fiber length gives an equation for the dependence of the fiber strength σf on the shear strength τ:
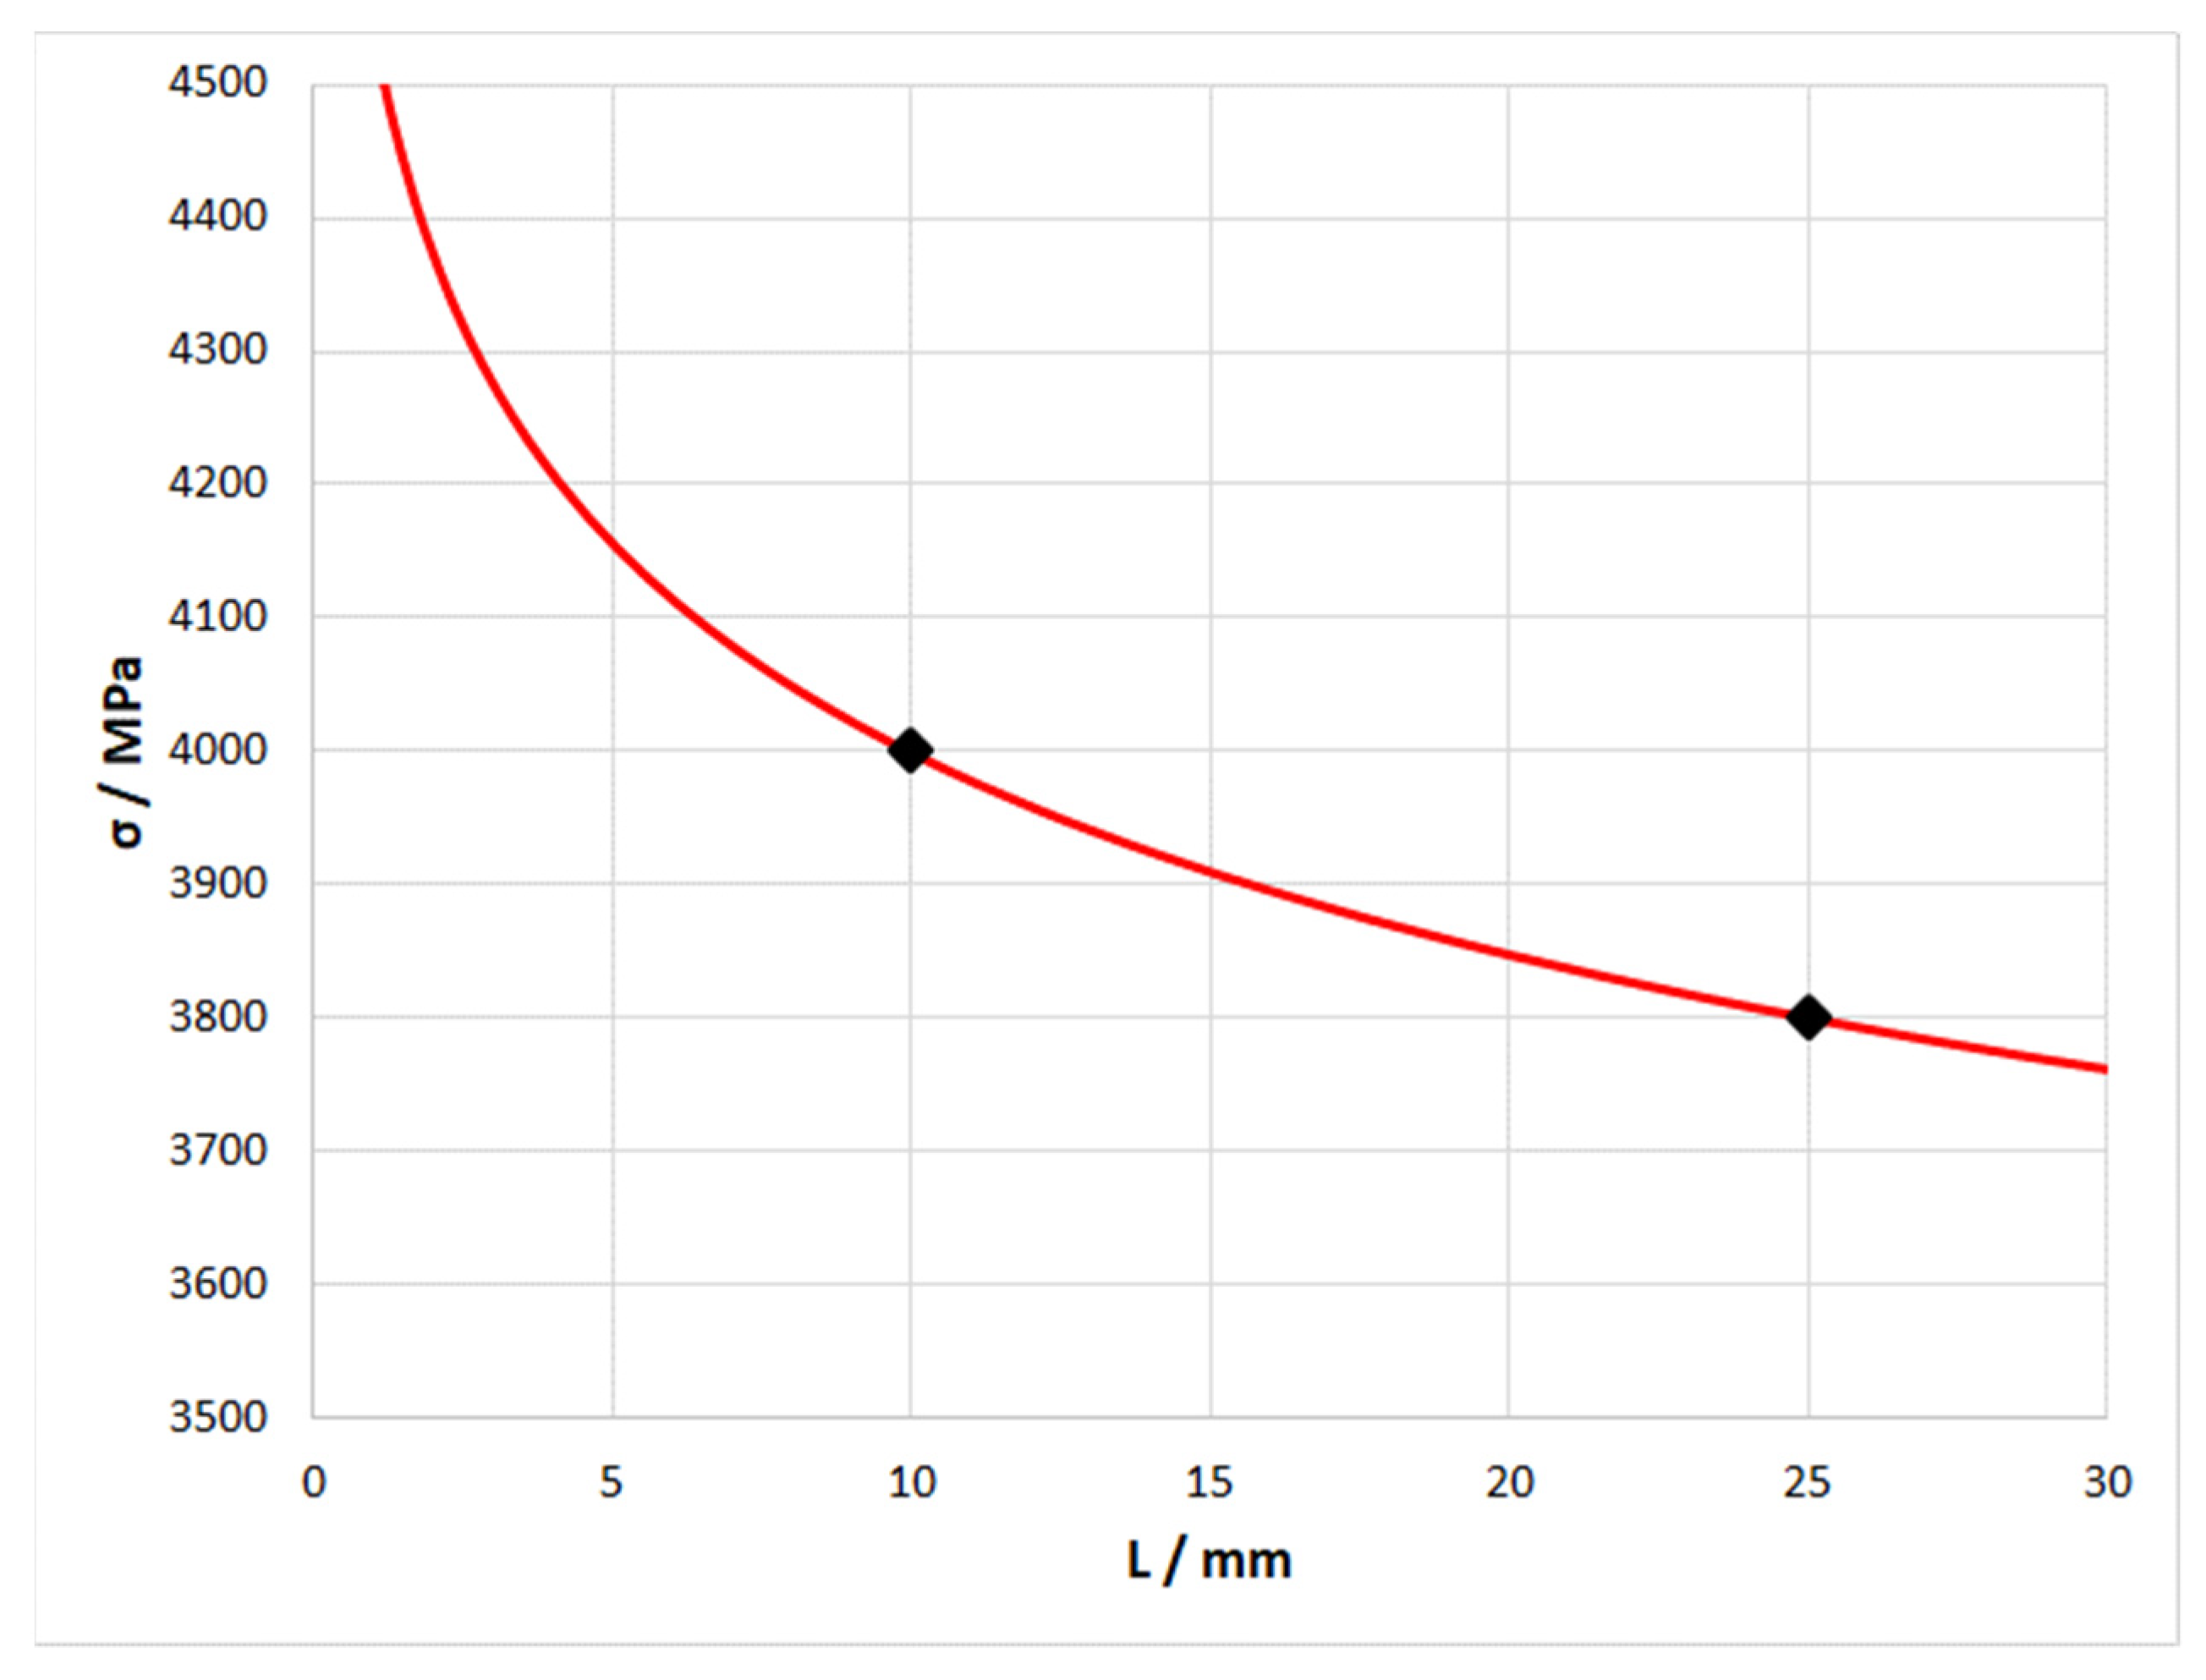
In Equation (3), the variable is the interface shear strength τ. The fiber radius R is taken to be 3.25 μm, according to the average value of the fiber radius determined from the transverse sections of the composite. According to the manufacturer’s data, we took σ0 and l0 to be 4000 MPa over a length of 10 mm. To determine the coefficient k and the Weibull modulus m, we also used the manufacturer’s data, according to which a decrease in the fiber strength over a length of 25 mm does not exceed 5%. According to this, the strength of the fiber over a length of 25 mm was taken to be 3800 MPa. Thus, having two points with the coordinates σf and l (4000;10) and (3800;25), the coefficients k and m were selected, which were 1.241 and 18, respectively. Figure 11 shows a plot of the dependence expressed by Equation (2) and the manufacturer’s data on the fiber strength.
Further refinement of the strength of the fiber in the composite, according to [1], gives the expression:
which introduces an additional coefficient (the first two factors in parentheses), expressed according to the assumption of global load sharing (GLS). After the fracture of a part of the fiber, the load is distributed evenly between the undestroyed fibers; in other words, there is no stress concentration near the destroyed fibers [1].
Replacement of the fiber strength in the mixture rule equation with expression (4) gives the numerical dependence σ*(τ):
where Vf is the fiber volume fraction and σm is the strength of the matrix. Since aluminum and tin in the matrix alloy are insoluble in each other and do not form intermetallic compounds, the strength of the matrix could be calculated according to the mixture rule:
where VAl is the volume fraction of aluminum in the matrix, σAl is the strength of aluminum (80 MPa), and σAl is the strength of tin (20 MPa). The matrix strength σm calculated by this method was between 66 and 73 MPa, depending on the tin content (see Figure 2b). Since this value was several orders of magnitude less than the fiber strength, for the convenience of further calculations, σm was taken to be 69 MPa.
5.2. Expression of the σc Curve
The assessment of the critical stress required for crack propagation was based on the Griffith–Orowan–Irwin concept, which consists of an equation representing the elastic energy released during the fracture of a material and the work of fracture necessary for the formation of a new fracture surface [19]. The difference between the applied approach and the one mentioned is that the work of fracture was calculated for the entire sample section, not for a small increment. The elastic energy was estimated in the same way. The above data were used as the experimental data.
The energy-balance equation has the form:
where AE is the elastic energy spent on the fracture of the composite wire, and AFract is the work of fracture of the composite wire. The work of fracture is equal to the area under the curve in the load–displacement axes; its value for the wire in different states is shown in Figure 8. On the other hand, the work of fracture is expressed as the sum of several components:
where APD is the work expended in the plastic deformation of the matrix, ANSm is the work expended in the formation of new matrix surfaces, ANSf is the work expended in the formation of new fiber surfaces, and Afr is the work expended in overcoming the friction force between the matrix and the fiber.
The sum of the first three terms in Equation (8) is almost independent of the shear strength of the interface between the matrix and the fiber; therefore, we take it to be constant and denote it as CA. The work expended in overcoming the friction force is expressed as follows:
where N is the number of filaments in the composite wire, the integrand in brackets is the expression of the friction force acting at an initial moment of pulling out a part of the fiber with the length lcr/2, and the variable z is the change in the length of the unpulled part of the fiber in the range from lcr/2 to 0. After integrating and expressing the value of lcr through τ, according to Formula (1), Expression (9) takes the form:
In addition, expressing τ in terms of lcr according to Equation (1), Equation (10) can be represented as:
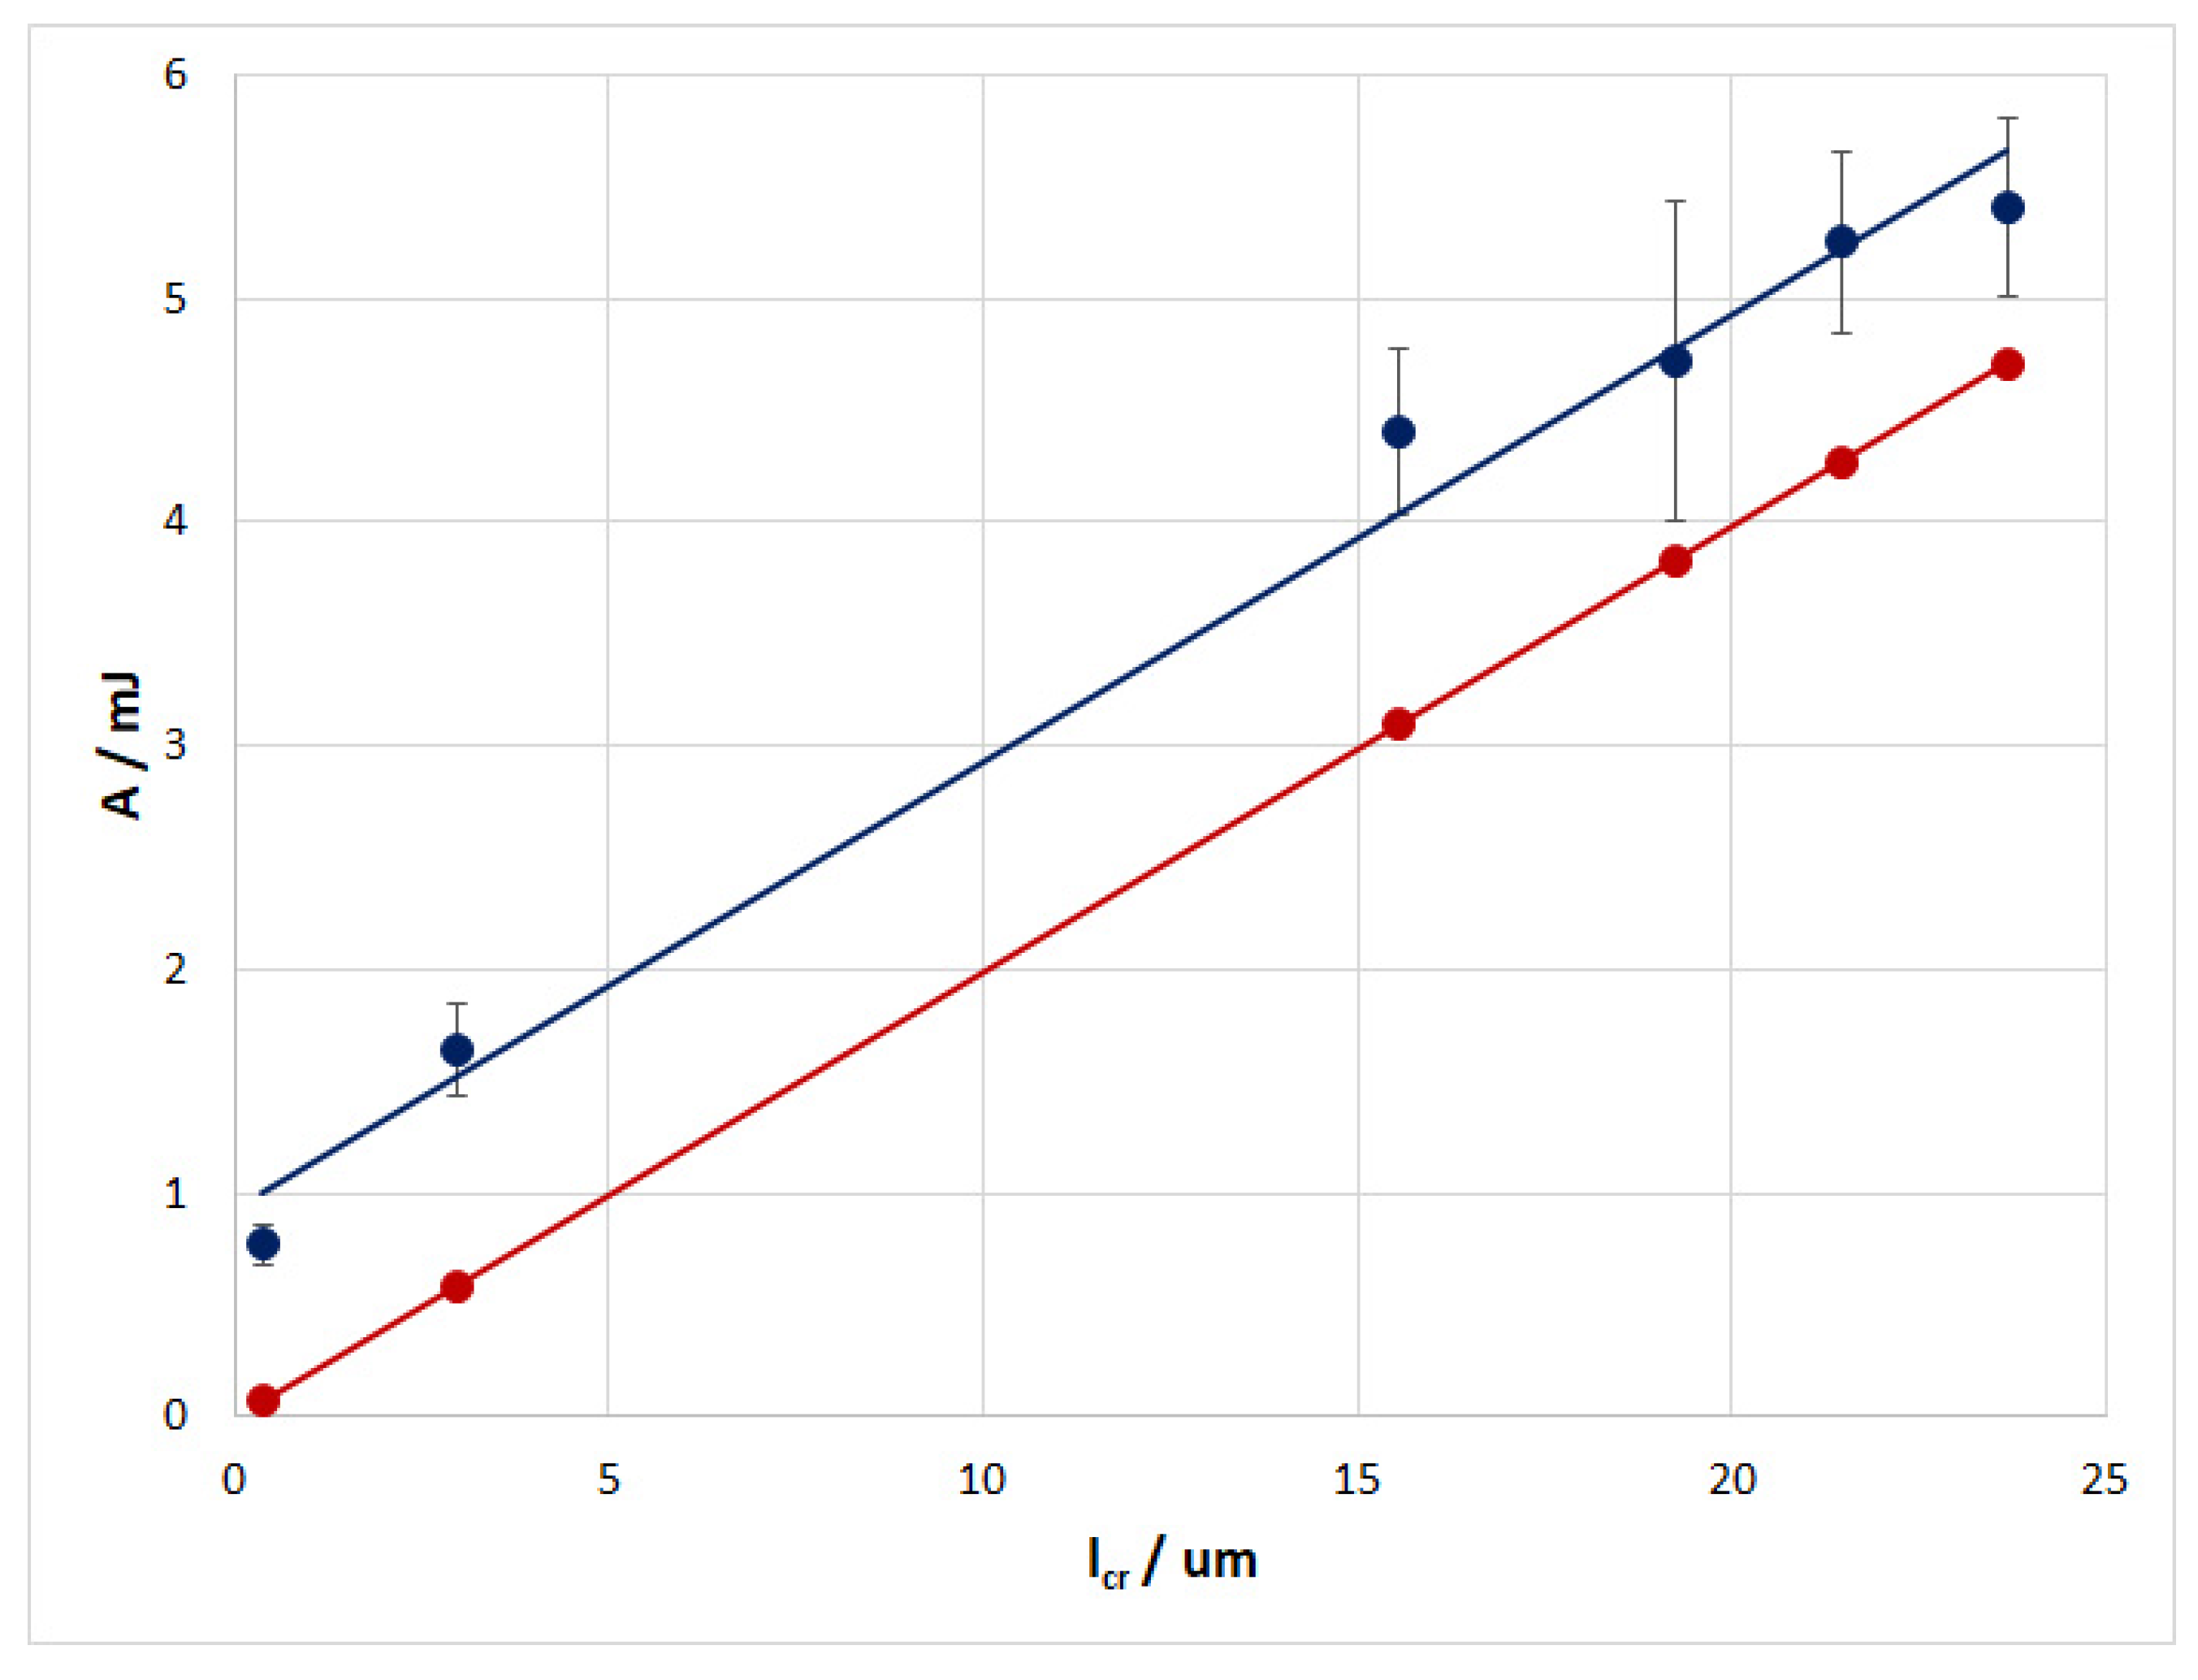
Figure 12 depicts experimental values of the work of fracture of the composite wire and the values of the work expended in overcoming the friction force from the critical length of the fiber lcr, calculated using Equation (11).
Note that the dependencies in Figure 12 were obtained using a correction factor of 0.74 for the critical fiber length determined from the photographs of the fracture surfaces. This was done for two reasons. Firstly, this method of determination is not sufficiently accurate. Secondly, according to Equation (11), with an almost zero value for the pulled-out part of the fiber (Figure 7d), the work of friction will also be almost zero. At the same time, with zero work of friction, the experimental work of fracture will be equal to the constant component CA, which is the sum of the first three terms in Equation (8). In addition, since the component CA (0.98 mJ) is taken to be constant, the discrepancy between the remaining points should be the same.
The elastic energy on the left side of Equation (8) is expressed as follows [19]:
where σc is the critical stress at which the crack propagates and the composite fails, E is the elastic modulus of the composite, and VE is the volume of the material from which the stored elastic energy is transferred to the fracture work.
To calculate the value of VE, the right side of Equation (12) was equated to the experimental values of the work of fracture, and the corresponding experimental values for the modulus of elasticity and the strength of the composite wire in different states were also used for E and σc. The calculation showed that the value of VE almost did not change and was 0.33 ± 0.02 mm3. In this regard, for further calculations, the value of VE was assumed to be constant. Since the average value of the elastic modulus was 172 ± 10 GPa, for further calculations, this value was also assumed to be constant.
From Equations (8), (10) and (12), we express the dependence between the critical stress necessary for crack propagation and the shear strength of the interface between the matrix and the fiber:
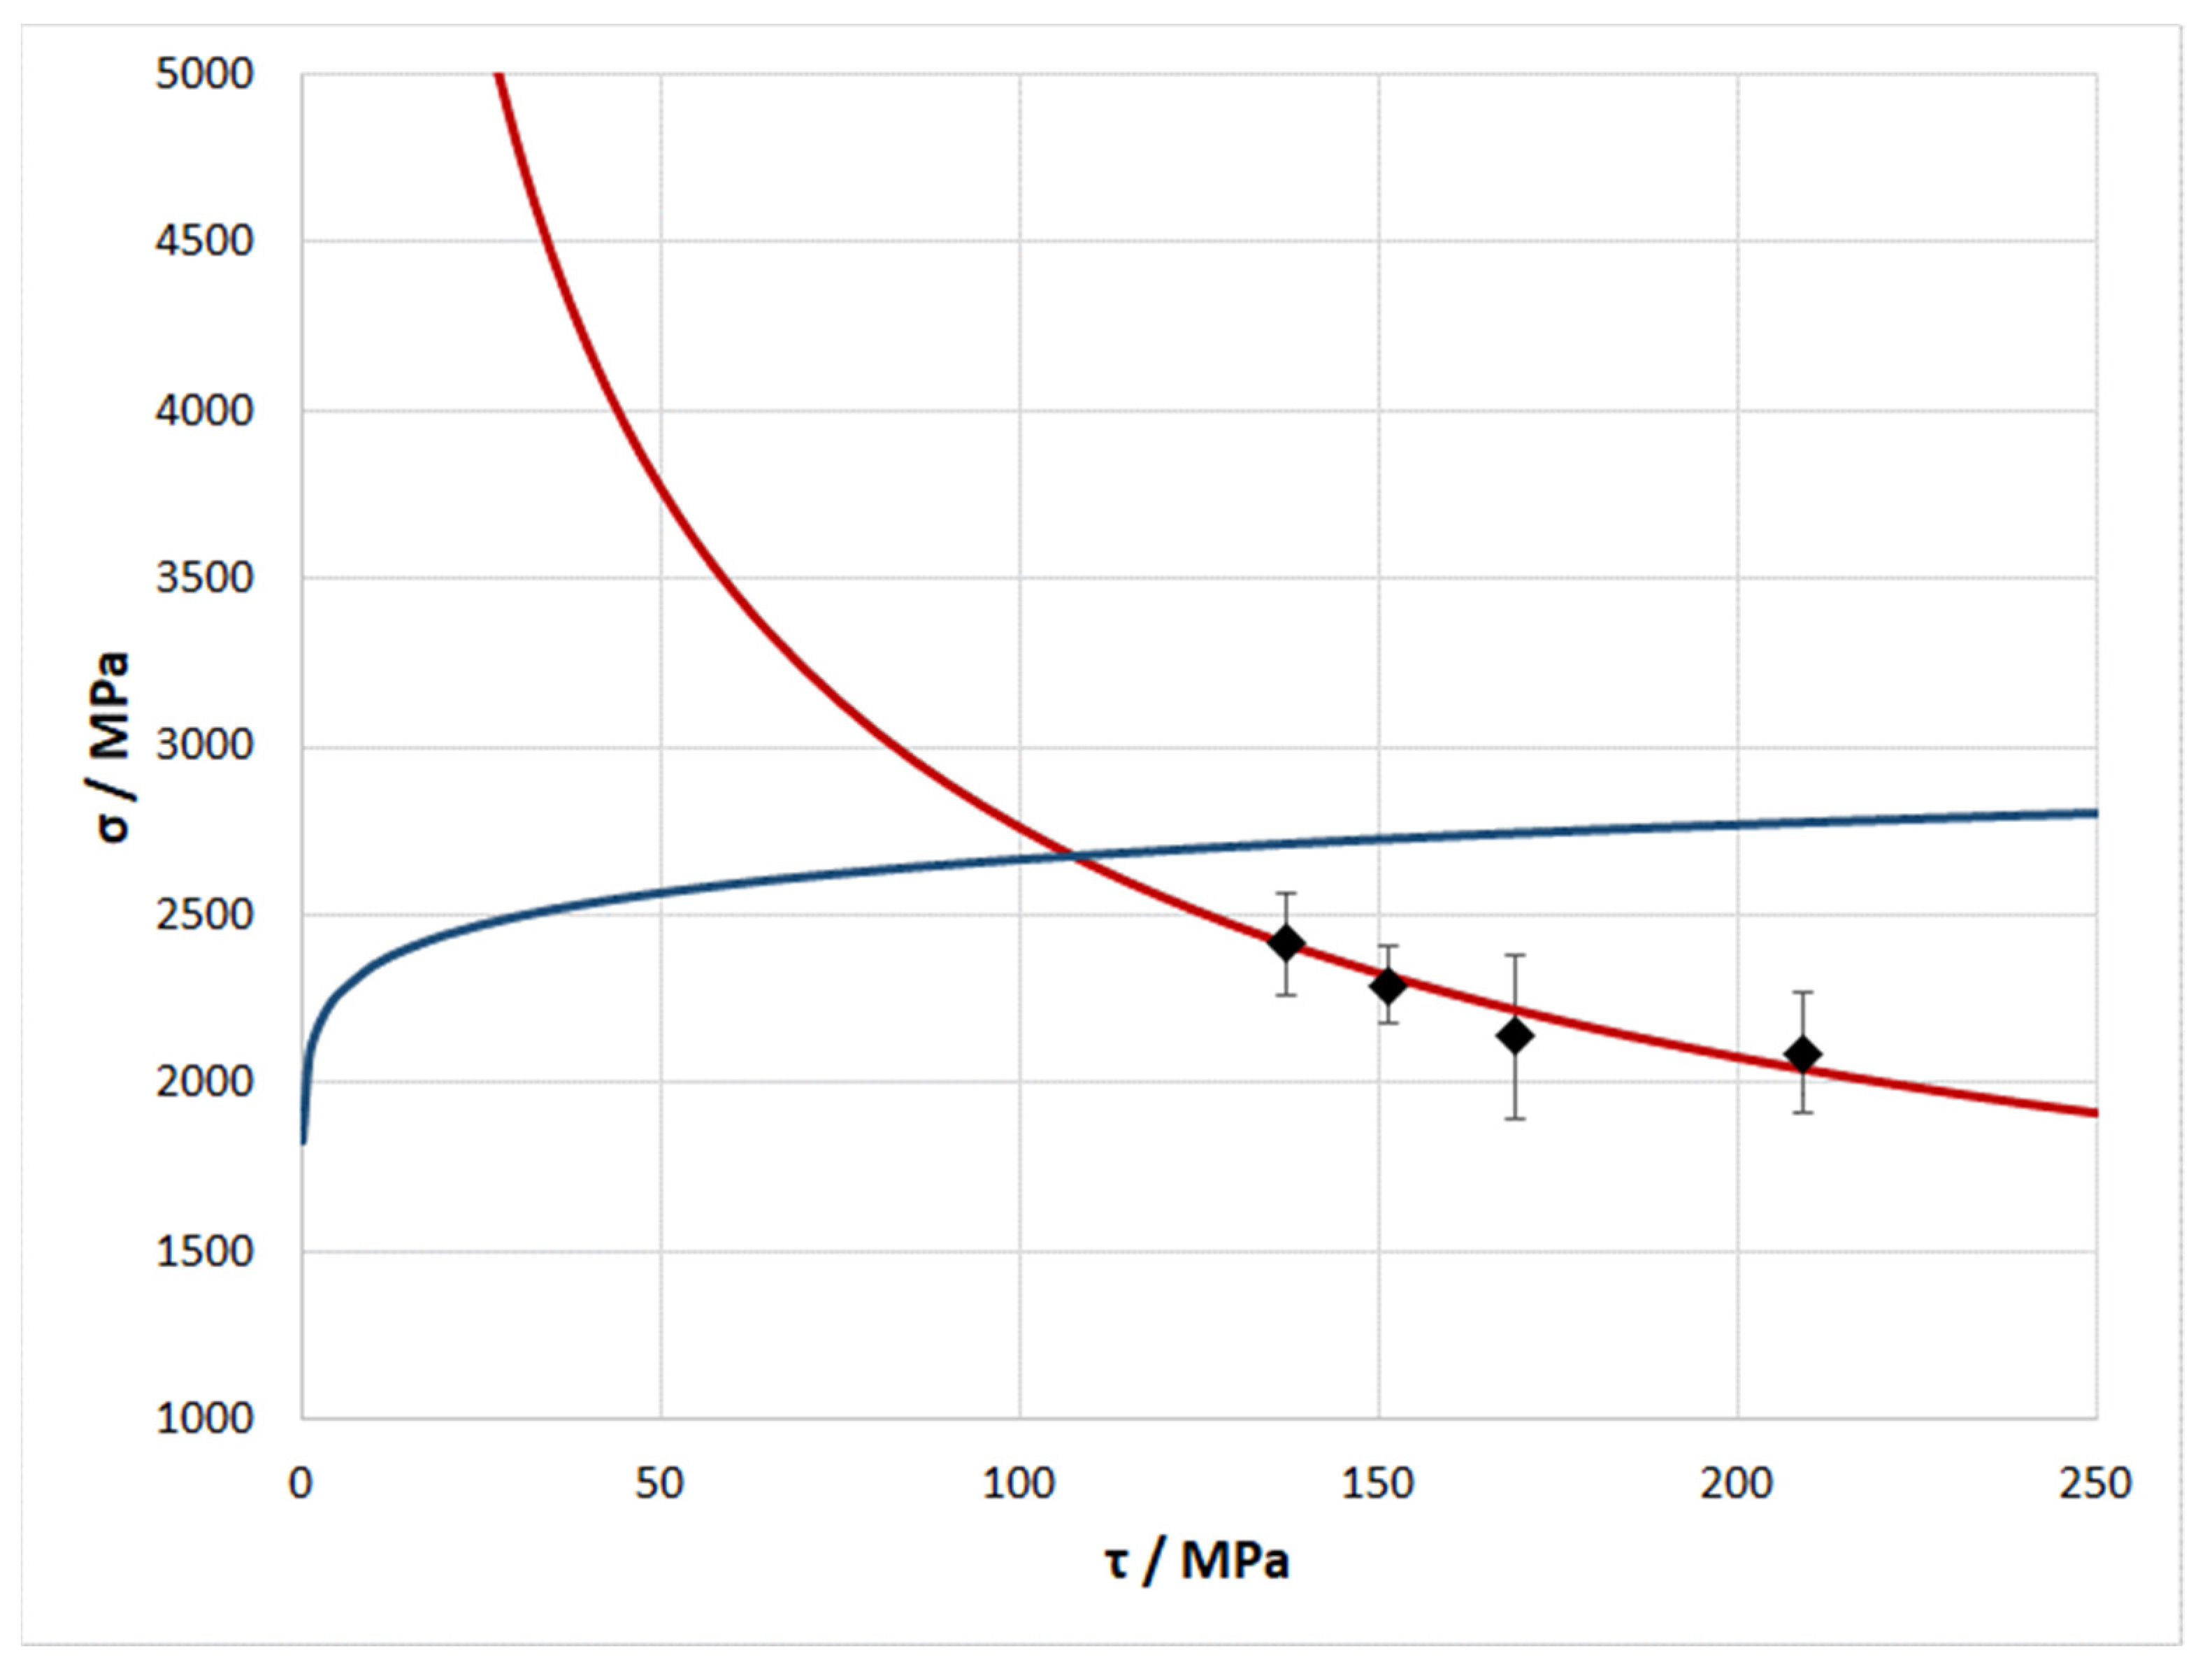
Figure 13 shows dependencies of the strength of the composite calculated according to the refined mixture rule, Equation (5), and the critical stress of crack propagation, Equation (13). As mentioned above, the greatest strength of the composite is achieved at the critical shear strength of the interface corresponding to the intersection of these curves, these values being τcr = 107 MPa and σmax = 2675 MPa, respectively. The experimental values for the composite strength compared with the shear strength calculated from the experimental values of lcr are marked with black dots.
The dependence of the composite strength plotted according to the rule of mixtures has a parabolic form (Figure 13). With an increase in the shear strength of the interface above 50 MPa, this dependence has an almost linear section. This is in good agreement with the data of [20], where the strength of the fiber was found to depend almost linearly on its length. As the shear strength of the interface decreases from 50 to 0 MPa, the dependence of the composite strength tends non-linearly to 0, which looks quite logical, since zero shear strength indicates an infinite length of the fiber, the strength of which is speculatively also equal to zero.
The dependence of the critical stress required for crack propagation has the form of a hyperbola (Figure 13). The nature of this dependence at the shear strength of the interface above 50 MPa is beyond doubt. However, as the shear strength of the interface in the composite decreases, the dependence of the critical stress tends to infinity, which looks very doubtful. Nevertheless, this dependence takes into account only the case of fracture by crack propagation, without taking into account other types of fracture. Such types of fracture include the case in which the bond between the matrix and the fiber is almost absent and where the fracture of the matrix occurs much earlier than that of the fiber.
The contribution of the work of overcoming the friction force to the total work of fracture turned out to be unexpected. That is, with relatively small values for shear strength, this contribution can be several times greater than the total contribution of all other types of energy (Figure 12). It can be assumed that, due to this, the composite can maintain its stability even after the onset of plastic deformation of the matrix and the breakage of some of the fibers in the bulk of the material.
6. Conclusions
- Taking the example of a composite wire with an Al-25% Sn alloy matrix reinforced with carbon fiber, the dependence of the bending strength on the shear strength of the interface between the matrix and the fiber was determined. For this purpose, a series of composite wire specimens were obtained and subjected to heat treatment at temperatures from 300 to 600 °C. An analysis of the microstructure of the composite wire in an initial state and after heat treatment showed that there were almost no changes that could affect the strength of the composite.
- The examination of the surface of the carbon fiber extracted from the composite in an initial state and after heat treatment showed that the fiber in the initial state almost did not differ from the fiber in the delivered state. The fiber from the composite treated at 300 °C had a rougher surface. A further increase in the treatment temperature led to the formation of aluminum carbide crystals on the fiber surface, the size and number of which increased with increasing temperature.
- The study of the fracture surfaces and the comparison with the results of the investigation of the fiber surface showed that the emergence of carbide crystals at the interface led to a decrease in the length of the pulled-out part of the fiber. This explicitly indicated a relation with an increase in the strength of the interface. The evaluation of the work of fracture of the composite with different strengths of the interface between the matrix and the fiber demonstrated that as the strength of the interface increased, the work of fracture decreased, due to the premature fracture of the composite through crack propagation in one plane. In the case of weak interfaces, the trajectory of crack propagation is not in one plane, which leads to an increase in the fracture work.
- The effect of the shear strength of the interface between the matrix and the fiber on the strength, the modulus of elasticity, and the nature of the composite fracture was studied. The highest bending strength of 2450 MPa was observed for composite wire samples with the lowest interface shear strength. With an increase in the shear strength of the interface, a decrease in the composite wire strength below 900 MPa was observed. Along with the strength, as the shear strength of the interface increased, the flexural modulus also decreased, from 190 to 150 GPa.
- Based on the experimental data, as well as the refinement of the mixture rule according to the Weibull distribution and the estimation of the critical stress of crack propagation according to the Griffith–Orowan–Irwin concept, a numerical assessment of the dependence of the composite strength on the shear strength of the interface was made. On the basis of this, the critical shear strength was calculated, at which the greatest strength of the composite was achieved, the values being τcr = 107 MPa and σmax = 2675 MPa, respectively. It has been shown that the contribution of the work of overcoming the friction force to the total work of fracture at relatively small values of shear strength can be several times greater than the total contribution of all other types of energy. This indicates that a composite with weak interfaces can remain stable even after the onset of plastic deformation of the matrix and the breakage of some of the fibers in the bulk of the material.
Author Contributions
Conceptualization, S.G.; methodology, S.G.; validation, S.G.; formal analysis, S.G.; investigation, B.A.; writing—original draft preparation, S.G.; writing—review and editing, S.G.; visualization, B.A.; supervision, S.G.; project administration, S.G.; funding acquisition, S.G. All authors have read and agreed to the published version of the manuscript.
Funding
This research was funded by Russian Science Foundation, grant number 22-79-10064.
Institutional Review Board Statement
Not applicable.
Informed Consent Statement
Not applicable.
Data Availability Statement
Not applicable.
Acknowledgments
The authors are grateful to Sergei Tikhonovich Mileiko, Evgeniya Yurevna Postnova, Olga Feliksovna Shakhlevich, and Elena Yurevna Aksenova. The research part of the work was carried out at the Collective Use Center of ISSP RAS.
Conflicts of Interest
The authors declare no conflict of interest.
References
- Curtin, W.A. Ultimate strengths of fibre-reinforced ceramics and metals. Composites 1993, 24, 98–102. [Google Scholar] [CrossRef]
- Deve, H.E.; McCullough, C. Continuous-fiber reinforced composites: A new generation. J. Miner. Met. Mater. Soc. 1995, 47, 33–37. [Google Scholar] [CrossRef]
- Evans, A. The mechanical properties of reinforced ceramic, metal and intermetallic matrix composites. Mater. Sci. Eng. A 1991, 143, 63–76. [Google Scholar] [CrossRef]
- Galyshev, S.; Orlov, V.; Atanov, B.; Kolyvanov, E.; Averichev, O.; Akopdzhanyan, T. The Effect of Tin Content on the Strength of a Carbon Fiber/Al-Sn-Matrix Composite Wire. Metals 2021, 11, 2057. [Google Scholar] [CrossRef]
- Vidal-Sétif, M.; Lancin, M.; Marhic, C.; Valle, R.; Raviart, J.-L.; Daux, J.-C.; Rabinovitch, M. On the role of brittle interfacial phases on the mechanical properties of carbon fibre reinforced Al-based matrix composites. Mater. Sci. Eng. A 1999, 272, 321–333. [Google Scholar] [CrossRef]
- Yu, J.K.; Li, H.L.; Shang, B.L. A functionally gradient coating on carbon fibre for C/Al composites. J. Mater. Sci. 1994, 29, 2641–2647. [Google Scholar] [CrossRef]
- Zhu, C.; Su, Y.; Zhang, D.; Ouyang, Q. Effect of Al2O3 coating thickness on microstructural characterization and mechanical properties of continuous carbon fiber reinforced aluminum matrix composites. Mater. Sci. Eng. A 2020, 793, 139839. [Google Scholar] [CrossRef]
- Gomzin, A.I.; Gallyamova, R.F.; Galyshev, S.N.; Paramonov, R.M.; Zaripov, N.G.; Musin, F.F. The effect of titanium dioxide coated carbon fibers on the aluminum alloy matrix composite strength. IOP Conf. Ser. Mater. Sci. Eng. 2019, 537, 022057. [Google Scholar] [CrossRef]
- Galyshev, S.; Postnova, E. Electrochemical Deposition of SiO2-Coatings on a Carbon Fiber. Fibers 2021, 9, 33. [Google Scholar] [CrossRef]
- Wang, X.; Jiang, D.; Wu, G.; Li, B.; Li, P. Effect of Mg content on the mechanical properties and microstructure of Grf/Al composite. Mater. Sci. Eng. A 2008, 497, 31–36. [Google Scholar] [CrossRef]
- Zhang, Y.; Wu, G. Comparative study on the interface and mechanical properties of T700/Al and M40/Al composites. Rare Metals 2010, 29, 102–107. [Google Scholar] [CrossRef]
- Galyshev, S.; Gomzin, A.; Gallyamova, R.; Khodos, I.; Musin, F. On the liquid-phase technology of carbon fiber/aluminum matrix composites. Int. J. Miner. Met. Mater. 2019, 26, 1578–1584. [Google Scholar] [CrossRef]
- Lee, M.; Choi, Y.; Sugio, K.; Matsugi, K.; Sasaki, G. Effect of aluminum carbide on thermal conductivity of the unidirectional CF/Al composites fabricated by low pressure infiltration process. Compos. Sci. Technol. 2014, 97, 1–5. [Google Scholar] [CrossRef]
- Galyshev, S. On the Strength of the CF/Al-Wire Depending on the Fabrication Process Parameters: Melt Temperature, Time, Ultrasonic Power, and Thickness of Carbon Fiber Coating. Metals 2021, 11, 1006. [Google Scholar] [CrossRef]
- Massalski, T.B.; Okamoto, H.; Subramanian, P.; Kacprzak, L.; Scott, W.W. (Eds.) Binary Alloy Phase Diagrams; American Society for Metals: Metals Park, OH, USA, 1986; Volume 1, p. 2. [Google Scholar]
- Oden, L.L.; Gokcen, N.A. Sn-C and Al-Sn-C phase diagrams and thermodynamic properties of C in the alloys: 1550 °C to 2300 °C. Met. Mater. Trans. A 1993, 24, 53–58. [Google Scholar] [CrossRef]
- Mileiko, S.T. Metal and Ceramic Based Composite; Elsevier: Amsterdam, The Netherlands, 1997; p. 690. [Google Scholar]
- Zhong, K.; Zhou, J.; Zhao, C.; Yun, K.; Qi, L. Effect of interfacial transition layer with CNTs on fracture toughness and failure mode of carbon fiber reinforced aluminum matrix composites. Compos. Part A Appl. Sci. Manuf. 2022, 163, 107201. [Google Scholar] [CrossRef]
- Parton, V.Z. Fracture Mechanics: From Theory to Practice; CRC Press: Boca Raton, FL, USA, 1992; p. 208. ISBN 9782881247804. [Google Scholar]
- Watt, W.; Perov, B.V. Strong Fibres Handbook of Composites; North-Holland Publishing Company: Amsterdam, The Netherlands, 1985; Volume 1, p. 752. ISBN 0-444-87505-0. [Google Scholar] [CrossRef]
Figure 1.
Microstructure of the composite wire in an initial state (a) and after heat treatment for 5 min at 500 °C (b), 550 °C (c), and 600 ° C (d).
Figure 1.
Microstructure of the composite wire in an initial state (a) and after heat treatment for 5 min at 500 °C (b), 550 °C (c), and 600 ° C (d).

Figure 2.
Change in the volume fraction of the carbon fiber (a) and the tin structural component (b) depending on the heat-treatment temperature.
Figure 2.
Change in the volume fraction of the carbon fiber (a) and the tin structural component (b) depending on the heat-treatment temperature.

Figure 3.
Dependence of the size of aluminum inclusions on the heat-treatment temperature.

Figure 4.
Carbon fiber after the extraction from the matrix of the composite in an initial state (a) and subjected to heat treatment at 300 °C (b), 400 °C (c), 500 °C (d), 550 °C (e), and 600 °C (f). Images include inserts obtained at 50,000× magnification.
Figure 4.
Carbon fiber after the extraction from the matrix of the composite in an initial state (a) and subjected to heat treatment at 300 °C (b), 400 °C (c), 500 °C (d), 550 °C (e), and 600 °C (f). Images include inserts obtained at 50,000× magnification.

Figure 5.
X-ray diffraction pattern of the fiber extracted from the composite after heat treatment at 600 °C.
Figure 5.
X-ray diffraction pattern of the fiber extracted from the composite after heat treatment at 600 °C.

Figure 6.
Dependence of the strength and elastic modulus of the composite wire at three-point bending on the heat-treatment temperature.
Figure 6.
Dependence of the strength and elastic modulus of the composite wire at three-point bending on the heat-treatment temperature.

Figure 7.
Fracture surfaces of the composite wire in an initial state (a) and after heat treatment at 500 °C (b), 550 °C (c), and 600 °C (d).
Figure 7.
Fracture surfaces of the composite wire in an initial state (a) and after heat treatment at 500 °C (b), 550 °C (c), and 600 °C (d).

Figure 8.
Dependence of the length of the pulled-out fiber part and fracture work on the treatment temperature.
Figure 8.
Dependence of the length of the pulled-out fiber part and fracture work on the treatment temperature.

Figure 9.
State diagram of the Al-Sn system [15].
Figure 9.
State diagram of the Al-Sn system [15].

Figure 10.
Schematic representation of the dependence of the composite strength σ on the shear strength of the interface between the matrix and the fiber τ [4].
Figure 10.
Schematic representation of the dependence of the composite strength σ on the shear strength of the interface between the matrix and the fiber τ [4].

Figure 11.
Plot of the fiber strength versus the length according to the Weibull distribution (red curve) and the manufacturer’s data on the fiber strength (black dots).
Figure 11.
Plot of the fiber strength versus the length according to the Weibull distribution (red curve) and the manufacturer’s data on the fiber strength (black dots).

Figure 12.
Experimental dependence of the work of fracture of the composite wire (blue line) and the calculated dependence of the work expended in overcoming the friction force (red line) on the critical length of the fiber.
Figure 12.
Experimental dependence of the work of fracture of the composite wire (blue line) and the calculated dependence of the work expended in overcoming the friction force (red line) on the critical length of the fiber.

Figure 13.
Plots of the dependencies of the strength of the composite calculated according to the refined mixture rule (blue curve) and the critical stress of crack propagation in the composite (red curve). Experimental composite strength values are marked with black dots.
Figure 13.
Plots of the dependencies of the strength of the composite calculated according to the refined mixture rule (blue curve) and the critical stress of crack propagation in the composite (red curve). Experimental composite strength values are marked with black dots.

Publisher’s Note: MDPI stays neutral with regard to jurisdictional claims in published maps and institutional affiliations. |
© 2022 by the authors. Licensee MDPI, Basel, Switzerland. This article is an open access article distributed under the terms and conditions of the Creative Commons Attribution (CC BY) license (https://creativecommons.org/licenses/by/4.0/).
Share and Cite
MDPI and ACS Style
Galyshev, S.; Atanov, B. The Dependence of the Strength of a Carbon Fiber/Aluminum Matrix Composite on the Interface Shear Strength between the Matrix and Fiber. Metals 2022, 12, 1753. https://doi.org/10.3390/met12101753
AMA Style
Galyshev S, Atanov B. The Dependence of the Strength of a Carbon Fiber/Aluminum Matrix Composite on the Interface Shear Strength between the Matrix and Fiber. Metals. 2022; 12(10):1753. https://doi.org/10.3390/met12101753
Chicago/Turabian StyleGalyshev, Sergei, and Bulat Atanov. 2022. "The Dependence of the Strength of a Carbon Fiber/Aluminum Matrix Composite on the Interface Shear Strength between the Matrix and Fiber" Metals 12, no. 10: 1753. https://doi.org/10.3390/met12101753
Note that from the first issue of 2016, this journal uses article numbers instead of page numbers. See further details here.