
Green Extraction of Phenolic Compounds from Lotus (Nelumbo nucifera Gaertn) Leaf Using Deep Eutectic Solvents: Process Optimization and Antioxidant Activity
 ,
,
Abstract
:
1. Introduction
2. Materials and Methods
2.1. Materials
2.2. Samples
2.3. Preparation of Deep Eutectic Solvents
2.4. Extraction of Flavonoid and Polyphenol Components
2.5. Optimization of Extraction Process
2.6. Traditional Extraction Method Comparison
2.7. Determination of Total Flavonoids
2.8. Determination of Polyphenols
2.9. Antioxidant Activity
2.9.1. DPPH Radical Scavenging Rate Measurement
2.9.2. ABTS Cation Radical Rate Determination
2.9.3. FRAP Total Reduction Capacity Measurement
2.10. LC–MS Structural Analysis
2.11. Statistical Analysis
3. Results and Discussion
3.1. Single-Factor Test
3.1.1. Selection of the Optimal DES
3.1.2. Selection of the Optimal DES Molar Ratio
3.1.3. Selection of Optimal Water Content
3.1.4. Selection of the Optimum DESs Liquid–Solid Ratios
3.1.5. Selection of Optimum DES Extraction Time
3.1.6. Selection of Optimum DES Extraction Temperature
3.2. Results of Response Surface Experiments
3.2.1. Response Surface Experimental Design and Analysis of Variance
3.2.2. Analysis of Validation Test Results
3.2.3. Comparison of the Effects of Different Extraction Methods on Antioxidant Activity
3.3. Correlation Comparison of Different Extraction Methods
3.4. LC–MS Detection Results
4. Conclusions
Author Contributions
Funding
Data Availability Statement
Conflicts of Interest
References
- Zhili, M.; Yu, M.; Yin, L.; Bei, Z.; Yalin, Z.; Ping, W.; Dexin, Z.; Deyuan, L. Effects of maturity and processing on the volatile components, phytochemical profiles and antioxidant activity of Lotus (Nelumbo nucifera) Leaf. Foods 2023, 12, 198. [Google Scholar] [CrossRef]
- Zhu, M.-Z.; Wu, W.; Jiao, L.-L.; Yang, P.-F.; Guo, M.-Q. Analysis of flavonoids in Lotus (Nelumbo nucifera) leaves and their antioxidant activity using macroporous resin chromatography coupled with LC-MS/MS and antioxidant biochemical assays. Molecules 2015, 20, 10553. [Google Scholar] [CrossRef]
- Showkat, Q.A.; Rather, J.A.; Jabeen, A.; Dar, B.N.; Makroo, H.A.; Majid, D. Bioactive components, physicochemical and starch characteristics of different parts of lotus (Nelumbo nucifera Gaertn.) plant: A review. Int. J. Food Sci. Technol. 2021, 56, 2205–2214. [Google Scholar] [CrossRef]
- Ahn, J.H.; Kim, E.S.; Lee, C.; Kim, S.; Cho, S.H.; Hwang, B.Y.; Lee, M.K. Chemical constituents from Nelumbo nucifera leaves and their anti-obesity effects. Bioorganic Med. Chem. Lett. 2013, 23, 3604–3608. [Google Scholar] [CrossRef]
- Hammi, K.M.; Essid, R.; Khadraoui, N.; Ksouri, R.; Majdoub, H.; Tabbene, O. Antimicrobial, antioxidant and antileishmanial activities of Ziziphus lotus leaves. Arch. Microbiol. 2022, 204, 119. [Google Scholar] [CrossRef] [PubMed]
- Da-Hee, K.; Won-Young, C.; Su-Jung, Y.; Sung-Hee, C.; Chi-Ho, L. Effects of Lotus (Nelumbo nucifera) Leaf on quality and antioxidant activity of Yogurt during refrigerated storage. Food Sci. Anim. Resour. 2019, 39, 792–803. [Google Scholar] [CrossRef]
- Lee, H.-J.; Chen, C.-C.; Chou, F.-P.; Wu, C.-H.; Lai, F.-S.; Yang, M.-Y.; Wang, C.-J. Water extracts from Nelumbo nucifera leaf reduced plasma lipids and atherosclerosis in Cholesterol-Fed rabbits. J. Food Biochem. 2010, 34, 779–795. [Google Scholar] [CrossRef]
- Liu, T.; Tan, F.; Long, X.; Pan, Y.; Mu, J.; Zhou, X.; Yi, R.; Zhao, X. Improvement effect of Lotus Leaf flavonoids on carbon Tetrachloride-Induced liver injury in mice. Biomedicines 2020, 2, 41. [Google Scholar] [CrossRef]
- Zheng, H.X.; Han, L.T.; Shi, W.F.; Fang, X.P.; Hong, Y.; Cao, Y. Research advances in Lotus Leaf as Chinese Dietary Herbal Medicine. Am. J. Chin. Med. 2022, 50, 1423–1445. [Google Scholar] [CrossRef] [PubMed]
- Wang, Z.Y.; Cheng, Y.; Zeng, M.M.; Wang, Z.J.; Qin, F.; Wang, Y.Z.; Chen, J.; He, Z.Y. Lotus (Nelumbo nucifera Gaertn.) leaf: A narrative review of its Phytoconstituents, health benefits and food industry applications. Trends Food Sci. Technol. 2021, 112, 631–650. [Google Scholar] [CrossRef]
- Routray, W.; Orsat, V. Microwave-Assisted extraction of flavonoids: A Review. Food Bioprocess Technol. 2012, 5, 409–424. [Google Scholar] [CrossRef]
- Oroian, M.; Ursachi, F.; Dranca, F. Ultrasound-Assisted extraction of polyphenols from crude pollen. Antioxidants 2020, 9, 322. [Google Scholar] [CrossRef] [PubMed]
- Smith, E.L.; Abbott, A.P.; Ryder, K.S. Deep eutectic solvents (DESs) and their applications. Chem. Rev. 2014, 114, 11060–11082. [Google Scholar] [CrossRef] [PubMed]
- Luo, S.B.; Ren, X.M.; Shi, X.Q.; Zhong, K.; Zhang, Z.J.; Wang, Z.T. Study on enhanced extraction and seasonal variation of secondary metabolites in Eucommia ulmoides leaves using deep eutectic solvents. J. Pharm. Biomed. Anal. 2022, 209, 114514. [Google Scholar] [CrossRef] [PubMed]
- Babu, S.M.; Kumar, V.S.; Mansi, C.; Prashant, S. A mini review on synthesis, properties and applications of deep eutectic solvents. J. Indian Chem. Soc. 2021, 98, 100210. [Google Scholar] [CrossRef]
- Sillero, L.; Prado, R.; Welton, T.; Labidi, J. Extraction of flavonoid compounds from bark using sustainable deep eutectic solvents. Sustain. Chem. Pharm. 2021, 24, 100544. [Google Scholar] [CrossRef]
- Dai, Y.; Witkamp, G.J.; Verpoorte, R.; Choi, Y.H. Natural deep eutectic solvents as a new extraction media for phenolic metabolites in Carthamus tinctorius L. Anal. Chem. 2013, 85, 6272–6278. [Google Scholar] [CrossRef] [PubMed]
- Sami, D.A.; Fadzelly, A.B.M.; Mohamed, A.; Fatimah, S.S.; Fathi, M.H.A.; Azman, M. Deep Eutectic Solvents (DESs) as green extraction media of beneficial bioactive phytochemicals. Separations 2021, 8, 176. [Google Scholar] [CrossRef]
- Bárbara, S.; Vanessa, T.M.; Gerardo, Á.; Mendiola, J.A. Deep eutectic solvents for the extraction of bioactive compounds from natural sources and agricultural By-Products. Appl. Sci. 2021, 11, 4897. [Google Scholar] [CrossRef]
- Wojeicchowski, P.; Ferreira, A.M.; Abranches, D.O.; Mafra, M.R.; Coutinho, J.A.P. Using Cosmo-Rs in the design of deep eutectic solvents for thie extraction of antioxidants from rosemary. ACS Sustain. Chem. Eng. 2020, 8, 12132–12141. [Google Scholar] [CrossRef]
- Zhang, H.; Hao, F.; Yao, Z.; Zhu, J.; Jing, X.; Wang, X. Efficient extraction of flavonoids from Polygonatum sibiricum using a deep eutectic solvent as a green extraction solvent. Microchem. J. 2022, 175, 107168. [Google Scholar] [CrossRef]
- Kimia, J.; Hossein, F.M.; Patrice, E. Deep eutectic solvents (DESs): A short overview of the thermophysical properties and current use as base fluid for heat transfer nanofluids. J. Mol. Liq. 2021, 321, 114752. [Google Scholar] [CrossRef]
- Henkel, S.; Beutel, S. Messung des pH-Werts in der Biotechnologie. Chem. Ing. Tech. 2013, 6, 872–885. [Google Scholar] [CrossRef]
- Bubalo, M.C.; Curko, N.; Tomasevic, M.; Ganic, K.K.; Redovnikovic, I.R. Green extraction of grape skin phenolics by using deep eutectic solvents. Food Chem. 2016, 200, 159–166. [Google Scholar] [CrossRef]
- Ji, Y.B.; Guo, S.Z.; Wang, B.; Yu, M. Extraction and determination of flavonoids in Carthamus tinctorius. Open Chem. 2018, 16, 1129–1133. [Google Scholar] [CrossRef]
- Sutivisedsak, N.; Cheng, H.N.; Willett, J.L.; Lesch, W.C.; Tangsrud, R.R.; Biswas, A. Microwave-assisted extraction of phenolics from bean (Phaseolus vulgaris L.). Food Res. Int. 2010, 43, 516–519. [Google Scholar] [CrossRef]
- Chen, X.; Liang, L.; Han, C. Borate suppresses the scavenging activity of gallic acid and plant polyphenol extracts on DPPH radical: A potential interference to DPPH assay. LWT 2020, 131, 109769. [Google Scholar] [CrossRef]
- Ali, A.R. Review on extraction of phenolic compounds from natural sources using green deep eutectic solvents. J. Agric. Food Chem. 2021, 69, 878–912. [Google Scholar] [CrossRef]
- Dai, Y.; Witkamp, G.-J.; Verpoorte, R.; Choi, Y.H. Tailoring properties of natural deep eutectic solvents with water to facilitate their applications. Food Chem. 2015, 187, 14–19. [Google Scholar] [CrossRef] [PubMed]
- Jablonský, M.; Škulcová, A.; Malvis, A.; Šima, J. Extraction of value-added components from food industry based and agro-forest biowastes by deep eutectic solvents. J. Biotechnol. 2018, 282, 46–66. [Google Scholar] [CrossRef]
- Cao, Q.; Li, J.; Xia, Y.; Li, W.; Luo, S.; Ma, C.; Liu, S.; Ibañez, E.; Chemat, F. Green Extraction of Six Phenolic Compounds from Rattan (Calamoideae faberii) with Deep Eutectic Solvent by Homogenate-Assisted Vacuum-Cavitation Method. Molecules 2018, 24, 113. [Google Scholar] [CrossRef]
- Alberto, G.; Mert, A.; Santiago, A. Molecular dynamics study on water confinement in deep eutectic solvents. J. Mol. Liq. 2021, 339, 116758. [Google Scholar] [CrossRef]
- Achkar, T.E.; Fourmentin, S.; Greige-Gerges, H. Deep eutectic solvents: An overview on their interactions with water and biochemical compounds. J. Mol. Liq. 2019, 288, 111028. [Google Scholar] [CrossRef]
- Balaraman, H.B.; Rathnasamy, S.K. Selective purification of protease from ginger and sodom apple by ultrasound assisted liquid-liquid microextraction using natural deep eutectic solvent. Microchem. J. 2019, 150, 104132. [Google Scholar] [CrossRef]
- Vorobyova, V.; Skiba, M.; Vasyliev, G. Extraction of phenolic compounds from tomato pomace using choline chloride-based deep eutectic solvents. J. Food Meas. Charact. 2022, 16, 1087–1104. [Google Scholar] [CrossRef]
- Chen, S.; Fang, L.C.; Xi, H.F.; Guan, L.; Fang, J.B.; Liu, Y.L.; Wu, B.H.; Li, S.H. Simultaneous qualitative assessment and quantitative analysis of flavonoids in various tissues of lotus (Nelumbo nucifera) using high performance liquid chromatography coupled with triple quad mass spectrometry. Anal. Chim. Acta 2012, 724, 127–135. [Google Scholar] [CrossRef]
- Wang, Y.B.; Lin, B.J.; Li, Z.X. Effect of Lactobacillus plantarum Fermentation on Metabolites in Lotus Leaf Based on Ultra-High-Performance Liquid Chromatography-High-Resolution Mass Spectrometry. Fermentation 2022, 8, 599. [Google Scholar] [CrossRef]


| Number | Hydrogen Bond Receptor (HBA) | Hydrogen Bonded Donor (HBD) | Mole Ratio | Water Content (%) | Viscosity (mpa s) | PH Value | Character |
|---|---|---|---|---|---|---|---|
| DES-1 | Choline chloride | Glycerol | 1:2 | 20% | 67.03 | 5.75 | Transparent liquid |
| DES-2 | Propylene glycol | 1:2 | 39.1 | 5.88 | Transparent liquid | ||
| DES-3 | Lactic acid | 1:2 | 31.3 | 1.22 | Transparent liquid | ||
| DES-4 | Citric acid | 1:2 | 213 | 0.07 | Transparent liquid | ||
| DES-5 | Malic acid | 1:2 | 138.8 | 0.11 | Transparent liquid | ||
| DES-6 | D(+)-Glucose | 1:2 | 222.8 | 3.6 | Transparent liquid | ||
| DES-7 | Urea | 1:2 | 26.4 | 9.28 | Transparent liquid | ||
| DES-8 | Betaine | Glycerol | 1:2 | 147.3 | 6.82 | Transparent liquid | |
| DES-9 | Propylene glycol | 1:2 | 131.3 | 7.37 | Transparent liquid | ||
| DES-10 | Lactic acid | 1:2 | 66.5 | 3.57 | Transparent liquid | ||
| DES-11 | Citric acid | 1:2 | 711 | 2.27 | Transparent liquid | ||
| DES-12 | Malic acid | 1:2 | 424.33 | 2.57 | Transparent liquid | ||
| DES-13 | D(+)-Glucose | 1:2 | 470 | 5.37 | Transparent liquid | ||
| DES-14 | Lactic acid | Glycerol | 1:2 | 66.03 | 2.11 | Transparent yellow liquid | |
| DES-15 | Propylene glycol | 1:2 | 33 | 2.24 | Transparent yellow liquid | ||
| DES-16 | D(+)-Glucose | 1:2 | 351.17 | 1.85 | Transparent yellow liquid | ||
| DES-17 | Citric acid | Glycerol | 1:2 | 326.67 | 1.75 | Transparent liquid | |
| DES-18 | Propylene glycol | 1:2 | 106.67 | 1.67 | Transparent liquid | ||
| DES-19 | D(+)-Glucose | 1:2 | 627 | 1.65 | Transparent liquid |
| Factor | Level | ||
|---|---|---|---|
| −1 | 0 | 1 | |
| Moisture content (%) | 20 | 30 | 40 |
| Extraction temperature (°C) | 40 | 50 | 60 |
| Extraction time (min) | 45 | 60 | 75 |
| Liquid–solid ratio (mL/g) | 30 | 40 | 50 |
| Number | Factors | Total Flavonoid Yield mg/g | Polyphenol Yield mg/g | |||
|---|---|---|---|---|---|---|
| A: Water Content % | B: Liquid-Solid Ratio mL/g | C: Extraction Temperature °C | D: Extraction Time min | |||
| 1 | −1 | −1 | 0 | 0 | 121.24 ± 3.22 | 103.93 ± 3.37 |
| 2 | 0 | −1 | 1 | 0 | 117.06 ± 1.48 | 109.63 ± 2.15 |
| 3 | 0 | 0 | −1 | −1 | 101.06 ± 2.76 | 94.59 ± 1.71 |
| 4 | 1 | 1 | 0 | 0 | 82.37 ± 2.02 | 102.45 ± 4.90 |
| 5 | 0 | 0 | 0 | 0 | 130.83 ± 3.33 | 111.56 ± 3.35 |
| 6 | 1 | 0 | 0 | 1 | 110.49 ± 0.91 | 94.52 ± 1.48 |
| 7 | 1 | 0 | 0 | −1 | 96.59 ± 2.41 | 95.95 ± 0.58 |
| 8 | 1 | −1 | 0 | 0 | 116.34 ± 3.50 | 96.03 ± 3.99 |
| 9 | 0 | −1 | 0 | 1 | 117.10 ± 4.75 | 91.34 ± 6.33 |
| 10 | 0 | 0 | 0 | 0 | 132.91 ± 4.11 | 114.91 ± 5.97 |
| 11 | −1 | 0 | 0 | 1 | 109.32 ± 3.04 | 98.88 ± 4.61 |
| 12 | 0 | 1 | 0 | −1 | 87.33 ± 1.96 | 101.01 ± 2.85 |
| 13 | 1 | 0 | 1 | 0 | 108.77 ± 3.31 | 100.35 ± 1.69 |
| 14 | 0 | 0 | 1 | 1 | 110.73 ± 0.75 | 103.57 ± 0.56 |
| 15 | −1 | 0 | 1 | 0 | 121.43 ± 8.10 | 102.88 ± 1.45 |
| 16 | −1 | 1 | 0 | 0 | 86.30 ± 0.29 | 102.70 ± 1.63 |
| 17 | 0 | 1 | −1 | 0 | 86.63 ± 3.84 | 99.04 ± 4.28 |
| 18 | 0 | 0 | −1 | 1 | 99.66 ± 4.36 | 81.17 ± 1.40 |
| 19 | 0 | 1 | 0 | 1 | 87.79 ± 2.19 | 102.53 ± 3.49 |
| 20 | 0 | 0 | 0 | 0 | 127.36 ± 4.29 | 110.26 ± 5.26 |
| 21 | 0 | 1 | 1 | 0 | 97.48 ± 0.80 | 109.17 ± 4.67 |
| 22 | 0 | −1 | −1 | 0 | 118.59 ± 2.94 | 91.33 ± 5.58 |
| 23 | −1 | 0 | 0 | −1 | 103.76 ± 2.94 | 96.72 ± 3.83 |
| 24 | 0 | 0 | 0 | 0 | 129.23 ± 15.84 | 112.54 ± 1.64 |
| 25 | 0 | −1 | 0 | −1 | 113.48 ± 3.53 | 95.82 ± 1.76 |
| 26 | 0 | 0 | 0 | 0 | 121.12 ± 3.07 | 115.92 ± 5.67 |
| 27 | 1 | 0 | −1 | 0 | 104.50 ± 5.71 | 90.03 ± 1.87 |
| 28 | −1 | 0 | −1 | 0 | 102.38 ± 0.39 | 91.56 ± 0.31 |
| 29 | 0 | 0 | 1 | −1 | 107.21 ± 1.65 | 96.65 ± 1.18 |
| Source | Sum of Squares | df | Mean Square | F-Value | p-Value | |
|---|---|---|---|---|---|---|
| Model | 5500.78 | 14 | 392.91 | 25.26 | <0.0001 | ** |
| A | 53.6 | 1 | 53.6 | 3.45 | 0.0846 | |
| B | 2578.55 | 1 | 2578.55 | 165.76 | <0.0001 | ** |
| C | 207.17 | 1 | 207.17 | 13.32 | 0.0026 | ** |
| D | 54.88 | 1 | 54.88 | 3.53 | 0.0813 | |
| AB | 0.2343 | 1 | 0.2343 | 0.0151 | 0.9041 | |
| AC | 54.62 | 1 | 54.62 | 3.51 | 0.082 | |
| AD | 17.36 | 1 | 17.36 | 1.12 | 0.3087 | |
| BC | 38.31 | 1 | 38.31 | 2.46 | 0.1389 | |
| BD | 2.52 | 1 | 2.52 | 0.1617 | 0.6937 | |
| CD | 6.06 | 1 | 6.06 | 0.3897 | 0.5425 | |
| A2 | 741.76 | 1 | 741.76 | 47.68 | <0.0001 | ** |
| B2 | 1395.06 | 1 | 1395.06 | 89.68 | <0.0001 | ** |
| C2 | 548.11 | 1 | 548.11 | 35.23 | <0.0001 | ** |
| D2 | 1106.71 | 1 | 1106.71 | 71.14 | <0.0001 | ** |
| Residual | 217.78 | 14 | 15.56 | |||
| Lack of Fit | 136.88 | 10 | 13.69 | 0.6767 | 0.7198 | |
| Pure Error | 80.91 | 4 | 20.23 | |||
| Cor Total | 5718.57 | 28 |
| Source | Sum of Squares | df | Mean Square | F-Value | p-Value | |
|---|---|---|---|---|---|---|
| Model | 1824.14 | 14 | 130.3 | 22.77 | <0.0001 | ** |
| A | 25.07 | 1 | 25.07 | 4.38 | 0.055 | |
| B | 69.22 | 1 | 69.22 | 12.1 | 0.0037 | ** |
| C | 462.89 | 1 | 462.89 | 80.9 | <0.0001 | ** |
| D | 6.33 | 1 | 6.33 | 1.11 | 0.3108 | |
| AB | 14.59 | 1 | 14.59 | 2.55 | 0.1326 | |
| AC | 0.256 | 1 | 0.256 | 0.0447 | 0.8355 | |
| AD | 3.2 | 1 | 3.2 | 0.559 | 0.467 | |
| BC | 16.75 | 1 | 16.75 | 2.93 | 0.1091 | |
| BD | 8.99 | 1 | 8.99 | 1.57 | 0.2305 | |
| CD | 103.37 | 1 | 103.37 | 18.07 | 0.0008 | ** |
| A2 | 366.1 | 1 | 366.1 | 63.98 | <0.0001 | ** |
| B2 | 98.12 | 1 | 98.12 | 17.15 | 0.001 | ** |
| C2 | 443.17 | 1 | 443.17 | 77.45 | <0.0001 | ** |
| D2 | 704.02 | 1 | 704.02 | 123.04 | <0.0001 | ** |
| Residual | 80.1 | 14 | 5.72 | |||
| Lack of Fit | 58.14 | 10 | 5.81 | 1.06 | 0.5224 | |
| Pure Error | 21.96 | 4 | 5.49 | |||
| Cor Total | 1904.24 | 28 |
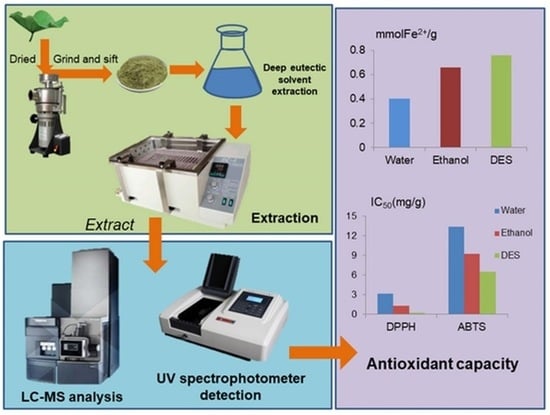
| Water | Ethanol | DESs | |
|---|---|---|---|
| FRAP (mmolFe2+/g) | 0.40 | 0.66 | 0.76 |
| DPPH-IC50 (mg/g) | 3.12 | 1.29 | 0.25 |
| ABTS-IC50 (mg/g) | 13.38 | 9.26 | 6.48 |
| TPC | TFC | ABTS | DPPH | FRAP | |
|---|---|---|---|---|---|
| TPC | 1 | ||||
| TFC | 0.972 ** | 1 | |||
| ABTS | 0.971 ** | 0.941 ** | 1 | ||
| DPPH | 0.829 ** | 0.773 ** | 0.892 ** | 1 | |
| FRAP | 0.843 ** | 0.77 ** | 0.877 ** | 0.903 ** | 1 |
| NO. | Rt (min) | Formula | Theoretical MASS (Da) | Calculated MASS (Da) | MASS ERROR (ppm) | Component Name |
|---|---|---|---|---|---|---|
| 1 | 0.50 | C16H12O5 | 284.263 | 284.0685 | −1.1 | Oroxylin A |
| 2 | 0.60 | C15H10O7 | 302.236 | 302.0427 | 1.6 | Quercetin |
| 3 | 0.67 | C15H10O6 | 286.236 | 286.0471 | 1.7 | Kaempferol |
| 4 | 1.14 | C16H12O7 | 316.2623 | 316.0583 | −3.8 | Isorhamnetin |
| 5 | 10.19 | C7H6O4 | 154.12 | 154.0266 | 0.0 | Protocatechuic acid |
| 6 | 14.53 | C20H18O11 | 434.35 | 434.0849 | 1.1 | Quercetin 3-O-arabinoside |
| 7 | 14.58 | C21H18O13 | 478.36 | 478.0747 | −3.3 | Quercetin 3-O-glucuronide |
| 8 | 14.99 | C22H20O11 | 460.4 | 460.1006 | 2.6 | Oroxindin |
| 9 | 15.28 | C21H18O12 | 462.36 | 462.0798 | 0.4 | Kaempferol 3-O-glucuronide |
| 10 | 15.99 | C9H8O4 | 180.157 | 180.0423 | 3.3 | Caffeic acid |
| 11 | 16.86 | C22H22O12 | 478.403 | 478.1111 | −1.9 | Isorhamnetin 3-O-hexose |
| 12 | 16.91 | C22H22O11 | 462.41 | 462.1162 | 1.7 | Diosmetin 7-O-hexose |
| 13 | 17.96 | C21H20O12 | 464.376 | 464.1033 | 3.2 | Quercetin 3-O-galactoside (hyperoside) |
| 14 | 18.32 | C21H20O11 | 448.38 | 448.1006 | −1.8 | Kaempferol 3-O-glucoside (astragalin) |
| 15 | 18.37 | C21H20O12 | 464.376 | 464.1033 | −4.3 | Quercetin 3-O-glucoside (isoquercitrin) |
| 16 | 18.37 | C22H20O13 | 492.386 | 492.0904 | −1.0 | Isorhamnetin 3-O-glucuronide |
| 17 | 26.80 | C21H20O13 | 480.376 | 480.0982 | 0.8 | Myricetin 3-O-hexose |
| 18 | 26.80 | C27H30O16 | 610.518 | 610.1534 | 4.3 | Quercetin 3-O-rhamnopyranosyl-(1→2)-glucopyranoside |
| 19 | 27.02 | C26H28O16 | 596.491 | 596.1377 | 2.8 | Quercetin 3-O-arabinopyranosyl-(1→2)-galactopyranoside |
Disclaimer/Publisher’s Note: The statements, opinions and data contained in all publications are solely those of the individual author(s) and contributor(s) and not of MDPI and/or the editor(s). MDPI and/or the editor(s) disclaim responsibility for any injury to people or property resulting from any ideas, methods, instructions or products referred to in the content. |
© 2023 by the authors. Licensee MDPI, Basel, Switzerland. This article is an open access article distributed under the terms and conditions of the Creative Commons Attribution (CC BY) license (https://creativecommons.org/licenses/by/4.0/).
Share and Cite
Yang, J.; Yan, Z.; Li, L.; Zhang, L.; Zhao, M.; Yi, H.; Wang, Z.; Li, G.; Wang, Z.; Li, M.; et al. Green Extraction of Phenolic Compounds from Lotus (Nelumbo nucifera Gaertn) Leaf Using Deep Eutectic Solvents: Process Optimization and Antioxidant Activity. Separations 2023, 10, 272. https://doi.org/10.3390/separations10050272
Yang J, Yan Z, Li L, Zhang L, Zhao M, Yi H, Wang Z, Li G, Wang Z, Li M, et al. Green Extraction of Phenolic Compounds from Lotus (Nelumbo nucifera Gaertn) Leaf Using Deep Eutectic Solvents: Process Optimization and Antioxidant Activity. Separations. 2023; 10(5):272. https://doi.org/10.3390/separations10050272
Chicago/Turabian StyleYang, Jiwei, Zhi Yan, Lingna Li, Lifen Zhang, Mengjian Zhao, Huixiang Yi, Ziying Wang, Gang Li, Zhenhua Wang, Mei Li, and et al. 2023. "Green Extraction of Phenolic Compounds from Lotus (Nelumbo nucifera Gaertn) Leaf Using Deep Eutectic Solvents: Process Optimization and Antioxidant Activity" Separations 10, no. 5: 272. https://doi.org/10.3390/separations10050272