

Adsorption Properties and Preparative Separation of Flavonoids from Rhizoma Smilacis Glabrae Using Macroporous Resins
The Key Laboratory of Prescription Effect and Clinical Valuation of State Administration of Traditional Chinese Medicine of China, School of Pharmacy, Binzhou Medical University, Yantai 264003, China
*
Author to whom correspondence should be addressed.
Separations 2022, 9(12), 431; https://doi.org/10.3390/separations9120431
Submission received: 11 November 2022
/
Revised: 30 November 2022
/
Accepted: 9 December 2022
/
Published: 11 December 2022
Abstract
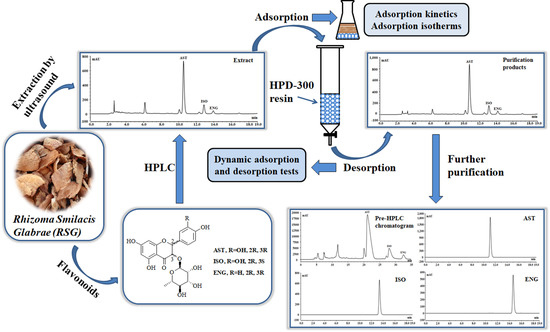
:Astilbin (AST), isoastilbin (ISO), and engeletin (ENG) are the main flavonoids in Rhizoma Smilacis Glabrae (RSG) and have many biological activities. In this study, the adsorption kinetics of AST, ISO, and ENG on HPD-300 resin was investigated and their adsorption processes conformed to a pseudo-second-order kinetics equation. The fitting curves of the intraparticle diffusion model showed three linear stages and did not pass through the origin, meaning the adsorption process of the three flavonoids was controlled by boundary layer diffusion and intraparticle diffusion. Their adsorption isotherms were also constructed and could be well-fitted by the Langmuir equation. A low temperature was favorable for their adsorption. The relative adsorption capacity of ENG was significantly higher than those of the other two compounds, indicating that the substitution pattern on ring B has an important impact on the adsorption of flavonoids with resin. The separation process was optimized by dynamic adsorption/desorption experiments. After separation, the purities of AST, ISO, and ENG increased from 5.55%, 1.22%, and 0.45% to 27.46%, 6.14%, and 2.27%, respectively, and all the recoveries exceeded 75%. After that, the three compounds were further separated by preparative HPLC and silica gel chromatography. In the final product, the purities of AST, ISO, and ENG could reach above 98%.
1. Introduction
The dried rhizome of Smilax glabra Roxb. is a famous traditional Chinese medicine with a long usage history in many countries, often called Rhizoma Smilacis Glabrae (RSG) [1,2]. In China, it is known as “TufuLing”, which has the effects of clearing heat, detoxication, removing carbuncles and relieving dampness recorded in Chinese Pharmacopoeia [3]. In clinics, RSG is usually used to treat syphilis, eczema, nephritis, diabetes, and rheumatoid arthritis [2,4]. Moreover, it has been confirmed that the extract of RSG has many kinds of physiological activities, including anti-inflammatory, hypoglycemic, antioxidant, anti-tumor and immunomodulatory effects, and so on [5,6,7]. Recent studies have shown that RSG is rich in various chemical components, such as flavonoids, steroid saponins, phenylpropanoids and phenolic acids, among which flavonoids are one of the main active components [2,8,9].
Astilbin (AST), isoastilbin (ISO) and engeletin (ENG) are flavonoids with similar structures (Figure 1) in RSG, of which AST is the index for determining the quality of RSG because of its highest content [10,11]. The content of AST in RSG shall not be less than 0.45% according to the Chinese pharmacopoeia [3]. Recent reports confirmed that AST has broad and varied biological activities including antioxidant, antidepressant, antimicrobial and insecticidal, immunosuppressive, anti-inflammatory, and anti-diabetic activities, without any obvious toxicity [11,12,13,14]. It has been reported that ENG can relieve osteoarthritis in vivo, and attenuate oxidative stress and neuroinflammation [15,16]. ISO also showed strong antioxidant and anti-inflammatory activities [17]. Due to the diverse pharmacological activities of flavonoids in RSG, it is necessary to develop an effective preparation method for purifying these flavonoids with high purity, especially those with low content.
As a separation material with many advantages, such as excellent adsorption and desorption performance, fast adsorption speed, low cost, and easy regeneration, macroporous resin is widely used in the extraction and separation of many effective components of traditional Chinese medicine (TCM) [18,19,20,21]. It is often used in combination with other separation technologies such as reversed-phase preparative chromatography, to separate the effective components [22]. In recent years, we found that HPD-300 resin has a good separation effect on flavonoids and used it to separate several flavonoids and chromones from TCM [23,24,25]. The study was conducted to explore the adsorption thermodynamics and adsorption kinetics of three flavonoids from RSG on the HPD-300 resin and discuss the influence of the small differences in structure on the relative adsorption capacities of flavonoids. In addition, an effective process route for the separation of AST, ISO, and ENG from RSG with high purities was established using macroporous resin coupled with preparative HPLC and silica gel column chromatography.
2. Materials and Methods
2.1. Materials and Chemicals
AST, ISO, and ENG (purity > 98%) standards were obtained from the Chengdu Pufei De Biotech Co., Ltd. (Chengdu, China). RSG was purchased from the Anxing Chinese Herbal Medicine Co., Ltd. (Anguo, China). Analytical pure ethanol, dichloromethane, methanol, and chromatographic-grade methanol were purchased from Tian Jin Shi Hui Hang Hua Gong Ke Ji You Xian Gong Si (Tianjin, China). Chromatographic-grade acetonitrile was provided by Tianjin Kemiou Chemical Reagent Co., Ltd. (Tianjin, China). Analytical pure phosphoric acid was provided by the Yantai Sanhe Chemical Reagent Co., Ltd. (Yantai, China). Wahaha purified water (Hangzou Wahaha Group Co., Ltd. (Hangzhou, China)) was used as HPLC mobile phase. Distilled water was prepared by an ultrapure water machine (Sichuan ULUPURE Ultrapure Technology Co., Ltd. (Chengdu China)). Nonpolar HPD-300 resin was obtained from the Cangzhou Bon Adsorber Technology Co., Ltd. (Cangzhou, China). Its surface area is 800–870 m2/g and pore diameter is 5.0–5.5 nm. Column chromatography silica gel (200–300 mesh) was provided by the Qingdao Haiyang Chemical Co., Ltd. (Qingdao, China).
2.2. Extration of RSG
RSG materials were crushed into powders and filtered with a No. 1 sieve (10 mesh). The powders (3.0 kg) were soaked in 70% ethanol for 24 h for making the solvent penetrate into the plant cells better, with the material liquid ratio of 1:10. Then, the samples were extracted twice by ultrasonic extraction using a KQ-400DE ultrasonic cleaner from the Kun Shan Ultrasonic Instruments Co., Ltd. (Kunshan, China) for 1 h each time. The frequency was 40 kHz and the power was 400 W. After the extraction was completed, the extract solution was filtered, merged, and recovered using a rotary evaporator to yield 340 g of RSG extracts.
2.3. HPLC Analysis of the Three Flavonoids
A Thermo Fisher U3000 system equiped with a H&E SP ODS-A column (4.6 × 250 mm, 5 μm) was employed for determining the concentrations of AST, ISO and ENG. 291 nm was selected as the detection wavelength. The injection volume was 20 μL. The mobile phase A was 0.1% phosphoric acid and B was methanol. The flow rate was 1 mL/min. The gradient elution procedure was as follows: 0–15 min: 40–55% solvent B, 15–16 min: 55–75% solvent B, 16–18 min: 75–80% solvent B, 18–19 min: 80–100% solvent B. The column temperature was set to 25 °C. According to the above method, the standard curves were established for the three standards and the retention times were 10.605, 12.925, and 13.982 min for AST, ISO, and ENG, respectively. The standard curves (Figure S1) of AST, ISO, and ENG were Y = 0.7601X + 1.6056 (R2 = 0.9995), Y = 0.6558X + 0.5913 (R2 = 0.9997), and Y = 0.7673X − 0.0875 (R2 = 0.9999), respectively, where Y stood for peak area and X was the concentration (µg/mL).
2.4. Adsorption Kinetics
The HPD-300 resin was pretreated according to the method described in reference [23]. RSG crude extracts were added into distilled water, fully dissolved with ultrasonic assistance, centrifuged at 4000 rpm for 10 min, and the supernatant was taken to obtain crude extract aqueous solution. The pre-treated HPD-300 resin was accurately weighed at 1.0 g, placed in a 50 mL conical flask, then 25 mL of RSG aqueous solution with a concentration of 30 mg/mL was poured. All flasks were placed in a constant-temperature shaker with a rotating speed of 120 rpm at 25 °C for continuous shaking adsorption. Eleven aliquots (each 200 μL) were taken from the flask when the adsorption time was 15, 30, 45, 60, 120, 180, 240, 300, 360, 480, and 600 min, respectively. The concentrations of AST, ISO, and ENG in each aliquot sample were measured using the HPLC method. The above experiment was repeated three times. The adsorption capacities and adsorption rates of AST, ISO, and ENG on HPD-300 resin at different adsorption times were quantified according to the following formula:
where Qt (mg/g) means the adsorption capacity at different adsorption time; R (%) stands for the adsorption rate; Ct (mg/mL) is the concentration of flavonoids in the solution at different adsorption time; C0 (mg/mL) is the initial concentration; V0 (mL) is the volume of RSG aqueous solution; and W (g) stands for the resin weight.
The adsorption kinetic data of AST, ISO, and ENG were fitted by three kind of adsorption kinetics models, including pseudo-first-order, pseudo-second-order, and intraparticle diffusion kinetics models. The formulas of the three kinetic models are as follows:
The pseudo-first-order formula:
The pseudo-second-order formula:
The intraparticle diffusion formula:
where t (min) means the adsorption time; Qe (mg/g) is the equilibrium adsorption capacity; K1 is the constant of the pseudo-first-order model; K2 is the constant of pseudo-second-order model; Ki means the constant of the intraparticle diffusion model; and C stands for a constant of the intraparticle diffusion model.
2.5. Adsorption Isotherms
According to the method in 2.4, the RSG extracts were prepared into aqueous solutions with concentrations of 15, 20, 30, 40, and 50 mg/mL, respectively. A total of 1.0 g of HPD-300 resin was put into a series of 50 mL conical flasks, and then 25 mL of RSG aqueous solutions of different concentrations were added. All conical flasks were put into a constant-temperature shaker and continuously shaken at different temperatures (25, 35, and 45 °C) to complete adsorption. The shaking speed was 120 rpm, and the shaking time was 12 h. The initial and equilibrium concentrations of AST, ISO, and ENG in the RSG extracts’ aqueous solutions were determined using the HPLC method. The adsorption capacities of AST, ISO, and ENG at different adsorption temperatures were calculated according to Formula (1). The adsorption isotherm experiment was repeated three times.
The adsorption isotherms of the three compounds were fitted by the Langmuir and Freundlich equations. The two equations are as follows:
Langmuir equation:
Freundlich equation:
where Qe (mg/g) is the same as that in Equation (3); Ce (mg/mL) stands for the concentration at adsorption equilibrium; Qmax (mg/g) means the maximum adsorption capacity; KL (mL/mg) is the adsorption constant of the Langmuir equation; KF stands for the Freundlich constant; and 1/n is an empirical constant.
2.6. Dynamic Adsorption and Desorption Tests
A total of 8.0 g of HPD-300 resins were filled into a glass column (12 mm × 350 mm) with a bed volume (BV) of 14 mL. Firstly, RSG extracts were prepared into an aqueous solution and loaded onto the resin column at a flow rate of 4 BV/h for dynamic adsorption. After that, the resin column with saturated adsorption was gradient eluted with deionized water (5 BV), 10% (5 BV), 50% (5 BV), and 70% (5 BV) ethanol at a rate of 4 BV/h, respectively. The concentrations of AST, ISO, and ENG in the efflux and eluent were determined using the HPLC method for drawing breakthrough and desorption curves.
2.7. The Purification of Flavonoids by Preparative HPLC and Silica Gel Column Chromatography
In order to obtain high-purity flavonoids, the products purified by the resin were further separated by preparative HPLC and silica gel column chromatography. The purification was firstly carried out on an Aglient SD-1 chromatograph equipped with a YMC-pack ODS-A column (20 × 250 mm, 5 μm). The mobile phase was acetonitrile (A) and water (B). The gradient conditions were as follows: 0–35 min, 20–23% solvent A. The flow rate was 10 mL/min. The detection wavelength was selected as 291 nm. The injection volume was 1.0 mL. When the peaks of AST, ISO, and ENG appeared on the chromatogram, the effluents were recovered and evaporated to dryness under reduced pressure, respectively. The crude products of AST, ISO, and ENG were further separated by silica gel column chromatography with dichloromethane-methanol (10:1) as eluent, respectively.
2.8. Data Processing
A Graphpad Prism was used for data processing, and data were presented as mean ± standard deviation (SD). One-way analysis of variance (ANOVA) was used to compare different groups. Differences with p < 0.05 indicated statistical significance.
3. Results and Discusstion
3.1. Adsorption Kinetics
The adsorption kinetics curves of AST, ISO, and ENG were studied at 25 °C and plotted with the adsorption time as the abscissa and the adsorption capacity as the ordinate. As observed in Figure 2A, the adsorption capacity of AST on the resin increased rapidly and showed a linear growth characteristic within the first 1 h. The increase of adsorption capacity slowed down between 2–4 h and reached adsorption equilibrium in about 5–6 h. As shown in Figure 2B, ISO and ENG had similar adsorption kinetic curves to AST because of their similar chemical structure. However, the relative adsorption capacities (i.e., adsorption rate) on the resin of the three flavonoids were different. As described in Figure 2C, the relative adsorption capacities of AST and ISO were relatively close in the whole adsorption process. As shown in Figure 1, ISO is a stereoisomer of AST, and their configurations at C-2 and C-3 positions are different. This indicated that the impact of the C-2 and C-3 positions’ configurations on the relative adsorption capacity was very small. However, the relative adsorption capacity of ENG was much greater than those of the other two flavonoids. The structure of ENG is one phenolic hydroxyl group less than those of AST and ISO at C-3′. Hence, the reason may be that the hydrophobic effect between the B ring of ENG and the resin was stronger than the other two compounds due to the lack of the C-3′ phenolic hydroxyl group. The above experimental results indicated that the substitution mode of the B ring will greatly affect the combination between flavonoids and the HPD-300 resin. The adsorption kinetic data of the three flavonoids were fitted by three kinetics models, and their fitting parameters were shown in Table 1. The correlation coefficients (R2) of the pseudo-second-order kinetic model were greater than 0.9997 for all three compounds, which were much higher than those of the pseudo-first-order kinetic model. Furthermore, the calculated Qe values of AST, ISO, and ENG in the pseudo-second-order kinetic model were closer to those measured in the experiment. In conclusion, the pseudo-second-order kinetic model was more suitable to describe the adsorption kinetic process of the three compounds on HPD-300 resin. As shown in Table 1 and Figure 2D, the fitting figures of the intraparticle diffusion kinetic model for AST, ISO, and ENG presented the characteristics of the multilinear stage. The whole process of the three compounds was divided into three stages, including boundary layer diffusion (0–60 min), the gradual adsorption stage (60–240 min), and the last equilibrium stage. The curves of the three flavonoids did not cross the origin, indicating that their adsorption process on the HPD-300 resin was controlled by both boundary layer diffusion and intraparticle diffusion.
3.2. Adsorption Isotherms
The RSG extracts with different concentrations were mixed with the resin to obtain the adsorption capacities of AST, ISO, and ENG at different temperatures. The adsorption isotherm was plotted with the equilibrium concentration as the abscissa and the adsorption capacity as the ordinate. The equilibrium adsorption capacities of the three flavonoids were increased when the equilibrium concentration rose (Figure 3A–C). At the same initial concentration, the adsorption capacities of the three flavonoids showed a downward trend as the temperature was risen from 25 °C to 45 °C. It meant that the adsorption of the three flavonoids was an exothermic process. In addition, the effects of temperature on the relative adsorption capacities of the three compounds were further discussed. It could be seen from Figure 3D that ENG had a much higher relative adsorption capacity than the other two compounds at any temperature. It further confirmed the substitution pattern on ring B, as fewer hydroxyl substituents increase the hydrophobicity of the flavonoid increasing the adsorption to the resin.
The fitting figures of the Langmuir and Freundlich equations for the adsorption isotherm data of AST, ISO, and ENG were shown in Figure 4. The adsorption parameters were calculated and listed in Table 2. It could be seen that the correlation coefficients of the Langmuir equation of the three compounds are higher than those of the Freundlich equation, which indicated their adsorption isotherm data conformed to the Langmuir equation well. In addition, all the values of 1/n in the Freundlich equation were in the range of 0.1598 to 0.2915, indicating the three flavonoids can be adsorbed easily by HPD-300 resin.
3.3. Dynamic Adsorption Tests
The leakage curves of the three flavonoids were drawn by dynamic adsorption tests when the concentrations of AST, ISO, and ENG were 2.22, 0.49, and 0.18 mg/mL, respectively. Generally, the leakage point is considered to be reached when the sample concentration in the effluent reaches 1/10 of the sample concentration. As shown in Figure 5A, the leakage points of AST and ISO were 8 BV, while that of ENG was 10 BV. The leakage point of ENG appeared later than those of the other two compounds, indicating that it showed the strongest competitive adsorption capacity in both static and dynamic adsorption experiments. In order to improve efficiency and avoid sample waste, the sample loading volume was selected as 7 BV.
3.4. Dynamic Desorption Tests
For obtaining the best desorption effect, the desorption curves of AST, ISO, and ENG were drawn by dynamic desorption tests. In the first dynamic desorption test (Figure 5B), deionized water (5 BV), 10% (5 BV), 50% (5 BV), and 70% (5 BV) ethanol were used as elution solvent to draw desorption curve. The results showed that AST, ISO, and ENG were mainly distributed in 50% ethanol eluent. However, 10% ethanol would elute some of the three flavonoids. In order to avoid the loss of the target compound, 10% ethanol was removed and the leakage curve was redrawn. It could be seen from Figure 5C that 50% ethanol (5 BV) could completely elute the three target compounds, which were not detected in 70% ethanol eluent. Therefore, the best elution scheme was as follows: first, elute the unabsorbed samples and impurities using distilled water (5 BV), then elute AST, ISO, and ENG using 50% ethanol (5 BV). The 50% ethanol eluate was distilled under reduced pressure to obtain the resin-purified product.
Under the optimal conditions, 3.92 g of RSG crude extract was loaded onto the resin, washed with 70 mL of distilled water, and then eluted with 70 mL of 50% ethanol to obtain 604 mg of resin-purified product with one treatment. It takes about 4.25 h to complete the sample loading and elution process. The HPLC chromatograms of the RSG extracts and resin-purified product are presented in Figure 6. Some high polarity impurities with short retention time had been removed. In addition, some impurities had no UV absorption and were not shown in the chromatograms. After separation using the HPD-300 resin under the best conditions, the purities of AST, ISO, and ENG were increased from 5.55%, 1.22%, and 0.45% to 27.46%, 6.14%, and 2.27% with recovery yields of more than 75%.
3.5. The Further Purification of AST, ISO, and ENG with High Purities
In order to further separate the three flavonoids, the resin-purified products (2.8 g) were separated by preparative HPLC. According to the tagged peaks in Figure 7A, fractions 1–3 were collected and evaporated to obtain the crude products of AST (762 mg), ISO (167 mg), and ENG (56 mg) with a round of preparative HPLC separation, respectively. The color of the three flavonoids obtained by preparative HPLC was dark, so silica gel column chromatography was used for further refining. After purification by silica gel column chromatography, the yields of the three compounds were 583, 112, and 39 mg, respectively, with recovery yields of more than 60%. As could be seen from Figure 7B–D, the purities of all three compounds could reach above 98% in the final product.
4. Conclusions
In this work, the adsorption properties of three flavonoids AST, ISO, and ENG in traditional Chinese medicine RSG on HPD-300 resin were studied. The adsorption process of the three compounds could be better described by the pseudo-second-order kinetic model. The adsorption isotherm of the three compounds conformed to the Langmuir equation and the adsorption was an exothermic reaction. At 25–45 °C, the relative adsorption capacity of ENG was significantly higher than those of AST and ISO because the lack of a phenolic hydroxyl group on its B ring increase the hydrophobicity of the flavonoid with the resin. Moreover, an effective method for the enrichment of AST, ISO, and ENG from RSG was developed using the HPD-300 resin. After separation under the optimal condition, the purities of AST, ISO, and ENG increased from 5.55%, 1.22%, and 0.45% to 27.46%, 6.14%, and 2.27% with recovery yields of more than 75%. After further purification by preparative HPLC and silica gel column chromatography, the purities of AST, ISO, and ENG could reach above 98% with recovery yields of more than 60%.
Supplementary Materials
The following supporting information can be downloaded at: https://www.mdpi.com/article/10.3390/separations9120431/s1, Figure S1: The standard curves of AST (A), ISO (B), and ENG (C).
Author Contributions
Conceptualization, H.L. and C.W.; formal analysis, X.S. and H.L.; resources, G.H. and H.L.; investigation, X.S. and X.Z.; data curation, X.S. and X.Z.; writing—original draft, X.S.; writing—review and editing, H.L.; visualization, X.S. and H.L.; supervision, G.H. and C.W.; project administration, G.H. and H.L.; funding acquisition, C.W. and H.L. All authors have read and agreed to the published version of the manuscript.
Funding
This study was financially supported by the Yantai science and technology plan (NO: 2022XDRH026; 2019XDHZ108).
Acknowledgments
We thank the key support projects (inheritance and development of traditional Chinese Medicine) of the State Administration of traditional Chinese medicine.
Conflicts of Interest
The authors declare that they have no competing interests. This article does not contain any studies with human or animal subjects.
References
- Gegentana; Xu, F.; Li, F.C.; Zhang, Y.F.; Shen, S.J.; Yang, P.; Yang, X.X.; Shang, M.Y.; Liu, G.X.; Li, Y.L.; et al. Discovery of the active compounds of Smilacis Glabrae Rhizoma by utilizing the relationship between the individual differences in blood drug concentration and the pharmacological effect in rats. J. Ethnopharmacol. 2020, 258, 112886. [Google Scholar] [CrossRef] [PubMed]
- Shu, J.; Li, L.; Zhou, M.; Yu, J.; Peng, C.; Shao, F.; Liu, R.; Zhu, G.; Huang, H. Three new flavonoid glycosides from Smilax Glabra and their anti-inflammatory activity. Nat. Prod. Res. 2018, 32, 1760–1768. [Google Scholar] [CrossRef] [PubMed]
- Pharmacopoeia Commission of PRC. Ch.P; Chinese Medicine Science and Technology Press: Beijing, China, 2020; Volume I, p. 19. [Google Scholar]
- Chen, L.; Yin, Y.; Yi, H.; Xu, Q.; Chen, T. Simultaneous quantification of five major bioactive flavonoids in Rhizoma Smilacis Glabrae by high-performance liquid chromatography. J. Pharm. Biomed. Anal. 2007, 43, 1715–1720. [Google Scholar] [CrossRef] [PubMed]
- Zhang, L.; Zheng, D.; Zhang, Q.F. Purification of total flavonoids from Rhizoma Smilacis Glabrae through cyclodextrin-assisted extraction and resin adsorption. Food Sci. Nutr. 2019, 7, 449–456. [Google Scholar] [CrossRef] [PubMed] [Green Version]
- Xie, J.; Li, L.; Shi, Y.; Chen, R.; Liu, G.; Wang, M.; Zheng, M.; Zhang, N. Simultaneous ultra-performance liquid chromatography-tandem mass spectrometry determination of six components in rat plasma after oral administration of Smilacis Glabrae Roxb. extract. Biomed. Chromatogr. 2019, 33, e4680. [Google Scholar] [CrossRef]
- Bao, Y.; Li, H.; Li, Q.Y.; Li, Y.; Li, F.; Zhang, C.F.; Wang, C.Z.; Yuan, C.S. Therapeutic effects of Smilax Glabra and Bolbostemma Paniculatum on rheumatoid arthritis using a rat paw edema model. Biomed. Pharmacother. 2018, 108, 309–315. [Google Scholar] [CrossRef]
- Zhang, H.; Li, B.; Zong, X.; Li, L. Preparative separation of flavonoids in plant extract of Smilacis Glabrae Roxb. by high performance counter-current chromatography. J. Sep. Sci. 2013, 36, 1853–1860. [Google Scholar] [CrossRef]
- Xu, S.; Shang, M.Y.; Liu, G.X.; Xu, F.; Wang, X.; Shou, C.C.; Cai, S.Q. Chemical constituents from the rhizomes of Smilax Glabra and their antimicrobial activity. Molecules 2013, 18, 5265–5287. [Google Scholar] [CrossRef] [Green Version]
- Zheng, D.; Zhang, L.; Zhang, Q.F. Isomerization of astilbin and its application for preparation of the four stereoisomers from Rhizoma Smilacis Glabrae. J. Pharm. Biomed. Anal. 2018, 155, 202–209. [Google Scholar] [CrossRef]
- Dong, L.; Zhu, J.; Du, H.; Nong, H.; He, X.; Chen, X. Astilbin from Smilax Glabra Roxb. attenuates inflammatory responses in complete freund’s adjuvant-Induced arthritis rats. Evid. Based Complement. Alternat. Med. 2017, 2017, 8246420. [Google Scholar] [CrossRef]
- Sharma, A.; Gupta, S.; Chauhan, S.; Nair, A.; Sharma, P. Astilbin: A promising unexplored compound with multidimensional medicinal and health benefits. Pharmacol. Res. 2020, 158, 104894. [Google Scholar] [CrossRef]
- Shi, M.; Xu, M.; Yin, L. Pharmacokinetic, bioavailability and tissue distribution study of astilbin in rats. J. Pharm. Pharmacol. 2020, 72, 1061–1071. [Google Scholar] [CrossRef]
- Ma, Y.; Gao, Z.; Xu, F.; Liu, L.; Luo, Q.; Shen, Y.; Wu, X.; Wu, X.; Sun, Y.; Wu, X.; et al. A novel combination of astilbin and low-dose methotrexate respectively targeting A2AAR and its ligand adenosine for the treatment of collagen-induced arthritis. Biochem. Pharmacol. 2018, 153, 269–281. [Google Scholar] [CrossRef]
- Wang, H.; Jiang, Z.; Pang, Z.; Qi, G.; Hua, B.; Yan, Z.; Yuan, H. Engeletin protects against TNF-α-Induced apoptosis and reactive oxygen species generation in chondrocytes and alleviates osteoarthritis in vivo. J. Inflamm. Res. 2021, 14, 745–760. [Google Scholar] [CrossRef]
- Huang, Z.; Ji, H.; Shi, J.; Zhu, X.; Zhi, Z. Engeletin attenuates Aβ1-42-Induced oxidative stress and neuroinflammation by Keap1/Nrf2 pathway. Inflammation 2020, 43, 1759–1771. [Google Scholar] [CrossRef]
- Zhao, X.; Chen, R.; Shi, Y.; Zhang, X.; Tian, C.; Xia, D. Antioxidant and anti-inflammatory activities of six flavonoids from Smilax Glabra Roxb. Molecules 2020, 25, 5295. [Google Scholar] [CrossRef]
- Dippenaar, C.; Shimbo, H.; Okon, K.; Miller, N.; Joubert, E.; Yoshida, T.; de Beer, D. Anti-allergic and antioxidant potential of polyphenol-enriched fractions from Cyclopia subternata (Honeybush) produced by a scalable process. Separations 2022, 9, 278. [Google Scholar] [CrossRef]
- Charpe, T.W.; Rathod, V.K. Separation of glycyrrhizic acid from licorice root extract using macroporous resin. Food Bioprod. Process 2015, 93, 51–57. [Google Scholar] [CrossRef]
- Guo, Z.; Xiong, S.; Xie, Y.; Liang, X. The separation and purification of ellagic acid from Phyllanthus urinaria L. by a combined mechanochemical-macroporous resin adsorption method. Separations 2021, 8, 186. [Google Scholar] [CrossRef]
- Che Zain, M.S.; Lee, S.Y.; Teo, C.Y.; Shaari, K. Adsorption and desorption properties of total flavonoids from oil palm (Elaeis Guineensis Jacq.) mature leaf on macroporous adsorption resins. Molecules 2020, 25, 778. [Google Scholar] [CrossRef] [PubMed]
- Li, Y.; Lin, H.; Zhang, J.; Deng, X.; Li, J. An efficient procedure for preparing high-purity pingyangmycin and boanmycin from Streptomyces verticillus var. pingyangensis fermentation broth via macroporous cation-exchange resin and subsequent reversed-phase preparative chromatography. J. Chromatogr. B 2020, 1136, 121883. [Google Scholar] [CrossRef] [PubMed]
- Li, H.J.; Hou, G.G.; Li, Y.Y.; Zhao, F.; Cong, W.; Wang, C.H. Preparative separation of phloridzin from apple leaves using macroporous resins followed by preparative high-performance liquid chromatography. J. Sep. Sci. 2018, 41, 3918–3924. [Google Scholar] [CrossRef] [PubMed]
- Li, H.J.; Shi, J.L.; Li, Y.Y.; Wang, C.H.; Hou, G.G.; Cong, W.; Zhao, F. Purification of spinosin from Ziziphi Spinosae Semen using macroporous resins followed by preparative high-performance liquid chromatography. J. Sep. Sci. 2019, 42, 3134–3140. [Google Scholar] [CrossRef] [PubMed]
- Sun, J.J.; Su, X.Y.; Zhang, Z.; Hu, D.X.; Hou, G.G.; Zhao, F.; Sun, J.F.; Cong, W.; Wang, C.H.; Li, H.J. Separation of three chromones from Saposhnikovia Divaricata using macroporous resins followed by preparative high-performance liquid chromatography. J. Sep. Sci. 2021, 44, 3287–3294. [Google Scholar] [CrossRef]
Figure 1.
The structure of AST ISO and ENG.

Figure 2.
Adsorption kinetics curves of AST (A), ISO, and ENG (B); relative adsorption capacities in the whole adsorption process of the three flavonoids (** p < 0.01 compared with ENG) (C); intraparticle diffusion kinetic models of AST, ISO, and ENG (D).
Figure 2.
Adsorption kinetics curves of AST (A), ISO, and ENG (B); relative adsorption capacities in the whole adsorption process of the three flavonoids (** p < 0.01 compared with ENG) (C); intraparticle diffusion kinetic models of AST, ISO, and ENG (D).

Figure 3.
Adsorption isotherms of AST (A), ISO (B), and ENG (C); relative adsorption capacities of the three flavonoids at different temperatures and concentrations (** p < 0.01 compared with ENG) (D).
Figure 3.
Adsorption isotherms of AST (A), ISO (B), and ENG (C); relative adsorption capacities of the three flavonoids at different temperatures and concentrations (** p < 0.01 compared with ENG) (D).

Figure 4.
Langmuir models of AST (A), ISO (B), and ENG (C); Freundlich models of AST (D), ISO (E), and ENG (F).
Figure 4.
Langmuir models of AST (A), ISO (B), and ENG (C); Freundlich models of AST (D), ISO (E), and ENG (F).

Figure 5.
Dynamic leakage curves of the three flavonoids (A); dynamic desorption curves 1 (B) and 2 (C) of AST, ISO, and ENG.
Figure 5.
Dynamic leakage curves of the three flavonoids (A); dynamic desorption curves 1 (B) and 2 (C) of AST, ISO, and ENG.

Figure 6.
HPLC chromatograms of RSG extracts (A) and resin purified product (B).

Figure 7.
Preparative HPLC chromatogram (A); chromatograms of the final prepared AST (B), ISO (C), and ENG (D).
Figure 7.
Preparative HPLC chromatogram (A); chromatograms of the final prepared AST (B), ISO (C), and ENG (D).


Table 1.
Adsorption kinetics parameters for AST, ISO, and ENG on the HPD-300 resin.
| Kinetics Equations | Dynamic Parameters | |||
|---|---|---|---|---|
| Pseudo-first-order model | Coumpound | Qe (mg/g) | K1 | R2 |
| AST | 18.33 | 0.0121 | 0.9925 | |
| ISO | 3.94 | 0.0123 | 0.9895 | |
| ENG | 1.40 | 0.0122 | 0.9853 | |
| Pseudo-second-order model | Qe (mg/g) | K2 | R2 | |
| AST | 34.60 | 0.0015 | 0.9997 | |
| ISO | 7.54 | 0.0070 | 0.9998 | |
| ENG | 3.20 | 0.0208 | 0.9999 | |
| Intraparticle diffusion model (0–60 min) | C | Ki | R2 | |
| AST | 9.24 | 2.0280 | 0.9993 | |
| ISO | 1.72 | 0.4979 | 0.9958 | |
| ENG | 0.76 | 0.2295 | 0.9891 | |
Table 2.
Langmuir and Freundlich adsorption parameters of AST, ISO, and ENG on HPD-300 resin.
| Compounds | Temperature (K) | Langmuir Equation | Freundlich Equation | ||||
|---|---|---|---|---|---|---|---|
| Qmax | KL | R2 | KF | 1/n | R2 | ||
| AST | 298 | 35.97 | 34.75 | 0.9996 | 36.39 | 0.1763 | 0.9264 |
| 308 | 35.09 | 23.75 | 0.9996 | 34.53 | 0.1785 | 0.9269 | |
| 318 | 33.78 | 15.58 | 0.9997 | 32.17 | 0.2051 | 0.9223 | |
| ISO | 298 | 8.07 | 137.67 | 0.9991 | 10.24 | 0.1598 | 0.9577 |
| 308 | 7.91 | 115.00 | 0.9985 | 9.88 | 0.1639 | 0.9528 | |
| 318 | 7.63 | 72.83 | 0.9985 | 9.62 | 0.1876 | 0.9575 | |
| ENG | 298 | 4.44 | 250.22 | 0.9844 | 9.34 | 0.2630 | 0.9675 |
| 308 | 4.41 | 206.09 | 0.9811 | 9.30 | 0.2697 | 0.9756 | |
| 318 | 4.33 | 164.79 | 0.9831 | 9.43 | 0.2915 | 0.9829 | |
Publisher’s Note: MDPI stays neutral with regard to jurisdictional claims in published maps and institutional affiliations. |
© 2022 by the authors. Licensee MDPI, Basel, Switzerland. This article is an open access article distributed under the terms and conditions of the Creative Commons Attribution (CC BY) license (https://creativecommons.org/licenses/by/4.0/).
Share and Cite
MDPI and ACS Style
Su, X.; Zhang, X.; Wang, C.; Hou, G.; Li, H. Adsorption Properties and Preparative Separation of Flavonoids from Rhizoma Smilacis Glabrae Using Macroporous Resins. Separations 2022, 9, 431. https://doi.org/10.3390/separations9120431
AMA Style
Su X, Zhang X, Wang C, Hou G, Li H. Adsorption Properties and Preparative Separation of Flavonoids from Rhizoma Smilacis Glabrae Using Macroporous Resins. Separations. 2022; 9(12):431. https://doi.org/10.3390/separations9120431
Chicago/Turabian StyleSu, Xiangyi, Xuan Zhang, Chunhua Wang, Guige Hou, and Hongjuan Li. 2022. "Adsorption Properties and Preparative Separation of Flavonoids from Rhizoma Smilacis Glabrae Using Macroporous Resins" Separations 9, no. 12: 431. https://doi.org/10.3390/separations9120431
Note that from the first issue of 2016, this journal uses article numbers instead of page numbers. See further details here.