
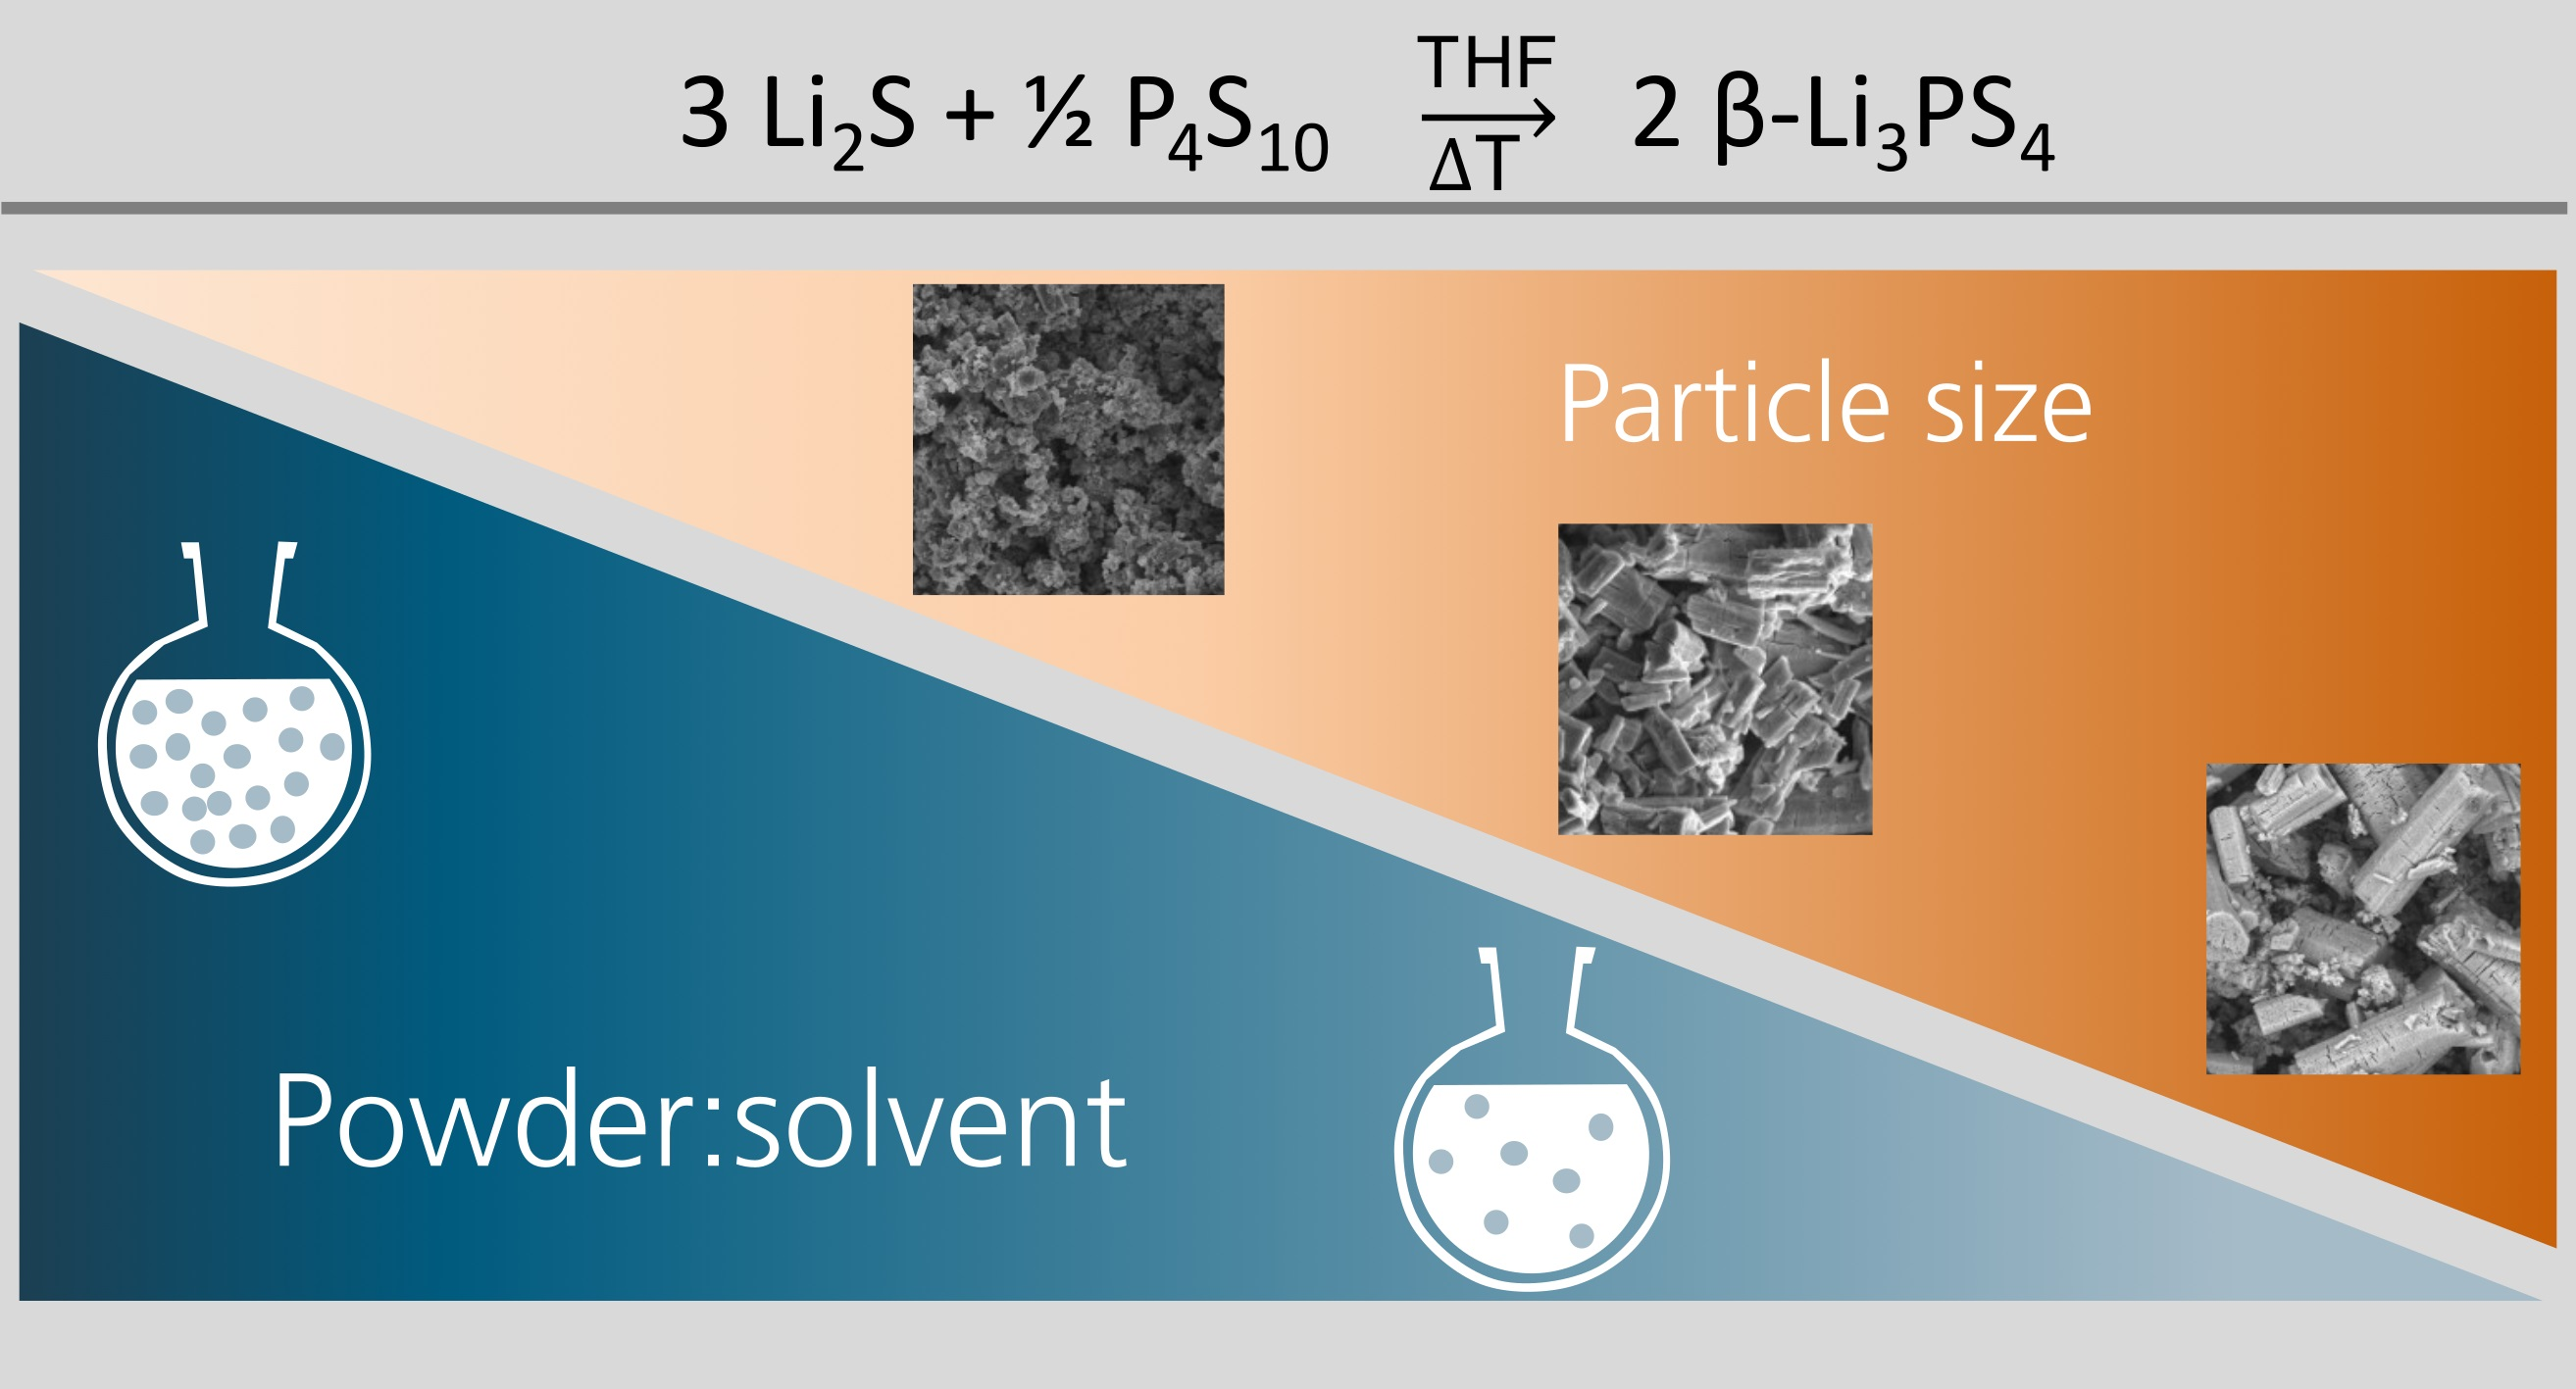
Influence of Solid Fraction on Particle Size during Wet-Chemical Synthesis of β-Li3PS4 in Tetrahydrofuran


1
Fraunhofer Institute for Manufacturing Technology and Advanced Materials IFAM, Lilienthalplatz 1, 38108 Braunschweig, Germany
2
Fraunhofer Institute for Manufacturing Technology and Advanced Materials IFAM, Wiener Str. 12, 28359 Bremen, Germany
*
Author to whom correspondence should be addressed.
Batteries 2024, 10(4), 132; https://doi.org/10.3390/batteries10040132
Submission received: 8 March 2024
/
Revised: 5 April 2024
/
Accepted: 9 April 2024
/
Published: 16 April 2024
(This article belongs to the Special Issue Solid Electrolytes for All-Solid-State Batteries: Recent Progress and Future Perspectives)
Abstract
:For all-solid-state batteries, the particle size distribution of the solid electrolyte is a critical factor. Small particles are preferred to obtain a high active mass loading of cathode active material and a small porosity in composite cathodes. In this work, the influence of the solid fraction in the wet-chemical synthesis of β-Li3PS4 in tetrahydrofuran (THF) is investigated. The solid fraction is varied between 50 and 200 mg/mL, and the obtained samples are evaluated using X-ray diffraction, SEM and electrochemical impedance measurements. The sizes of the resulting particles show a significant dependency on the solid fraction, while a good ionic conductivity is maintained. For the highest concentration, the particle sizes do not exceed 10 µm, but for the lowest concentration, particles up to ~73 µm can be found. The ionic conductivities at room temperature are determined to be 0.63 ± 0.01 × 10⁻⁴ S/cm and 0.78 ± 0.01 × 10⁻⁴ S/cm for the highest and lowest concentrations, respectively. These findings lead to an improvement towards the production of tailored sulfide solid electrolytes.

1. Introduction
In search of an increase in energy and power density, all-solid-state batteries are considered the next generation in battery technology due to the possibility to reduce their overall volume and weight by constructing batteries in bipolar stacks [1,2]. Solid-state electrolytes offer advantages over conventional liquid electrolytes, such as high melting points (greater thermal safety) and a higher mechanical strength. The high shear modulus is believed to suppress the growth of lithium dendrites and therefore opens up the possibility of using a lithium metal anode [1].
One promising material group consists of sulfides because of their high ionic conductivity and ductility [3]. Crystalline β-Li3PS4 exhibits a good ionic conductivity (~1.6·10−4 S/cm at 25 °C [4]) and has gathered much attention over the last years due to the opportunity of using a wet-chemical synthesis route.
Wet-chemical syntheses are considered eligible for scale-up, and a short reaction time and low energy are needed compared to high-temperature solid-state reactions and the mechanical ball-milling route [5,6,7,8]. Furthermore, a wet-chemical synthesis opens up the possibility to tailor the particle size distribution [9], which is critical for processing solid electrolytes. A small particle size is preferred for composite cathode production to obtain homogeneity and a high active mass loading. If the particles are too large, some particles of the active material in the composite cathode are isolated and, therefore, inactive. This dead volume decreases the cell capacity [10]. On the other hand, with a decreasing particle size, the number of particles per volume increases, leading to a relative increase in grain boundaries. This is assumed to be followed by a higher grain-boundary resistance [10,11].
The wet-chemical synthesis route was developed by Liu et al. [4]. The synthesis consists of mixing the educts lithium sulfide (Li2S) and phosphorus pentasulfide (P4S10) in a stoichiometry of Li2S:P2S5 = 3:1 in anhydrous tetrahydrofuran (THF) at ambient temperature (RT) overnight. Afterwards, an intermediate is collected by centrifuging. Heat treatment at 140 °C is used to obtain the crystalline product β-Li3PS4.
During the last years, wet-chemical synthesis was examined in relation to the crystallization temperature and annealing duration [12], various solvents [6,13,14,15] and the reaction mechanism [16,17]. Additionally, we recently reported our investigations on enthalpy determination [18]. Recently, Zhou et al. [9] reported the possibility to tailor the particle size of a similar material Li7P3S11 via different solvents, concentrations and nucleation temperatures. The focus of their survey is on Li7P3S11 and the solvent ethyl acetate (EA), but they also show results for Li3PS4 synthesized in EA and Li7P3S11 synthesized in THF. The investigated concentrations varied between 10 and 40 mg/mL, aiming to obtain nanoparticles by dissolving the precursors completely.
In this survey, for the wet-chemical synthesis of β-Li3PS4 in tetrahydrofuran, the impact of varying the solid fraction is examined. The synthesis consists of four process steps, namely mixing, separation, drying and crystallization. The first step is identified as a particle size determining step. The ability to control particle sizes during the wet-chemical synthesis process is critical for the performance and processibility of the β-Li3PS4 as a solid electrolyte. Hence, the ratio between educts and solvent is varied between 50 and 200 mg/mL, while the other synthesis parameters are kept constant. Using X-ray diffraction (XRD), the synthesis product is analyzed in terms of phase fractions and crystallite size. The particle size and morphology are investigated using scanning electron microscopy (SEM). Lastly, electrochemical impedance spectroscopy (EIS) is used to examine ionic conductivities. The findings are studied in relation to correlations, and the implications of the synthesis process are given. This study aims to provide valuable insights into the correlations between the synthesis parameters and the resulting properties of the solid electrolyte β-Li3PS4. In particular, we demonstrate the ability to tailor the particle size using varying solid fractions.
2. Materials and Methods
2.1. Synthesis of β-Li3PS4
The syntheses were performed analogously to our earlier investigations [18]. Three different samples were synthesized using concentrations of 200 (sample-200), 100 (sample-100) and 50 mg/mL (sample-50). For sample-200, 1.91 g Li2S (Alfa Aesar, 99.9%, Haverhill, MA, USA) and 3.09 g P4S10 (Sigma-Adrich Chemie GmbH, Taufkirchen, Germany, 99%) were mixed in 25 mL THF (VWR Chemicals, anhydrous, max. 30 ppm H2O, Darmstadt, Germany) and stirred with a magnetic stirrer for 24 h in an argon-filled glovebox. Afterwards, the excessive solvent was separated by centrifuging and removed. The received solid was treated with two heating steps: First, the THF of the intermediate was removed by heating for 4 h at 80 °C under vacuum. Subsequently, the temperature was increased to 140 °C, and the sample was kept for 12 h under vacuum for crystallization to β-Li3PS4. The samples with concentrations of 100 and 50 mg/mL (sample-100 and sample-50) were prepared analogously.
2.2. Characterization
2.2.1. XRD
The phase composition and crystal structure of synthesis products were determined using X-ray diffractometry (Mini Flex 600, Rigaku, Tokyo, Japan). The samples were prepared in an argon-filled glovebox. An inert sample holder was used to ensure the integrity of the inert measurement. The instrument was equipped with a Cu(Kα)-source, and a stepwise scan was carried out from 5–60° 2θ with a step size of 0.03° 2θ. To determine the phase fractions of the products, the data were processed with Match! (Version 3.13 Build 227, Crystal Impact, Bonn, Germany) using the semi-quantitative Reference Intensity Ratio (RIR) method [19]. Furthermore, crystallite sizes were estimated using Scherrer’s formula [20] on the six largest reflections between 26–50° 2θ: 26°, 27.5°, 29°, 30°, 31° and 47.7° 2θ.
2.2.2. SEM
The morphology of the educts Li2S and P4S10 and the synthesis products were investigated using a scanning electron microscope at 10 kV (FEI Helios 600). Representative images were selected and processed with Fiji (ImageJ Version 1.53t) to determine the maximum particle size. For this, the longest distance of the 10 largest particles was measured. Criteria for suitability were that both endings of the largest side were visible and could be assigned to the same particle. Furthermore, the measured distance had to be in plane with the sample background. To make sure that one would find the 10 largest particles, at least 15 particles were investigated, and the 10 largest particles were used for the analysis.
2.2.3. Electrochemical Impedance Measurements
Pellets of 150 mg β-Li3PS4 were pressed in a hydraulic press with 65 bar/310 MPa for 5 min at room temperature (RT). The diameter was 10 mm and the height about 1 mm. Carbon-coated aluminum foil was used as symmetric blocking electrodes. The impedance measurement was performed by a Gamry Interface 1010E between 1 MHz and 1 Hz with an amplitude of 10 mV in KP solid cells (Hohsen Corp., Osaka, Japan) with an applied pressure of 15 MPa. The temperature was varied between −40 and 60 °C. The measurement data were processed with ZView. The pellet densities compared to the bulk material were obtained by m/(V·ρbulk), where ρbulk = 1.86 g/cm3 (calculated from [21]) is the density of the bulk material.
3. Results
3.1. Synthesis
Mixing the powdery educts in THF was followed by an increase in temperature caused by the exothermic reaction, as found in our previous investigation [18]. Due to the higher solvent amount in the samples with a lower solid concentration, the temperature rise decreased linearly (sample-200: 40 °C, sample-100: 21 °C, sample-50: 9.6 °C). This can be explained by the temperature change ΔT being approximately linearly dependent on the concentration x when considering the formula ΔT = k·x, where k = = const., because the parameters reaction enthalpy ΔH, specific heat capacity cs, density of the solvent ρ and mass of the solids ms are considered constant in this setup.
After mixing, the suspensions were well separated into sedimented yellowish-white powders and deep-yellow liquids. Further separation was performed by centrifugation and subsequent drying under vacuum, resulting in white powders.
3.2. XRD
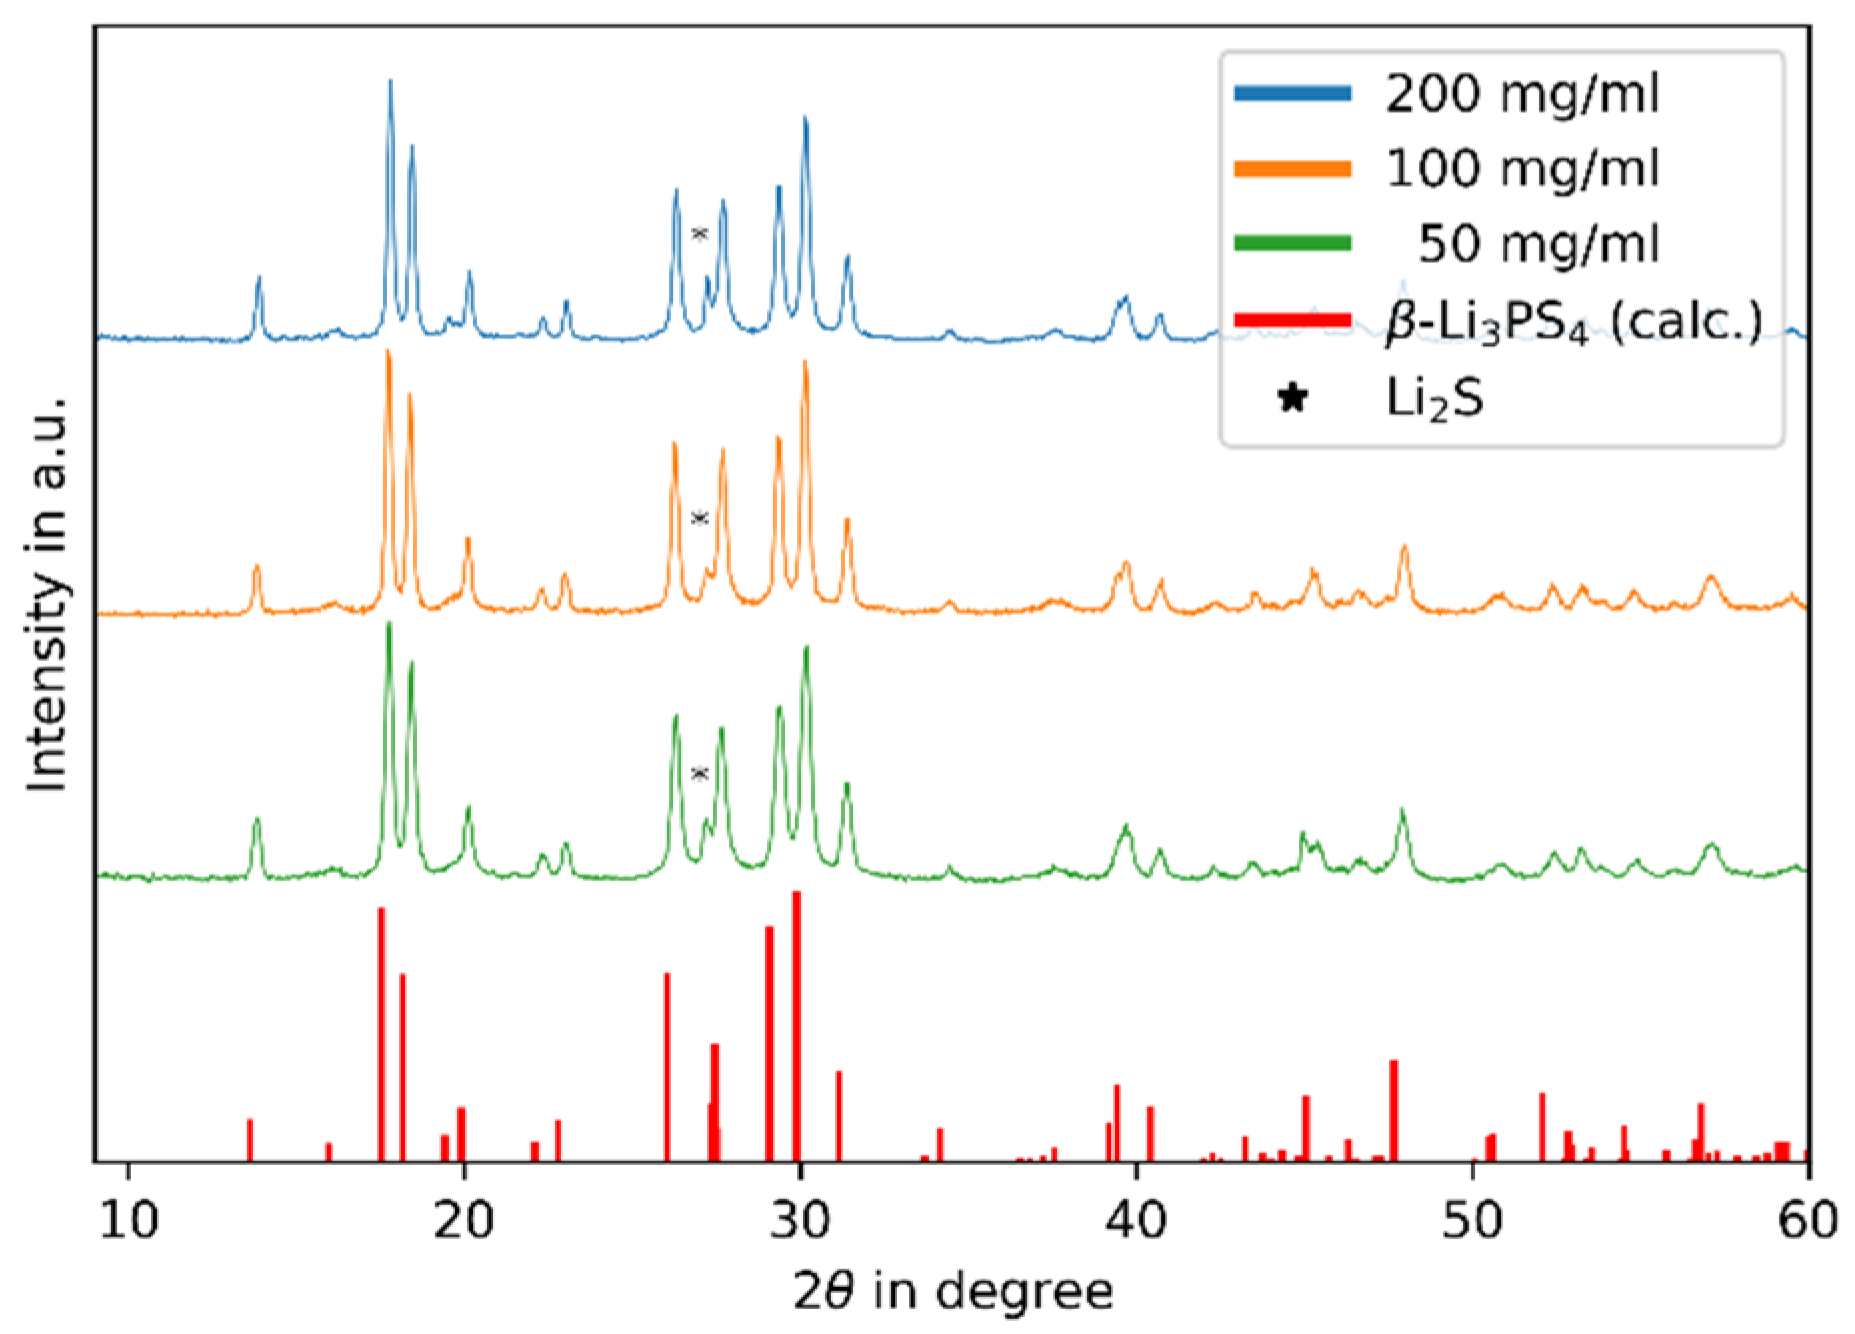
After heat treatment, the samples were investigated by XRD. The results are shown in Figure 1. The blue, orange and green lines show the samples of 200, 100 and 50 mg/mL, respectively. The red lines show the calculated peak positions of β-Li3PS4 using data from Stöffler et al. [21]. For all samples, the patterns show the same peak positions and similar intensities. All reflections except one can be assigned to β-Li3PS4. The residual reflection, marked with an asterisk, at ~27° 2θ can be assigned to residual educt Li2S. To quantify the phase fraction, the RIR method was used. Here, with the factors I/IC(β-Li3PS4) = 1.04 and I/IC(Li2S) = 3.63, the following fractions N of Li2S were obtained:
N200 (Li2S) = 4.7%
N100 (Li2S) = 5.7%
N50 (Li2S) = 4.1%
The obtained phase fractions are all around 5%, and no dependency on the solvent concentration is observable. Therefore, we interpret that the residual amount of Li2S is not connected to the concentration. To reduce the residual amount of Li2S, adjustments in the synthesis routine can be explored, such as adding a small amount of P4S10. It is possible that due to its dissolution in the solvent, the entire amount of P4S10 may not be available for the synthesis.
The crystallite size was estimated by applying the Scherrer equation on the full width of the half maximum [22]. The obtained crystallite sizes are 76 ± 9 nm (sample-200), 72 ± 7 nm (sample-100) and 52 ± 5 nm (sample-50), respectively. A small tendency for a decreasing crystallite size with a decreasing concentration is visible. While the crystallite sizes of sample-200 and sample-100 are similar, the value for sample-50 is a little smaller. The given errors were obtained by the deviation of the six largest reflections, as described in the experimental section. These reflections were chosen because the smaller reflections cannot be separated sufficiently to obtain the full width of the half maximum. In total, the deviation between the samples is not large.
3.3. SEM
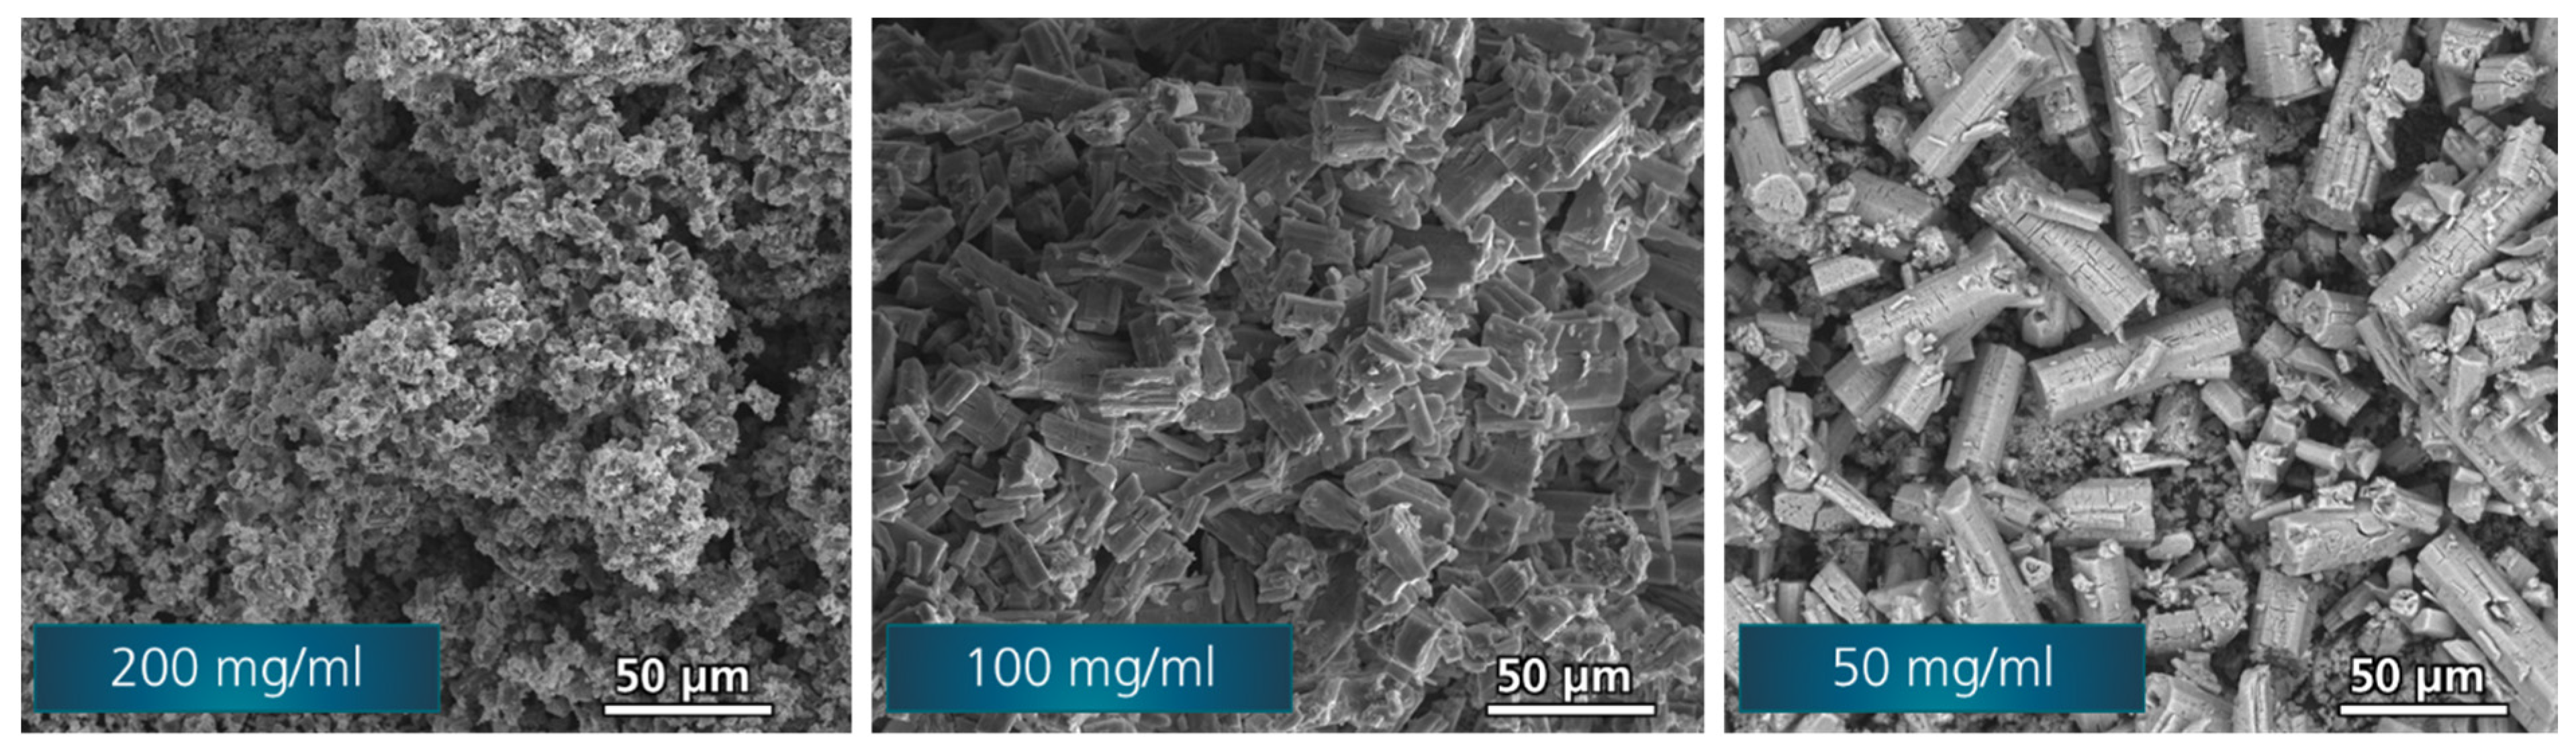
The particle sizes and morphologies of the obtained synthesis products were investigated using SEM (see Figure 2). For the highest solid fraction (sample-200), the SEM image shows the smallest particles. Solid fractions of sample-100 and sample-50 lead to larger particles, respectively. Therefore, for this range of concentrations, an increase of the maximum particle size with a decreasing solid fraction can be concluded. For sample-50, the shape of the particle differs from previous observations [4,23,24]. While sample-200 and sample-100 show block-like shapes of the particles, as found before [4,23,24], the large particles in sample-50 are prism-shaped with an octagonal base. For these large particles, drying cracks are clearly visible. Very fine, nano-sized particles are found in all samples.
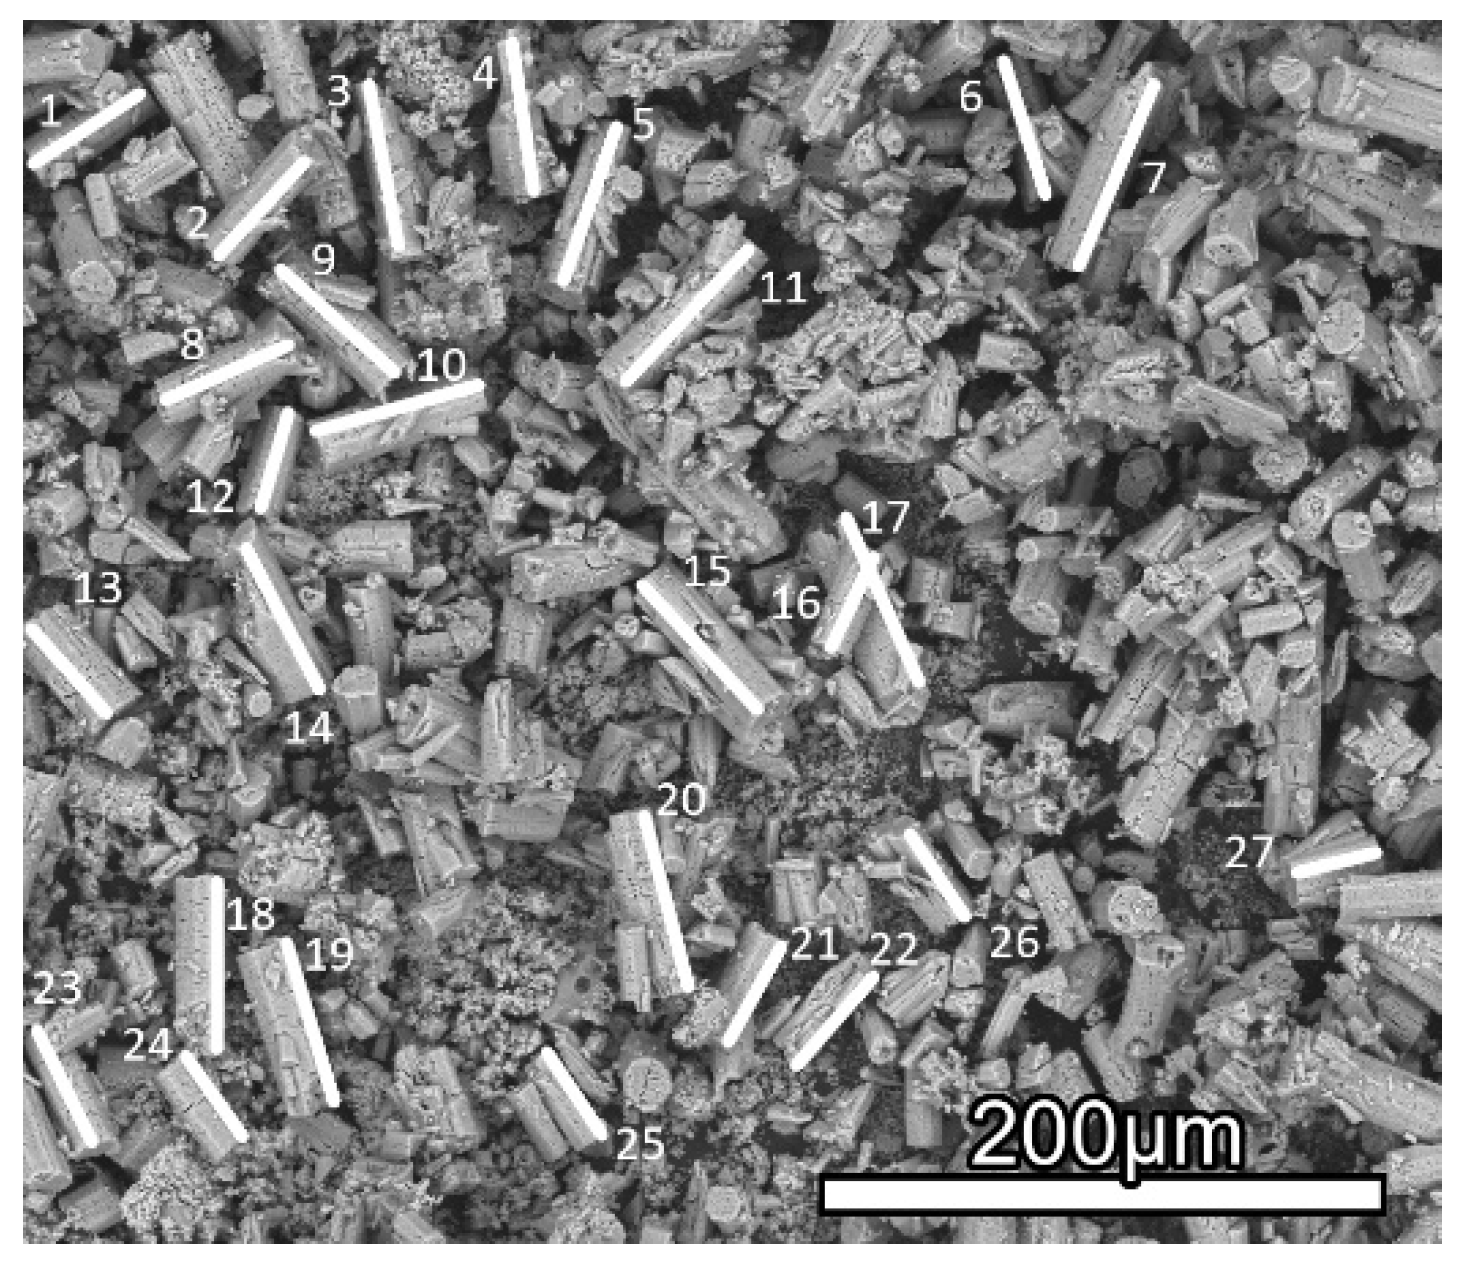
To determine the maximum particle sizes, the largest particles were measured as described in the experimental section. As an example, the measurement is shown in Figure 3 for sample-50. To obtain a better view of the particles, for sample-50 a smaller magnification was chosen, while for sample-200 a higher magnification was needed to distinguish the particles. The average values for the 10 largest particles of each sample are l200 = 9.3 ± 0.7 µm, l100 = 33 ± 4 µm and l50 = 64 ± 5 µm. The measurements and the obtained data can be found in the Supporting Information (Figure S1 and Table S1).
For comparison, SEM images of the educts are also included in the Supporting Information (Figure S2).
The shapes of the particles of the educts show no similarities to the particles of the product. Therefore, it can be concluded that the analysis of the particle size is not influenced by residual educts.
3.4. Impedance Spectroscopy
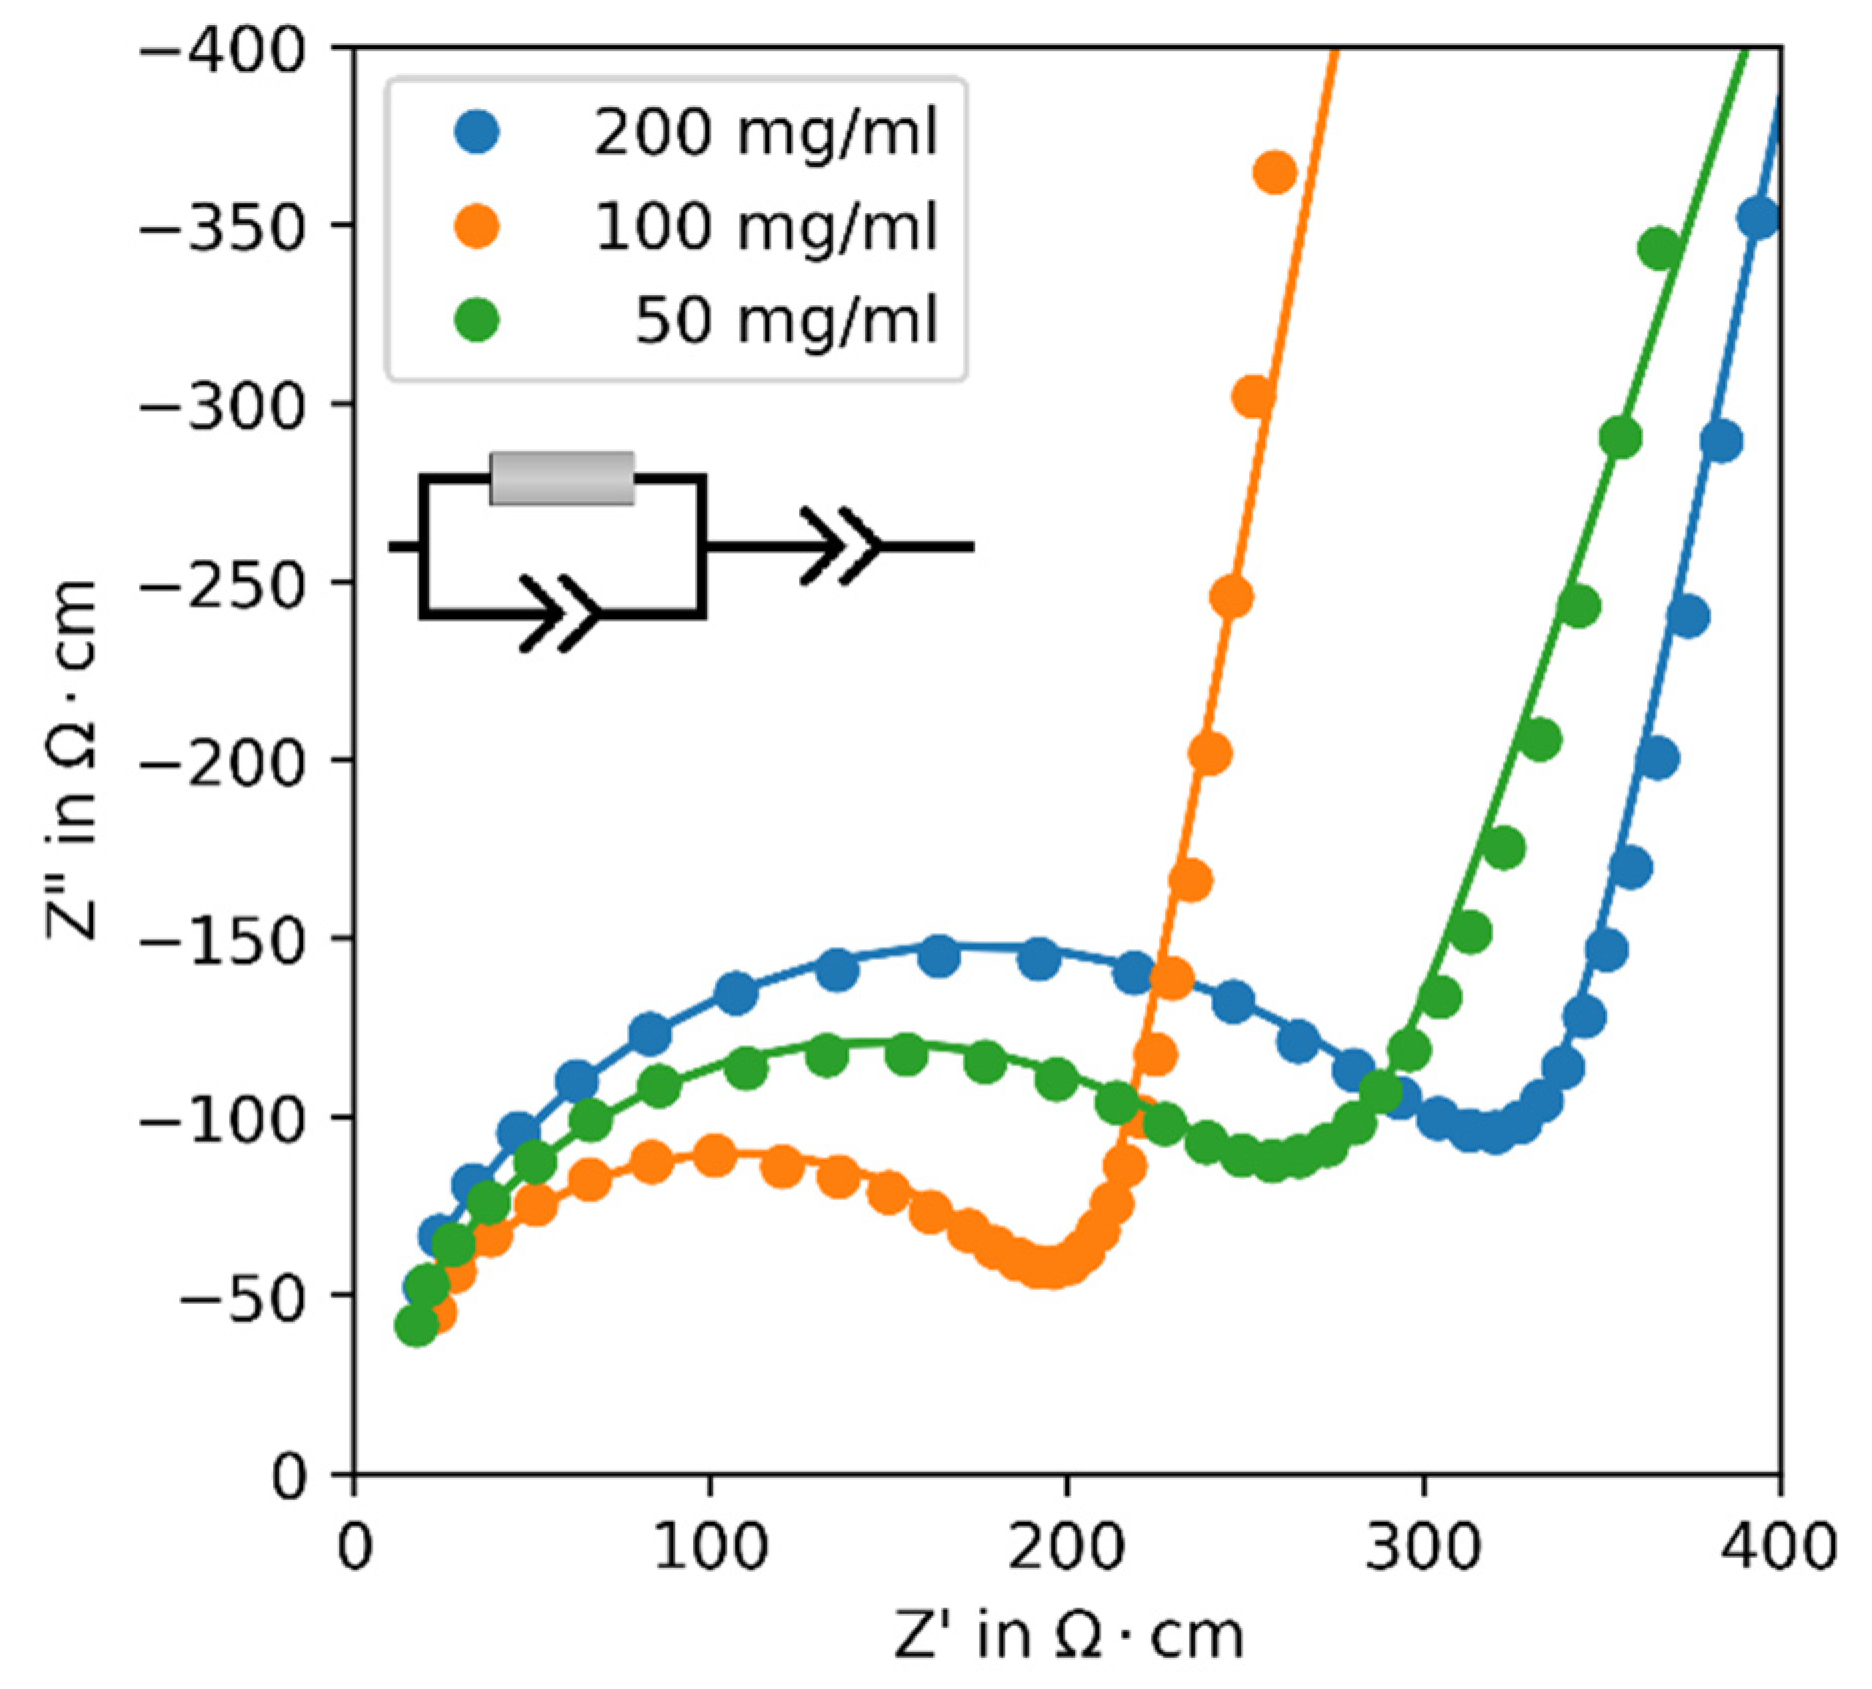
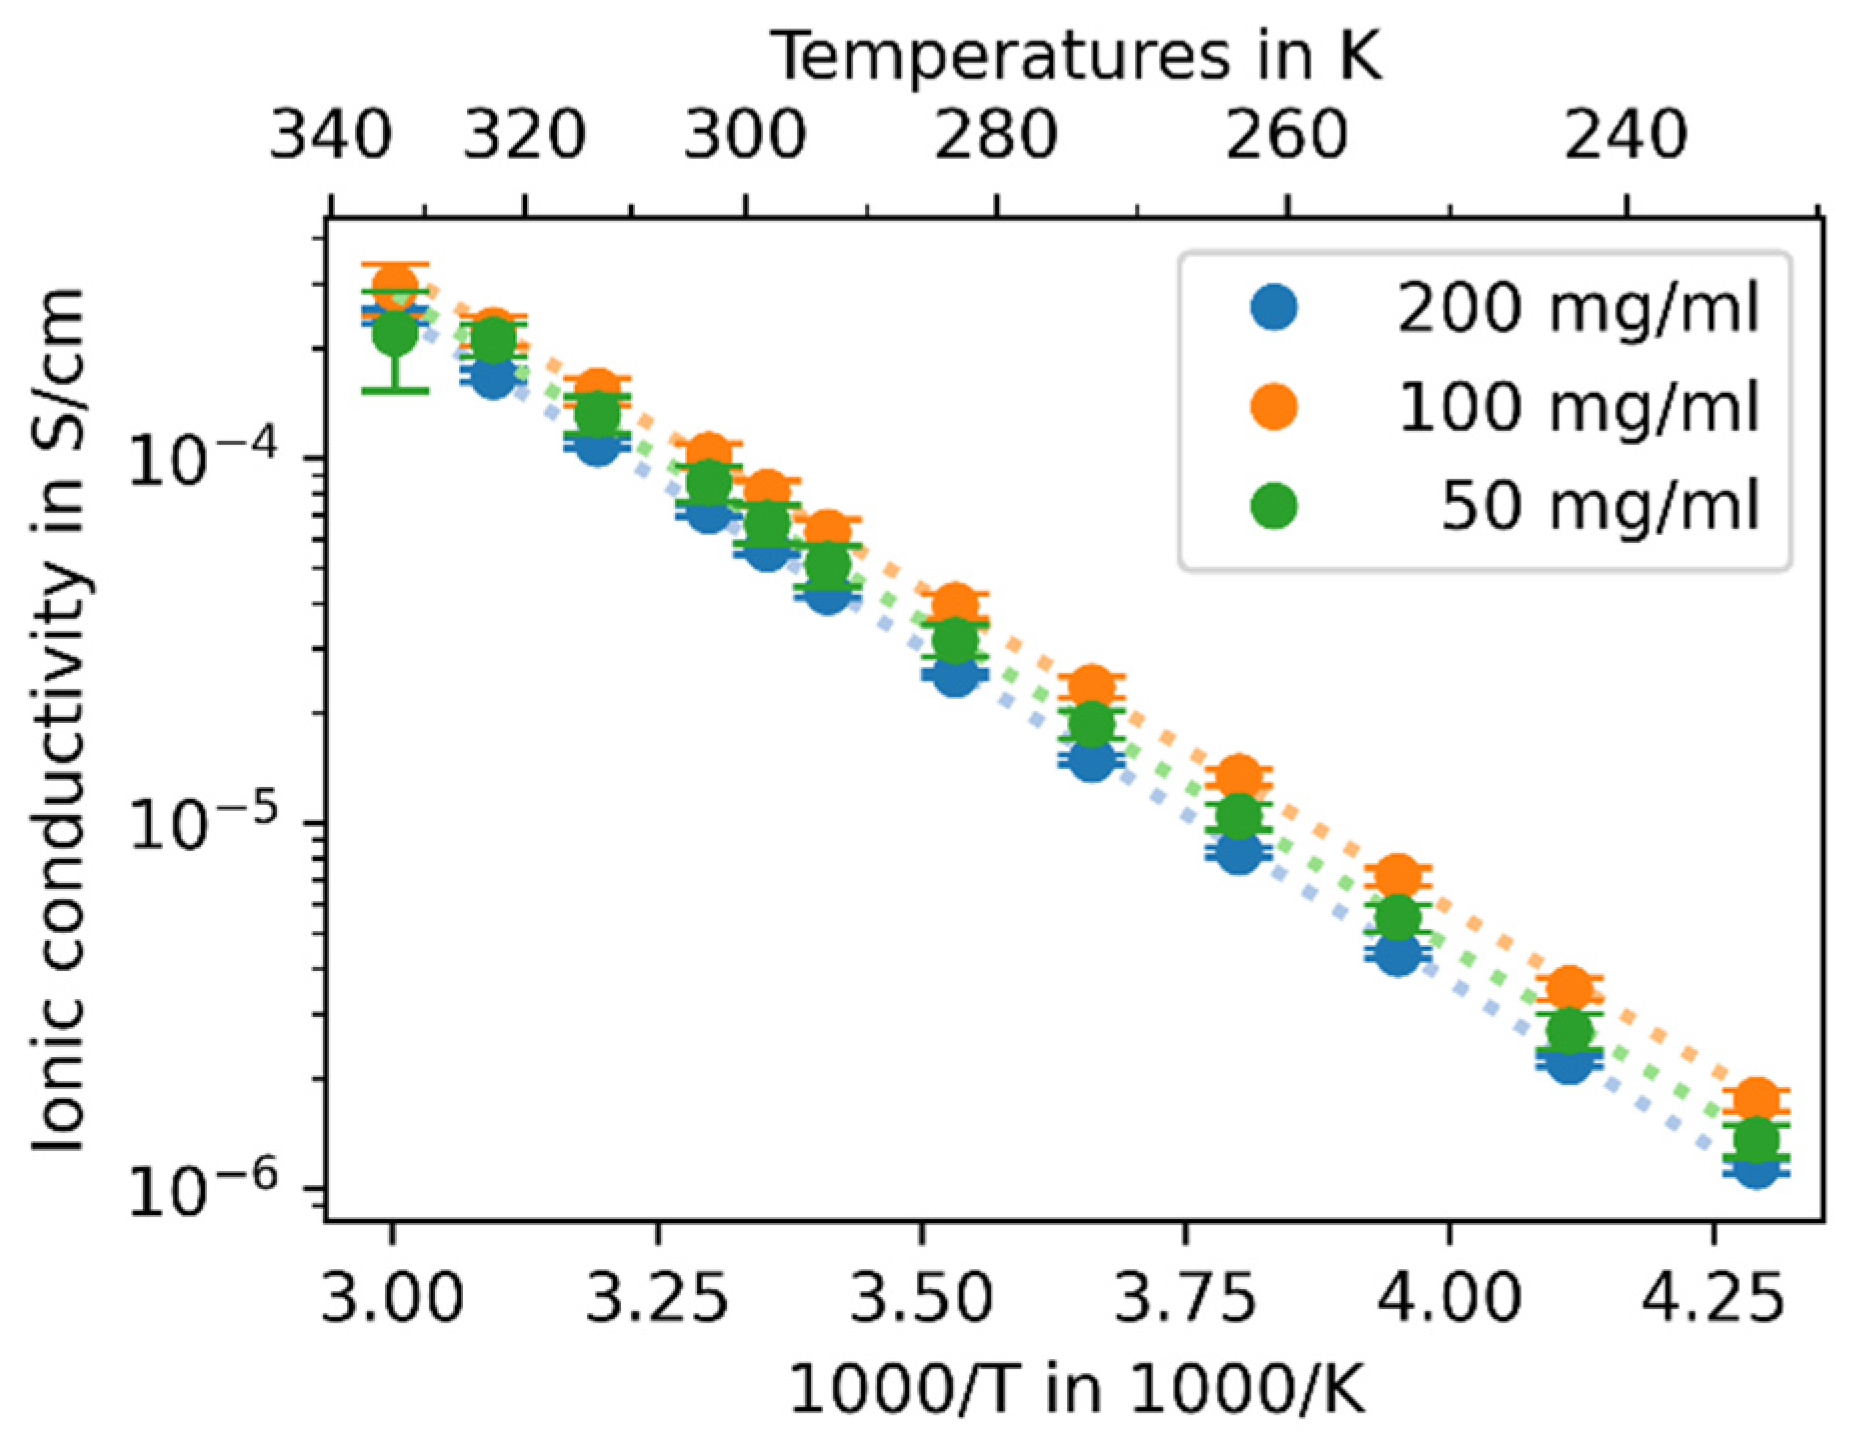
To examine the effect of the particle size on the performance of the synthesis product as a solid electrolyte, temperature-dependent EIS was performed. The impedance measurements show the typical response of an ionic conductor placed between two blocking electrodes exhibiting a semi-circle and a straight line (Figure 4). Therefore, an established equivalent circuit consisting of a resistor with a constant phase element in parallel and a further constant phase element in row was used to fit the data. Using the height and diameter of the pellets, the ionic conductivities were calculated from the obtained resistances, which are shown in Figure 5. All samples show Arrhenius-type behavior with a low standard deviation and an activation energy of EA = 0.383 ± 0.005 eV, which is comparable to the literature [4]. Sample-200 shows the lowest ionic conductivity (IC) of all three samples, and sample-100 shows the highest IC. At 25 °C, the averaged values of three pellets for each sample are
IC200 = 0.63 ± 0.01 × 10⁻⁴ S/cm,
IC100 = 0.98 ± 0.03 × 10⁻⁴ S/cm and
IC50 = 0.78 ± 0.05 × 10⁻⁴ S/cm.
For the investigated range of solid concentrations, the ionic conductivity does not vary much, and no obvious correlation between ionic conductivity and particle size is visible. Therefore, the good ionic conductivity of the material is preserved for small particles. This might be caused by the similar crystallite sizes of the samples resulting in a similar amount of grains and grain boundaries and, therefore, in a similar ionic conductivity. Further grain boundaries can be found on the interfaces between the particles. Their amount increases relatively to the particle amount. While preparing the pressed pellets, the particles can sinter [25], leading to the decimation of grain boundaries.
For our samples, the following densities ρ compared to the bulk material were obtained: ρ200 = 78 ± 1%, ρ100 = 77.4 ± 0.8% and ρ50 = 79.3 ± 0.6%. The values show no significant spread between the samples, and the overall pellet density can be given by ρall = 79 ± 1%. From this data, no influence of the particle size or estimated crystallite size on the pellet density can be observed, and therefore it can be concluded that the pelletizing process is not influenced by the particle size.
In comparison to the literature, slightly lower ionic conductivities are obtained [4,23]. This might be due to the lower pellet density compared to other reports, which is reported to influence the ionic conductivity [26,27]. Another reason for the lower ionic conductivities are the residuals of Li2S in all samples [12]. The values of the phase fractions show no correlation with the ionic conductivity but might result in a general off-set in the resistance.
All results are summarized in Table 1.
The particle size of inorganic solid electrolytes is a crucial parameter for their suitability for applications in solid-state batteries. In general, small particles are preferred for producing thin separator coatings or composite cathodes with a high active mass loading. If particles are too large, active material in the composite cathode may not be connected to the conduction pathways and is therefore inactive, which decreases the cell capacity [10]. While from the viewpoint of cell production, small particles are preferred, these are criticized as having an increased grain boundary resistance [10,11,28]. However, our measurements show that the spread in ionic conductivity of β-Li3PS4 with different particle sizes is small compared to the spread caused by external factors such as stack pressure, pellet density and electrode contacting [26,29]. This could also be related to the sintering of the samples during the pellet preparation leading to the decimation of grain boundaries. Cronau et al. [25] examined the sintering of sulfide solid electrolytes with various degrees of crystallinity. This was adjusted by the heat treatment of amorphous products obtained from ball-milling. They distinguish between amorphous sulfides (no heat treatment), partially crystallized glass-ceramics (low-temperature heat treatment at 260 °C) and microcrystalline sulfides (high-temperature heat treatment at 550 °C). While the sintering of microcrystalline materials can only be performed through annealing, amorphous and glass-ceramic sulfides can be sintered using pressure at ambient temperature. The examined β-Li3PS4 in our study is comparable to the glass-ceramics due to the crystallization at moderate temperatures. Furthermore, Milan et al. [30] showed that for sulfides, in contrast to oxides, the contribution of the grain boundary resistance to the total resistance is similar to that of the grain and is therefore less harmful to the ionic conductivity, as presumed.
To examine the contribution of the grain boundary resistance, the total resistance has to be separated into the contributions of the grain boundary resistance and the bulk resistance, which is not possible in this study due to the strong overlapping of the grain boundary resistance and the bulk resistance in the impedance plots.
4. Discussion on Solid Deposition and Particle Growth
The influence of the concentration on the particle size is known and can be applied specifically to tailor the particle size [9,31]. The deposition of solid from solutions takes place in two steps, as follows: the formation of crystal nuclei and their growth. The formation of nuclei happens when a solution is supersaturated, which can be achieved by solvent removal or cooling. If the initial concentration is already supersaturated, the formation of nuclei and the crystal growth are intensified [31]. The relation between the concentration of a deposing solution and the particle size can be described by “Weimarn’s law” [32]. While at high concentrations the deposition is dominated by the formation of nuclei, at low concentrations the crystal growth prevails. Consequently, at low concentrations, the particle size increases with increasing concentrations because the crystal growth outweighs the formation of nuclei. At medium concentrations, the nuclei formation increases, leading to a decrease in particle size towards high concentrations. Therefore, the slope of the relation can be described over the degree of supersaturation as an increase in particle size through the passage of a maximum and a decrease at higher supersaturations.
The synthesis intermediate Li3PS4·2THF appears insoluble in THF. Therefore, all examined concentrations are in the supersaturated region. As we found a negative relation between concentration and particle size from our SEM examinations, we can conclude that we were working in the region of medium to high supersaturation. Conversely, Zhou et al. [9], showing a positive relation between concentration and particle size, examined lower concentrations with the aim to dissolve the educts completely. Hence, they worked in the region of low supersaturation. All in all, the results of our investigation are in very good agreement with the fundamentals of solid deposition from liquids.
5. Conclusions
In this work, the influence of the solid fraction on the particle size in the wet-chemical synthesis of β-Li3PS4 in THF is examined. The solid fraction is varied between 50 and 200 mg/mL, and the synthesis products are compared using XRD, SEM and electrochemical impedance measurements. While XRD shows no differences between the samples, the influence of varying the concentration can be clearly seen by SEM. For 200 mg/mL, small particles (<10 µm) are synthesized, while concentrations of 100 and 50 mg/mL lead to larger particles that are about three and six times larger, respectively. In this range of concentrations, particle sizes increase with a decreasing solid fraction. The impedance measurement shows that the ionic conductivity of pelletized powder is independent of the particle size.
Supplementary Materials
The following supporting information can be downloaded at: https://www.mdpi.com/article/10.3390/batteries10040132/s1. Figure S1: Measurement of particle sizes in sample-200 (left) and sample-100 (right). Table S1: Measured particle sizes of all samples. The 10 largest particles, which are used to calculate the mean values and standard deviation (STD), are colored in green. Figure S2: SEM images of lithium sulfide (left) and phosphorus pentasulfide (right). File S1: Results from the crystallite size estimation.
Author Contributions
Conceptualization, A.G.; methodology, A.G.; validation, A.G.; formal analysis, A.G.; investigation, A.G.; data curation, A.G.; writing—original draft preparation, A.G.; writing—review and editing, A.G., F.L., J.S. and M.B.; supervision, M.B. All authors have read and agreed to the published version of the manuscript.
Funding
This research was funded by the Lower Saxony Ministry of Science and Culture, grant number ZN3402.
Data Availability Statement
The data presented in this study are available within this article and the Supplementary Material.
Acknowledgments
This research was conducted within the framework of the Fraunhofer project center for electrical energy storage and systems ZESS. Financial support from the Lower Saxony Ministry of Science and Culture within the framework of “Niedersächsisches Vorab” and the Federal Ministry of Education and Research (BMBF) is acknowledged.
Conflicts of Interest
The authors declare no conflicts of interest. The funders had no role in the design of the study; in the collection, analyses, or interpretation of data; in the writing of the manuscript; or in the decision to publish the results.
References
- Janek, J.; Zeier, W.G. A solid future for battery development. Nat. Energy 2016, 1, 16141. [Google Scholar] [CrossRef]
- Zhang, Z.; Shao, Y.; Lotsch, B.V.; Hu, Y.-S.; Li, H.; Janek, J.; Nan, C.; Nazar, L.; Maier, J.; Armand, M.; et al. New Horizons for Inorganic Solid State Ion Conductors. Energy Environ. Sci. 2018, 11, 1945–1976. [Google Scholar] [CrossRef]
- Byeon, Y.-W.; Kim, H. Review on Interface and Interphase Issues in Sulfide Solid-State Electrolytes for All-Solid-State Li-Metal Batteries. Electrochem 2021, 2, 30. [Google Scholar] [CrossRef]
- Liu, Z.; Fu, W.; Payzant, E.A.; Yu, X.; Wu, Z.; Dudney, N.J.; Kiggans, J.; Hong, K.; Rondinone, A.J.; Liang, C. Anomalous high ionic conductivity of nanoporous β-Li3PS4. J. Am. Chem. Soc. 2013, 135, 975–978. [Google Scholar] [CrossRef]
- Stöffler, H.; Zinkevich, T.; Yavuz, M.; Hansen, A.-L.; Knapp, M.; Bednarčík, J.; Randau, S.; Richter, F.H.; Janek, J.; Ehrenberg, H.; et al. Amorphous versus Crystalline Li3PS4: Local Structural Changes during Synthesis and Li Ion Mobility. J. Phys. Chem. C 2019, 123, 10280–10290. [Google Scholar] [CrossRef]
- Ghidiu, M.; Ruhl, J.; Culver, S.P.; Zeier, W.G. Solution-based synthesis of lithium thiophosphate superionic conductors for solid-state batteries: A chemistry perspective. J. Mater. Chem. A 2019, 7, 17735–17753. [Google Scholar] [CrossRef]
- Zhang, Q.; Cao, D.; Ma, Y.; Natan, A.; Aurora, P.; Zhu, H. Sulfide-Based Solid-State Electrolytes: Synthesis, Stability, and Potential for All-Solid-State Batteries. Adv. Mater. 2019, 31, 1901131. [Google Scholar] [CrossRef] [PubMed]
- Miura, A.; Rosero-Navarro, N.C.; Sakuda, A.; Tadanaga, K.; Phuc, N.H.H.; Matsuda, A.; Machida, N.; Hayashi, A.; Tatsumisago, M. Liquid-phase syntheses of sulfide electrolytes for all-solid-state lithium battery. Nat. Rev. Chem. 2019, 3, 189–198. [Google Scholar] [CrossRef]
- Zhou, J.; Chen, Y.; Yu, Z.; Bowden, M.; Miller, Q.R.; Chen, P.; Schaef, H.T.; Mueller, K.T.; Lu, D.; Xiao, J.; et al. Wet-chemical synthesis of Li7P3S11 with tailored particle size for solid state electrolytes. Chem. Eng. J. 2022, 429, 132334. [Google Scholar] [CrossRef]
- Shi, T.; Tu, Q.; Tian, Y.; Xiao, Y.; Miara, L.J.; Kononova, O.; Ceder, G. High Active Material Loading in All-Solid-State Battery Electrode via Particle Size Optimization. Adv. Energy Mater. 2020, 10, 1902881. [Google Scholar] [CrossRef]
- Mertens, A.; Yu, S.; Schön, N.; Gunduz, D.C.; Tempel, H.; Schierholz, R.; Hausen, F.; Kungl, H.; Granwehr, J.; Eichel, R.-A. Superionic bulk conductivity in Li1.3Al0.3Ti1.7(PO4)3 solid electrolyte. Solid State Ion. 2017, 309, 180–186. [Google Scholar] [CrossRef]
- Yamamoto, K.; Takahashi, M.; Ohara, K.; Phuc, N.H.H.; Yang, S.; Watanabe, T.; Uchiyama, T.; Sakuda, A.; Hayashi, A.; Tatsumisago, M.; et al. Synthesis of Sulfide Solid Electrolytes through the Liquid Phase: Optimization of the Preparation Conditions. ACS Omega 2020, 5, 26287–26294. [Google Scholar] [CrossRef]
- Yamamoto, K.; Yang, S.; Takahashi, M.; Ohara, K.; Uchiyama, T.; Watanabe, T.; Sakuda, A.; Hayashi, A.; Tatsumisago, M.; Muto, H.; et al. High Ionic Conductivity of Liquid-Phase-Synthesized Li3PS4 Solid Electrolyte, Comparable to That Obtained via Ball Milling. ACS Appl. Energy Mater. 2021, 4, 2275–2281. [Google Scholar] [CrossRef]
- Ohara, K.; Masuda, N.; Yamaguchi, H.; Yao, A.; Tominaka, S.; Yamada, H.; Hiroi, S.; Takahashi, M.; Yamamoto, K.; Wakihara, T.; et al. Observation of Liquid Phase Synthesis of Sulfide Solid Electrolytes Using Time-Resolved Pair Distribution Function Analysis. Phys. Status Solidi B 2020, 257, 2000106. [Google Scholar] [CrossRef]
- Ito, A.; Kimura, T.; Sakuda, A.; Tatsumisago, M.; Hayashi, A. Liquid-phase synthesis of Li3PS4 solid electrolyte using ethylenediamine. J. Sol.-Gel. Sci. Technol. 2021, 414, 359. [Google Scholar] [CrossRef]
- Calpa, M.; Nakajima, H.; Mori, S.; Goto, Y.; Mizuguchi, Y.; Moriyoshi, C.; Kuroiwa, Y.; Rosero-Navarro, N.C.; Miura, A.; Tadanaga, K. Formation Mechanism of β-Li3PS4 through Decomposition of Complexes. Inorg. Chem. 2021, 60, 6964–6970. [Google Scholar] [CrossRef] [PubMed]
- Delnick, F.M.; Yang, G.; Self, E.C.; Meyer, H.M.; Nanda, J. Investigation of Complex Intermediates in Solvent-Mediated Synthesis of Thiophosphate Solid-State Electrolytes. J. Phys. Chem. C 2020, 124, 27396–27402. [Google Scholar] [CrossRef]
- Gries, A.; Langer, F.; Schwenzel, J.; Busse, M. Determination of Reaction Enthalpies of Synthesizing β-Li3PS4 in Tetrahydrofuran. ACS Omega 2023, 8, 14034–14040. [Google Scholar] [CrossRef]
- Hubbard, C.R.; Evans, E.H.; Smith, D.K. The reference intensity ratio, I/IC, for computer simulated powder patterns. J. Appl. Crystallogr. 1976, 9, 169–174. [Google Scholar] [CrossRef]
- Scherrer, P. Bestimmung der Grösse und der Inneren Struktur von Kolloidteilchen Mittels Röntgenstrahlen. In Nachrichten von der Gesellschaft der Wissenschaften zu Göttingen; Vandenhoeck & Ruprecht: Göttingen, Germany, 1918; pp. 98–100. [Google Scholar]
- Stöffler, H.; Zinkevich, T.; Yavuz, M.; Senyshyn, A.; Kulisch, J.; Hartmann, P.; Adermann, T.; Randau, S.; Richter, F.H.; Janek, J.; et al. Li+-Ion Dynamics in β-Li3PS4 Observed by NMR: Local Hopping and Long-Range Transport. J. Phys. Chem. C 2018, 122, 15954–15965. [Google Scholar] [CrossRef]
- Holzwarth, U.; Gibson, N. The Scherrer equation versus the ‘Debye-Scherrer equation’. Nat. Nanotechnol. 2011, 6, 534. [Google Scholar] [CrossRef] [PubMed]
- Lim, H.-D.; Yue, X.; Xing, X.; Petrova, V.; Gonzalez, M.; Liu, H.; Liu, P. Designing solution chemistries for the low-temperature synthesis of sulfide-based solid electrolytes. J. Mater. Chem. A 2018, 6, 7370–7374. [Google Scholar] [CrossRef]
- Suto, K.; Bonnick, P.; Nagai, E.; Niitani, K.; Arthur, T.S.; Muldoon, J. Microwave-aided synthesis of lithium thiophosphate solid electrolyte. J. Mater. Chem. A 2018, 6, 21261–21265. [Google Scholar] [CrossRef]
- Cronau, M.; Szabo, M.; König, C.; Wassermann, T.B.; Roling, B. How to Measure a Reliable Ionic Conductivity? The Stack Pressure Dilemma of Microcrystalline Sulfide-Based Solid Electrolytes. ACS Energy Lett. 2021, 6, 3072–3077. [Google Scholar] [CrossRef]
- Doux, J.-M.; Yang, Y.; Tan, D.H.S.; Nguyen, H.; Wu, E.A.; Wang, X.; Banerjee, A.; Meng, Y.S. Pressure effects on sulfide electrolytes for all solid-state batteries. J. Mater. Chem. A 2020, 8, 5049–5055. [Google Scholar] [CrossRef]
- Wang, H.; Yu, M.; Wang, Y.; Feng, Z.; Wang, Y.; Lü, X.; Zhu, J.; Ren, Y.; Liang, C. In-situ investigation of pressure effect on structural evolution and conductivity of Na3SbS4 superionic conductor. J. Power Sources 2018, 401, 111–116. [Google Scholar] [CrossRef]
- Schneider, C.; Schmidt, C.P.; Neumann, A.; Clausnitzer, M.; Sadowski, M.; Harm, S.; Meier, C.; Danner, T.; Albe, K.; Latz, A.; et al. Effect of Particle Size and Pressure on the Transport Properties of the Fast Ion Conductor t-Li7SiPS8. Adv. Energy Mater. 2023, 13, 2203873. [Google Scholar] [CrossRef]
- Ohno, S.; Bernges, T.; Buchheim, J.; Duchardt, M.; Hatz, A.-K.; Kraft, M.A.; Kwak, H.; Santhosha, A.L.; Liu, Z.; Minafra, N.; et al. How Certain Are the Reported Ionic Conductivities of Thiophosphate-Based Solid Electrolytes? An Interlaboratory Study. ACS Energy Lett. 2020, 5, 910–915. [Google Scholar] [CrossRef]
- Milan, E.; Pasta, M. The role of grain boundaries in solid-state Li-metal batteries. Mater. Futures 2023, 2, 13501. [Google Scholar] [CrossRef]
- Arai, Y. Chemistry of Powder Production; Springer: Dordrecht, The Netherlands, 1996. [Google Scholar] [CrossRef]
- von Weimarn, P.P. The Precipitation Laws. Chem. Rev. 1925, 2, 217–242. [Google Scholar] [CrossRef]
Figure 1.
Diffractograms of synthesis product β-Li3PS4 under variation of concentration.

Figure 2.
SEM images of synthesis product β-Li3PS4 with varying solid fractions: 200 mg/mL (left), 100 mg/mL (middle) and 50 mg/mL (right).
Figure 2.
SEM images of synthesis product β-Li3PS4 with varying solid fractions: 200 mg/mL (left), 100 mg/mL (middle) and 50 mg/mL (right).

Figure 3.
Measurement of particle sizes in sample-50.

Figure 4.
Nyquist plots of synthesis product β-Li3PS4 with varying solid fractions at 25 °C. The inset depicts the equivalent circuit used for fitting.
Figure 4.
Nyquist plots of synthesis product β-Li3PS4 with varying solid fractions at 25 °C. The inset depicts the equivalent circuit used for fitting.

Figure 5.
Arrhenius plots of ionic conductivity of synthesis product β-Li3PS4 with varying solid fractions.
Figure 5.
Arrhenius plots of ionic conductivity of synthesis product β-Li3PS4 with varying solid fractions.


Table 1.
Summary of investigated entities.
| Sample-200 | Sample-100 | Sample-50 | |
|---|---|---|---|
| Concentration in mg/mL | 200 | 100 | 50 |
| Temperature increase in K | 40 | 21 | 9.6 |
| Residual Li2S in % | 4.7 | 5.7 | 4.1 |
| Crystallite size in nm | 76 ± 9 | 72 ± 7 | 52 ± 5 |
| Largest particles in µm | 9.3 ± 0.7 | 33 ± 4 | 64 ± 5 |
| Ionic conductivity × 10−4 S/cm | 0.63 ± 0.01 | 0.98 ± 0.03 | 0.78 ± 0.05 |
| Activation energy in eV | 0.388 ± 0.002 | 0.379 ± 0.002 | 0.383 ± 0.004 |
| Pellet density in % | 78 ± 1 | 77.4 ± 0.8 | 79.3 ± 0.6 |
Disclaimer/Publisher’s Note: The statements, opinions and data contained in all publications are solely those of the individual author(s) and contributor(s) and not of MDPI and/or the editor(s). MDPI and/or the editor(s) disclaim responsibility for any injury to people or property resulting from any ideas, methods, instructions or products referred to in the content. |
© 2024 by the authors. Licensee MDPI, Basel, Switzerland. This article is an open access article distributed under the terms and conditions of the Creative Commons Attribution (CC BY) license (https://creativecommons.org/licenses/by/4.0/).
Share and Cite
MDPI and ACS Style
Gries, A.; Langer, F.; Schwenzel, J.; Busse, M. Influence of Solid Fraction on Particle Size during Wet-Chemical Synthesis of β-Li3PS4 in Tetrahydrofuran. Batteries 2024, 10, 132. https://doi.org/10.3390/batteries10040132
AMA Style
Gries A, Langer F, Schwenzel J, Busse M. Influence of Solid Fraction on Particle Size during Wet-Chemical Synthesis of β-Li3PS4 in Tetrahydrofuran. Batteries. 2024; 10(4):132. https://doi.org/10.3390/batteries10040132
Chicago/Turabian StyleGries, Aurelia, Frederieke Langer, Julian Schwenzel, and Matthias Busse. 2024. "Influence of Solid Fraction on Particle Size during Wet-Chemical Synthesis of β-Li3PS4 in Tetrahydrofuran" Batteries 10, no. 4: 132. https://doi.org/10.3390/batteries10040132
Note that from the first issue of 2016, this journal uses article numbers instead of page numbers. See further details here.