

A Large-Crack Image-Stitching Method with Cracks as the Regions of Interest


1
Department of Civil Engineering, National Chung Hsing University, Taichung 40227, Taiwan
2
Department of Applied Geomatics, Chien Hsin University of Science and Technology, Taoyuan 32097, Taiwan
3
Department of Land Management, Feng Chia University, Taichung 407301, Taiwan
*
Author to whom correspondence should be addressed.
Infrastructures 2024, 9(4), 74; https://doi.org/10.3390/infrastructures9040074
Submission received: 28 February 2024
/
Revised: 10 April 2024
/
Accepted: 13 April 2024
/
Published: 16 April 2024
(This article belongs to the Special Issue Advanced Technologies in Data Collection, Evaluation, and Visualization of Reinforced Concrete Structures)
Abstract
:While crack detection is crucial for maintaining concrete structures, existing methods often overlook the analysis of large cracks that span multiple images. Such analyses typically rely on image stitching to create a complete image of a crack. Current stitching methods are not only computationally demanding but also require manual adjustments; thus, a fast and reliable solution is still lacking. To address these challenges, we introduce a stitching method that leverages the advantages of crack image-segmentation models. This method first utilizes the Mask R-CNN model for the identification of crack regions as regions of interest (ROIs) within images. These regions are then used to calculate keypoints of the scale-invariant feature transform (SIFT), and descriptors for these keypoints are computed with the original images for image matching and stitching. Compared with traditional methods, our approach significantly reduces the computational time; by 98.6% in comparison to the Brute Force (BF) matcher, and by 58.7% with respect to the Fast Library for Approximate Nearest Neighbors (FLANN) matcher. Our stitching results on images with different degrees of overlap or changes in shooting posture show superior structural similarity index (SSIM) values, demonstrating excellent detail-matching performance. Moreover, the ability to measure complete crack images is indicated by the relative error of 7%, which is significantly better than that of traditional methods.
1. Introduction
Crack detection plays an indispensable role in the monitoring of the health of concrete structures, with its significance extending beyond simply preventing structural damage to ensuring public safety and long-term maintenance. However, during inspections, merely identifying and detecting a single crack is not sufficient to understand the structural behavior [1]. Additionally, inspection tasks generate a large volume of image data, which require effective organization. A typical solution is the application of image stitching [2], which is a viable method for increasing the field of view [3]. Stitched images can provide high-resolution images, improving the results when detecting crack defects, especially in the case of detecting fine cracks [4].
The measurement accuracy in crack detection is crucial for the maintenance of structures, as cracks as small as approximately 0.3 to 0.4 mm are considered to be defects [5]. For fine cracks ranging from 0.3 to 0.4 mm, the shooting distance should not be too far; otherwise, the crack images will become insufficiently clear due to inadequate spatial resolution, thus failing to meet the detection requirements. In order to satisfy the requirements for measuring cracks with images during inspections, the spatial resolution of the images must reach at least 0.1 mm/pixel. For a typical camera, this would correspond to a shooting distance of about 50 cm. Taking an image size of 3200 4800 pixels as an example, at a resolution of 0.1 mm/pixel, the imaging area would only cover 3248 square centimeters. This implies that, for cracks exceeding one meter in length, dense imaging is required for detailed documentation. However, at this point, crack information would be scattered across different images, making it challenging to conduct a comprehensive analysis and evaluate the potential harm the crack poses to the concrete structure, as well as whether it has caused structural damage.
For such cross-image crack damage analysis, image stitching can be employed to construct complete crack images for assessment [6,7]. Traditionally, the most commonly used method is to utilize the scale-invariant feature transform (SIFT) for image stitching [8,9,10]. However, while the SIFT excels in maintaining scale invariance, its drawbacks include susceptibility to the erroneous matching of keypoints, resulting in suboptimal stitching results [10]; it also involves a considerable computational burden, particularly for high-resolution images, to the extent that it may be impractical [9]. For the issue of erroneous matching, Tian et al. [10] utilized the geometric relationships between crack feature points to improve matching accuracy, while Woo et al. [11] used the SIFT combined with the Random Sample Consensus (RANSAC) algorithm [12] to compute homography matrices for image stitching. Additionally, researchers have explored various feature-matching methods combined with RANSAC for crack image-stitching tasks; Da et al. [13] and Wu et al. [14], for instance, used the SURF and ORB (Oriented FAST and Rotated BRIEF) algorithms, respectively, in combination with RANSAC. Apart from using RANSAC during the computation of homography matrices, scholars have proposed different feature-matching strategies. For instance, Geda et al. [15] used the Accelerated-KAZE (AKAZE) feature-detection algorithm combined with the k-nearest neighbor algorithm and Lowe’s ratio test [16] to stitch pavement images, while Wang et al. [17] combined the uniformed ORB algorithm with the KD tree and k-nearest neighbor algorithms for feature-point matching, and similarly employed RANSAC to enhance the matching accuracy. These methods, which combine feature matching with different matching strategies and utilize RANSAC for stitching, have shown promising results in crack image stitching. However, these approaches involve computation on entire images, which, for high-resolution images with numerous feature points, requires a significant computation time to find all matching point pairs. In particular, when using the Brute Force (BF) matcher, matching between only two images can take several minutes.
To reduce the matching computation time, reducing the number of matching points is a highly effective approach. The most direct method is to use only feature points within the region of interest (ROI) for matching. For instance, Huang et al. [18] manually delineated crack and non-crack regions and then used the SIFT for underwater crack image stitching. Similarly, Wang et al. [19] partitioned the ROIs in an image into fixed areas and matched the corresponding ROIs in adjacent images using the SIFT. However, this rigid ROI specification imposes considerable demands on the consistency of posture and overlap in the capture of the images, which is difficult to achieve in practical shooting operations and is not suitable for practical use. For crack image stitching, the primary ROI is the area of pixels in which a crack is located. Wang et al. [9] proposed a method of first detecting cracks and then stitching images. In this study, crack detection was performed using the Canny edge-detection method. After noise elimination, the SIFT was used to calculate matching keypoints and descriptors for a binary crack image. Finally, stitching was performed using Lowe’s ratio test [16] and RANSAC to produce a complete binary crack image. However, the Canny algorithm requires manual parameter adjustment, meaning that its results depend on the operator’s relevant experience. Additionally, the Canny algorithm is a form of image processing, and such methods have limited crack-recognition capabilities and are prone to noise. They also require reliance on empirical rules to filter out noise from binary images; otherwise, non-crack noise can adversely affect the stitching results. Furthermore, this method uses a binary image for the computation of the SIFT, which, despite reducing the number of keypoints, also causes the loss of a significant amount of texture information. This is highly disadvantageous for the calculation of the SIFT descriptor and can lead to erroneous matches, thereby affecting the stitching results.
In addressing the limitations of the Canny algorithm for crack detection, recent developments in convolutional neural networks (CNNs) have proven effective [20,21]. Whether using object-detection models or image-segmentation models, CNNs demonstrate excellent performance in crack detection. Unlike object-detection models, image-segmentation models can perform pixel-level classification on images while effectively marking crack areas with masks and being robust to noise [22]. This facilitates the extraction of regions of interest (ROIs) for crack image stitching.
Of the various CNN models, the Mask R-CNN model is often applied and compared in concrete crack-recognition studies [23,24,25]. Compared with image-segmentation models such as U-Net and DeepCrack, Mask R-CNN demonstrates superior performance in complex imaging situations [24] and is concurrently more suited for application in on-site concrete damage detection [25]. Furthermore, the Mask R-CNN model can also be utilized for crack recognition in different materials, such as asphalt pavement [26,27] and metal surfaces [28,29]. In related research, some scholars have discussed both image-stitching and crack-recognition models in experiments [14,19]. However, these studies typically addressed these two issues separately—completing image stitching first and then performing crack recognition using different CNN models—without considering that the detection results of the CNN models could serve as regions of interest (ROIs) for crack image stitching. Through integrating both tasks, it is possible to achieve crack image stitching concurrently with successful crack recognition, facilitating subsequent crack hazard analysis.
Based on this literature review, it is known that current methods for image stitching with large cracks cannot simultaneously achieve speed and robustness, and they still rely on operational expertise. Therefore, this study proposes a new method to address this issue. Utilizing the advantages of current crack image-segmentation models in pixel-level segmentation, this method segments the binary mask of a crack area in an image into regions of interest (ROIs). Subsequently, the SIFT is used to compute the matching keypoints within the ROIs of the image, and the SIFT descriptors for the keypoints in the original image are calculated. Finally, this process involves the completion of the matching and stitching of the crack area images. The method proposed in this study offers several advantages:
- Utilizing a crack image-segmentation model to identify crack regions as ROIs eliminates the need for manual parameter adjustments, thus avoiding reliance on operational expertise. Moreover, the noise within the recognition results is significantly lower than that of methods using image processing.
- Computing the keypoints in images of ROIs instead of using a binary mask of a crack area significantly reduces the number of keypoints to be matched, effectively decreasing the computation time. Moreover, this approach is not affected by variations in the mask’s shape, ensuring both robustness and optimal stitching results in the crack area.
- Calculating the descriptors of keypoints from the original image preserves texture-feature information outside the ROI, enhancing the number of effective matches. This ensures good stitching results even for images with significant differences in shooting angles.
According to the experimental results, the method proposed in this study significantly saves computation time compared with traditional methods. Additionally, the proposed method demonstrates excellent performance in handling images with varying degrees of overlap or changes in shooting angles when successfully completing stitching tasks. Notably, the proposed method surpasses traditional methods in detail matching, achieving higher SSIM values across various metrics. Regarding the measurement accuracy for the crack length, the proposed method achieves a relative error of 7%, which is significantly better than that of traditional methods, highlighting its importance for subsequent crack hazard assessments. Moreover, the method proposed in this study includes a process of crack detection before stitching, avoiding unnecessary stitching operations on images without cracks, thus effectively improving the efficiency of the detection of cracks in concrete structures. Future research could consider integrating quantitative analysis and risk assessment for large cracks to further enhance the detection mechanism for such cracks.
2. Materials and Methods
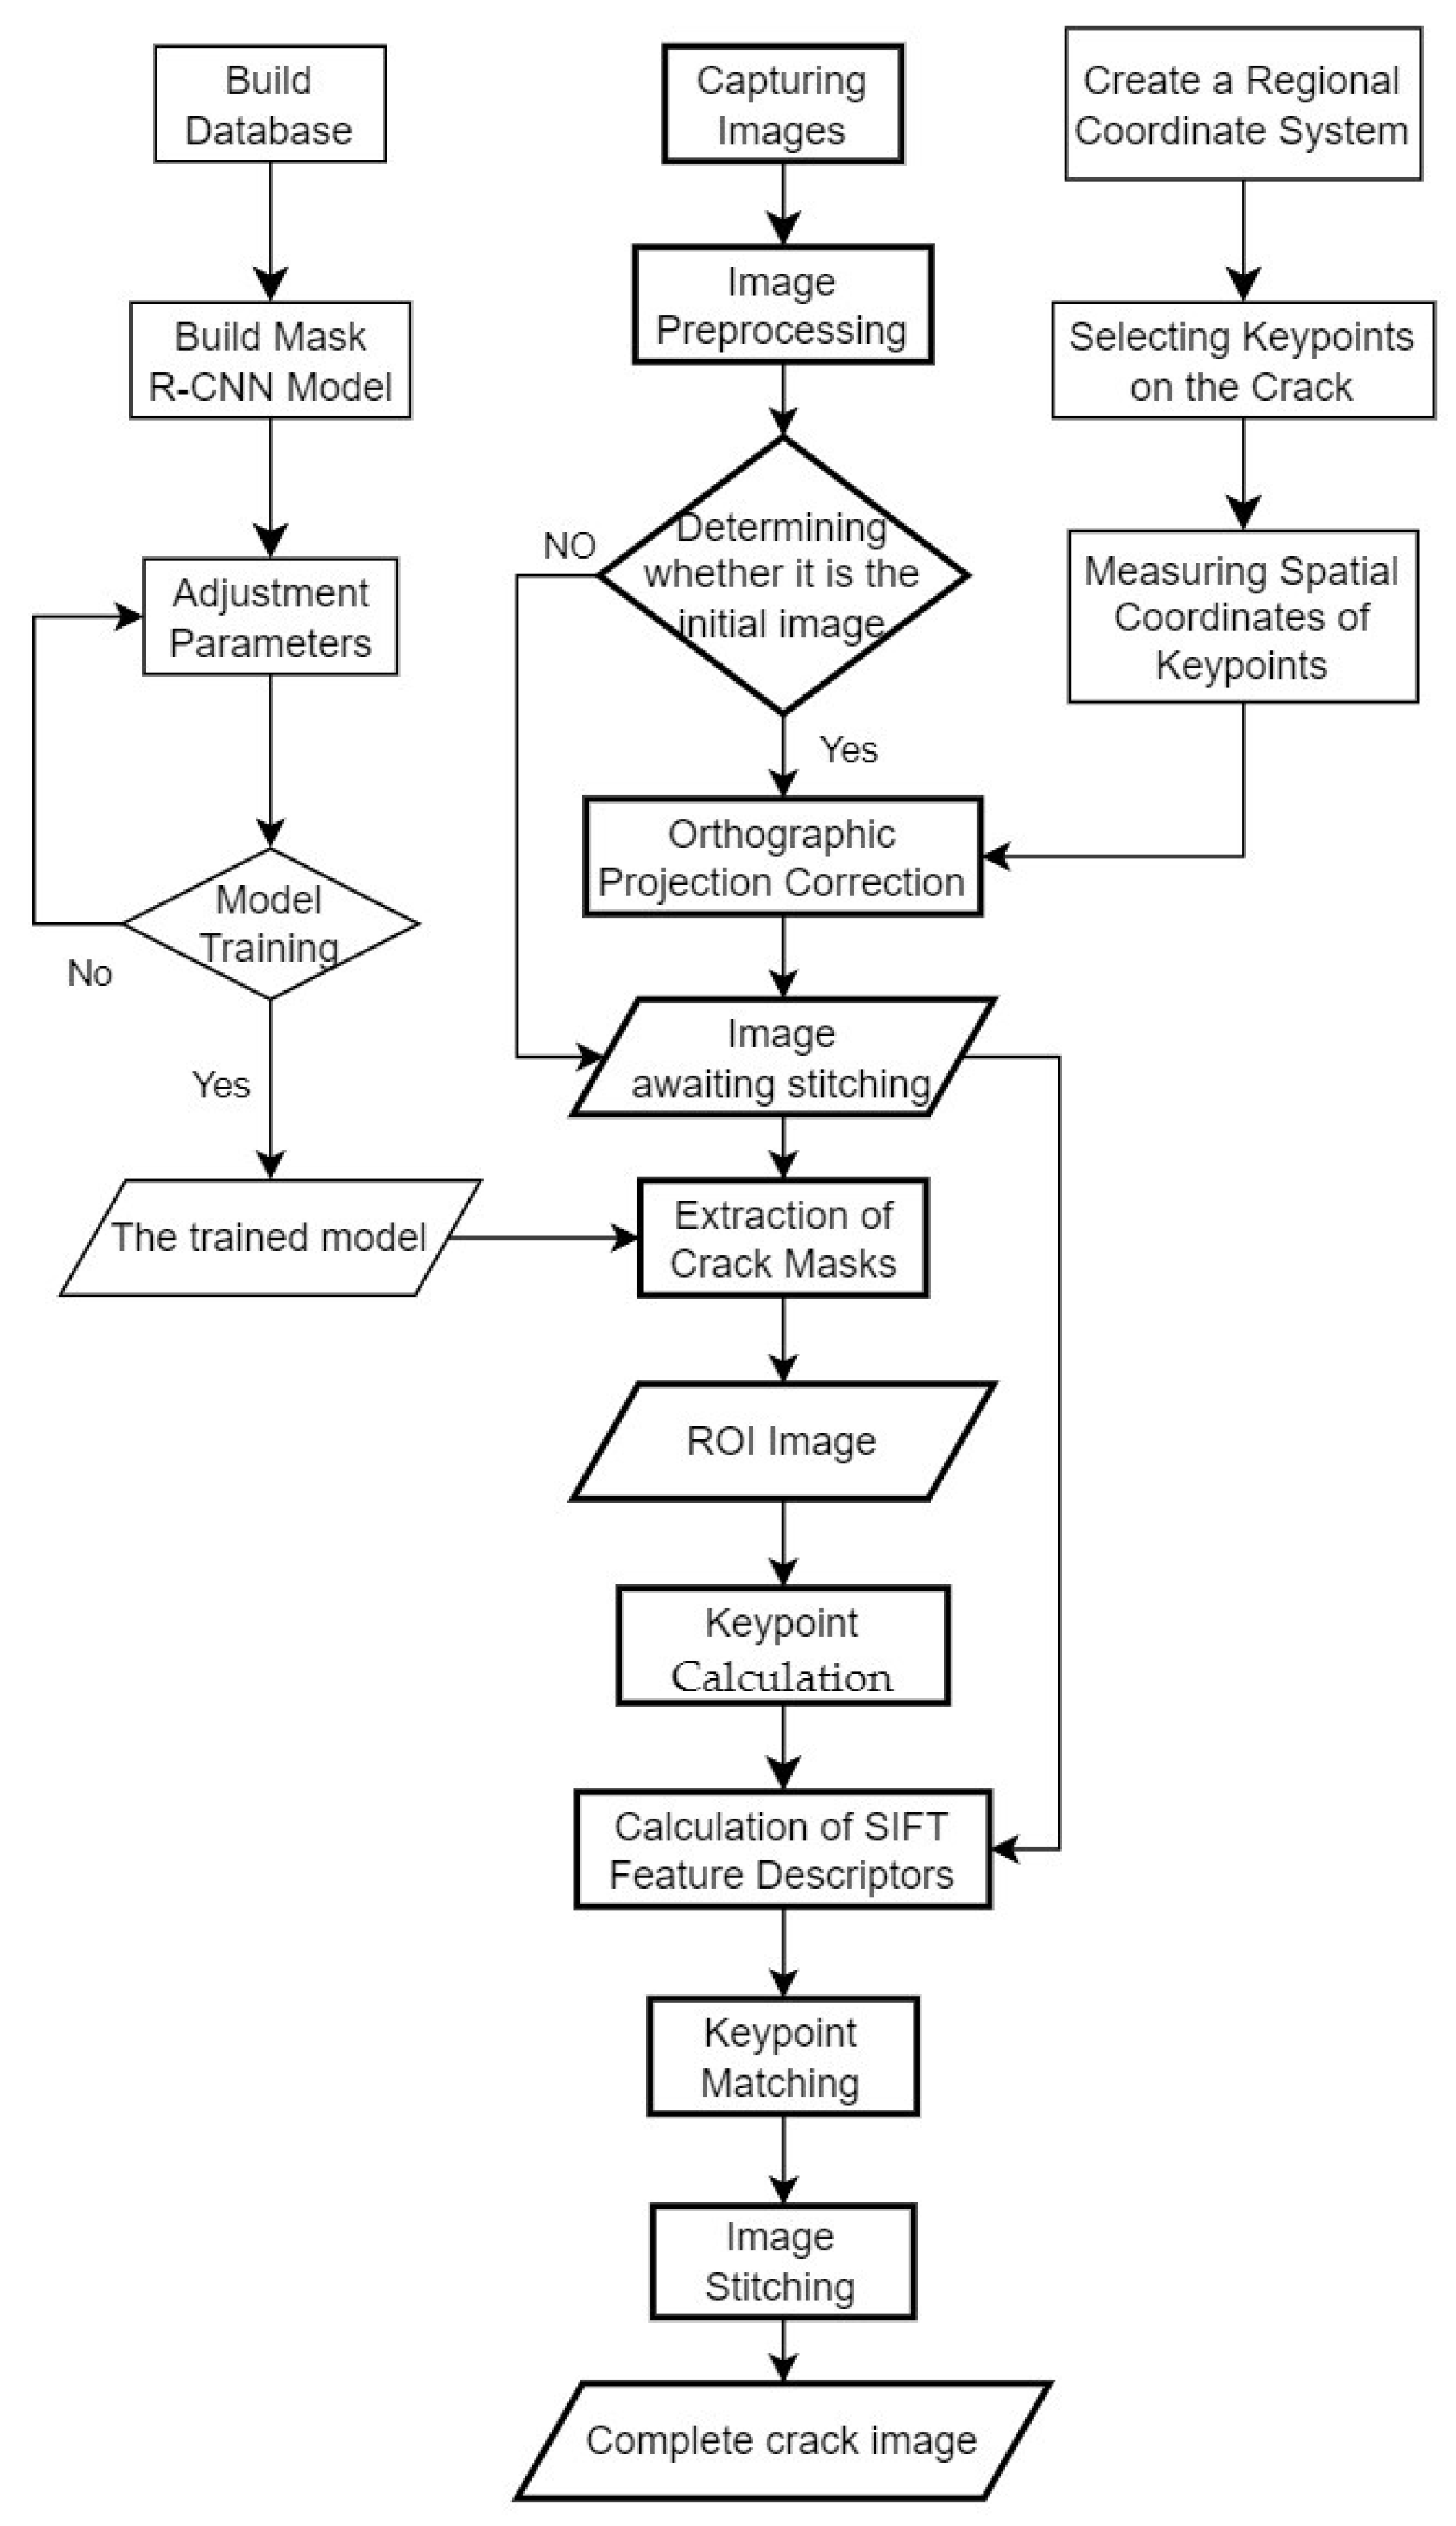
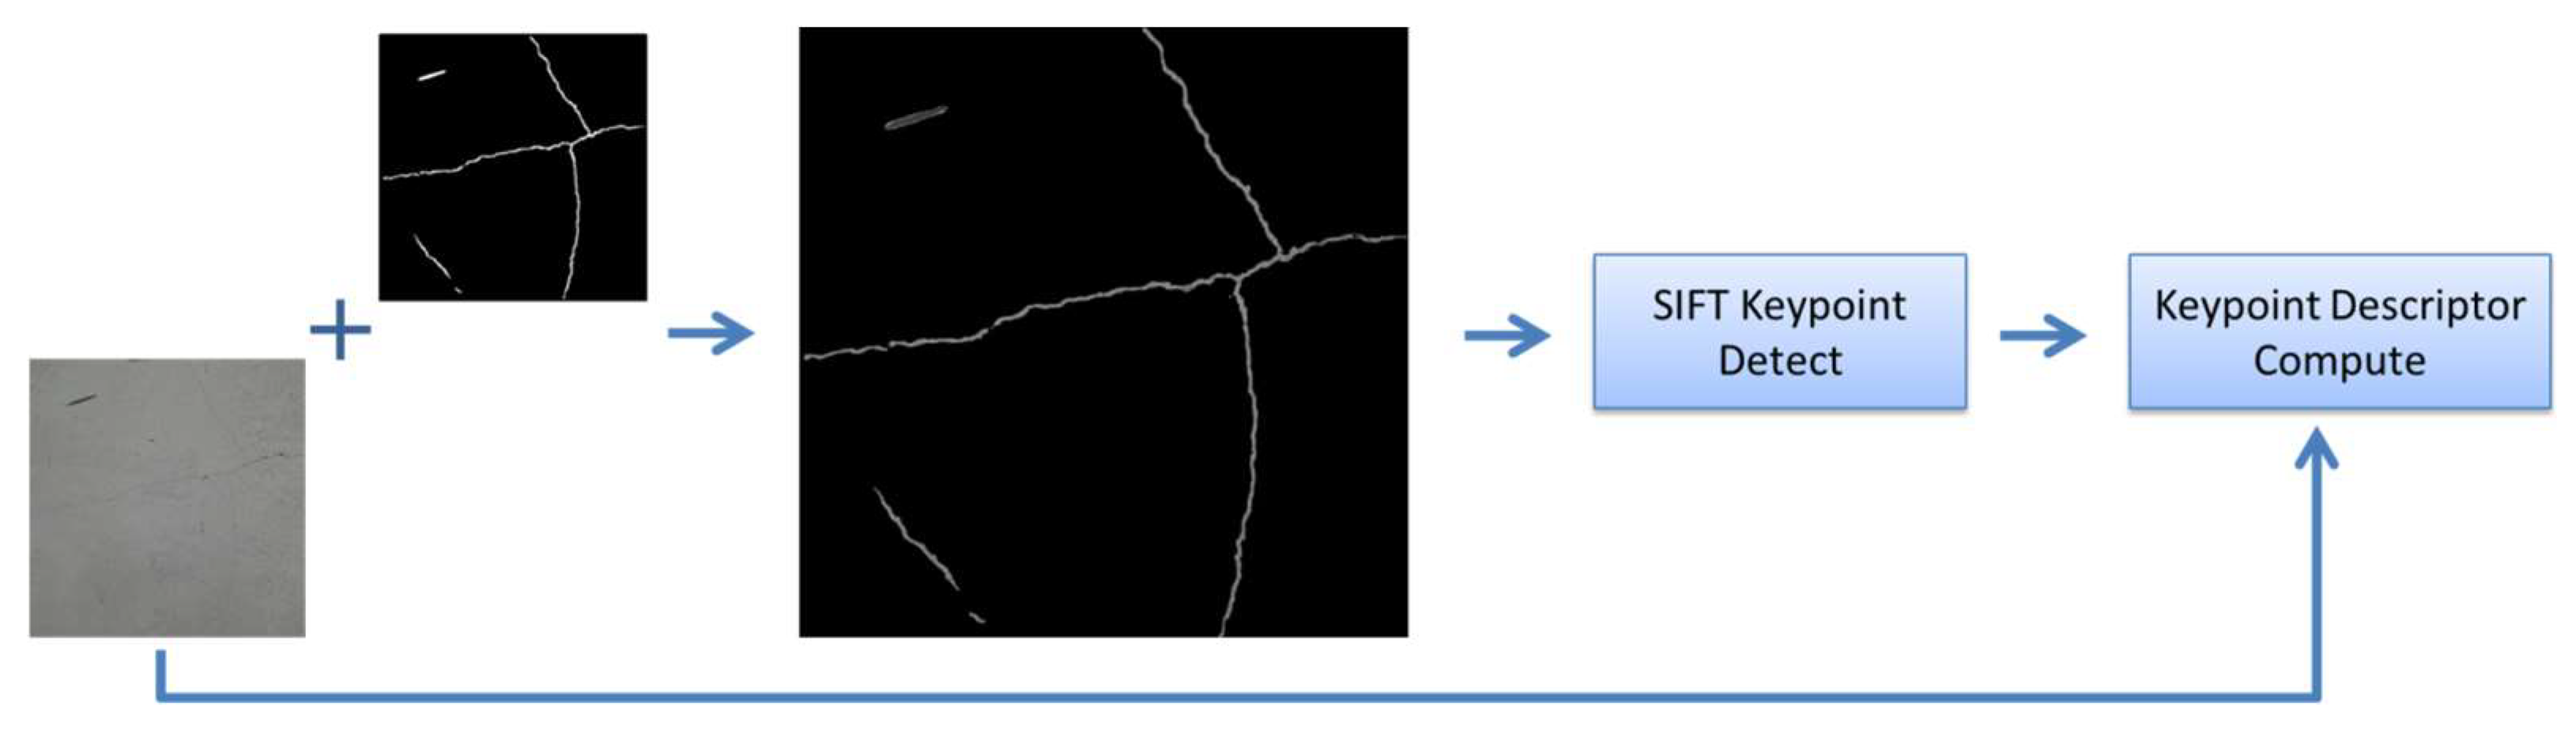
This study utilizes a crack image-segmentation model to extract crack regions from images as ROIs, then the SIFT keypoints in these ROI images are calculated; finally, the descriptors in the original images are calculated to complete the stitching of crack-region images. Figure 1 illustrates the workflow of the proposed method, wherein the crack image-segmentation model employed is a Mask R-CNN model trained specifically for this study. Additionally, this study incorporates the spatial coordinates of feature points on cracks into the image-stitching process for image projection correction. This approach can enhance the stability of continuous image stitching and enable final images of complete cracks to provide measurement capabilities. Each step is detailed in the following subsections. The image-processing techniques used in this study were implemented using the Python3.7 OpenCV library, with all processing conducted on the same computer under consistent hardware conditions.
2.1. Capturing Images
The experimental site chosen for this study was the Taichung Cultural and Creative Industries Park in Taiwan, where multiple cracks were present in the concrete walls. Tests were conducted using images captured at one location with a large-scale branching crack and in another area with more complex cracks. Multiple sets of images were captured for each crack location, and efforts were made to keep the camera parallel to the wall during shooting. For each set of images, the camera was maintained in a similar shooting posture, and attention was paid to the overlap between images. However, there were slight variations in the shooting posture between different sets of images.
2.2. Image Preprocessing
The camera used in this study was a SONY RX0, with a focal length of 9.2 mm and an image resolution of 3200 × 3200 pixels. The RX0 belongs to the category of general cameras, and calibration is required to correct for distortions caused by the lens. The calibration method used in this study was the planar chessboard-grid calibration technique [30]. This method involved taking photographs of a black-and-white chessboard grid at different angles and then calculating the camera’s distortion parameters based on the chessboard grid’s corner points in the images. After correcting for distortion parameters, the distortions within the images could be removed. This not only enhanced the integrity of the image-stitching results but also improved the measurement accuracy of the images.
2.3. Training of the Crack Image-Segmentation Model and the Extraction of Crack Masks
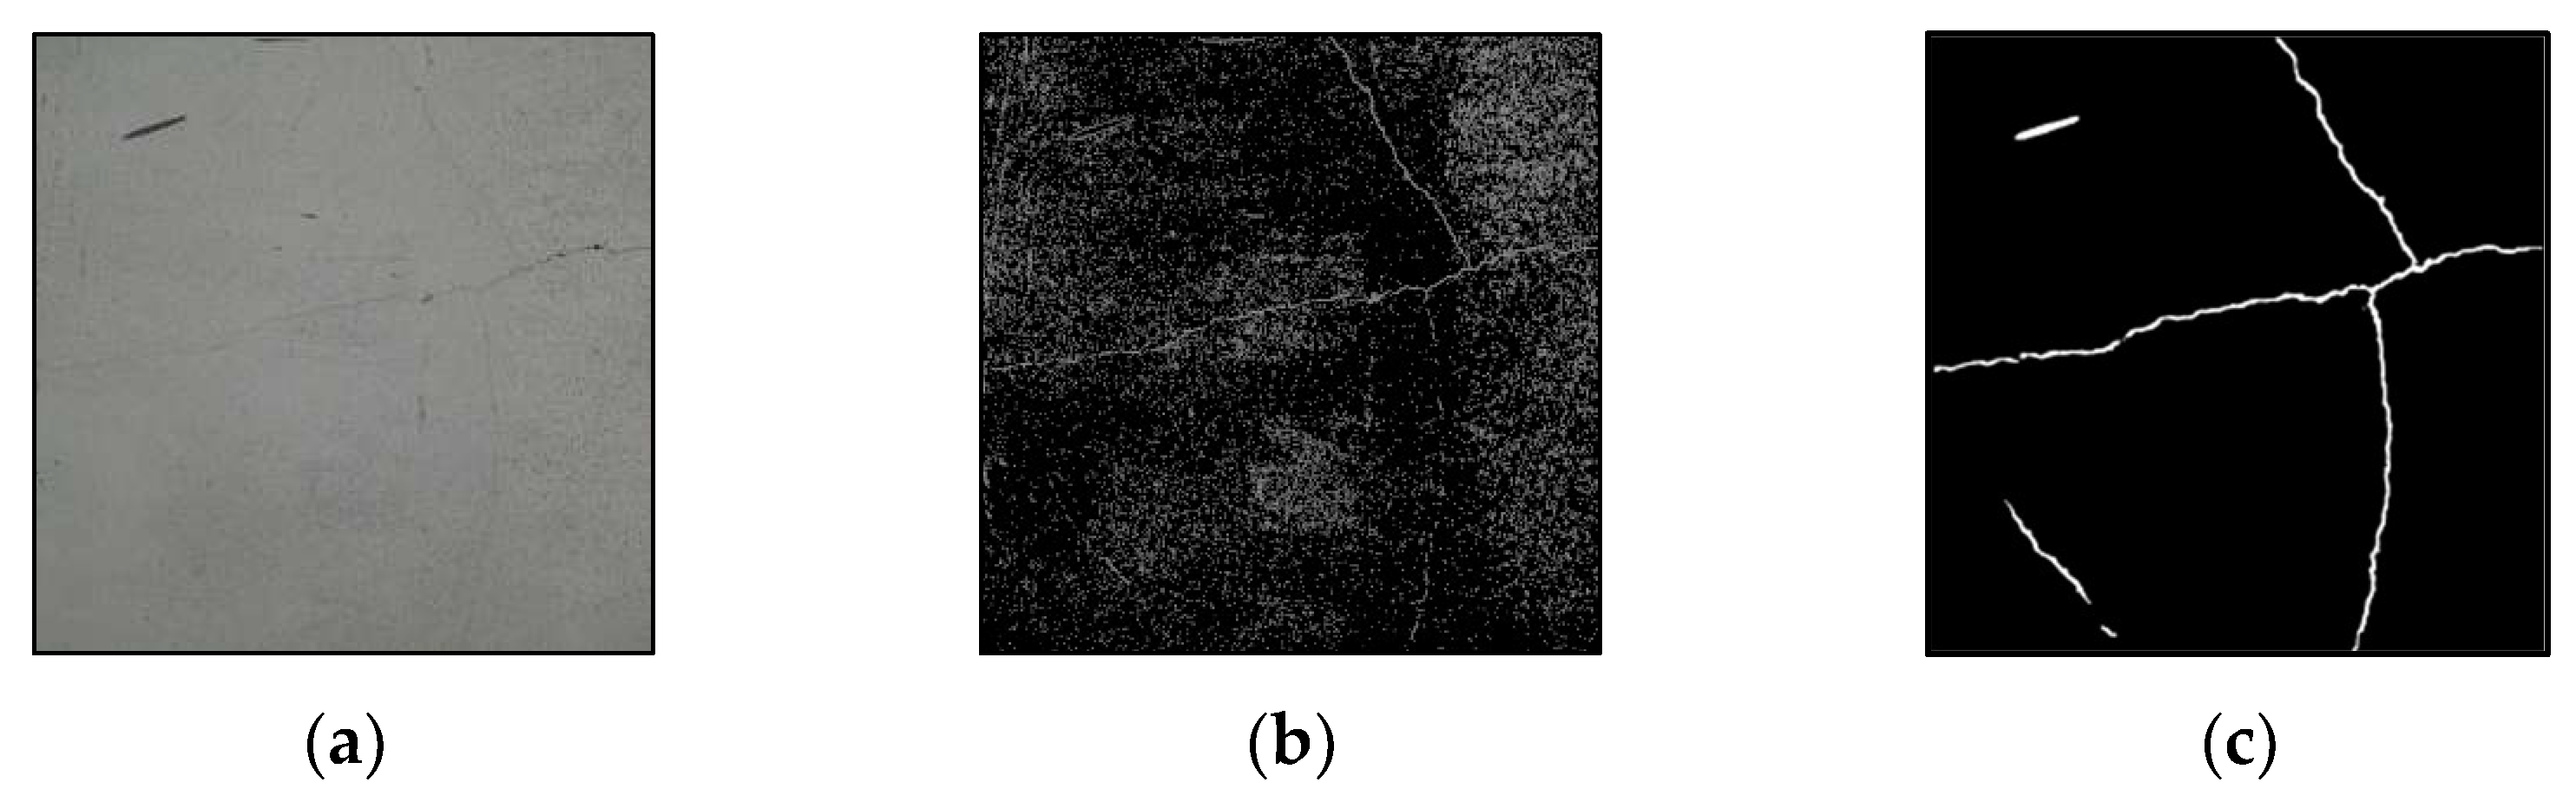
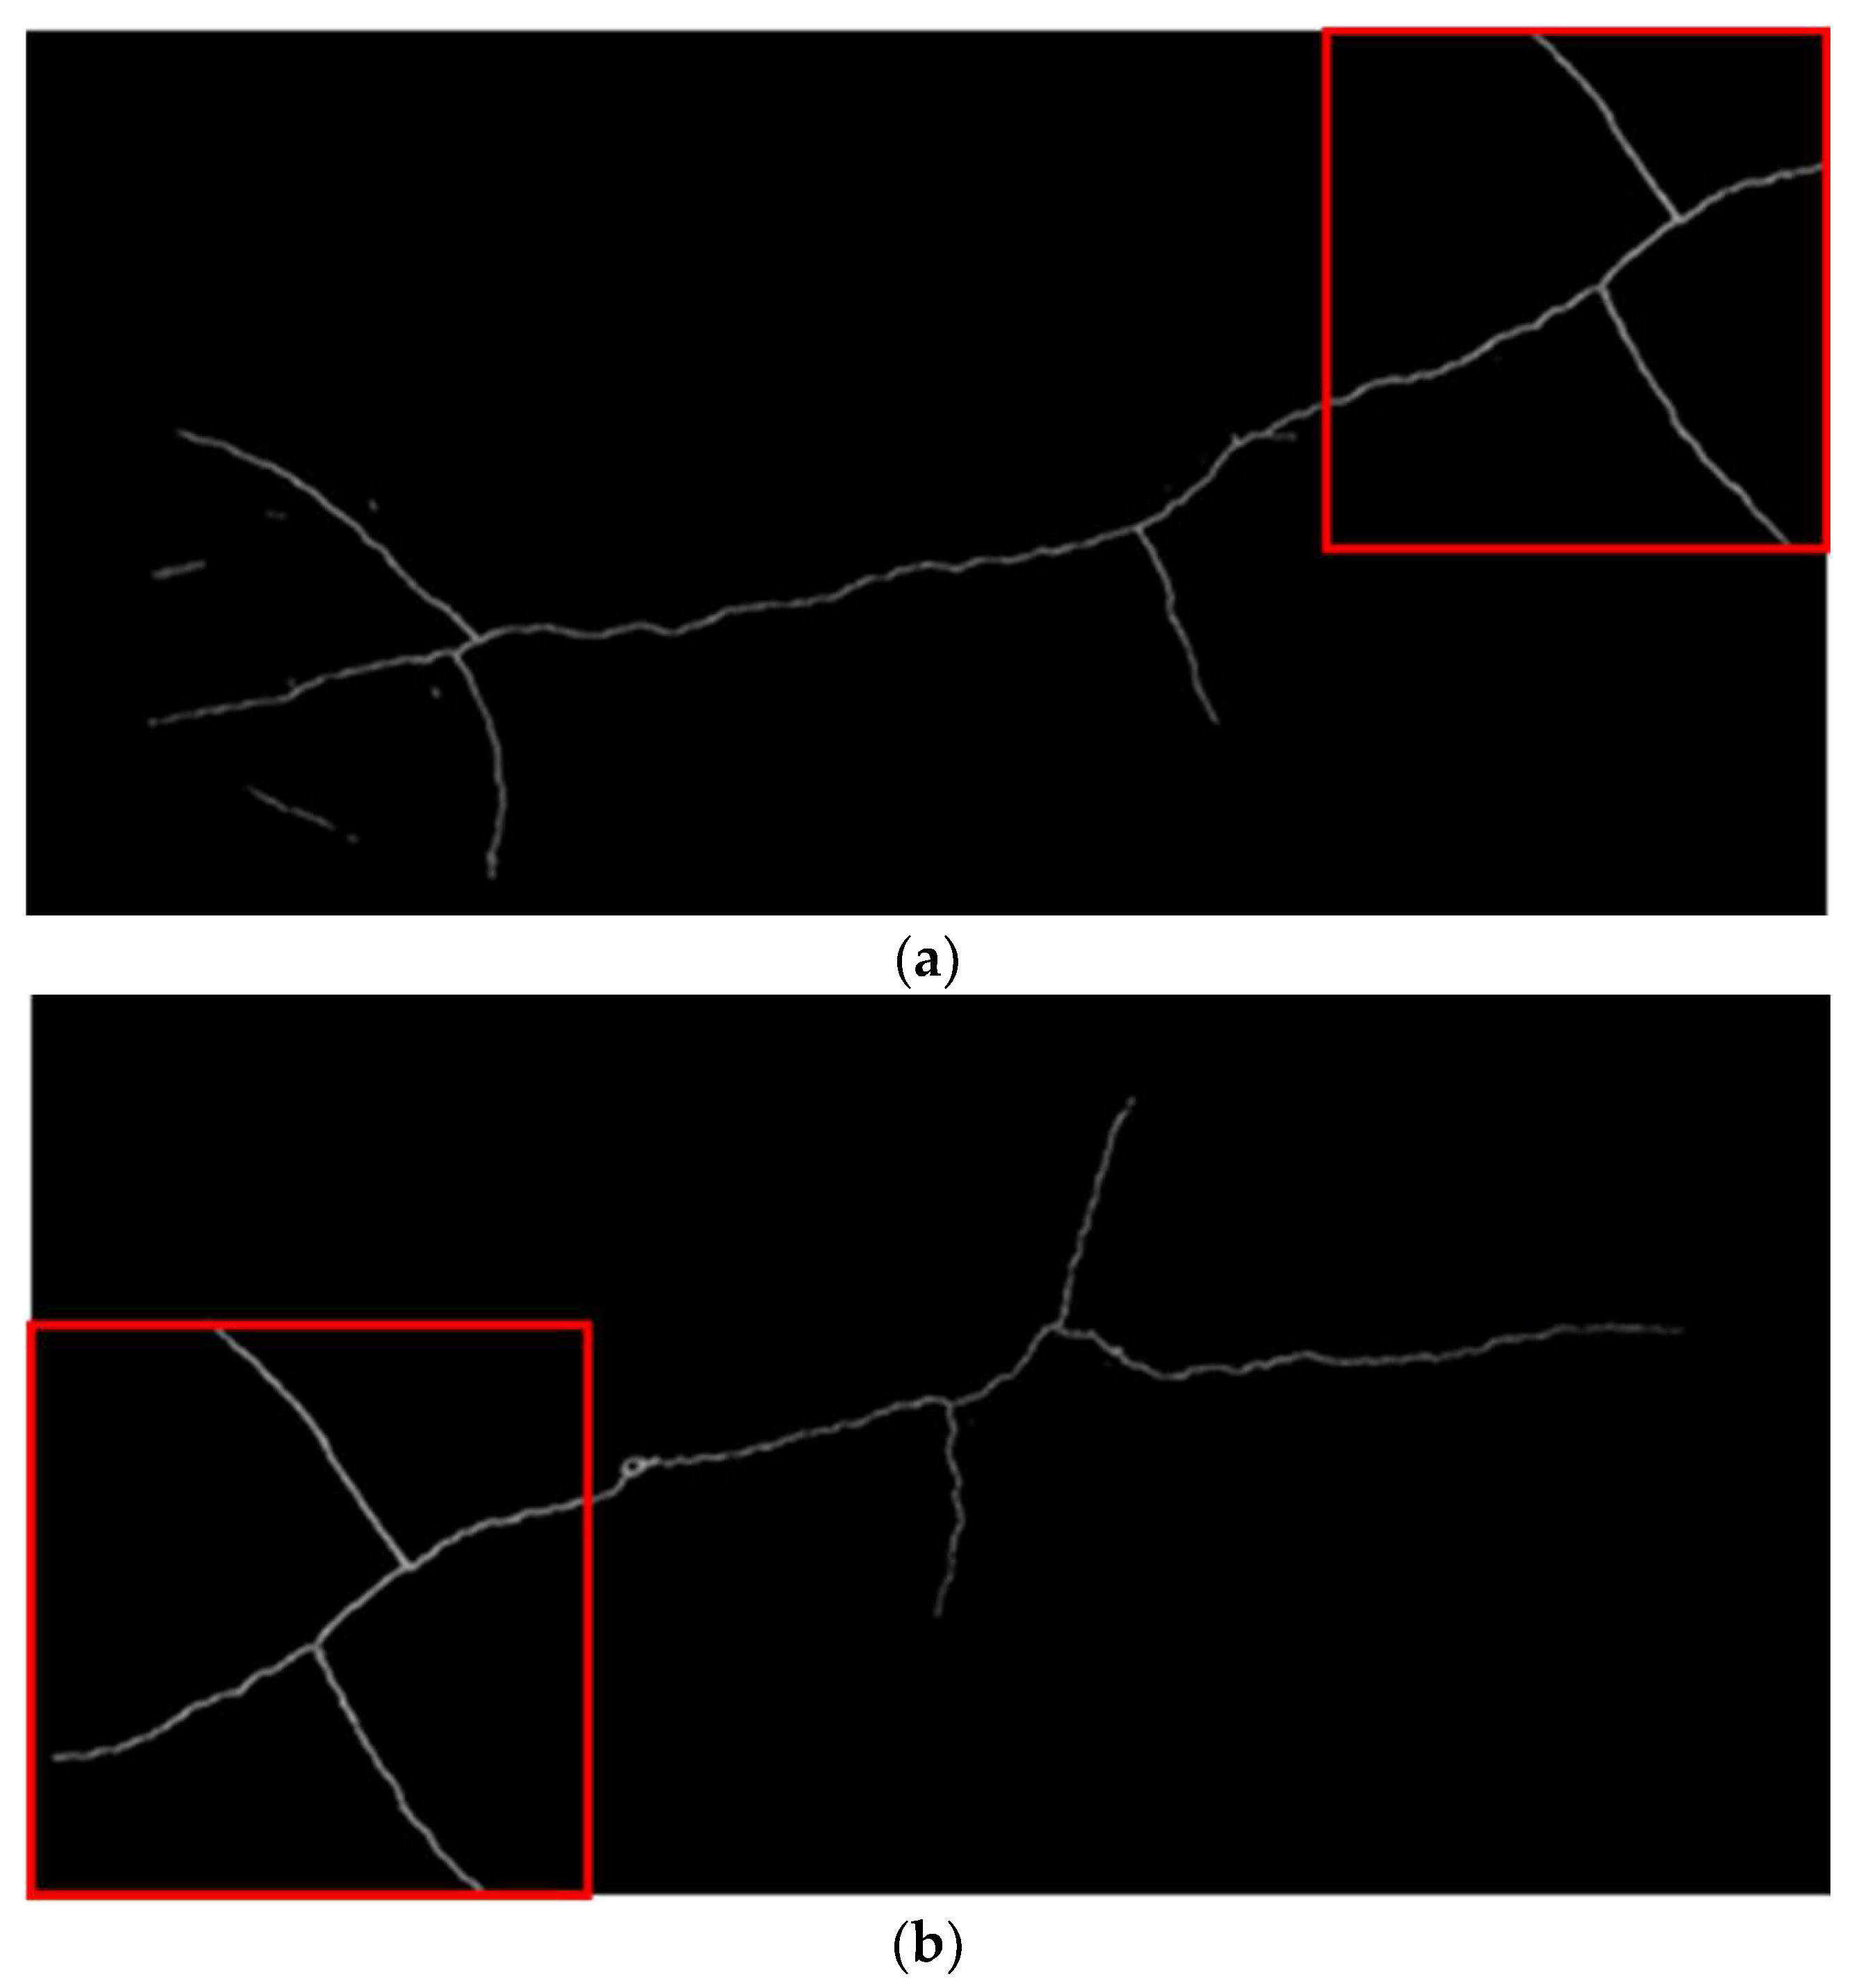
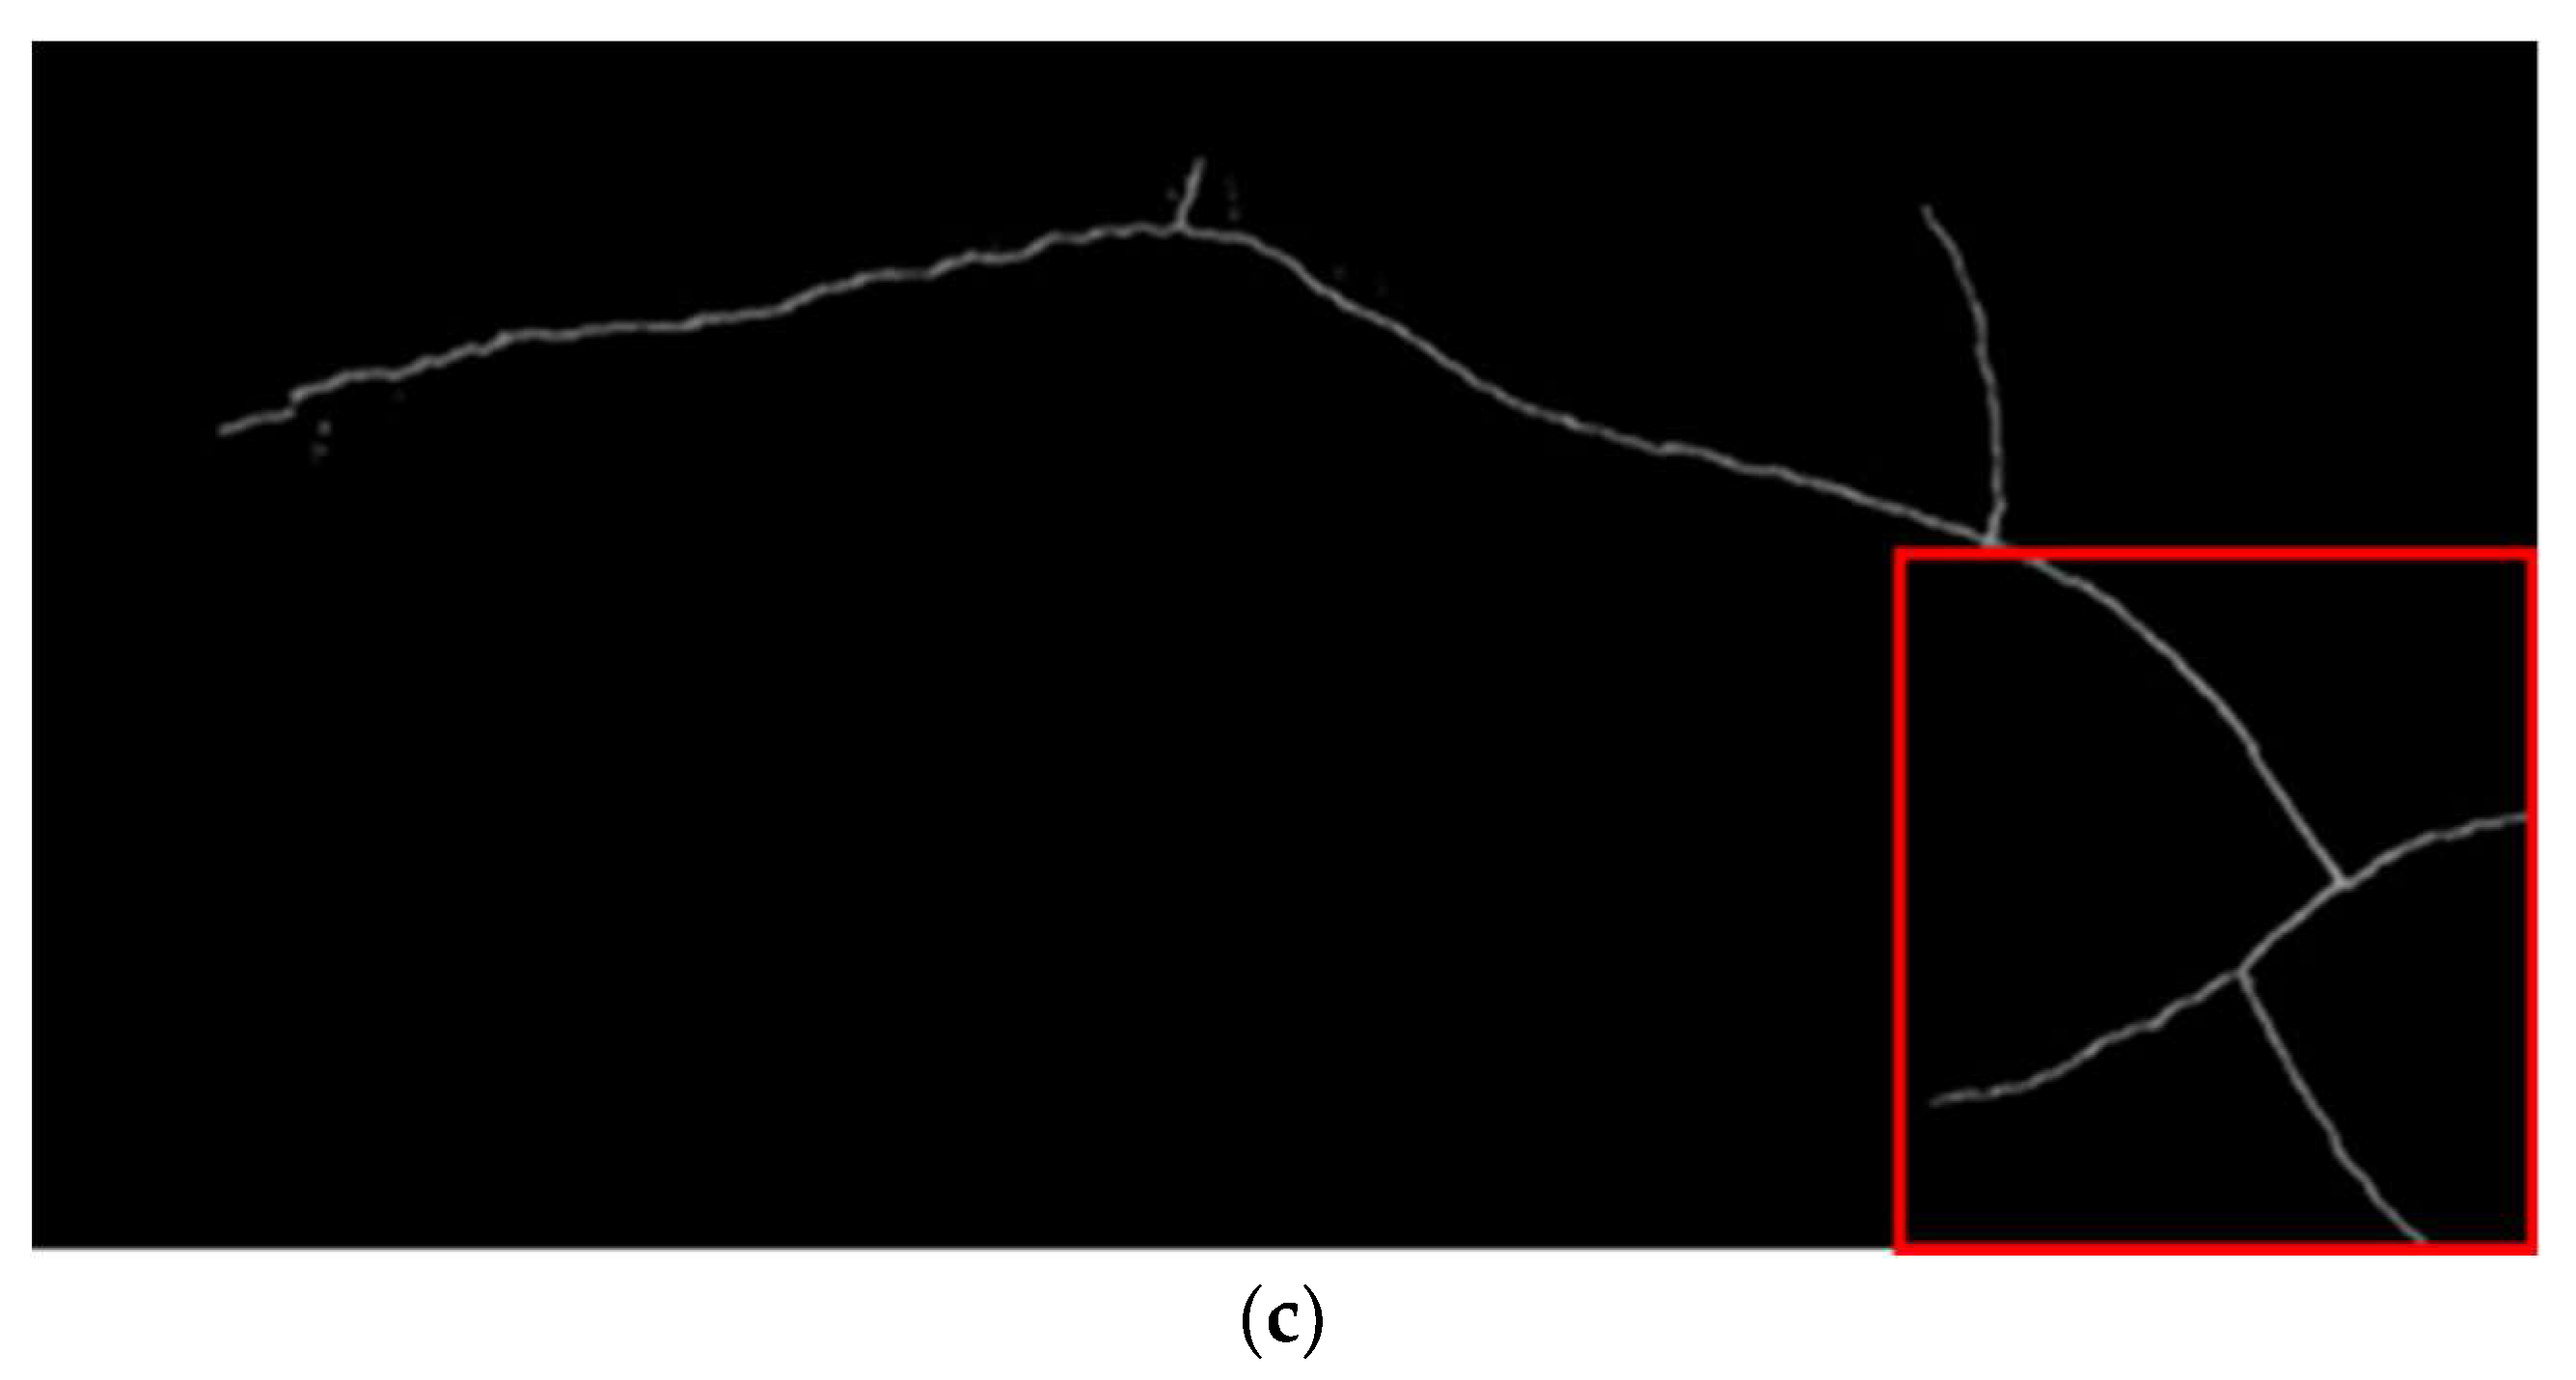
In the process of image stitching, the most time-consuming task is matching large numbers of keypoints. In addressing this issue, Wang et al. [9] employed the Canny edge-detection method to filter out crack pixels in images and then extracted keypoints from these pixels for matching. While this approach effectively reduces the number of keypoints by reducing image information, the quality of edge detection depends on the selected parameters and may have limited effectiveness in removing noise, as shown in Figure 2b. In contrast, the method proposed in this study utilizes a crack image-segmentation model to detect crack regions in images and generate masks, which are used as ROIs. This approach effectively filters out noise, as illustrated in Figure 2c.
This study utilized the crack data set provided by Volker [31] to train the Mask R-CNN model. A total of 788 images were selected from this data set. Data augmentation was performed on each image by rotating it by 90°, 180°, and 270°, increasing the brightness by 10%, decreasing the brightness by 10%, and mirroring, resulting in a sixfold increase in the number of images. The final data set comprised 5516 images, and all were resized to 448 × 448 pixels. The images were randomly split into training and validation sets in an 80:20 ratio.
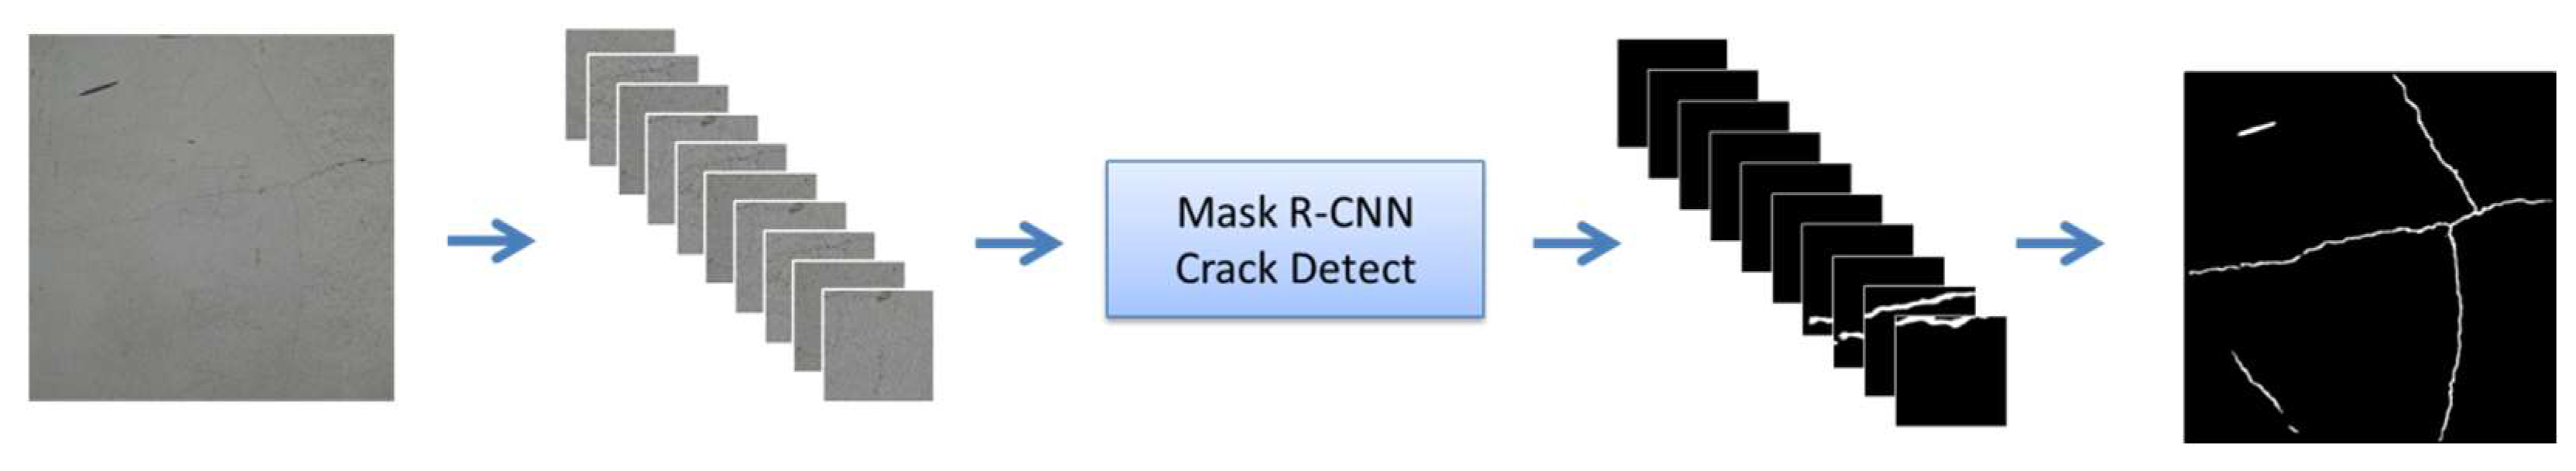
On the other hand, when calculating the mask for the crack regions in the images, the images were not resized in this study. Instead, the original images were segmented into several smaller images with a size of 448 × 448 pixels, which were then fed into the Mask R-CNN model. The segmentation results of these cropped images were subsequently stitched together to reconstruct the original image, as illustrated in Figure 3. This approach prevented the loss of subtle crack features due to resizing, ensuring the accurate identification of cracks.
2.4. Keypoint Calculation
According to the method proposed by Wang et al. [9], compared with using the original images, using binary images indeed reduces the number of keypoints, as shown in Figure 4a,b. In the method proposed in this study, binary images correspond to the masks of crack regions. However, it is not recommended to use a mask image to calculate keypoints for matching due to the following three issues. First, the masks generated by Mask R-CNN do not perfectly align with the crack pixels, resulting in differences in the contours of the crack masks in overlapping areas of adjacent images. Second, the keypoints detected in the mask images mainly surround the mask’s perimeter, resulting in a minority of keypoints within the mask, as shown in Figure 4c. Finally, using a binary mask means ignoring the texture information of crack pixels and their surroundings, which prevents the SIFT’s matching advantages from being leveraged. The differences in mask contours, the keypoints predominantly surrounding the mask, and the disregard for texture information are all critical issues for subsequent matching tasks.
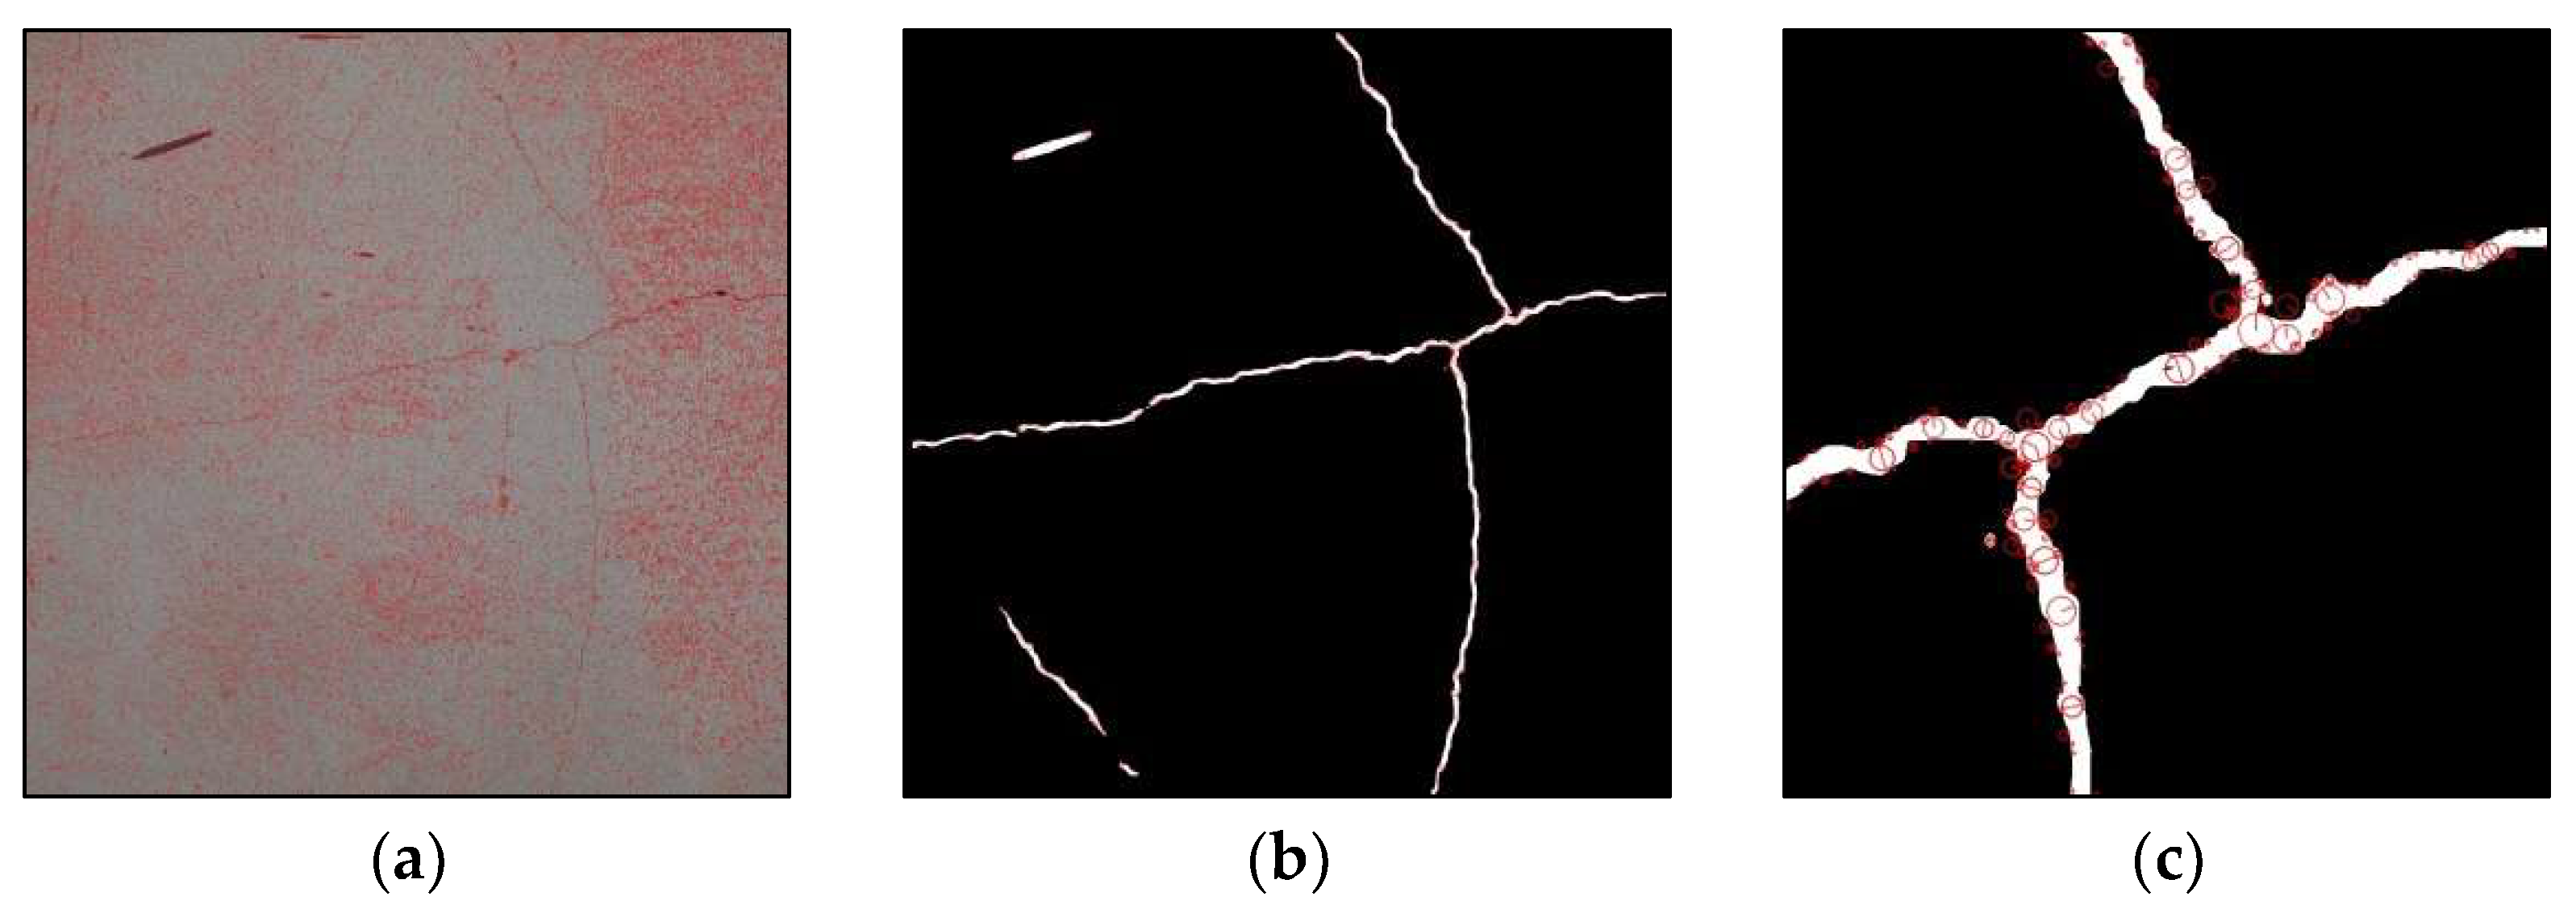
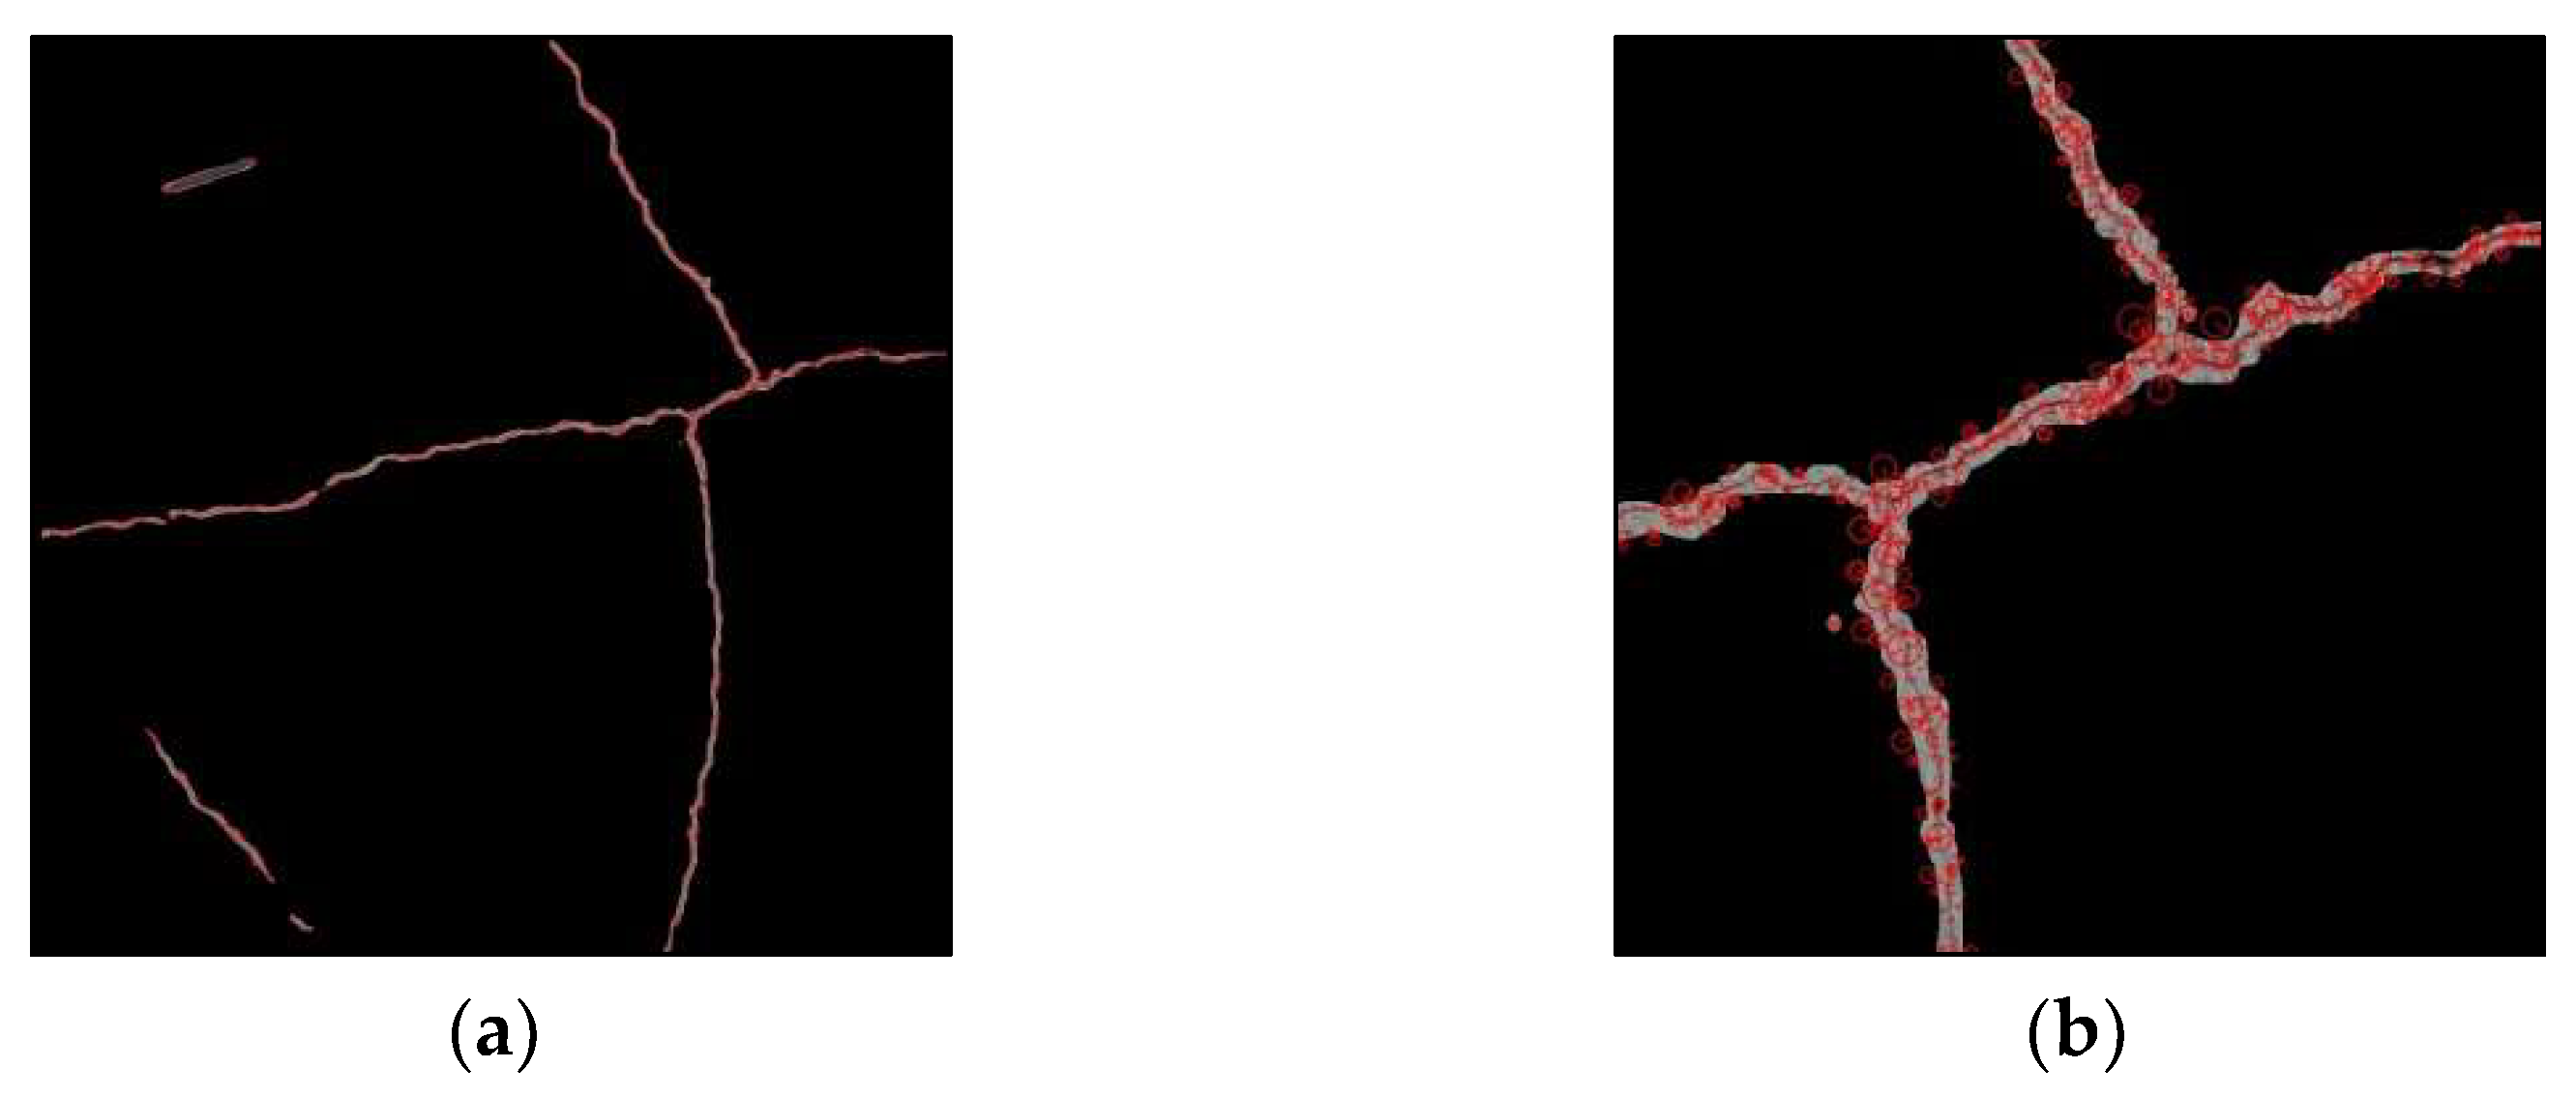
Due to the aforementioned limitations, this study proposes the partitioning of the mask into ROIs, followed by the detection of keypoints for matching in the ROI images. As long as there is an overlap in the ROIs between two adjacent images, matching and stitching can be accomplished based on the keypoints in the overlapping area. In the method proposed by this study, the pixels of the crack area will constitute the overlap between the two images, while other aspects, such as false positives from non-overlapping sections, will not affect the matching outcome. This approach not only mitigates the impact of mask shape differences but also significantly increases the number of keypoints within the ROIs, concentrating keypoints on crack pixels within the image (as shown in Figure 5). Moreover, the keypoints calculated using this method are more representative of the texture information of crack pixels. The computation of keypoints follows the feature-point-detection method used for the SIFT, which can be used to calculate keypoints at different scales.
2.5. Calculation of SIFT Feature Descriptors
A feature descriptor is used to describe the texture features around keypoints. Traditionally, when calculating descriptors, the image containing keypoints is directly used. This method is unquestionably effective for general images. However, in this study, keypoints are calculated using ROI images in which the pixel values outside the ROI are 0, meaning that there is no relevant texture information. As shown in Figure 5b, some keypoints are distributed outside the ROIs, and some keypoints within the ROIs are located at the edges. For these keypoints, if descriptors are computed using only the ROI images, descriptors for keypoints outside the ROIs would lack texture information and could be used for matching. Additionally, for keypoints located at the edges of the ROIs, the loss of surrounding texture information would affect the performance of descriptors, further reducing the robustness of matching. Therefore, in this study, keypoints are first calculated in the ROI image, and then SIFT feature descriptors are computed using the texture information around each keypoint coordinate in the complete image, as shown in Figure 6. This approach preserves the background texture from the original image, providing complete feature descriptors, reducing the impact of texture loss, and enhancing the matching accuracy and robustness without affecting the computation time.
2.6. Keypoint Matching
This step involves matching feature descriptors calculated from two images to find corresponding keypoint pairs, and accounts for the majority of the computation time in the image-stitching process. At present, in the OpenCV library, the most common methods for SIFT matching are using the Brute Force (BF) matcher or the FLANN (Fast Library for Approximate Nearest Neighbors) matcher. The Brute Force matcher is a basic and straightforward matching method that calculates the Euclidean distance between all feature points to find the most similar descriptors. It is a robust matcher but is only suitable for small data sets and is inefficient for large data sets. On the other hand, the FLANN matcher utilizes tree-based data structures (e.g., kd-trees, k-means, and so on) to perform approximate nearest-neighbor searches. This allows FLANN to efficiently find approximate nearest neighbors in high-dimensional data spaces, improving search speed. Therefore, FLANN is particularly suitable for large data sets.
This study will compare the image-stitching results of the proposed method with those of traditional methods using both the BF matcher and the FLANN matcher. This comparison is intended to demonstrate the advantages of the proposed method in keypoint matching.
2.7. Image Stitching
In the process of forming a complete crack image using image-stitching techniques, it is necessary to ensure consistency between different projection planes. In this study, based on keypoint matching, the Random Sample Consensus (RANSAC) algorithm is introduced to calculate the homography matrix for adjusting the projection planes, thereby enhancing the accuracy of the stitching.
This section is focused solely on stitching images related to the crack mask region. Initially, pairwise image-stitching comparisons were conducted to assess the accuracy of stitching between adjacent images. Subsequently, the method was applied to the continuous stitching of crack images, with a focus on the measurement accuracy of the stitched crack images. Through these experimental results, the potential value of the proposed method in measurement and analysis could be elucidated.
For continuous stitching of a series of crack images, this study introduces the spatial coordinates of several manually selected feature points on the cracks to address the issue of changing camera angles. These spatial coordinates of the feature points were measured using a total station theodolite within a local spatial coordinate system established in the study, with the aim of determining the spatial position of the plane at which the crack was located. At the start of continuous stitching, projection correction was performed on only the first image of each set to be stitched based on the spatial coordinates of the feature points, and the first image was projected onto an orthographic plane relative to the crack. This orthographic plane served as the base plane for image stitching. During the subsequent continuous stitching, the remaining images to be stitched were aligned to this orthographic plane. This approach primarily addressed the problem of excessive differences in camera angles between different images. As it was challenging for the photographer to maintain a completely consistent camera angle during shooting, and because all images were aligned and projected onto the same plane during continuous stitching, if a few images had too significant of a difference in camera angles, this could lead to stitching failure. Using an orthographic plane as the base plane for stitching was able to prevent this issue. Additionally, through introducing the spatial coordinates of feature points, the complete crack images were endowed with actual spatial information, enabling them to have value for measurement.
2.8. Evaluation Metrics
The discussion of the image-stitching outcomes in this study is divided into two parts: stitching between adjacent images and continuous stitching of the entire set of crack images. In the section concerning stitching between adjacent images, this study compared the degree of overlap of ROIs in the overlapping areas of adjacent images and the consistency of the ROI images. The degree of overlap of ROIs was measured using the intersection over union (IOU) of the crack masks, while the consistency of the ROI images was compared using the structural similarity index (SSIM) of the ROI images. These two evaluation metrics are used to discuss the stitching accuracy of the method proposed in this study in comparison with that of traditional methods. In the section on continuous image stitching, the precision of stitching in measurements of continuous crack images is examined. The actual length of cracks was compared with the length measured in the complete crack images to verify the applicability of the method proposed in this study for crack measurements. Details about the IOU and SSIM for the crack masks will be explained in the following.
- IOU of the Crack Mask
The calculation of the IOU typically involves computing the IOU value for two binary masks. This involves calculating the intersection and union of two binary regions, as shown in Equation (1).
where is the intersection area between two regions and is the union area between the two regions.
The IOU represents the level of overlap between two masks, and the values range from 0 to 1. A value closer to 1 indicates a higher similarity between the two masks.
- 2.
- SSIM
is an indicator used to evaluate the similarity between two images while considering luminance, contrast, and structural similarity, as shown in Equation (2).
where is the luminance, is the contrast, and is the structural similarity. The weights for the luminance, contrast, and structural similarity are denoted by α, β, and γ, respectively. The calculation formulas for , , and are given in Equations (3)–(5).
where and are the pixel intensity averages of the two images, and are the variances of the two images, is the covariance between the two images, and , , and are constants to avoid division by zero.
The result of the computation of the SSIM falls within the range of –1 to 1, with values closer to 1 indicating a higher similarity between the two images. As this study focuses solely on the stitching outcomes of images of crack regions, the calculation of the SSIM is specifically applied to the crack region rather than the entire image. Using the SSIM as an indicator allows for the examination of the matching details in images of a crack mask region.
3. Results
Two types of crack images were tested in this study: The first type was the commonly encountered branched crack (Crack 1), which exhibits branching, and the second type was the complex crack (Crack 2), which involved multiple cracks within the image range. For Crack 1, the stitching method involved dividing the crack into three parts and stitching each part separately from the central branching point to the three farthest endpoints (Crack 1–1 to Crack 1–3). The numbers of images captured for each set of cracks and the average overlap rates between adjacent images are shown in Table 1.
In each image of Crack 1, there was only one main crack, and the crack pattern was close to linear and relatively monotonous. Some images had branching but not many twists. On the other hand, in the images of Crack 2, the crack pattern resembled a network, and there was more than one crack in the images. This study discusses the applicability of the proposed method to these two different types of crack patterns.
In Table 1, it can be observed that, except for Crack 1–2, the average overlap ratio of adjacent images in each group of cracks was close to 80%, indicating high overlap among the images. To evaluate the performance of the proposed method on images with lower overlap ratios (around 60%), a subset of images was selected for Crack 1–1, Crack 1–3, and Crack 2 to form a test group with lower overlap ratios. The numbers of images and the overlap ratios for the low-overlap-ratio test group are shown in Table 2.
In addition to discussing the low-overlap-ratio images, this study also captured multiple sets of images with varying camera poses. Artificially, from these images with pose variations, a mixed set of crack images was selected and the images were combined to form another test group to determine the robustness of the method in stitching images with pose variations. The numbers of images and overlap rates for the mixed-image test group are presented in Table 3.
3.1. Detection Results of the Mask R-CNN Model
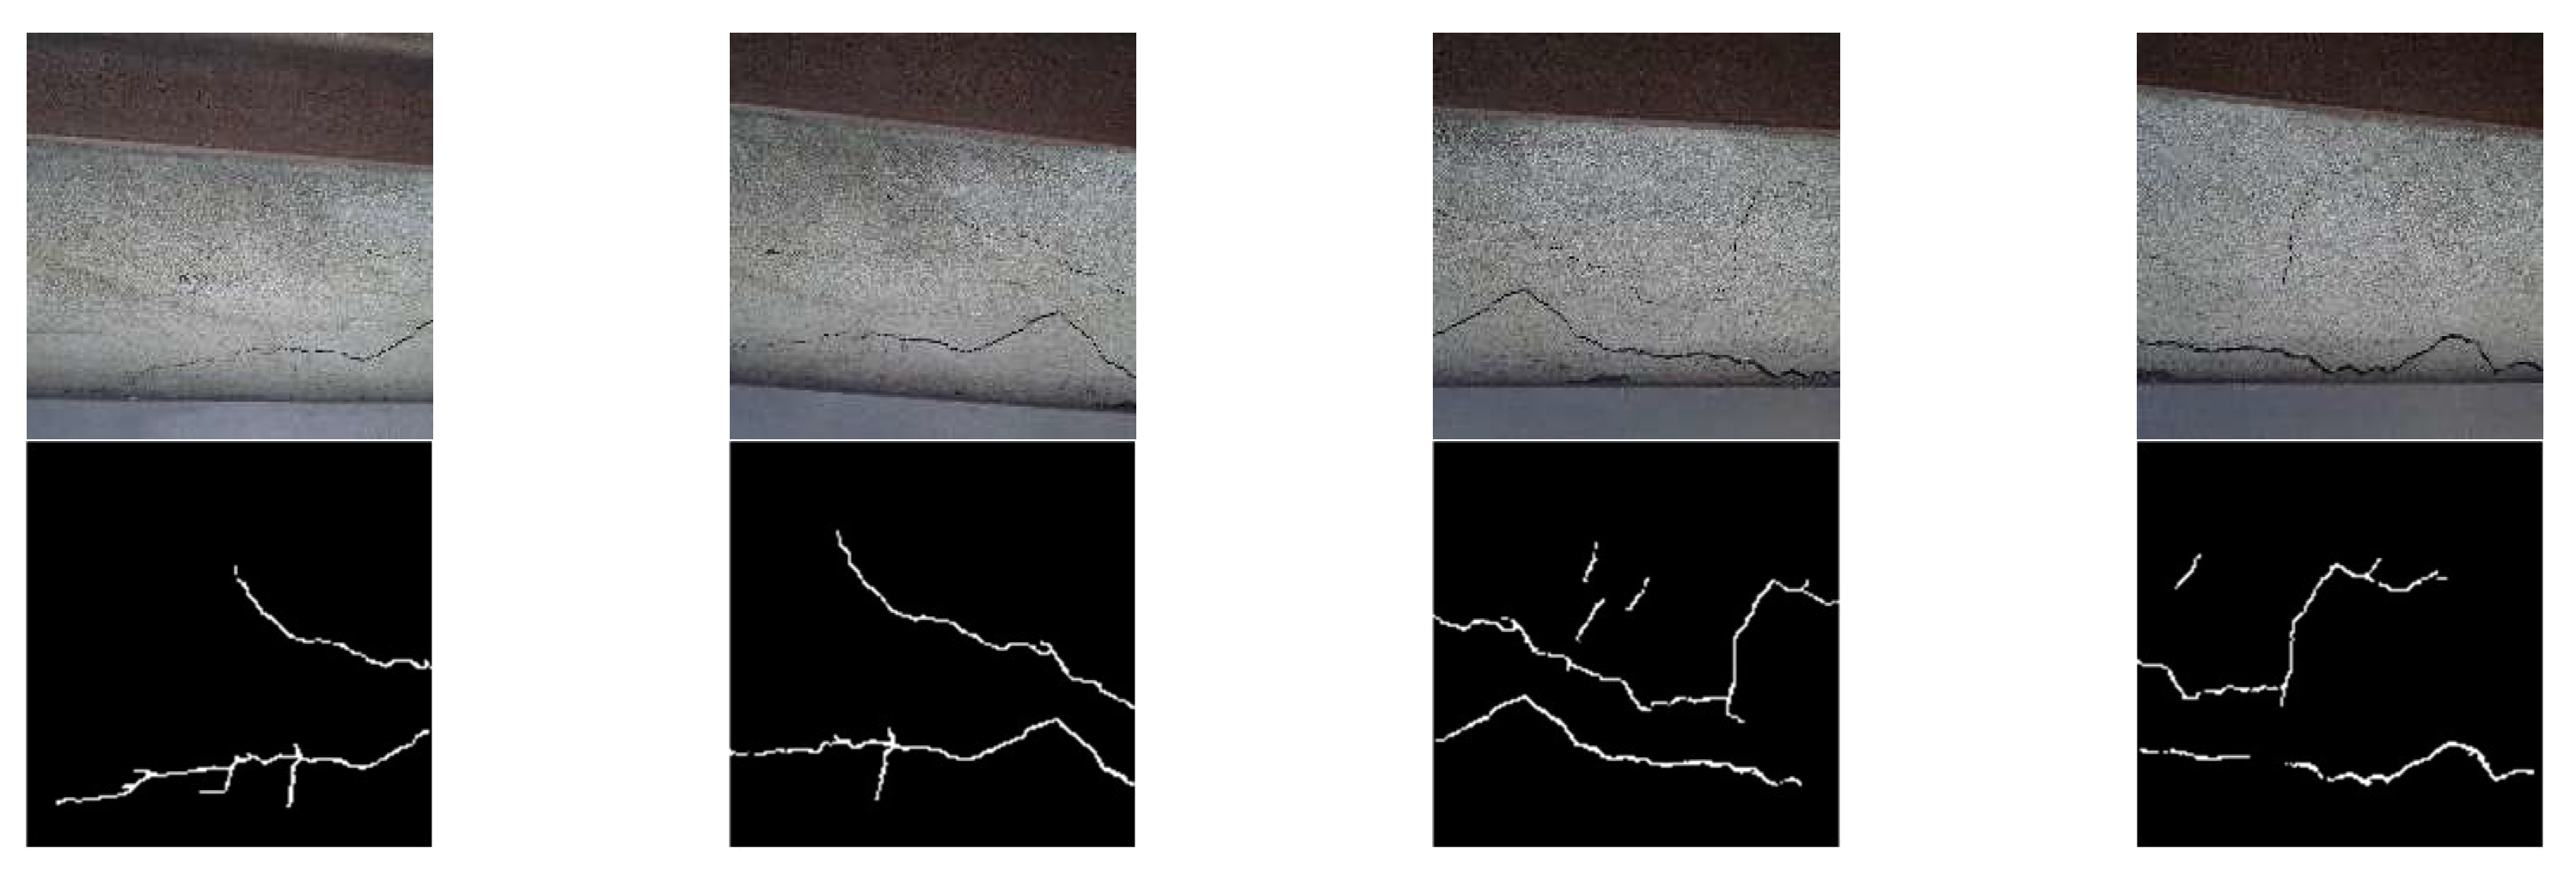
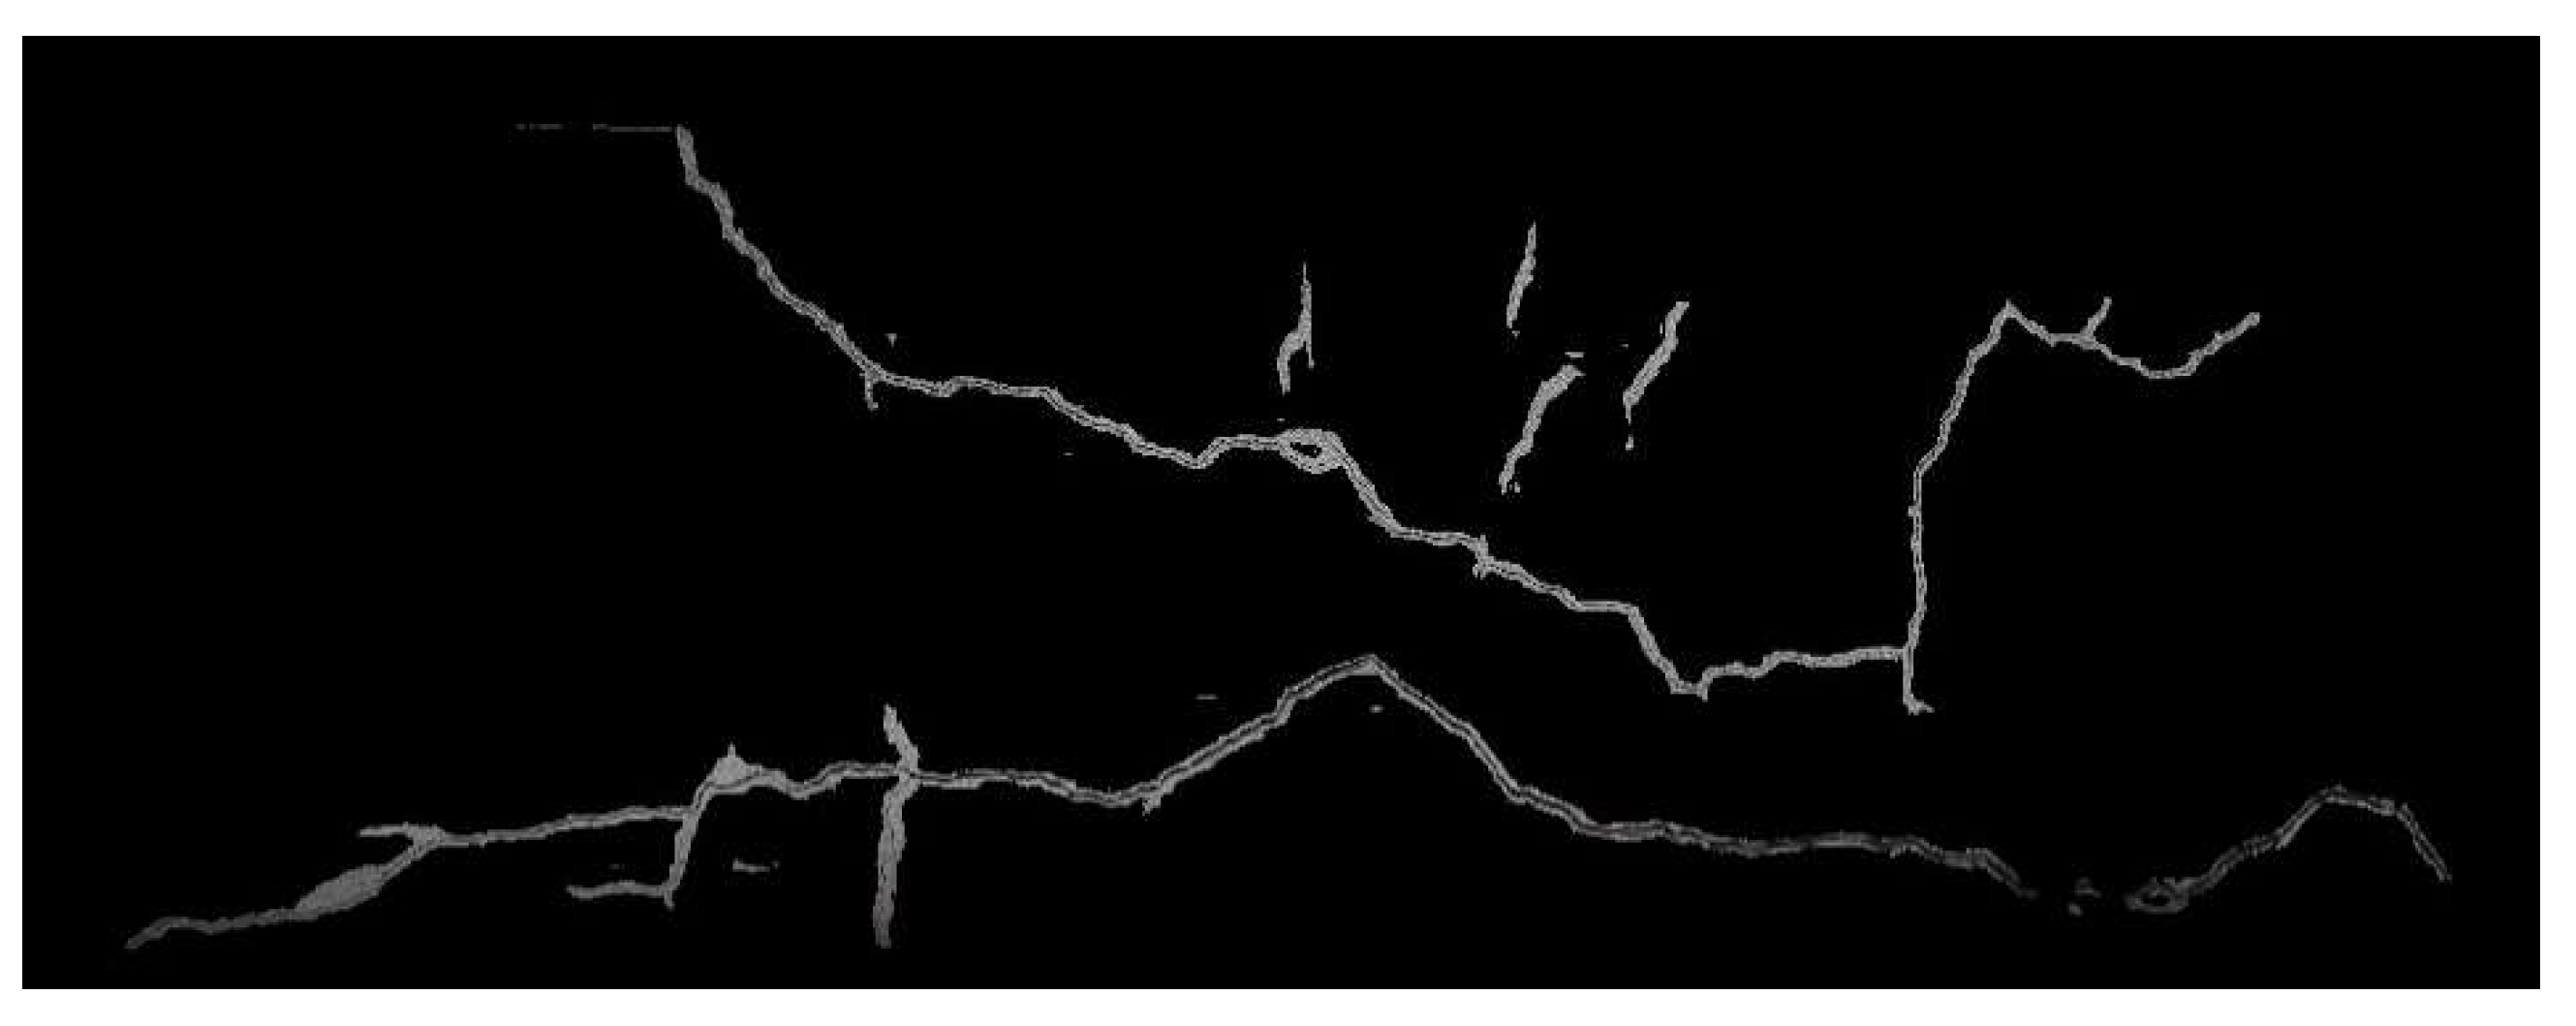
The Mask R-CNN model trained in this study reached convergence after 99 training iterations. The precision and recall on the validation set were 86.6% and 87.3%, respectively. The detection results for the 51 images of Crack 1 and Crack 2 were manually inspected, and it was confirmed that the fissures in the images were successfully detected and segmented using binary masks, as shown in Figure 7. The subsequent experiments and discussions in this study utilized these crack masks as ROIs and involved ROI images.
3.2. Stitching of Adjacent Images
This section focuses on discussing the results of stitching adjacent images. First, regarding the number of matched keypoints, compared with the traditional method of using the entire image for matching, the number of matched keypoints calculated from the crack mask and the ROI image significantly decreased, reducing the numbers of matched keypoints by 99.1% and 96.5%, respectively, as shown in Table 4. This reduction can greatly decrease the subsequent matching time for the keypoints.
In terms of image-matching results, not only were the traditional method using only the mask and the method proposed in this study tested, with each paired with both the BF matcher and the FLANN matcher, but the results of using only the ROI images for matching were also compared. The differences between various matching methods are detailed in Table 5. Among these methods, the difference between the method using only ROI images for matching and the method proposed in this study lies in the source of the feature descriptors for the keypoints. The method that matches using only ROI images does not refer to the entire image when calculating feature descriptors; hence, it lacks the texture information outside of the ROI. This study included this method in the comparison to discuss the effectiveness of using full-frame images to calculate keypoint feature descriptors.
Regarding the matching results, this study primarily discusses the IOU of the crack mask in the overlapping regions of the two images and the SSIM of the crack areas. For the crack-mask IOU, the results of matching with both the BF matcher and the FLANN matcher are detailed in Table 6 and Table 7, respectively. The matching counts, IOUs, and times in the tables are the averages across all adjacent image pairs in each group.
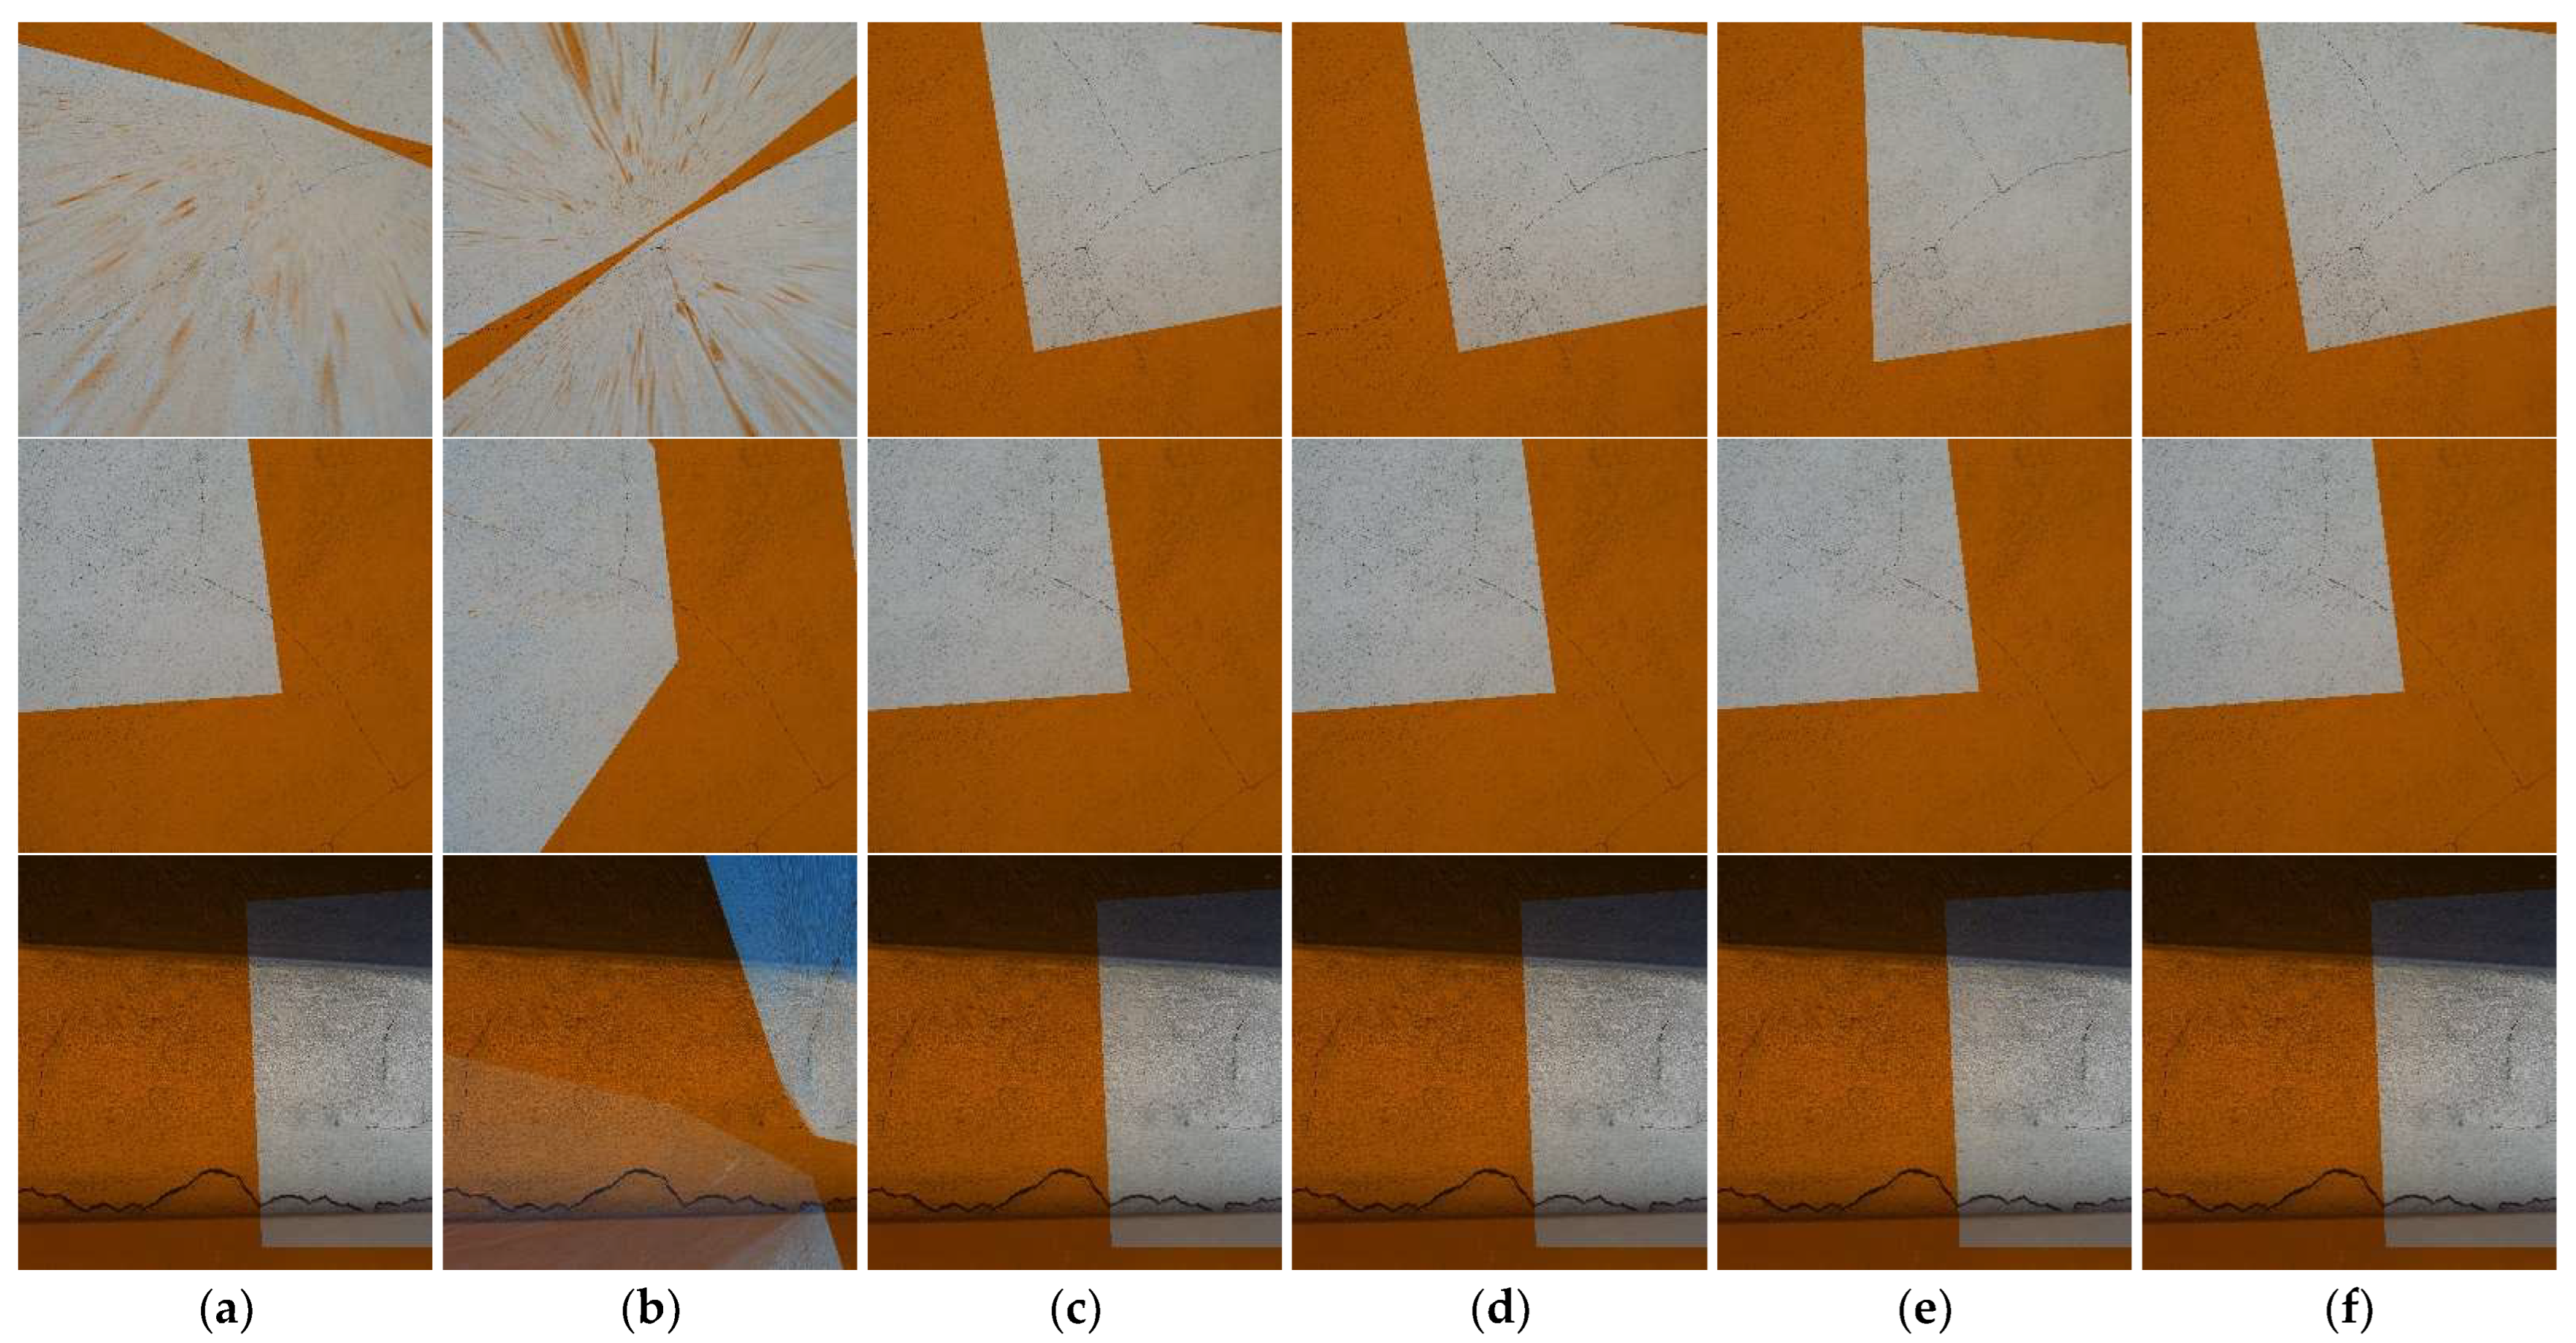
In terms of the IOU performance in the crack areas, the method proposed in this study performed well across all crack groups, whether paired with the BF matcher or the FLANN matcher, with a slightly better performance being observed with the BF matcher compared with that of the traditional method. However, the method of matching using only the crack area mask was a complete failure, confirming that relying solely on the recognition results of the Mask R-CNN model for stitching is not suitable. As for the method of matching using only ROI images, the performance was also decent across all crack groups, but the number of matched keypoints was lower than that of the method proposed in this study. Even when using the FLANN matcher, the number of matches in this method was only 44% of that in the method proposed in this study. Figure 8 displays three sets of images where the matching failed.
In these images, Figure 8a,b both exhibit obvious failures; additionally, while the matching result in Figure 8e appears to be successful, in comparison with Figure 8c,d,f, the first image still shows slight differences in the upper-right corner of the image. From the matching results of these three sets of images, it can be observed that the method proposed in this study is capable of performing matching effectively, regardless of the type of matcher used. Compared with the method of matching using only ROI images, the proposed method effectively enhances the matching robustness.
The performance in matching time showed that the traditional method using the BF matcher had an average matching time of 582.2 s; meanwhile, when using the FLANN matcher, it was 18.3 s. In contrast, the method proposed in this study had matching times of 8.2 s and 7.6 s with the different matchers, indicating reductions of 98.6% and 58.7%, respectively. However, the matching time when using only ROI images for matching was similar to that of the proposed method. This demonstrates that the method proposed by this study can effectively reduce matching time under the same computer hardware conditions.
Regarding the SSIM performance, the reader is referred to Table 8. As the results obtained when using only the mask for matching were all failures, only the results for the other three methods are discussed.
In the matching results for each crack group, the average SSIM values of the stitching results using the proposed method with the two different matchers were 0.585 and 0.576, respectively, and both were higher than those of the traditional method, which were 0.547 and 0.556. The method that matched using only ROI images performed better with the FLANN matcher, indicating its lack of robustness. In this part, in conjunction with the number of matches shown in Table 6, it was observed that the matching count when using the ROI images with the BF matcher was similar to that of the method proposed in this study. However, there was a significant difference in performance in terms of the SSIM value. This discrepancy was likely due to the lack of texture information in the feature descriptors of the keypoints located at the edges and outside of the ROI, leading to more incorrect matches when using the BF matcher, which matched keypoints one by one, as shown in Figure 9.
From the comparison of the SSIM (structural similarity index measure) values, it is evident that the method proposed in this study—whether matching the details of monotonic cracks (Crack 1) or complex cracks (Crack 2)—performed better than traditional methods, regardless of whether the BF (Brute Force) or FLANN (Fast Library for Approximate Nearest Neighbors) matcher was used. This is advantageous for crack image stitching requiring high resolution for analysis.
In addition, in the experiments with the low-overlap-rate test group and the mixed-image test group, the traditional method paired with the FLANN matcher was used as the control to examine the effectiveness of the proposed method when paired with the different matchers. The detailed experimental results are shown in Table 9 and Table 10.
From Table 9 and Table 10, it can be observed that the performance of the proposed method with the different matchers was superior to that of the traditional method in both the low-overlap-rate test group and the mixed-image test group. This indicates that the proposed stitching method is applicable to neighboring images with an overlap rate of over 60% and neighboring images with significant variations in shooting poses.
3.3. Continuous Stitching of Crack Images
The results of the continuous stitching of various sets of crack images completed using the proposed method with the BF matcher are shown in Figure 10 and Figure 11. In these figures, the parts of Crack 1 were manually grouped into Crack 1–1, Crack 1–2, and Crack 1–3, with each group containing images of the central branching point (highlighted with the red box in Figure 10).
Before continuous stitching, perspective projection correction was performed on the images at the branching points using feature-point spatial coordinates measured on-site. This not only ensured that the projection posture of the images was parallel to the wall surface but also provided information on the image scale. Subsequently, during stitching, the images at the branching points were fixed, and adjacent images were sequentially inserted into them. Finally, the complete image of Crack 1 was assembled from the images at the branching points, as shown in Figure 12. In Figure 12, the upper-left branch of the crack corresponds to Crack 1–3, the lower-left branch corresponds to Crack 1–1, and the right branch corresponds to Crack 1–2. Throughout the entire process of continuous stitching of the crack images, only image grouping and perspective projection correction required manual processing, while the other steps were automatically handled by the program without the need to adjust any parameters.
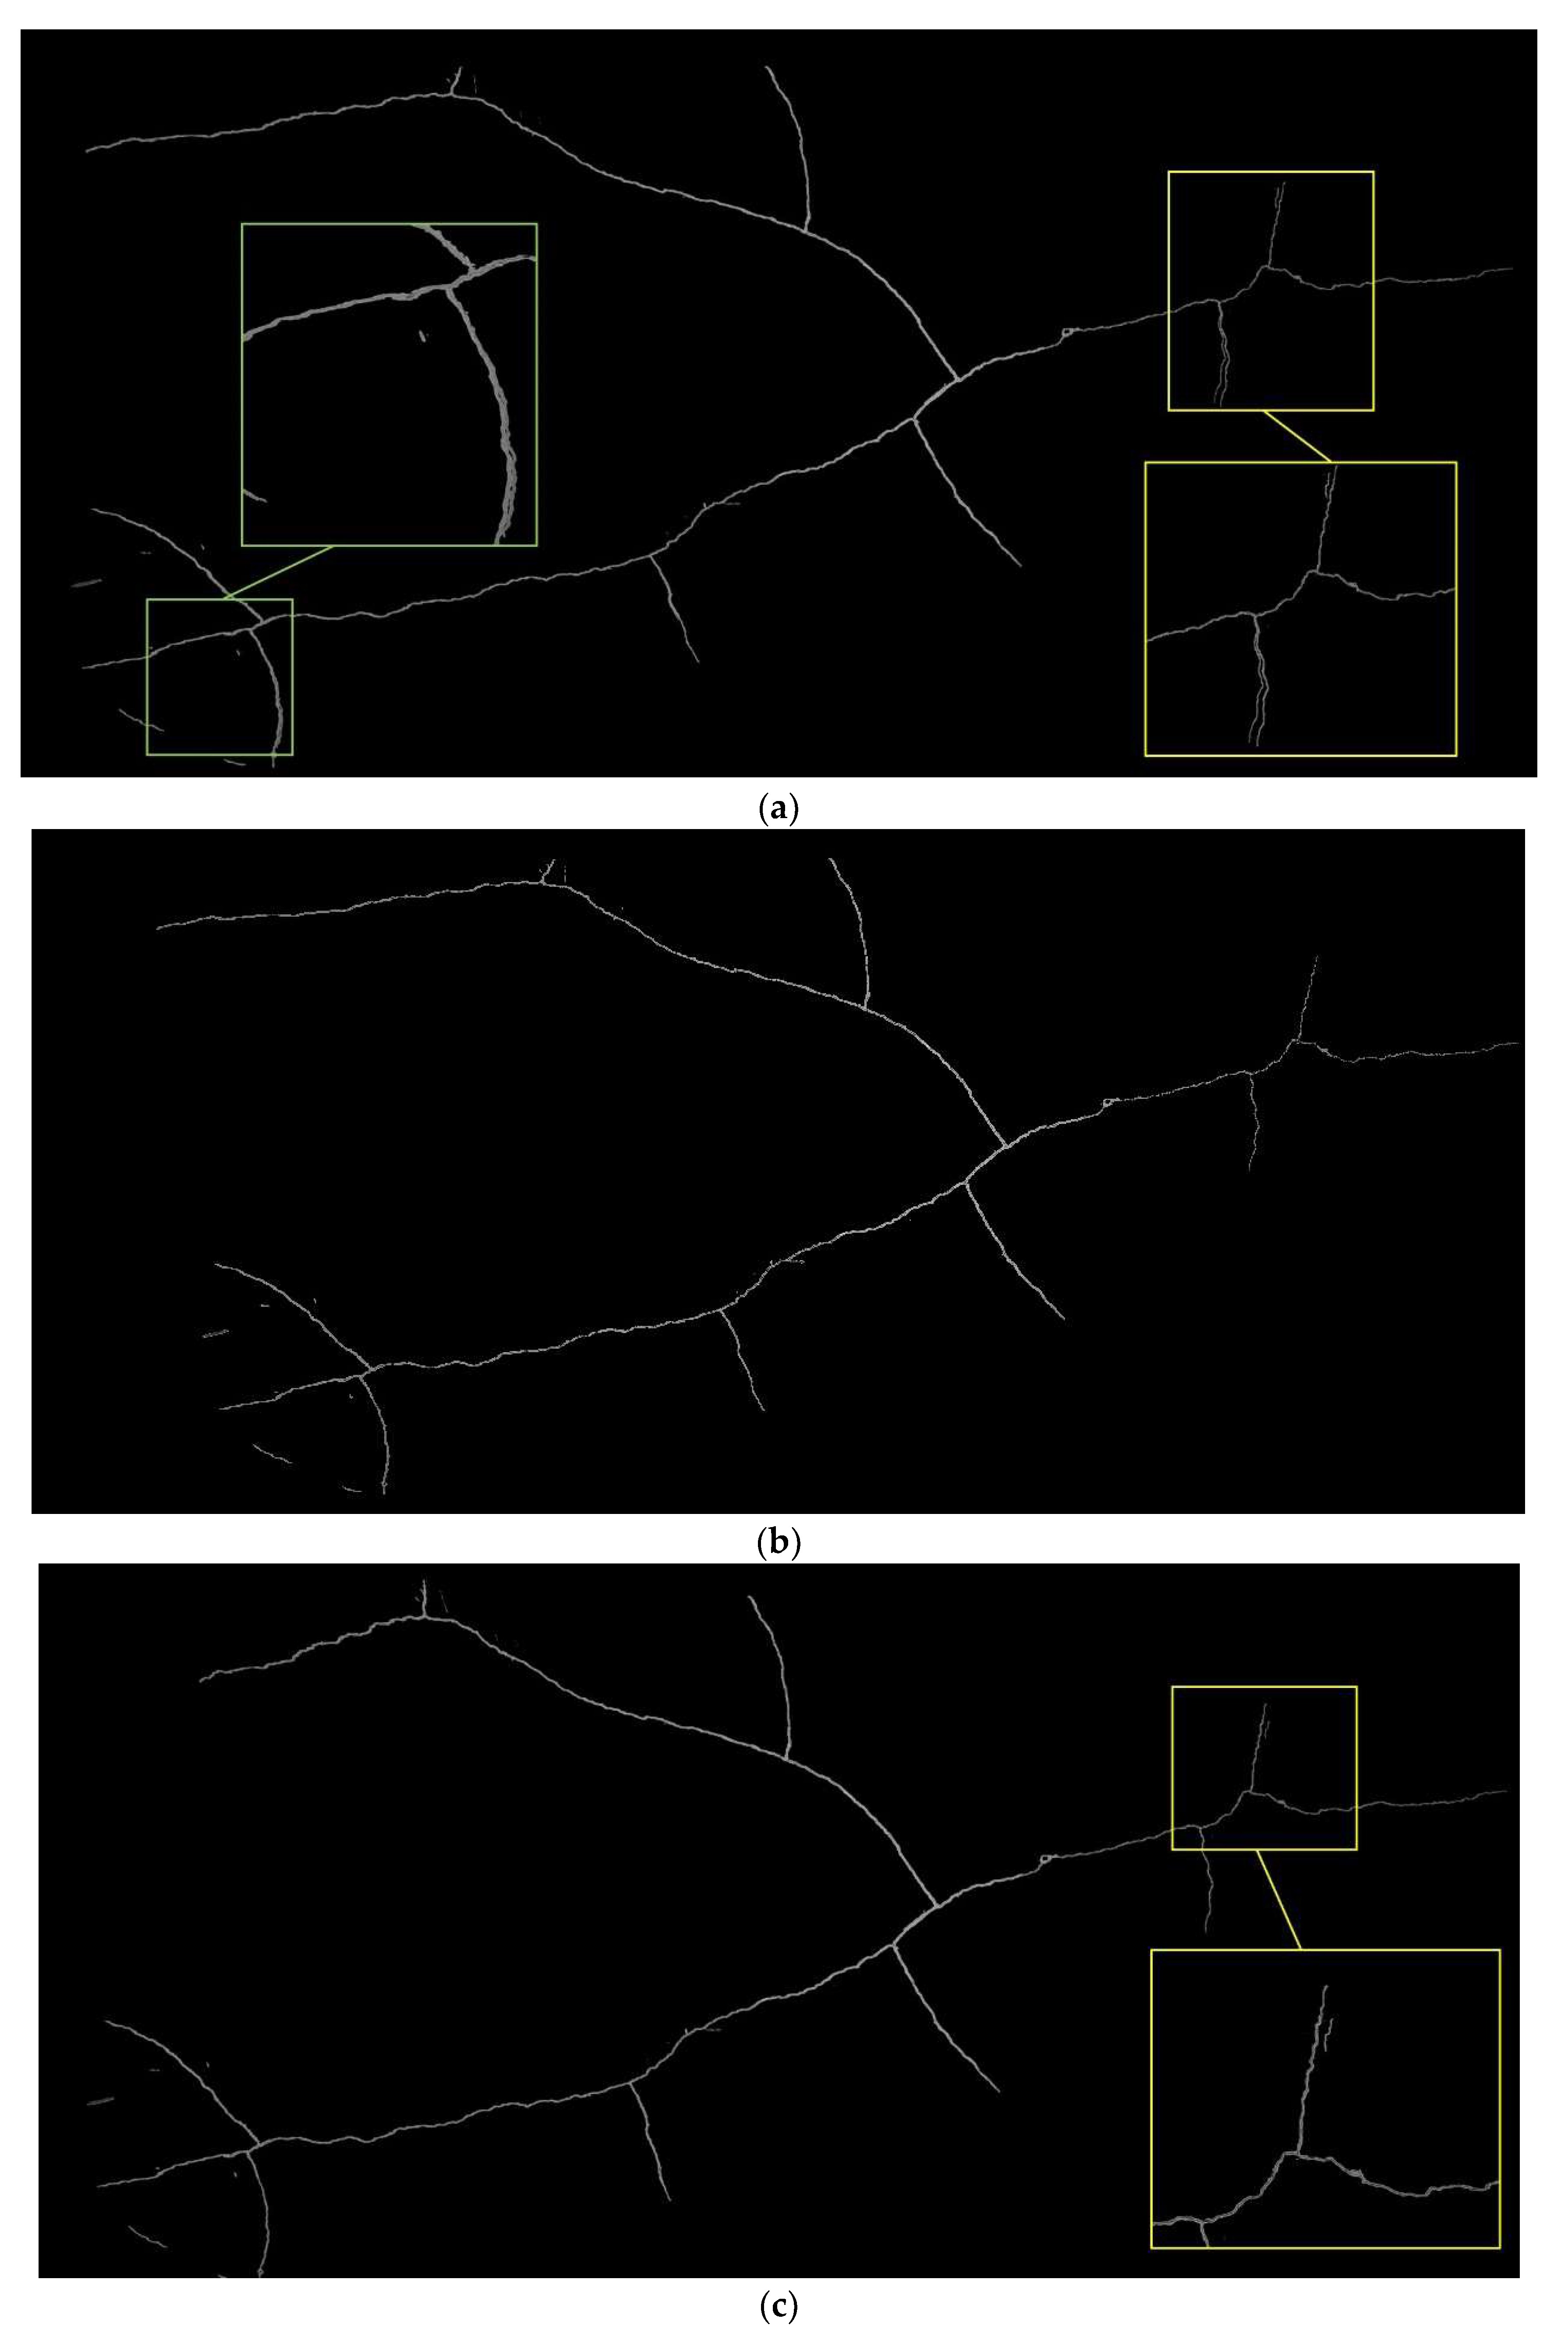
Figure 12 illustrates three complete images of Crack 1 stitched using three different methods: the traditional method with the FLANN matcher, the method proposed in this study with the BF matcher, and the method proposed in this study with the FLANN matcher. Among these three results, the outcome achieved with the method proposed in this study with the BF matcher was the most complete, and no misalignment was observed. Next was the method proposed in this study combined with the FLANN matcher, which showed no misalignment at the main trunk of the crack, and only partial misalignment occurring at the bifurcation of Crack 1–2, as shown in the yellow box of Figure 12c. The worst performance was observed with the traditional method combined with the FLANN matcher, where there were significant misalignments at both Crack 1–1 (as indicated by the green box in Figure 12a) and Crack 1–2 (as indicated by the yellow box in Figure 12a).
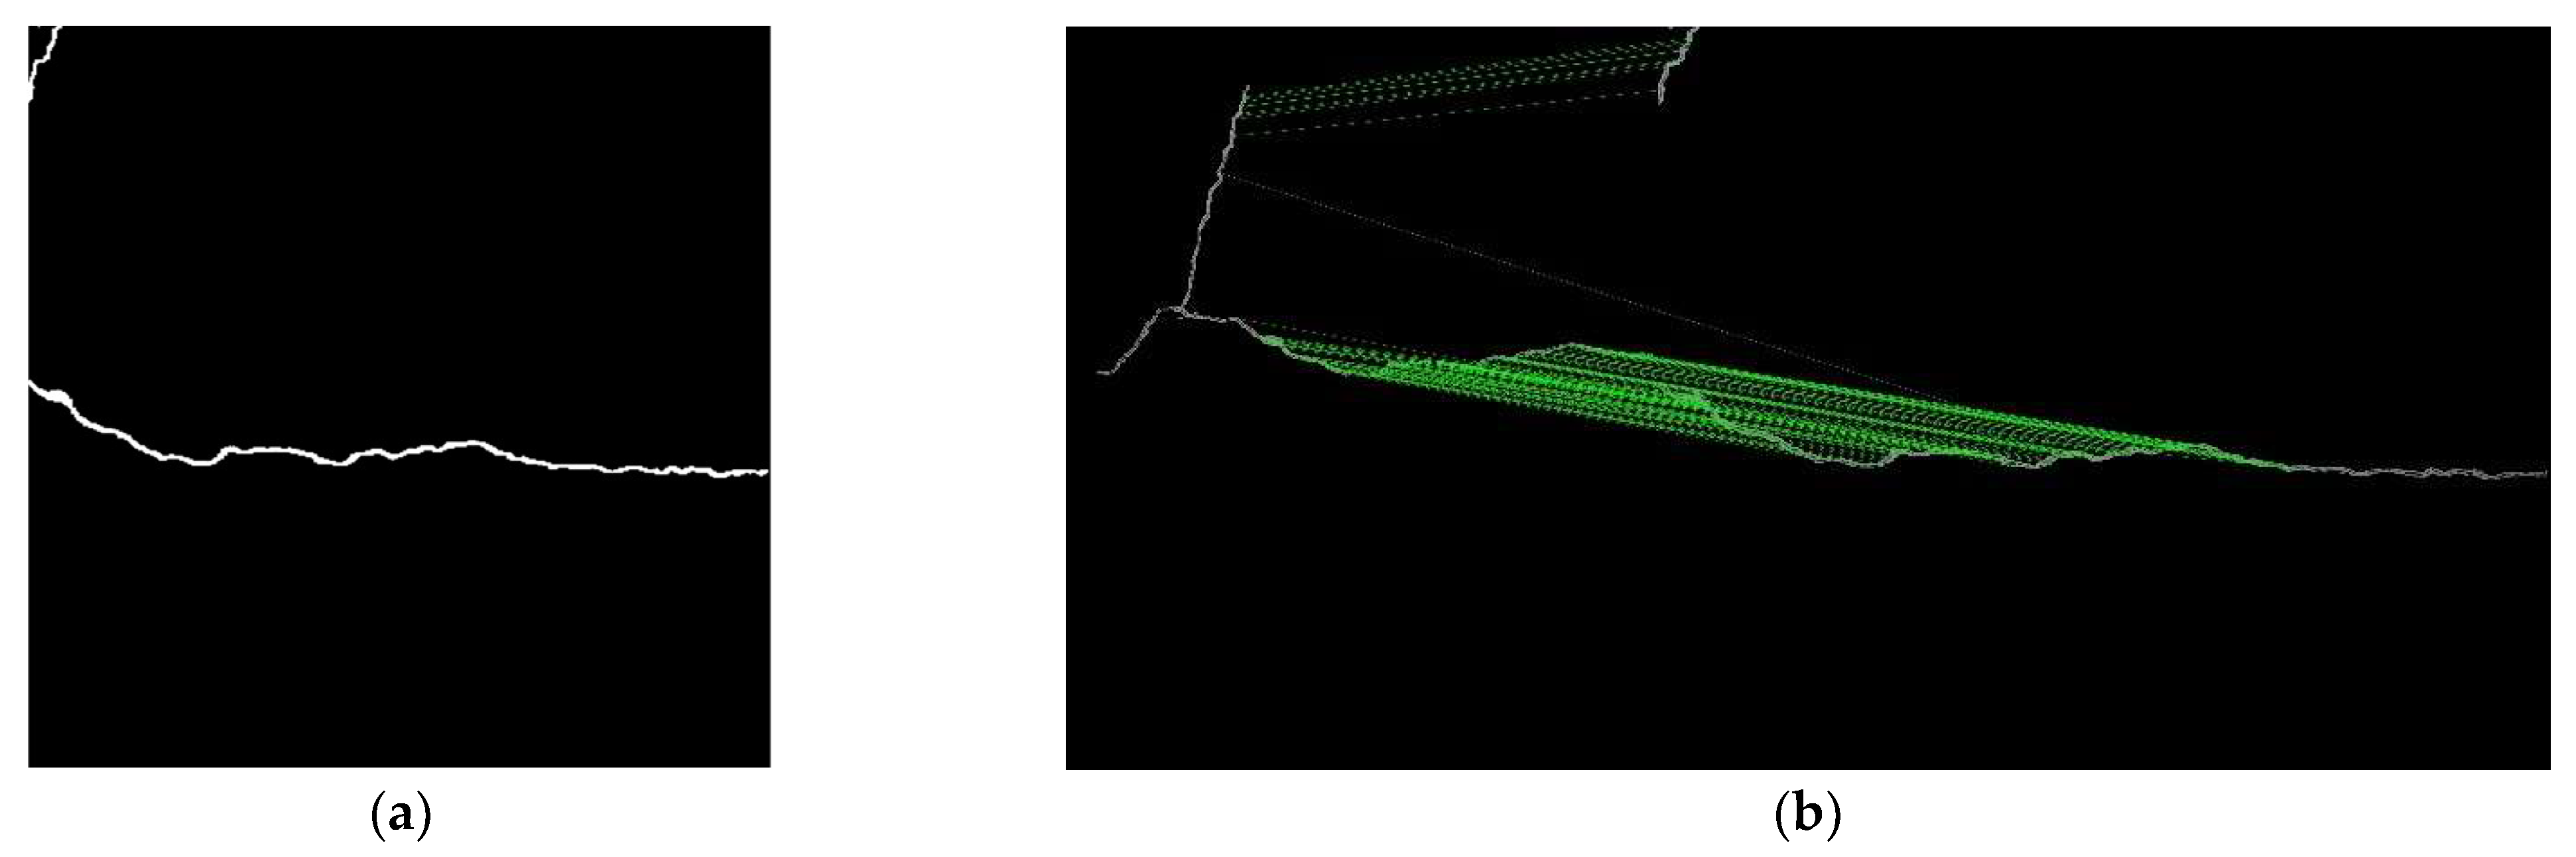
Upon inspection of the images to be stitched, the small cracks that are misaligned inside the yellow frames of Figure 12a,c were found to be related to the fragment cracks at the upper left inside the image, as shown in Figure 13a. This segment of cracks accounted for only a minority of the overall crack features; hence, their influence on the calculation of the homography matrix was weaker, as illustrated in Figure 13b, ultimately leading to the occurrence of misalignment. The absence of this misalignment in Figure 12b is due to the dense matching of the BF matcher, which, compared with the FLANN matcher, resulted in more matching-point pairs in the fragment cracks. In addition to using the BF matcher, avoiding the occurrence of fragment cracks during shooting can also reduce the occurrence of such misalignments.
In terms of crack measurement accuracy, this study measured the straight-line distance from the intersection point of the three branches at the center of Crack 1 to the endpoints of the three individual crack segments. The measurement results are detailed in Table 11. The ground truth in Table 11 was obtained by directly measuring the actual wall surface with a steel tape measure.
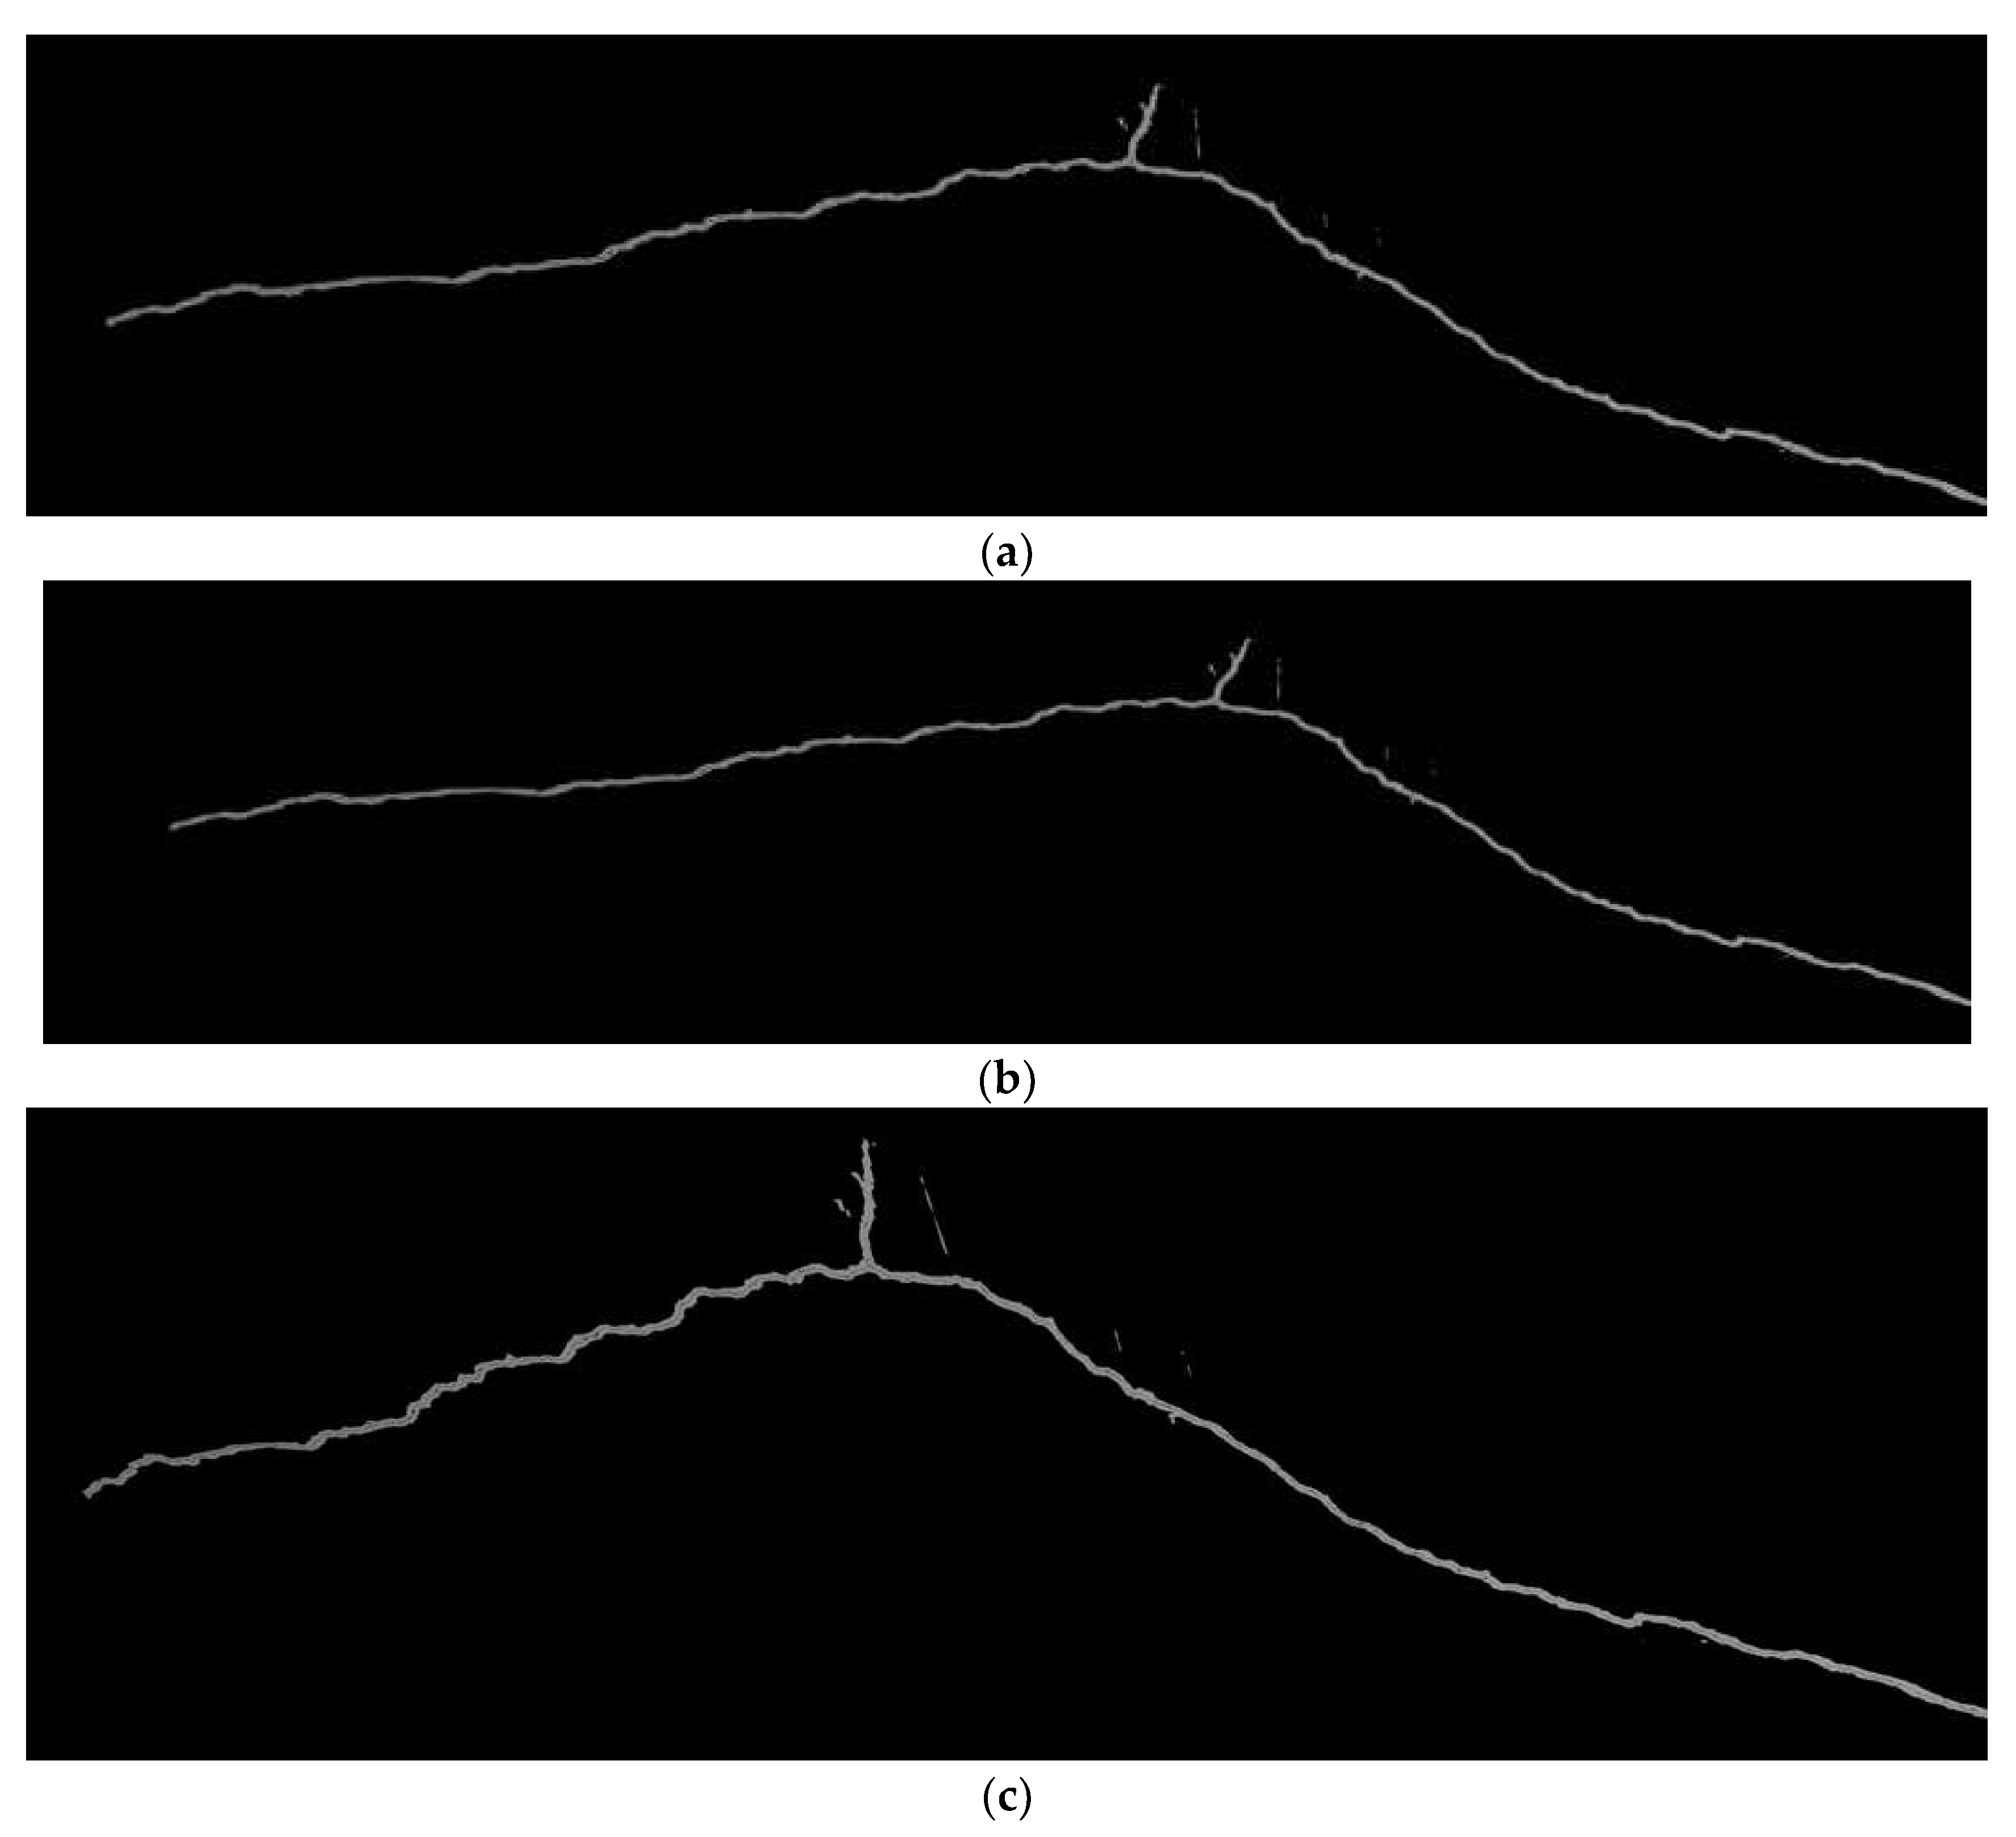
In the measurements of the complete crack images produced with the different methods, the performance of the method proposed in this study with the FLANN matcher was the best, with an average relative error of 7%. The relative error with the BF matcher was 16%, which was not significantly different from the 15% obtained with the traditional method. Among the measurements of the lengths of these three cracks, except for the method proposed in this study with the FLANN matcher, the other two methods had the highest relative errors for Crack 1–3. By comparing with Figure 12, it can be observed that the upper-left section of Crack 1–3 had significant deformation towards the end, as shown in Figure 14. This error arose from the cumulative deformation caused by continuous image stitching. Additionally, the crack at the end of Crack 1–3 was quite simple and unidirectional, making it more susceptible to the accumulation of deformation in the same direction.
4. Conclusions
This study aimed to address the problem of stitching crack images and proposed a rapid and robust method. First, a Mask R-CNN model was utilized to segment the crack foreground in an image, generating a mask as an ROI without the need for manual parameter adjustment, thus ensuring minimal noise in the extraction result. Subsequently, matching keypoints were computed in the ROI image, reducing the number of keypoints by 96.5% compared with traditional methods. During image matching, a method for calculating keypoint descriptors over the entire image was used, allowing texture information outside the ROI to contribute to comprehensive descriptor information. When paired with either the BF or FLANN matchers, the proposed approach increased the number of matched-point pairs, thereby enhancing the matching robustness. The experimental results confirmed that, compared with traditional methods, the proposed method reduced computational time by 98.6% and 58.7%, respectively, when paired with the two different matchers. It successfully completed stitching tasks on crack images with different degrees of overlap or varying shooting poses. Moreover, the SSIM values of all results were higher than those of traditional methods, indicating better performance in matching details. Regarding the ability to measure the complete crack length, the proposed method achieved a relative error of 7%, surpassing that of the traditional method (15%), which is advantageous for subsequent crack hazard assessments.
The method proposed in this study primarily uses images within the ROI for matching to achieve the goal of stitching; hence, it has higher requirements for the selection of the ROI and the clarity of images within the ROI. The ROI-selection method proposed in this study uses a crack image-segmentation model; thus, the crack-recognition capabilities of the model directly determine the quality of the ROI and will affect the final stitching results. On the other hand, as the proposed method only uses images within the ROI for matching, it demands higher clarity of the ROI images than that required by traditional methods. While traditional methods can still perform matching with the help of keypoints in the background image when the crack images are too fine or unclear, the method proposed in this study does not consider keypoints calculated from the background image during matching. Therefore, it is prone to issues with images in which the cracks are too fine and blurred. Additionally, when capturing cracks, it is advisable to avoid capturing fragments of branching cracks in the corners of the image. This action can help to reduce the occurrence of image misalignment issues related to fragmentary cracks. Future research could explore the following directions: (1) utilizing crack image-segmentation models with greater recognition capabilities that can simultaneously ensure the accuracy of crack detection and image stitching; and (2) developing automated analysis methods for quantifying the properties of large cracks, such as their length, width, and orientation; and, subsequently, using them for risk assessment.
Author Contributions
Conceptualization, S.-P.K. and J.-S.L.; methodology, S.-P.K., J.-S.L. and F.-L.W.; software, J.-S.L. and F.-L.W.; validation, J.-S.L. and F.-L.W.; formal analysis, J.-S.L., S.-P.K., F.-L.W. and P.-S.H.; writing—original draft, J.-S.L. and S.-P.K.; writing—review and editing, J.-S.L., S.-P.K., F.-L.W. and P.-S.H.; visualization, J.-S.L.; supervision, S.-P.K. and P.-S.H.; project administration, J.-S.L. and S.-P.K.; funding acquisition, S.-P.K. All authors have read and agreed to the published version of the manuscript.
Funding
This research was funded and supported by the National Science and Technology Council (NSTC) of Taiwan under project number NSTC 112-2121-M-005-004.
Data Availability Statement
The original contributions presented in the study are included in the article, further inquiries can be directed to the corresponding author.
Conflicts of Interest
The authors declare no conflicts of interest.
References
- Adhikari, R.; Moselhi, O.; Bagchi, A. Image-based retrieval of concrete crack properties for bridge inspection. Autom. Constr. 2014, 39, 180–194. [Google Scholar] [CrossRef]
- Attard, L.; Debono, C.J.; Valentino, G.; Di Castro, M. Tunnel inspection using photogrammetric techniques and image processing: A review. ISPRS J. Photogramm. Remote Sens. 2018, 144, 180–188. [Google Scholar] [CrossRef]
- Chaiyasarn, K. Damage Detection and Monitoring for Tunnel Inspection Based on Computer Vision. Ph.D. Thesis, University of Cambridge, Cambridge, UK, 2014. [Google Scholar]
- Koch, C.; Georgieva, K.; Kasireddy, V.; Akinci, B.; Fieguth, P. A review on computer vision based defect detection and condition assessment of concrete and asphalt civil infrastructure. Adv. Eng. Inform. 2015, 29, 196–210. [Google Scholar] [CrossRef]
- Yao, Y.; Tung, S.T.E.; Glisic, B. Crack detection and characterization techniques—An overview. Struct. Control Health Monit. 2014, 21, 1387–1413. [Google Scholar] [CrossRef]
- Zhang, C.; Wang, F.; Zou, Y.; Dimyadi, J.; Guo, B.H.W.; Hou, L. Automated UAV image-to-BIM registration for building façade inspection using improved generalised Hough transform. Autom. Constr. 2023, 153, 104957. [Google Scholar] [CrossRef]
- Xie, R.; Yao, J.; Liu, K.; Lu, X.; Liu, Y.; Xia, M.; Zeng, Q. Automatic multi-image stitching for concrete bridge inspection by combining point and line features. Autom. Constr. 2018, 90, 265–280. [Google Scholar] [CrossRef]
- Baek, S.-C.; Oh, J.; Woo, H.-J.; Kim, I.-H.; Jang, S. Localization of Cracks in Concrete Structures Lacking Reference Objects and Feature Points Using an Unmanned Aerial Vehicle. Appl. Sci. 2023, 13, 9918. [Google Scholar] [CrossRef]
- Wang, L.; Spencer Jr, B.F.; Li, J.; Hu, P. A fast image-stitching algorithm for characterization of cracks in large-scale structures. Smart Struct. Syst. 2021, 27, 593–605. [Google Scholar] [CrossRef]
- Tian, F.; Zhao, Y.; Che, X.; Zhao, Y.; Xin, D. Concrete Crack Identification and Image Mosaic Based on Image Processing. Appl. Sci. 2019, 9, 4826. [Google Scholar] [CrossRef]
- Woo, H.-J.; Seo, D.-M.; Kim, M.-S.; Park, M.-S.; Hong, W.-H.; Baek, S.-C. Localization of Cracks in Concrete Structures Using an Unmanned Aerial Vehicle. Sensors 2022, 22, 6711. [Google Scholar] [CrossRef]
- Fischler, M.A.; Bolles, R.C. Random sample consensus: A paradigm for model fitting with applications to image analysis and automated cartography. Commun. ACM 1981, 24, 381–395. [Google Scholar] [CrossRef]
- Da, X.; Wang, X.; Yu, X.; Wang, L. Bridge Surface Damage Image Stitching Method Based on SURF Algorithm. In Proceedings of the CICTP 2020, Xi’an, China, 14–16 August 2020; pp. 1330–1340. [Google Scholar]
- Wu, L.; Lin, X.; Chen, Z.; Lin, P.; Cheng, S. Surface crack detection based on image stitching and transfer learning with pretrained convolutional neural network. Struct. Control Health Monit. 2021, 28, e2766. [Google Scholar] [CrossRef]
- Geda, J.M.G.; Xue, K.; Nagayama, T. Automatic Top-View Transformation and Image Stitching of In-Vehicle Smartphone Camera for Road Crack Evaluation. In Experimental Vibration Analysis for Civil Engineering Structures: Select Proceedings of the EVACES 2021, Tokyo, Japan, 14–17 September 2021; Springer: Berlin/Heidelberg, Germany, 2022; pp. 567–579. [Google Scholar]
- Lowe, D.G. Distinctive Image Features from Scale-Invariant Keypoints. Int. J. Comput. Vis. 2004, 60, 91–110. [Google Scholar] [CrossRef]
- Wang, H.-F.; Zhai, L.; Huang, H.; Guan, L.-M.; Mu, K.-N.; Wang, G.-P. Measurement for cracks at the bottom of bridges based on tethered creeping unmanned aerial vehicle. Autom. Constr. 2020, 119, 103330. [Google Scholar] [CrossRef]
- Huang, Y.; Zhang, Z.; Xu, X. Image Stitching Algorithm Based on Region Division for Underwater Dam Crack Image. In Proceedings of the 2021 IEEE International Conference on Progress in Informatics and Computing (PIC), Shanghai, China, 17–19 December 2021; pp. 112–117. [Google Scholar]
- Wang, S.; Liu, C.; Zhang, Y. Fully convolution network architecture for steel-beam crack detection in fast-stitching images. Mech. Syst. Signal Process. 2022, 165, 108377. [Google Scholar] [CrossRef]
- Ali, R.; Chuah, J.H.; Talip, M.S.A.; Mokhtar, N.; Shoaib, M.A. Structural crack detection using deep convolutional neural networks. Autom. Constr. 2022, 133, 103989. [Google Scholar] [CrossRef]
- Munawar, H.S.; Hammad, A.W.A.; Haddad, A.; Soares, C.A.P.; Waller, S.T. Image-Based Crack Detection Methods: A Review. Infrastructures 2021, 6, 115. [Google Scholar] [CrossRef]
- Deng, J.; Singh, A.; Zhou, Y.; Lu, Y.; Lee, V.C.-S. Review on computer vision-based crack detection and quantification methodologies for civil structures. Constr. Build. Mater. 2022, 356, 129238. [Google Scholar] [CrossRef]
- Wu, S.; Fu, F. Crack control optimization of basement concrete structures using the Mask-RCNN and temperature effect analysis. PLoS ONE 2023, 18, e0292437. [Google Scholar] [CrossRef]
- Hsu, S.-H.; Chang, T.-W.; Chang, C.-M. Concrete surface crack segmentation based on deep learning. In European Workshop on Structural Health Monitoring: Special Collection of 2020 Papers-Volume 2; Springer: Berlin/Heidelberg, Germany, 2021; pp. 24–34. [Google Scholar]
- Kumar, P.; Sharma, A.; Kota, S.R. Automatic multiclass instance segmentation of concrete damage using deep learning model. IEEE Access 2021, 9, 90330–90345. [Google Scholar] [CrossRef]
- Liu, Z.; Yeoh, J.K.; Gu, X.; Dong, Q.; Chen, Y.; Wu, W.; Wang, L.; Wang, D. Automatic pixel-level detection of vertical cracks in asphalt pavement based on GPR investigation and improved mask R-CNN. Autom. Constr. 2023, 146, 104689. [Google Scholar] [CrossRef]
- Dong, J.; Liu, J.; Wang, N.; Fang, H.; Zhang, J.; Hu, H.; Ma, D. Intelligent segmentation and measurement model for asphalt road cracks based on modified mask R-CNN algorithm. Comput. Model. Eng. Sci. 2021, 128, 541–564. [Google Scholar] [CrossRef]
- Kim, C.; Hwang, S.; Sohn, H. Weld crack detection and quantification using laser thermography, mask R-CNN, and CycleGAN. Autom. Constr. 2022, 143, 104568. [Google Scholar] [CrossRef]
- Yang, F.; Huo, J.; Cheng, Z.; Chen, H.; Shi, Y. An Improved Mask R-CNN Micro-Crack Detection Model for the Surface of Metal Structural Parts. Sensors 2023, 24, 62. [Google Scholar] [CrossRef]
- Zhang, Z. A flexible new technique for camera calibration. IEEE Trans. Pattern Anal. Mach. Intell. 2000, 22, 1330–1334. [Google Scholar] [CrossRef]
- Crack Segmentation Dataset. Available online: https://github.com/khanhha/crack_segmentation/ (accessed on 16 January 2024).
Figure 1.
Research process.

Figure 2.
The original images were processed using both the Canny edge detector and Mask R-CNN for crack detection. (a) Original image. (b) Cracks detected using the Canny edge detector on the original image (parameters were manually adjusted). (c) Cracks detected using Mask R-CNN on the original image.

Figure 3.
Flowchart of the process for generating crack masks: The original image is segmented, and the cracks are recognized using the Mask R-CNN model. The results are then stitched back to the original size.
Figure 3.
Flowchart of the process for generating crack masks: The original image is segmented, and the cracks are recognized using the Mask R-CNN model. The results are then stitched back to the original size.

Figure 4.
Illustration of the results of calculating matching keypoints using both the original image and the mask image. (a) Calculation of keypoints using the original image. (b) Calculation of keypoints using the mask image. (c) A close-up view of the results of calculating keypoints using the mask image.

Figure 5.
Calculation of matching keypoints using ROI images. (a) Calculation of keypoints using ROI images. (b) A close-up view of the results of calculating keypoints using ROI images.
Figure 5.
Calculation of matching keypoints using ROI images. (a) Calculation of keypoints using ROI images. (b) A close-up view of the results of calculating keypoints using ROI images.

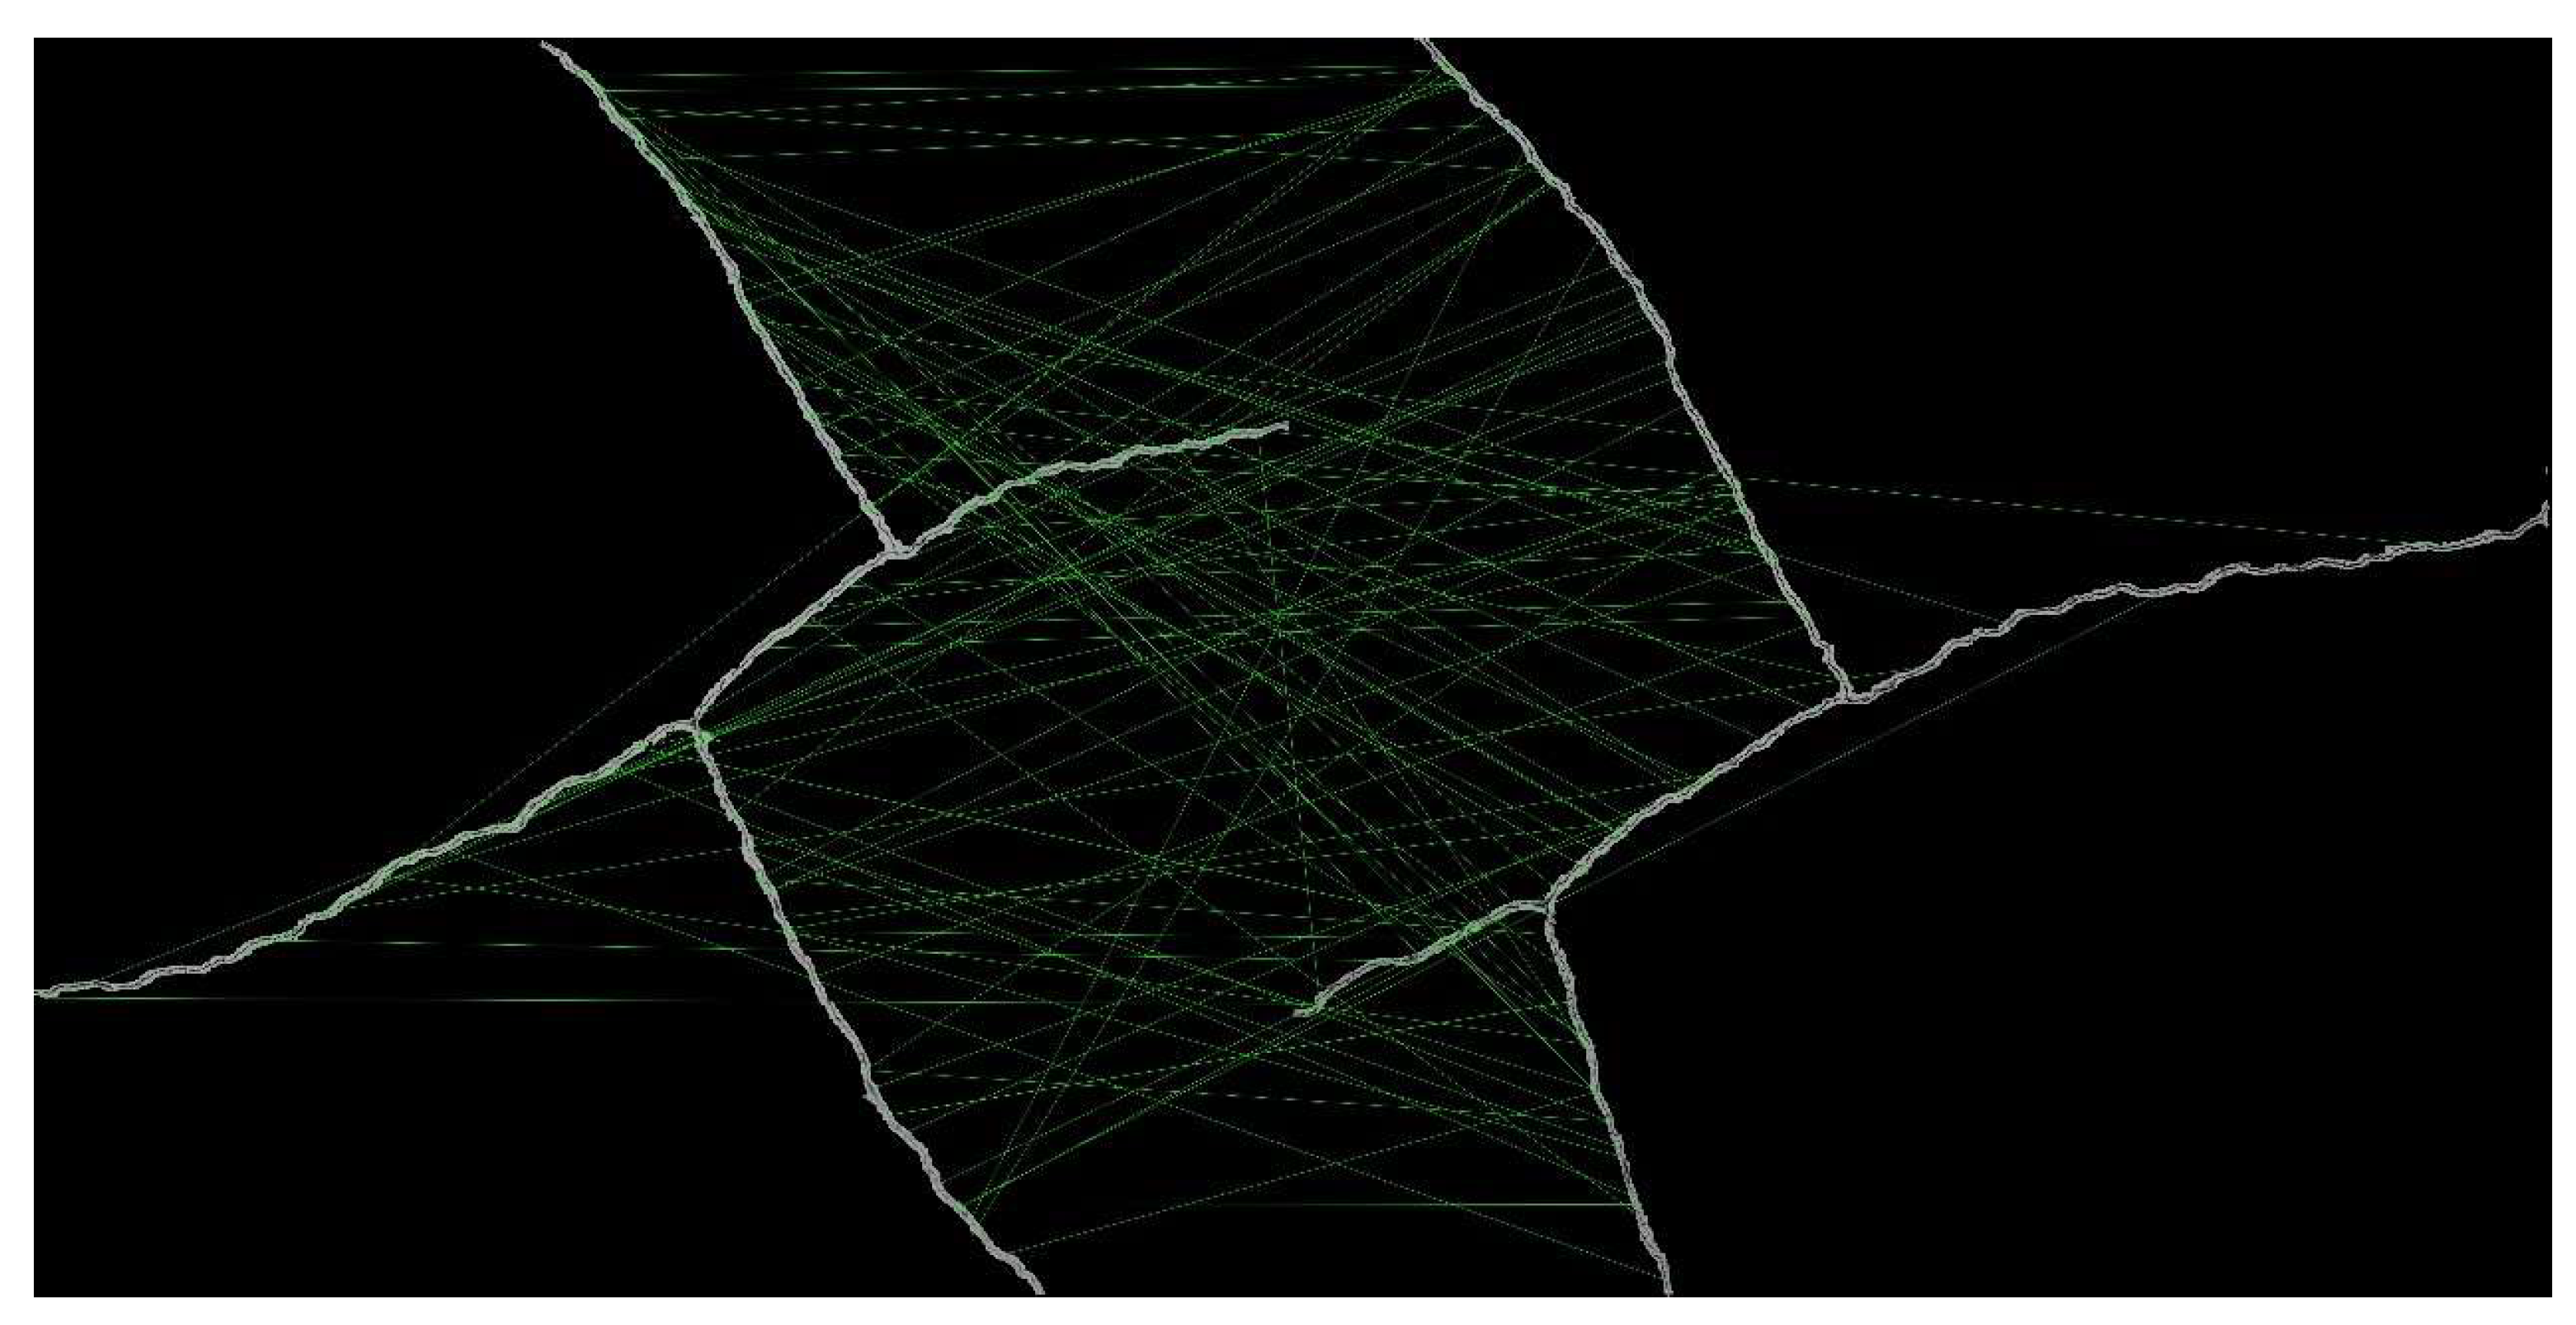
Figure 6.
After calculating keypoints using ROI images, descriptors are computed based on the keypoints’ positions and the original images.
Figure 6.
After calculating keypoints using ROI images, descriptors are computed based on the keypoints’ positions and the original images.

Figure 7.
A crack image and a crack mask detected by the Mask R-CNN model, with a portion of Crack 2 as an example.
Figure 7.
A crack image and a crack mask detected by the Mask R-CNN model, with a portion of Crack 2 as an example.

Figure 8.
Illustration of partially failed stitching results. (a) Traditional method with the BF matcher. (b) Matching with only ROI images using the BF matcher. (c) Our method with the BF matcher. (d) Traditional method with the FLANN matcher. (e) Matching with only ROI images using the FLANN matcher. (f) Our method with the FLANN matcher.

Figure 9.
Illustration of the matching results using only ROI image matching with the first 100 keypoint pairs using the BF matcher.
Figure 9.
Illustration of the matching results using only ROI image matching with the first 100 keypoint pairs using the BF matcher.

Figure 10.
The segmented-stitching results for Crack 1 when using our method with the BF matcher. The red boxes in the figure indicate the positions of the central branching point images. (a) Crack 1–1; (b) Crack 1–2; (c) Crack 1–3.
Figure 10.
The segmented-stitching results for Crack 1 when using our method with the BF matcher. The red boxes in the figure indicate the positions of the central branching point images. (a) Crack 1–1; (b) Crack 1–2; (c) Crack 1–3.


Figure 11.
The stitching results for Crack 2.

Figure 12.
Complete images of Crack 1 stitched using different methods. The yellow and green boxes in the figure indicate and magnify the misalignment situations. (a) Traditional method with the FLANN matcher. (b) Proposed method with the BF matcher. (c) Proposed method with the FLANN matcher.
Figure 12.
Complete images of Crack 1 stitched using different methods. The yellow and green boxes in the figure indicate and magnify the misalignment situations. (a) Traditional method with the FLANN matcher. (b) Proposed method with the BF matcher. (c) Proposed method with the FLANN matcher.

Figure 13.
Illustrative diagrams of the cause of misalignment. (a) An image to be stitched showing a fragmentary crack in the upper-left corner. (b) The results of feature-point pairing during stitching.
Figure 13.
Illustrative diagrams of the cause of misalignment. (a) An image to be stitched showing a fragmentary crack in the upper-left corner. (b) The results of feature-point pairing during stitching.

Figure 14.
The latter half of Crack 1–3 in each complete crack image. (a) Traditional method with the FLANN matcher. (b) Proposed method with the BF matcher. (c) Proposed method with the FLANN matcher.
Figure 14.
The latter half of Crack 1–3 in each complete crack image. (a) Traditional method with the FLANN matcher. (b) Proposed method with the BF matcher. (c) Proposed method with the FLANN matcher.


Table 1.
Numbers of images and overlap rates for each group of crack images.
| Crack Number | Number of Images | Average Overlap Rate |
|---|---|---|
| Crack 1–1 | 16 | 79.0% |
| Crack 1–2 | 11 | 67.7% |
| Crack 1–3 | 12 | 76.9% |
| Crack 2 | 12 | 86.9% |
Table 2.
Numbers of images and adjacent overlap rates for the low-overlap test group.
| Crack Number | Number of Images | Average Overlap Rate |
|---|---|---|
| Crack 1–1 | 9 | 62.4% |
| Crack 1–3 | 9 | 66.0% |
| Crack 2 | 6 | 70.9% |
Table 3.
Numbers of images and neighboring overlap rates for the mixed-image test group.
| Crack Number | Number of Images | Average Overlap Rate |
|---|---|---|
| Crack 1–1 | 10 | 63.3% |
| Crack 1–2 | 13 | 70.0% |
| Crack 1–3 | 12 | 69.5% |
| Crack 2 | 6 | 69.7% |
Table 4.
Numbers of keypoints calculated with different methods.
| Crack Number | Traditional Methods | Mask Only | ROI Image | ||
|---|---|---|---|---|---|
| Number of Keypoints | Reduction Rate | Number of Keypoints | Reduction Rate | ||
| Crack 1–1 | 94,264 | 670 | 99.3% | 2791 | 97.0% |
| Crack 1–2 | 78,725 | 676 | 99.1% | 2917 | 96.3% |
| Crack 1–3 | 59,671 | 606 | 99.0% | 2245 | 96.2% |
| Crack 2 | 94,052 | 1099 | 98.8% | 3495 | 96.3% |
| Average | 81,678 | 762 | 99.1% | 2862 | 96.5% |
Table 5.
Sources for calculating matching keypoints and feature descriptors of different matching methods.
Table 5.
Sources for calculating matching keypoints and feature descriptors of different matching methods.
| Traditional Methods | Mask Only | Matching Using Only ROI Images | Our Method | |
|---|---|---|---|---|
| The calculation source for matching keypoints | Entire image | Crack mask | ROI image | ROI image |
| The computation source for feature descriptors | Entire image | Crack mask | ROI image | Entire image |
Table 6.
Comparison of the IOU results when using the BF matcher.
| Crack Number | Traditional Methods | Mask Only | Matching Using Only ROI Images | Our Method | ||||||||
|---|---|---|---|---|---|---|---|---|---|---|---|---|
| Number of Matches | IOU | Time (s) | Number of Matches | IOU | Time (s) | Number of Matches | IOU | Time (s) | Number of Matches | IOU | Time (s) | |
| Crack 1–1 | 56,058 | 43.7% | 747.8 | 355 | 0.3% | 7.6 | 1562 | 43.4% | 8.2 | 1635 | 43.8% | 8.4 |
| Crack 1–2 | 44,525 | 40.0% | 523.9 | 371 | 0.1% | 7.1 | 1657 | 40.5% | 8.0 | 1710 | 43.7% | 8.1 |
| Crack 1–3 | 34,084 | 43.3% | 348.9 | 331 | 0.1% | 7.1 | 1244 | 42.9% | 7.7 | 1299 | 43.3% | 7.6 |
| Crack 2 | 58,635 | 41.7% | 708.1 | 616 | 0.3% | 7.4 | 2015 | 41.6% | 8.8 | 2098 | 41.7% | 8.8 |
| Average | 48,326 | 42.2% | 582.2 | 418 | 0.2% | 7.3 | 1619 | 42.1% | 8.2 | 1685 | 43.1% | 8.2 |
Table 7.
Comparison of the IOU results when using the FLANN matcher.
| Crack Number | Traditional Methods | Mask Only | Matching Using Only ROI Images | Our Method | ||||||||
|---|---|---|---|---|---|---|---|---|---|---|---|---|
| Number of Matches | IOU | Time (s) | Number of Matches | IOU | Time (s) | Number of Matches | IOU | Time (s) | Number of Matches | IOU | Time (s) | |
| Crack 1–1 | 15,427 | 43.7% | 19.6 | 97 | 0.3% | 7.4 | 276 | 43.6% | 7.6 | 597 | 43.6% | 7.8 |
| Crack 1–2 | 8821 | 43.6% | 17.6 | 106 | 0.3% | 7.3 | 217 | 43.5% | 7.3 | 445 | 43.7% | 7.5 |
| Crack 1–3 | 7667 | 43.3% | 15.2 | 88 | 0.2% | 7.3 | 144 | 43.4% | 7.4 | 348 | 43.2% | 7.3 |
| Crack 2 | 18,181 | 41.6% | 20.9 | 145 | 0.3% | 7.3 | 191 | 41.6% | 7.7 | 491 | 41.6% | 7.8 |
| Average | 12,524 | 43.1% | 18.3 | 109 | 0.3% | 7.3 | 207 | 43.0% | 7.5 | 470 | 43.1% | 7.6 |
Table 8.
Comparison of the SSIM results for matching.
| Crack Number | Using BF Matcher | Using FLANN Matcher | ||||
|---|---|---|---|---|---|---|
| Traditional Methods | Using Only ROI Image Matching | Our Method | Traditional Methods | Using Only ROI Image Matching | Our Method | |
| Crack 1–1 | 0.588 | 0.608 | 0.620 | 0.592 | 0.599 | 0.603 |
| Crack 1–2 | 0.511 | 0.535 | 0.591 | 0.544 | 0.585 | 0.590 |
| Crack 1–3 | 0.556 | 0.543 | 0.577 | 0.559 | 0.574 | 0.567 |
| Crack 2 | 0.534 | 0.545 | 0.551 | 0.531 | 0.539 | 0.543 |
| Average | 0.547 | 0.558 | 0.585 | 0.556 | 0.574 | 0.576 |
Table 9.
Comparison of the SSIM results for the low-overlap-rate test group.
| Crack Number | Average Overlap Rate | Traditional Methods Using FLANN Matcher | Our Method | |
|---|---|---|---|---|
| Using BF Matcher | Using FLANN Matcher | |||
| Crack 1–1 | 62.4% | 0.584 | 0.610 | 0.599 |
| Crack 1–3 | 66.0% | 0.534 | 0.557 | 0.542 |
| Crack 2 | 70.9% | 0.407 | 0.480 | 0.482 |
| Average | 0.508 | 0.549 | 0.541 | |
Table 10.
Comparison of the SSIM results for the mixed-image test group.
| Crack Number | Average Overlap Rate | Traditional Methods Using FLANN Matcher | Our Method | |
|---|---|---|---|---|
| Using BF Matcher | Using FLANN Matcher | |||
| Crack 1–1 | 63.3% | 0.566 | 0.598 | 0.588 |
| Crack 1–2 | 70.0% | 0.532 | 0.545 | 0.550 |
| Crack 1–3 | 69.5% | 0.522 | 0.551 | 0.541 |
| Crack 2 | 69.7% | 0.428 | 0.458 | 0.467 |
| Average | 0.512 | 0.538 | 0.537 | |
Table 11.
Measurement results for Crack 1.
| Crack Number | Ground Truth (M) | Traditional Methods Using FLANN Matcher | Our Method | ||||
|---|---|---|---|---|---|---|---|
| Measurement Value (M) | Relative Error | Using BF Matcher | Using FLANN Matcher | ||||
| Measurement Value (M) | Relative Error | Measurement Value (M) | Relative Error | ||||
| Crack 1–1 | 1.212 | 1.349 | 11% | 1.312 | 8% | 1.308 | 8% |
| Crack 1–2 | 0.945 | 0.827 | 12% | 0.827 | 12% | 0.858 | 9% |
| Crack 1–3 | 1.091 | 1.320 | 21% | 1.388 | 27% | 1.139 | 4% |
| Average | 15% | 16% | 7% | ||||
Disclaimer/Publisher’s Note: The statements, opinions and data contained in all publications are solely those of the individual author(s) and contributor(s) and not of MDPI and/or the editor(s). MDPI and/or the editor(s) disclaim responsibility for any injury to people or property resulting from any ideas, methods, instructions or products referred to in the content. |
© 2024 by the authors. Licensee MDPI, Basel, Switzerland. This article is an open access article distributed under the terms and conditions of the Creative Commons Attribution (CC BY) license (https://creativecommons.org/licenses/by/4.0/).
Share and Cite
MDPI and ACS Style
Kao, S.-P.; Lin, J.-S.; Wang, F.-L.; Hung, P.-S. A Large-Crack Image-Stitching Method with Cracks as the Regions of Interest. Infrastructures 2024, 9, 74. https://doi.org/10.3390/infrastructures9040074
AMA Style
Kao S-P, Lin J-S, Wang F-L, Hung P-S. A Large-Crack Image-Stitching Method with Cracks as the Regions of Interest. Infrastructures. 2024; 9(4):74. https://doi.org/10.3390/infrastructures9040074
Chicago/Turabian StyleKao, Szu-Pyng, Jhih-Sian Lin, Feng-Liang Wang, and Pen-Shan Hung. 2024. "A Large-Crack Image-Stitching Method with Cracks as the Regions of Interest" Infrastructures 9, no. 4: 74. https://doi.org/10.3390/infrastructures9040074