1. Introduction
The monitoring and mapping of crops on a large scale are essential to assist in management and decision-making in various crops, thus improving production efficiency in a more technological way [
1,
2]. In this context, remote sensing is an effective strategy, allowing better precision in agricultural monitoring, especially in the health of crops, such as soybeans, which are regularly affected by foliar diseases [
3], which lead to irreversible economic damage.
One of the diseases that affects the soybean [
Glycine max (L.) Merril] is target spot (
Corynespora cassiicola), which has become increasingly prominent since 2010 due to the use of sensitive cultivars and loss of sensitivity to regulated fungicides. Several resistant strains of the fungus have emerged in recent years, increasing its spread and making control difficult, generating economic losses in several soybean production areas [
4]. Some recent studies have reported yield losses of up to 24%. Among the factors that increase its importance, its ability to survive in crop residues has a major impact [
5]. Another aspect of great importance for this disease is its host range, of which 530 plant species have been reported [
6,
7,
8,
9].
Plants respond to biotic and abiotic pressures by changing their biophysical and biochemical aspects, such as reducing their biomass and developing chlorosis, which can be readily identified using remote-sensing techniques applied to the visible, near-infrared and shortwave infrared spectrum range (VIS/NIR/SWIR) [
10]. The early identification of crop diseases offers adequate time to control potential epidemics and minimize yield losses. In view of this, professionals in precision agriculture persist in the search for innovative and economical solutions that easily and effectively address disease detection [
11]. Due to advances in technology, increasingly smaller, lighter and cheaper sensors have become available for remote-sensing drone applications. In the literature, it is possible to find detailed introductions to various drone remote-sensing systems [
12,
13].
A more sophisticated imaging technique, called hyperspectral imaging, uses reflectance data collected over a wide spectral range, usually between 350 and 2500 nm, in order to reconstruct a spatial representation of the plant leaf under analysis through highly specialized image processing procedures. Although the use of hyperspectral data is an extremely informative approach that enables the detection of a wider range of plant diseases compared to RGB imaging, it does have some disadvantages, including high costs, longer data acquisition periods and complex data analysis, especially in situations where rapid responses or extensive assessment of large areas are required [
14]. In this sense, using machine learning techniques allied to remote sensing enables technological advances in the agricultural environment in crop monitoring, especially in phytosanitary aspects. The authors of [
15] recommend the processing of sensor data by using machine learning for fast and accurate classification in crop diseases.
The hypothesis of this study is that it is possible to diagnose the occurrence of target spot on soybean leaves using hyperspectral and multispectral sensors, and to analyze the relationship between these spectral characteristics and the crop yield. The objectives of this study were: (i) identify spectral differences between target spot disease severity levels; (ii) investigate the relationship between disease severity levels and multi- and hyperspectral data; (iii) identify the best input that guarantees the best performance of machine learning algorithms between multi- and hyperspectral data.
3. Results
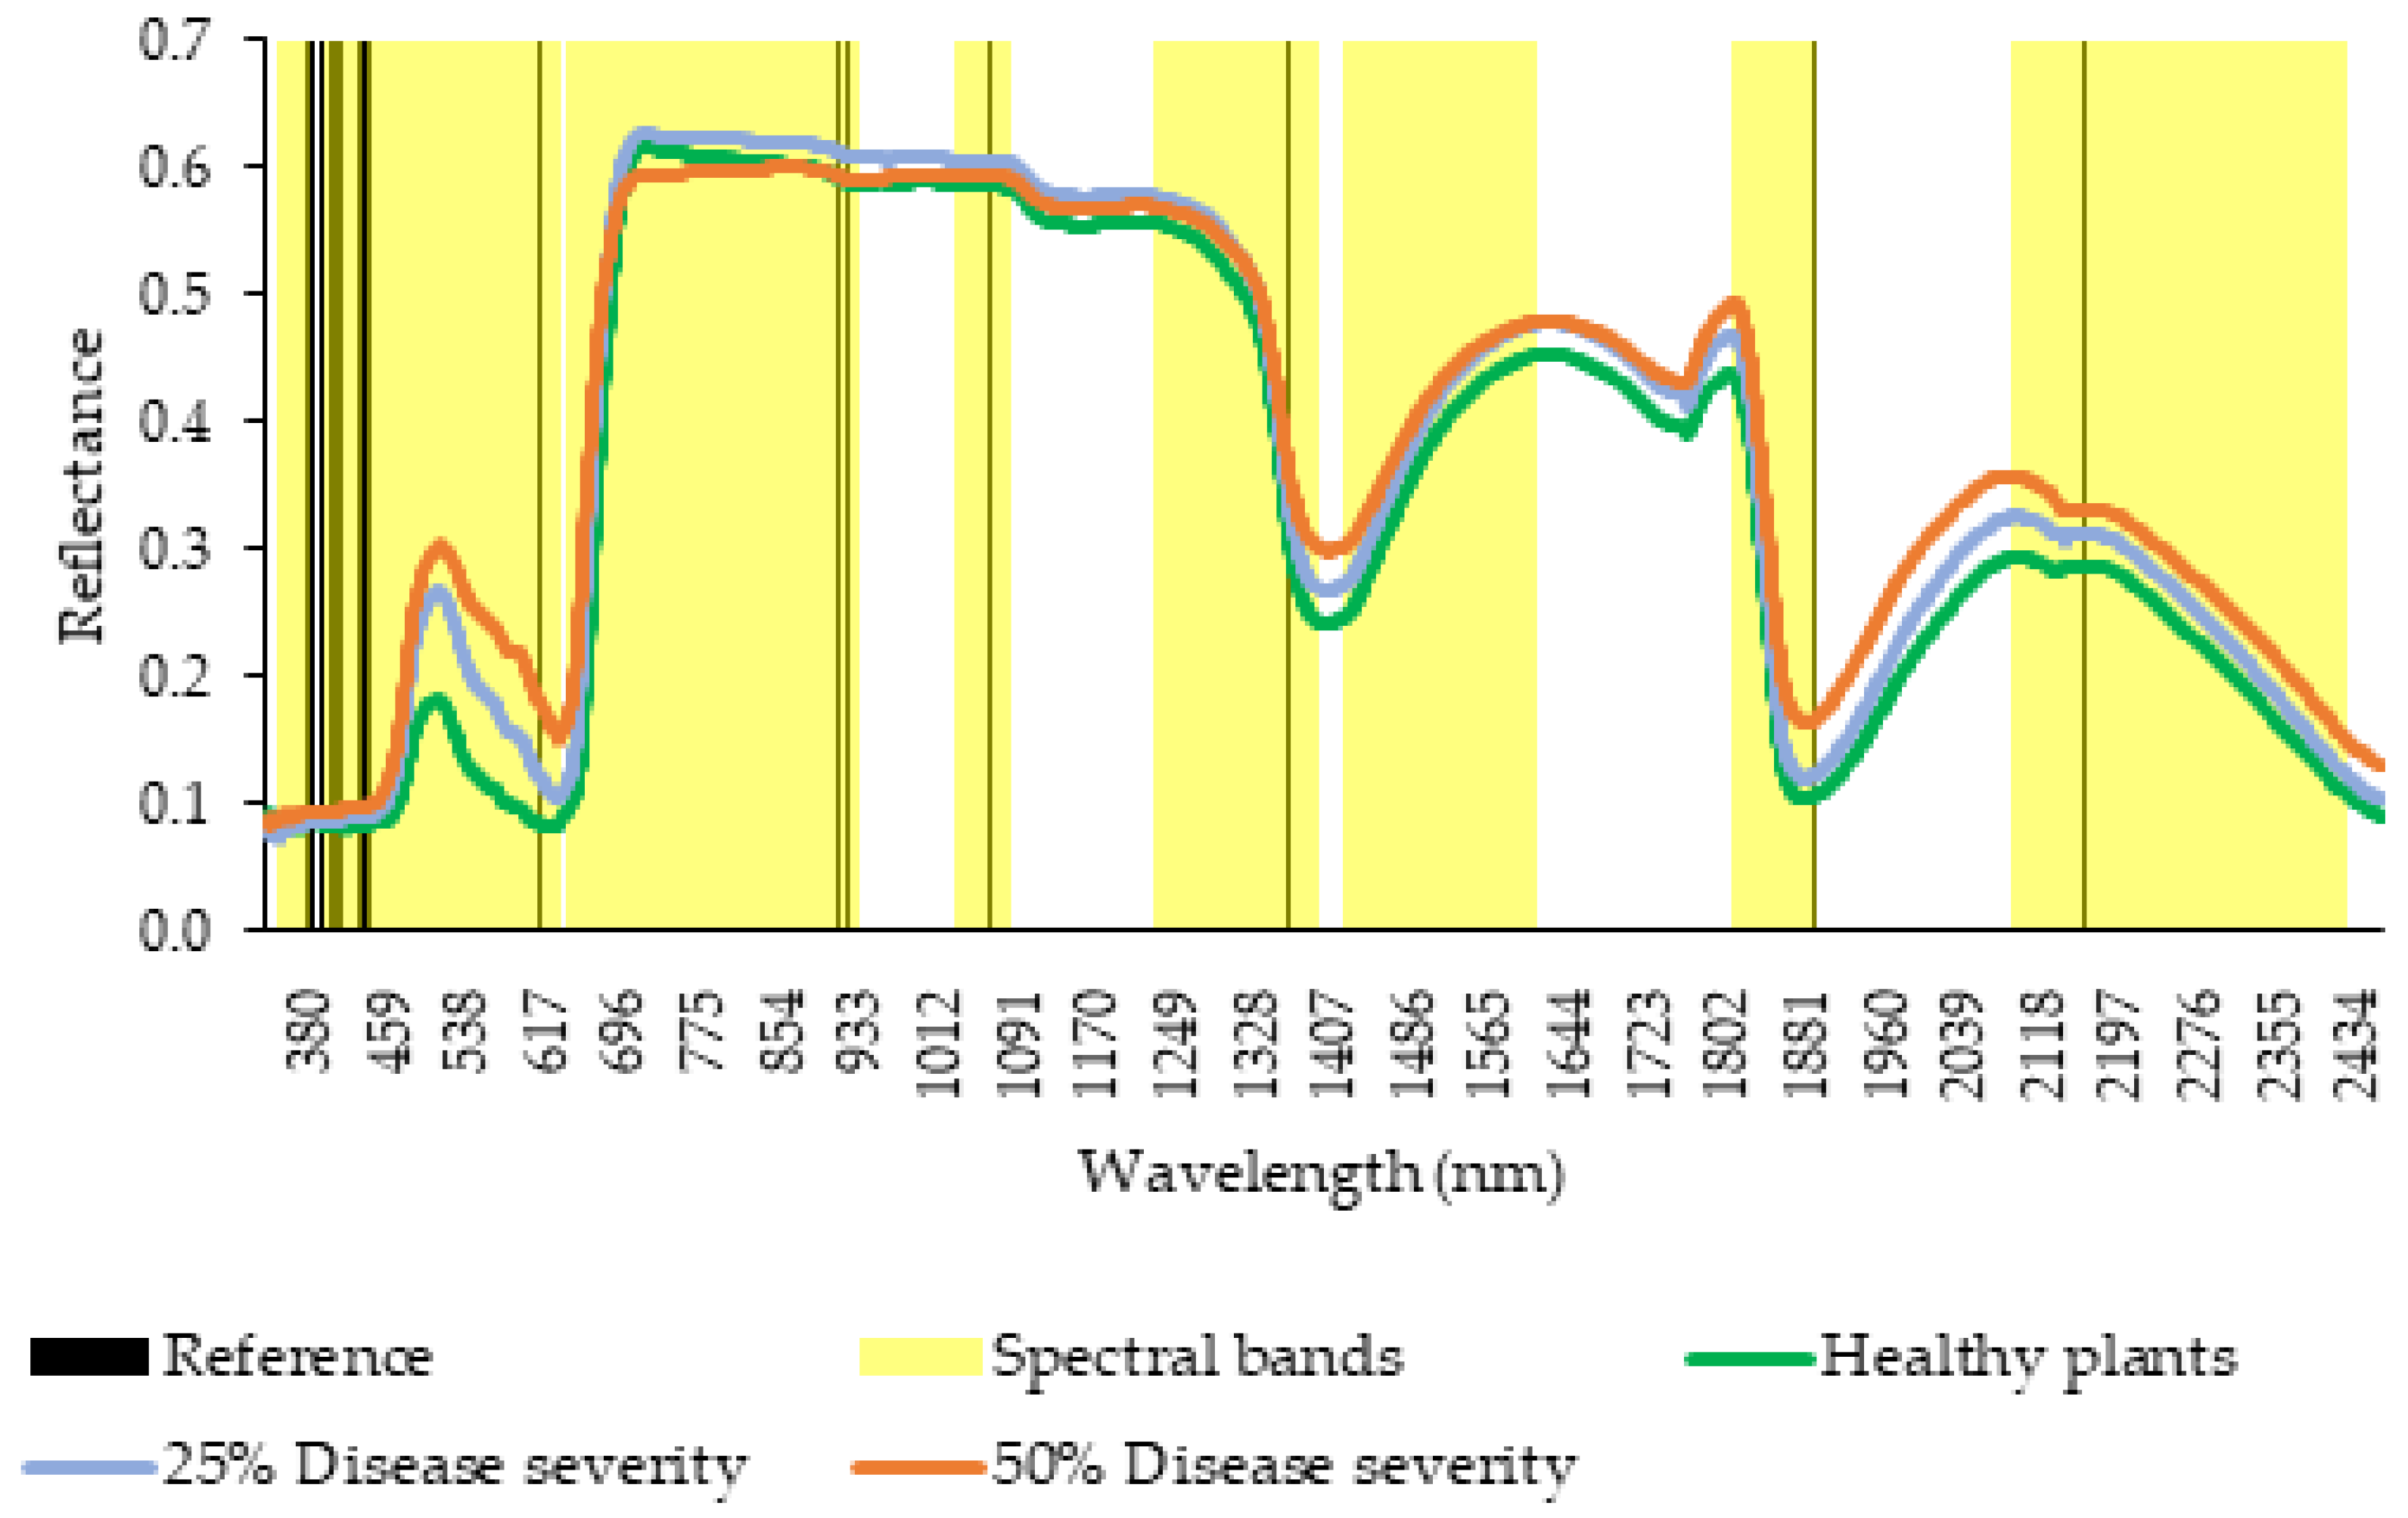
Disease severity levels showed different hyperspectral curves (
Figure 4). It is remarkable that the highest reflectance in the visible region occurred in the highest severity leaves (50%), while the lowest reflectance was in the healthy leaves, especially in the 508–700 nm wavelengths corresponding to bands B3, B4 and B5.
Healthy leaves showed similar reflectance at a severity level of 25% in the wavelength range from 725 to 863 nm, from which point there was a decrease in reflectance up to the short-wave infrared (SWIR) region. In the near-infrared (NIR) region, 50% severity showed low reflectance between the wavelengths from 725 to 794 nm, with a subsequent increase in reflectance from this point up to the SWIR bands. This behavior was notably represented by bands B6, B7 and B8, corresponding directly to the water content in the leaves. Meanwhile, the 25% severity level revealed an increase in reflectance in the 725 to 1346 nm range, showing intermediate reflectance in the SWIR region.
Canonical analysis revealed a closer relationship between healthy leaves and NDRE and GNDVI (
Figure 5A). Leaves with 25% severity were close to the 680–750 nm, and 1460–1650 nm bands. More severely attacked leaves were close to the 435–470 nm, 2130–2460 nm, and 1850–1930 nm ranges, where the wavelengths presented an increase in reflectance at these levels of severity (
Figure 4).
Figure 5B shows that healthy leaves and yield were closest to the SAVI, EVI, 840 nm and grain weight vectors. Leaves with 25% severity were close to 475 nm, 560 nm, 668 nm, and 717 nm wavelengths.
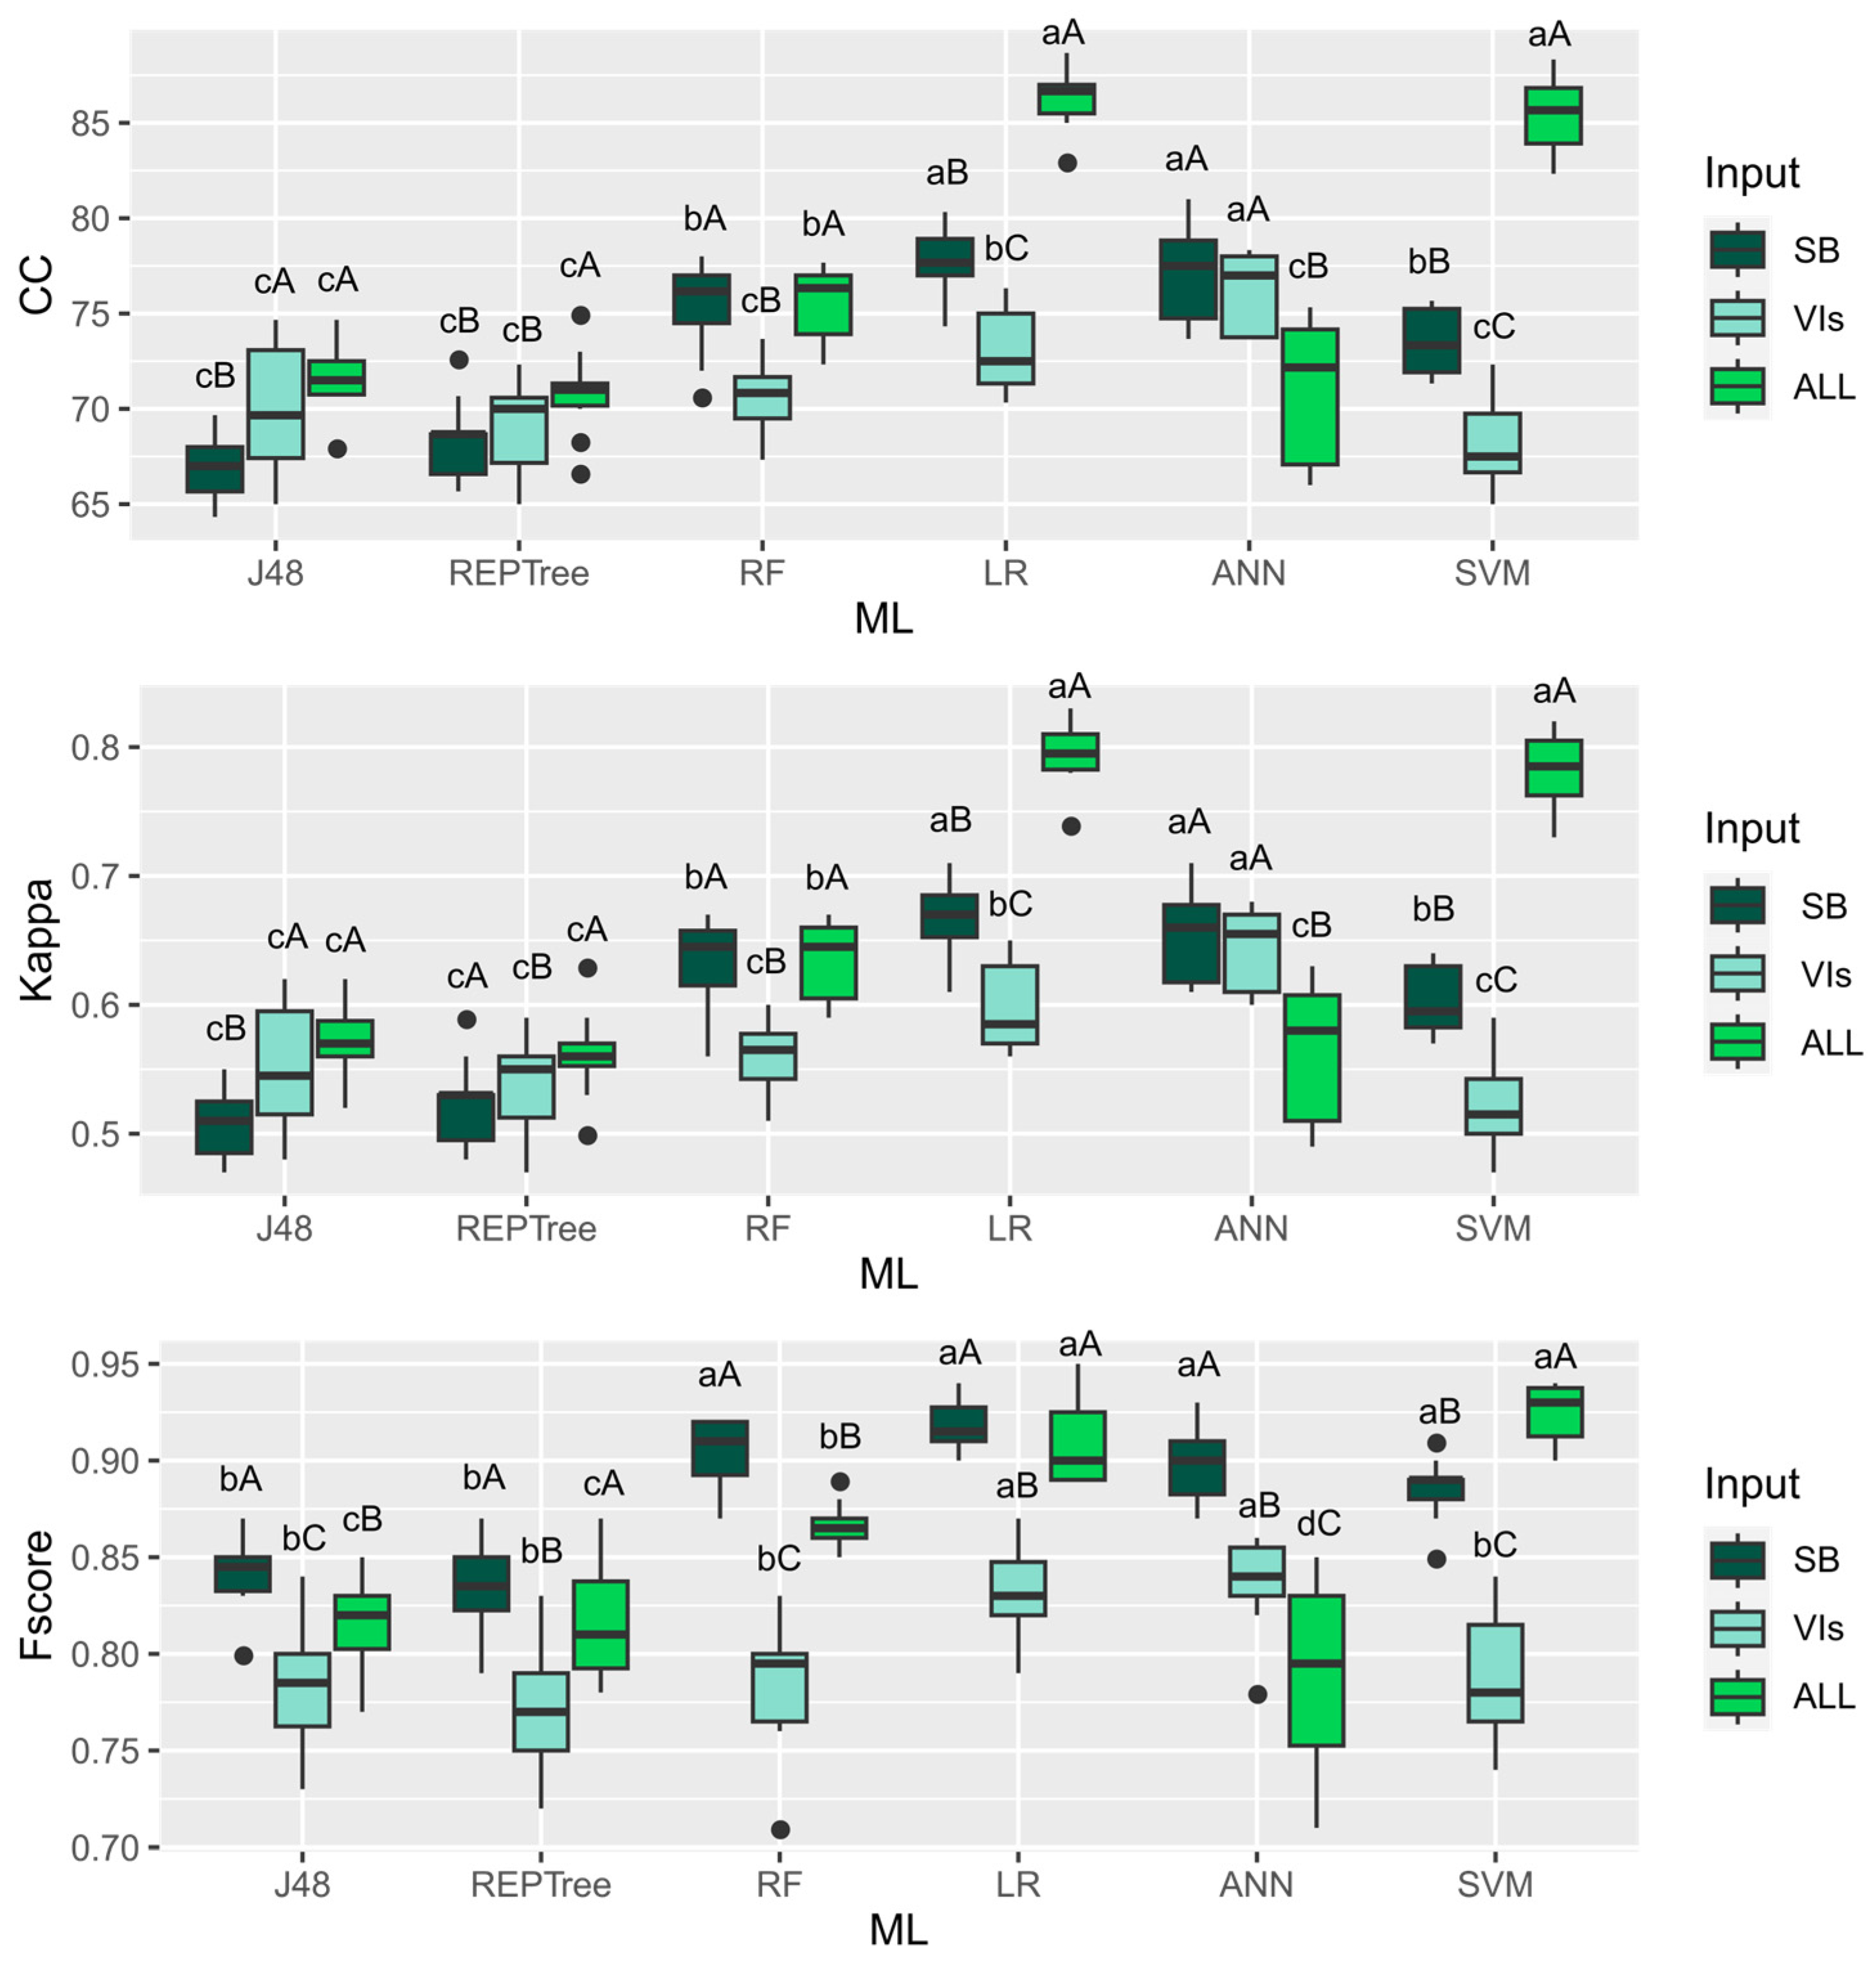
Overall, the levels of disease severity differed from each other and formed different spectral signatures. Thus, data were submitted to machine learning (ML) analysis in order to find the best algorithm for classifying target spot severity levels in soybean. Six ML algorithms and three different input configurations were used, resulting in a significant interaction between them for the three accuracy metrics tested: correct classification percentage (CC), F-score, and Kappa.
For the CC and Kappa metrics (
Figure 6), when using the bands as input configuration, the best performance was achieved by LR and ANN. When using VIs as input, ANN outperformed the other algorithms. Using all the reflectance values provided by the sensor, LR and SVM showed the highest accuracies. When comparing the three inputs within the algorithms, all had the best performance when using all the reflectance information from the sensor.
Considering the F-score metric using bands as input, the best performances were achieved by the RF, LR, ANN and SVM algorithms (
Figure 6). Using VIs as input, LR and ANN showed the best responses. Using all the information provided by the sensor, LR and SVM had the best results. Comparing the three inputs within each algorithm, J48, RF and RNA were better using the bands. REPtree and LR had similar performances using bands or reflectance. SVM achieved better accuracy using reflectance as input.
4. Discussion
The biophysical and biochemical behavior of plant tissue can be altered due to external environmental factors such as diseases, causing changes in tissue color, leaf shape, transpiration rate, leaf morphology and density, which leads to modified optical properties in the leaf tissue, altering its spectral response [
33,
34]. The composition and content of pigments are modified when leaves are exposed to pathogens that cause chlorotic and necrotic symptoms [
34], such as target spot.
In the visible range (VIS) between wavelengths 400 and 700 nm, there is low reflectance of the canopy due to the absorption of chlorophyll and other pigments [
35], as shown in the reference table, where the visible region is more closely related to photosynthesizing pigments such as chlorophyll, anthocyanins, and carotenes. Therefore, this range can be used to detect changes in leaf color caused by diseases and stress in plants [
36]. The low reflectance in the visible spectrum range is indicative of the efficiency of these photosynthesizing pigments in absorbing light to sustain the essential metabolic activities of plants and the higher reflectance of the plants affected by the disease is due to the damage caused to the pigments, negatively affecting their function in the plant and altering their reflectance in this range [
37]. This relationship between reflectance and photosynthetic pigments provides important information for understanding the physiological conditions and the state of the health of the plants.
In the visible range, reflectance increases in proportion to the severity of the disease. However, in the near-infrared (NIR) region, higher reflectance is observed in healthier leaves [
38]. Overall, healthy plants have low reflectance in the visible and mid-infrared regions and high reflectance in the NIR [
39], This pattern of reflectance in the spectral regions provides valuable indications of the plant’s phytosanitary condition, and is particularly relevant for plant health assessments and early detection of diseases. This behavior was partially observed in the hyperspectral signatures in
Figure 3, with the exception of the 725–863 nm band, where there was a peak of reflectance in healthy leaves similar to leaves with a 25% severity level.
Changes observed in the spectral signature at 25% severity when compared to healthy leaves can provide early information on the biochemical changes in the leaf caused by the disease, and the use of a hyperspectral sensor is essential for implementing effective strategies to diagnose target spot and prevent major crop losses [
36]. Furthermore, VIs calculated from the reflectance of the VIS and NIR bands can provide more accurate estimates of chlorophyll content, ensuring accurate results regarding the plant’s photosynthetic activity [
40].
In the SWIR region, a higher reflectance is remarkable at the highest level of disease severity, as this band is associated with the leaf’s chemical composition and water content [
41,
42]. Several studies have reported an increased reflectance in the SWIR region in leaves with a higher severity of diseases such as powdery mildew, grapevine leafroll virus and rust as a result of water loss through the lesions [
42,
43,
44].
Detecting, identifying and quantifying plant diseases using sensors allows more appropriate management, as the sensors are sensitive, accurate and easy to use for evaluating diseases [
45]. Choosing the sensor to use will depend on the resources available, since multispectral sensors are easier to acquire from an economic point of view. By canonical analysis, it can be seen that the multispectral sensor had a higher relationship between healthy leaves and grain weight, both close to the VIs SAVI and EVI, and the 840 nm wavelength. Thus, using this sensor for obtaining these VIs is more sensitive for estimating possible yields in healthy plants due to its higher proximity to grain weight.
There was a behavior in which healthy leaves had a higher association with NDRE and GNDVI when the hyperspectral sensor was used. Using vegetation indices from calculations on the VIS/NIR range can be efficient in agricultural disease monitoring, and can detect changes in vegetation caused by disease attack [
3].
Leaves with 25% severity were close to the 680–750 nm range, equivalent to B5, and the 1460–1650 nm range, equivalent to B9. The stronger relationship between these spectral bands and the lower severity of the disease enables early identification of target spot. The hyperspectral sensor deserves to be highlighted in this relationship with lower disease severity levels because plants with a 25% level are still unable to see symptoms in the upper third, making it difficult for the multispectral sensor to capture differences.
The most severely attacked leaves were in the 435–470 nm, 1850–1930 nm, and 2130–2460 nm bands, where
Figure 3 shows an increased reflectance in these bands in the hyperspectral signature. The 435–470 bands belong to the visible region, which have a higher relevance for classifying the disease, as they are directly related to the pigment absorption regions, which suffer disturbances characterized by chlorosis when the disease is present [
10]. The SWIR region covering the 1850–1930 and 2130–2460 bands tends to increase its reflectance when the leaf’s internal water content decreases, which is directly related to a higher disease infection rate [
46].
Once the disease severities had been distinguished spectrally, this information was used in machine learning models to find accurate algorithms for classifying disease severity. Overall, the algorithms showing the best results for the three metrics were LR and SVM using reflectance, i.e., using all the information from the spectral range provided by the sensor. The authors of [
47] found high accuracy values in the classification of diseased and healthy leaves by using the SVM algorithm, similarly to [
44], who used LR to find a disease detection model. The SVM has been proven to be an effective algorithm in several classification tasks, such as classifying soybean genotypes regarding the primary macronutrient contents [
48] and classifying soybean genotypes according to their content of industrial grain parameters [
10]. In both studies, using the raw information provided by the sensor guaranteed better results for the algorithm. Here, both algorithms had better accuracies using all the information provided by the hyperspectral sensors. Hyperspectral data provide a detailed characterization of the object studied, allowing the assimilation of specific spectral variations for detecting diseases and according to the specifications of each severity level for each disease [
49].
Using hyperspectral sensors allowed a more comprehensive acquisition of information across the leaf spectrum, taking into account the different severity levels. This is because hyperspectral sensors allow information about the chemical properties of what is being evaluated to be obtained, enabling the identification, detection and analysis of the chemical composition of the material, in our case related to the physiology of the plant, facilitating various activities in agriculture and an essential role in harvest monitoring and planning [
50]. In our study, this in-depth spectral analysis offers a more detailed understanding of leaf conditions at different severity levels, contributing significantly to the accuracy and sensitivity of plant-health assessments. Using this advanced approach represents remarkable progress in monitoring and diagnostic abilities, with promising implications for management and decision-making in agricultural and environmental contexts.
5. Conclusions
Applying the methodology used in this research and expanding it to other phytosanitary problems in different crops is a promising perspective for advancing disease monitoring in agriculture. In this way, the approach allows the development of broader strategies for monitoring and controlling diseases in various agricultural crops using hyperspectral data and machine learning, thus enabling the expansion of these discoveries for accurate and even early diagnosis of diseases. The discovery of the algorithm that deals better with the task of classifying target stain severity levels makes it possible to use it in an unsupervised way to classify the disease when its severity is unknown to the professional, making the process more assertive for making decisions on the management strategy to be carried out.
In addition to the relevant findings provided by hyperspectral data, the employment of machine learning algorithms provided significant classification performance, achieving high accuracy in identifying different levels of disease severity. This robust performance suggests that both LR and SVM algorithms are effective, especially when using all available information from the spectral range provided by the sensor to classify target spot severity in soybeans.
Hyperspectral sensors allowed greater acquisition of information across the spectrum of leaves with different levels of severity of the target spot disease. Our results reveal that the LR and SVM algorithms provide high classification accuracy and are therefore best suited for identifying disease severity levels in soybean using the entire reflectance range of the plants.


 ,
, 


