1. Introduction
The Island of Jamaica, just like other small island developing states (SIDS) located in the Caribbean region, faces unique challenges related to natural hazards and climate change impacts (NHCIs). Its susceptibility is particularly evident in the form of hydrometeorological hazards, such as powerful storms that can cause significant damage, exacerbating the effects of other risks, such as floods and landslides [
1,
2]. The consequences of NHCIs are far-reaching and profound, affecting various aspects of Jamaican society, already resulting in an estimated 238 million USD, about 1.5% of Jamaica’s yearly GDP [
3]. In addition to Jamaica’s vulnerability to NHCIs, the El Niño/La Niña Southern Oscillation (ENSO), a periodic oceanic atmospheric phenomenon that occurs across the tropical Pacific, further compounds the country’s challenges. El Niño, a recurring climate pattern characterized by the warming of sea surface temperatures in the equatorial Pacific Ocean [
4], presents significant consequences that can affect Jamaica and other SIDS in the Caribbean region.
Previous studies have investigated the impacts of ENSO on a global scale and the regional climatology of the Caribbean [
5,
6]. Some of these studies have sectioned the island into at least four distinct climatological areas based on observational station data. Jury et al. [
6] found a stable positive relationship at all lags between ENSO and sea surface temperature (SST) in the Jamaica subsection, a weak North Atlantic Oscillation (NAO) dependency, and an increased rainfall in May–July of the year following a warm ENSO. On the contrary, Stephenson et al. [
7] and the Jamaican State of the Climate Report (2019) established that Caribbean temperatures are rising, and heavy precipitation in different parts of the region is increasing [
8]. Stephenson et al. also highlights the challenges posed by data availability and homogeneity in the territory, hence complicating the understanding of the climatology of the region. Ashby et al. [
9] found interannual variations for the Caribbean region, with equatorial Pacific sea surface temperature anomalies, and the NINO3 index and zonal gradients between the equatorial Pacific and tropical Atlantic becoming significant in both the early (May–July) and late (August–October) wet seasons, highlighting spatial variability in predictor importance. Curtis et al. [
10] showed that during El Niño events, Jamaica is at an increased risk of experiencing prolonged periods of drought during the summer. The interaction of the NAO in the preceding spring (March) and an El Niño event that forms typically in July leads to drier mid-summer periods in the Caribbean region. Depending on how extreme this is, it can have systemic, cascading impacts leading to water scarcity, crop failure, and livestock losses, negatively impacting the country’s economy and people’s livelihoods [
11,
12].
Martin [
13] identified a connection between the intra-seasonal (30–90 days) variability in Caribbean precipitation and the phases of the Madden–Julian Oscillation (MJO), based on 12 years of daily satellite precipitation and wind reanalysis data [
13]. It was concluded that ENSO alters convergence patterns and SSTs, leading to variations in rainfall. In El Niño years, the second rainfall season tends to be drier, while in La Niña years, it tends to be wetter. Conversely, during the first rainfall season, there is a tendency for increased precipitation in the year following an El Niño year and reduced rainfall in a La Niña year. Moreover, a study performed by the National Oceanic and Atmospheric Administration (NOAA) [
14], within the northern Caribbean region centered around Puerto Rico, demonstrated that the area receives approximately 13% more precipitation from December to April (the study’s definition of the dry season) during El Niño compared to La Niña years. However, during the study’s definition of the wet season (May to November) (which is different than the dry/wet definitions of the aforementioned studies), La Niña receives approximately 14% more precipitation than in El Niño years.
While previous studies, such as those mentioned above, have significantly contributed to our knowledge of the climate in the region, they come with limitations. They relied heavily on observations and measurements from single stations within the Caribbean region, introducing uncertainty arising from data gaps—due to the lack of spatial coverage across the region—and assumptions introducing bias, when a single station location and time series is assumed to be representative of an entire area. This includes possible changes in a station’s location or change measurement sensors that can affect data quality, particularly for a longer time-series record. Some areas within the Caribbean region have no observation stations, highlighting the need for a more comprehensive and synoptic approach [
1,
15]. Burgess et al. [
16] highlighted that historical data indicates an increasing trend in severe flood events, with an average of 14 events per decade. This suggests that Jamaica’s extreme precipitation records surpass global measurements, highlighting the inadequacy of current intensity–duration–frequency (IDF) curves. Flood control infrastructure design relies on outdated IDF standards, excluding historical and recent gauge data. The author urges that an improved understanding of extreme precipitation is crucial, especially considering potential intensification under climate change [
17].
Recent major technological advancements have been made in assessing the spatial and temporal variability of rainfall, air temperature, and other climatological variables. For example, techniques now incorporate data from multiple satellites, weather stations, and databases. These “big data” provide invaluable information for climate monitoring and risk analysis [
18,
19,
20,
21]. A recent study by Barthelemy et al. [
22] investigated the performance of five remote sensing instruments, including the climate hazards group infrared precipitation with stations (CHIRPS), and evaluated their qualities and shortcomings for hydrometeorological applications in the Caribbean region. The authors concluded that CHIRPS estimates heavy rainfall percentiles sufficiently accurately for its further use in the statistical analysis of rainfall.
A better understanding of the potential impact of ENSO activity on rainfall (and temperature) extremes is crucial for disaster risk preparedness, increasing the reliability of risk assessments, providing more statically explicit information for community disaster planning, and providing the statistical quantification necessary for predicting the systematic risks of floods to existing rural road infrastructure and agricultural operations, for example. Further, the spatially explicit quantification of climate risk enhances risk assessments of critical infrastructure; determines how to strengthen resilience in the face of climate change and extreme rainfall events; helps tailor strategies for infrastructure investments including alternative rainwater harvesting [
23], the optimization of disease management in the cultivation of, for example, high-value Jamaican crops like coffee [
24]; and addresses other concerns related to floods and landslides that could affect people and structures. For instance, the statistical quantifications of ENSO’s spatial influence (and influence over time) can improve the understanding of hazards like bushfire risk, which is an issue of rising concern and urgency according to Charlton et al. [
25].
The primary goal of this study is to examine how rainfall patterns in Jamaica are impacted by ENSO using satellite-based observations to fill in any gaps in data that may be absent from local stations and allow for a more complete and thorough temporal/spatial analysis. We focus on examining the relationship between ENSO events and variations in total monthly rainfall (TMR) in Jamaica’s historical record utilizing high-quality satellite data, specifically CHIRPS and TerraClimate. We aim to elucidate the potential impacts of ENSO on rainfall and temperature extremes, as it is vital for enhancing disaster risk preparedness. By providing statistically robust insights, this study aids in improving risk assessments for community disaster planning, specifically targeting systematic flood risks in terms of rural road infrastructure and agricultural activities. This multifaceted approach is particularly pertinent given the projected escalation of climate-related challenges in Jamaica over the next three decades, making the study’s findings valuable for diverse sectors, including agriculture and tourism [
26]. It is important to emphasize that we do not aim to decode the factors responsible for the onset of ENSO, nor do we intend to develop predictive models for its occurrence.
This paper is organized as follows: We first provide an overview of Jamaica’s climatological characteristics and the four distinct seasonal subdivisions integral to this analysis.
Section 2 describes the data sources of CHIRPS and TerraClimate.
Section 3 explains the statistical methodology used for understanding variable relationships across both temporal and spatial dimensions.
Section 4 shows our findings regarding the two distinct ENSO phases and the four seasons, and it presents a series of illustrative maps, highlighting the patterns of rainfall fluctuations across the region during ENSO events and the various seasons. In
Section 5 we discuss our findings, and in
Section 6, we provide key recommendations inferred from our findings and the potential consequences of recurring cyclical climate events like ENSO that intensify extreme weather above underlying climate change.
3. Methods
To date, there has been a lack of detailed research on how ENSO impacts Jamaica across its entire geographical expanse. We focus on gaining insights from past ENSO events to understand how they impacted the island, particularly through a detailed analysis of rainfall variations, both in terms of time and location. By examining the CHIRPS and TerraClimate datasets, we aim to gain a comprehensive understanding of ENSO’s influence on rainfall variations across Jamaica.
This section outlines such methodology for rainfall variations between 1981 and 2021, using the CHIRPS dataset. We conducted a comprehensive analysis of the rainfall data, examining the maximum, minimum, average, totals, and trends. To assess the correlations between monthly rainfall and other variables, we used multiple correlation techniques. To visualize the geographic variations in rainfall variations, we calculated these correlations and totals for each of the 370 location points in Jamaica.
The monthly rainfall data series from 1981 to 2021 in Jamaica was divided into two sub-samples based on the type of event: El Niño or La Niña conditions. We further classified these sub-samples into four distinct rainfall seasons: dry season I, wet season I, dry season II, and wet season II, as shown in
Table 1 above. For each season, we compiled the total monthly data across sub-samples and selected the maximum TMR. This process was repeated for each of the 370 location points across Jamaica to provide a comprehensive understanding of the spatial variation in this parameter.
3.1. Multiple Correlation Coefficient
Rainfall is well known to be affected by other meteorological data such as temperature, wind speed, humidity, and evapotranspiration [
31,
32]. The degree of the effect of causative factors changes spatially depending on the topographical features of the location. Correlation analysis can show the degree of dependence of the rainfall on these other meteorological variables. We utilized CHIRPS rainfall data to carry out a spatial and temporal correlation analysis covering the period from 1981 to 2021. The analysis was conducted at monthly intervals and separated for El Niño and La Niña events to observe any changes in the causal relationship between rainfall and other variables during ENSO.
When investigating a phenomenon affected by multiple variables, employing multivariate analysis is a common and effective approach. Among these various methods, correlation analysis carries out a pivotal role in elucidating the degree of dependence of a dependent variable
y on various independent variables (
x_i,
i = 1,2
…m), where
m represents the number of these independent variables. In this study, we used two variable correlation coefficients and the multiple correlation coefficient (denoted as
R) with TMR in millimeters as the dependent variable, substituting for
y in the subsequent equations. The independent variables encompass the maximum air temperature (°C)
, the minimum air temperature
, wind velocity (m/s)
, and evapotranspiration (mm)
. These coefficients are determined through the following equations:
where the vector
represents the column vector of two variable correlation coefficients between the dependent variable
y and the independent variables
x_i, while
denotes the correlation matrix among the independent variables
xi,
xj.
The two-variable correlation coefficient is calculated using the following equation:
Equation (4) is used to calculate the elements of the vector in Equation (6) and the matrix in Equation (3).
3.2. Probability Distribution
The frequency distribution works by presenting a mathematical probability density function that shows the frequency of occurrence of different levels of monthly rainfall. This analysis reveals variations within the data, providing insights into how the intensity and frequency of rainfall threshold events fluctuate across the 370 location points in Jamaica during different seasonal scenarios.
In this study, we employ probability density distributions with the best fit, namely normal, lognormal, gamma, and Weibull distributions with their respective equations, as outlined below.
The cumulative density function (CDF) that represents the probability that a random variable takes on a value less than or equal to a given point is expressed by the following equations for each distribution type:
Normal distribution:
where
μ is the location (mean of
x) and
σ = scale (standard deviation of
x)
Lognormal distribution:
where
μ is the scale (mean of log
x) and
σ = shape (standard deviation of log
x)
Gamma distribution:
where
α is the shape,
b is the scale, and
F(
α) is the gamma function.
Weibull distribution:
where
α is the scale and
b is the shape.
The Kolmogorov–Smirnov (KS) test is a nonparametric statistical tool used to assess the likelihood of observing a set of samples, such as our monthly rainfall data categorized by El Niño and La Niña conditions across distinct seasons in Jamaica if they were drawn from the same, albeit unknown, probability distribution. Specifically, we employ the KS test to examine whether the maximum TMR significantly varies among these climatic conditions. This technique is especially well-suited for our study, given its nonparametric nature and independence from specific distributional assumptions.
Data Homogenization for Probability Distribution Modeling
The data sample from 1981 to 2021 was divided into two subsets: 75% (corresponding to 1981–2010) was used for modeling, while approximately 25% (encompassing 2011–2021) served as the model verification. Analysis of these two sets revealed a notable variability in TMR values, with distinct mean values indicating non-homogeneity in the dataset. This discrepancy was previously discussed by Avalon-Cullen et al. [
33], and
Table 2 below presents the
t-test and F-test results supporting this non-homogeneity. In
Table 2, columns 1 and 3 show the
p-value for the
t-test and the F-test, respectively, both demonstrate a significant difference between the modeling and the verification subsamples at a confidence level of 95%, α = 0.05.
To address this issue, given that the modeling phase employed 75% of the data, we standardized the data to enhance homogeneity, with the remaining 25% representing future data (2011–2021). The standardization procedure, outlined by Al Suhili [
34], was implemented as follows:
where
X and
Y denote the original and adjusted modeling data for the 1981–2010 period, respectively.
a represent the overall means of the original data for the periods 1981–2010 and 2011–2021, respectively, and
denote the overall standard deviations for these two data subsets, respectively. It is important to note that the standardization process does not alter the probability distribution. The
t-test and F-test results presented in
Table 2, columns 2 and 4, following the application of Equation (9), confirm that the standardization process successfully homogenized the data as the
p-values are all greater than α.
4. Results
4.1. Correlation Analysis
The spatial variation in the correlation coefficients between TMR and each variable is shown in
Figure 4 below. The TMR and maximum air temperature correlation (TMR/Tmax) show a positive and higher correlation for El Niño compared to La Niña (
Figure 4a). The increase in temperature leads to an increase in the maximum monthly rainfall. Conversely, this relationship is reversed for La Niña as most of the spatial correlation is negative. However, there are exceptions in the east, west, and southern areas.
The correlation coefficient between (TMR and Tmin) spatial variations in
Figure 4c leads to the same observations. In
Figure 4e, the spatial correlation comparison between El Niño and La Niña events for TMR and wind speed (TMR/Wv) shows no significant change, except for a slight variation in the percentage area coverage of positive/negative correlation, as indicated in
Table 3. A similar finding is observed for the comparison of the TMR and average evapotranspiration (TMR/AET) spatial correlation between El Niño and La Niña events in
Figure 4g. The only difference between the two is that the (TMR/Wv) dominant correlation is negative, while the (TMR/AET) correlation is dominantly positive.
The concept of the positive area coverage percentage (PACP) is used in this study to describe the extent of geographical areas in Jamaica where there is a positive correlation between the total monthly rainfall (TMR) and climatic variables (like maximum air temperature—Tmax and minimum air temperature—Tmin) during El Niño and La Niña phases. PACP essentially measures the percentage of an area where TMR increases with an increase in these variables.
Table 3 illustrates this concept. For example, during an El Niño phase, a high PACP is observed for both TMR/Tmax and TMR/Tmin, meaning that in a large part of Jamaica (over 90%), TMR increases as Tmax or Tmin increases. This indicates a strong positive correlation between these variables over most of the island during El Niño. Conversely, during a La Niña phase, we find a smaller PACP for these correlations. Specifically, for TMR/Tmax, it is observed that in more than 77% of Jamaica (PACP = 23%), TMR decreases as Tmax increases. This indicates a predominantly negative correlation between TMR and Tmax during La Niña over a significant portion of the island. Further, the relationship between TMR and evapotranspiration remains unchanged during both El Niño and La Niña events. There is no significant increase in the PACP for the correlations between TMR and wind speed (TMR/Ws) or TMR and evapotranspiration (TMR/AET), suggesting that these relationships are not as strongly affected by El Niño and La Niña events as the temperature correlations.
Figure 5 illustrates the spatial distribution of the multiple correlation coefficient of monthly total rainfall (TMR) with four key variables: maximum air temperature (Tmax), minimum air temperature (Tmin), wind speed (Ws), and average evapotranspiration (AET). The figure highlights the varying strengths of these correlations across different regions of Jamaica. Specifically,
Figure 5a shows a relatively weaker correlation on the eastern side of the island, while
Figure 5b indicates a weaker correlation on the southern side. The correlation coefficients for El Niño range between 0.39 and 0.80, while for La Niña, they range from 0.36 to 0.75, demonstrating variability in the influence of these variables on TMR under different climatic conditions.
To further elucidate these spatial variations,
Table 4 provides a detailed breakdown of the percentage of Jamaica’s area where the multiple correlation coefficient is below certain thresholds. The table categorizes the data according to different limits of the correlation coefficient (R ≤ 0.8, R ≤ 0.7, R ≤ 0.6, R ≤ 0.5). For instance, under the condition R ≤ 0.7, 48% of the area during El Niño shows a significant influence of these four variables on TMR, compared to 99% during La Niña. This suggests that during El Niño, the combined effect of Tmax, Tmin, Ws, and AET on TMR is more pronounced in a smaller area of the island than during La Niña, where the influence is more widespread.
4.2. Probability Distribution Models
To explore whether ENSO influences the probability of the TMR over Jamaica, four common frequency distributions for each season during El Niño and La Niña are used, namely, normal, lognormal, gamma, and Weibull. Parameter estimation for each distribution was performed using the maximum likelihood method, and the goodness of fit was assessed using the Kolmogorov–Smirnov test.
After standardization, for each season, we chose the distribution with the highest σ value as the best fit. The resulting parameter values and the test σ values are shown in
Table 5 below. In the table, the best-fit distributions are highlighted in blue, the non-fitting distributions in red, and the distributions that fitted but were not considered the best fit are in black. This approach ensures the selection of the most appropriate frequency distribution for the total monthly rainfall in each specific season and ENSO phase.
Dry season I is best represented by a lognormal distribution for El Niño and a normal distribution for La Niña. For dry season II, a lognormal distribution is the best fit for both. During wet season I, El Niño is best represented by a normal distribution, while La Niña is best fitted with a lognormal distribution. For wet season II, lognormal is the best fit for El Niño, with gamma for La Niña.
Probability Distribution Verification
We compare the probability of exceeding the established rainfall levels estimated from the validation dataset (2011–2021) in
Figure 6, with the distribution models developed using the training dataset (1981–2010). In
Figure 6a, which examines dry season I using the models for both El Niño and La Niña, it is suggested that the thresholds for significant rainfall range from 50 mm to around 240 mm. Notably, La Niña shows a consistently higher probability across these thresholds compared to El Niño. For example, the probability of exceeding 200 mm of rainfall during El Niño approaches zero, while for La Niña, it extends to nearly 250 mm. This indicates a greater likelihood of higher rainfall totals during La Niña events in dry season I.
Figure 6b explores dry season II and reveals a similar trend, with La Niña again showing higher threshold probabilities than El Niño, starting at 50 mm and reaching up to approximately 325 mm. Both phases exhibit a decline in probability as the rainfall thresholds increase, yet they converge at higher thresholds. A distinct observation here is the increased probability of exceeding 100 mm of rainfall during this season.
Moving on to
Figure 6c, which captures wet season I, we see thresholds ranging from 100 mm to 400 mm. The graph indicates a higher probability for La Niña across this spectrum, suggesting that wet season I is typically wetter during La Niña than El Niño events. Finally,
Figure 6d, representing wet season II, showcases threshold values between 200 mm and 700 mm. In line with the previous patterns, La Niña demonstrates a higher probability of exceeding these thresholds. This suggests not only a consistent pattern of higher rainfall probabilities during La Niña for both wet seasons, but it also indicates that the quantities of rainfall are significantly greater in wet season II than in wet season I.
To evaluate the probabilities of rainfall during different seasons for El Niño and La Niña events, we analyzed the likelihood of total monthly rainfall (TMR) within certain ranges. These ranges are segmented into intervals such as less than 100 mm, 100–200 mm, 200–300 mm, and extending to the extreme range of 900–1000 mm.
Figure 7a examines dry season I, revealing that for El Niño, there is a pronounced probability for lower rainfall amounts, particularly under 61 mm. The data suggests a bimodal distribution, indicating a tendency towards either lower or moderately high rainfall amounts during El Niño. For La Niña, the probability distribution appears to be more evenly spread across various rainfall intervals, although it also shows a significant likelihood for rainfall in the 61–87 mm range.
Figure 7b, depicting dry season II, continues this bimodal trend. El Niño displays a distribution leaning towards lower rainfall amounts, while La Niña shows a distribution closer to a normal curve, suggesting a broader range of rainfall amounts with a significant occurrence in the 58–91 mm range. The probabilities here are generally lower than those in dry season I, which may indicate less overall rainfall during this period. The calculated probabilities for El Niño and La Niña in this range are lower than the observed values, with El Niño’s lognormal distribution indicating a lower probability than La Niña’s.
Moving on to wet season I, as shown in
Figure 7c, El Niño’s distribution is left-skewed, pointing to a higher occurrence of smaller rainfall amounts. Conversely, La Niña’s distribution is more symmetric, suggesting a greater likelihood of a wide range of rainfall amounts, but with an emphasis on intervals exceeding 178 mm. El Niño’s calculated lognormal distribution fits closer to observed probabilities in lower intervals (up to 265 mm), while La Niña’s normal distribution calculated probabilities suggest higher likelihoods for larger amounts of rainfall, especially in the interval of 265–309 mm.
Lastly,
Figure 7d illustrates wet season II, highlighting contrasts between the distributions of El Niño and La Niña. El Niño has a high observed probability for the 189–250 mm range, while La Niña shows a significant peak in the 493–554 mm range. The calculated values for El Niño fit closely with the observed in the lower intervals but underestimate the higher rainfall intervals. For La Niña, the calculated gamma distribution suggests a higher probability for extremely high rainfall intervals than the observed values.
4.3. Spatial and Temporal Variability of TMR
The analysis of total monthly rainfall (TMR) during El Niño and La Niña phases across Jamaica reveals distinct geographical and seasonal patterns. During both dry seasons I and II, as seen in
Figure 8, La Niña events typically result in higher rainfall, especially in the northeast part of the island, including the Blue Mountains area. In dry season I, La Niña leads to more rainfall in the northeastern region compared to El Niño, while the southern region experiences similar rainfall levels in both phases. Similarly, in dry season II, La Niña again brings greater rainfall to the northeast than El Niño.
Conversely, during El Niño events, dry season I generally sees lower TMR values across most parts of Jamaica, while in dry season II, the northwestern part of the island receives more rainfall. For La Niña events, dry season I tends to have lower TMR values than dry season II, with notably drier areas in the southern region of the island. These findings highlight the significant impact of ENSO phases on Jamaica’s rainfall distribution, particularly during the dry seasons.
Wet seasons I and II under El Niño and La Niña conditions, as illustrated in
Figure 9, reveal a stark contrast to the patterns observed during the dry seasons. In the wet seasons, El Niño is associated with higher rainfall in the northwestern part of Jamaica. The geographical variability in rainfall distribution is evident even between the two wet seasons under El Niño conditions. During wet season I, El Niño brings increased rainfall distributed across the western part of the island. In contrast, during wet season II under El Niño, rainfall is more concentrated in the northeastern region.
In the case of La Niña, the rainfall patterns differ significantly. Wet season I experiences a more uniform distribution of rainfall over the entire northern part of the island compared to El Niño, with relatively less rainfall in the southern regions. Conversely, during wet season II, La Niña results in increased rainfall across most of the island, in contrast to El Niño, where higher rainfall is more localized, particularly within the Blue Mountains region. These distinctions emphasize the diverse impacts of El Niño and La Niña on Jamaica’s rainfall, demonstrating significant variations not only between the wet and dry seasons but also within the wet seasons themselves.
4.4. ENSO Hazards
While acknowledging the qualitative nature of the hazard report, we leverage these qualitative insights in identifying coincidental events that could be attributed to ENSO. Despite the limitations associated with the non-methodical nature and lack of precision in this dataset, we find it crucial to incorporate this information as a guide, representing the initial step in investigating the effects of ENSO on the island. Furthermore, this highlights the urgent need to establish a more comprehensive hazard database.
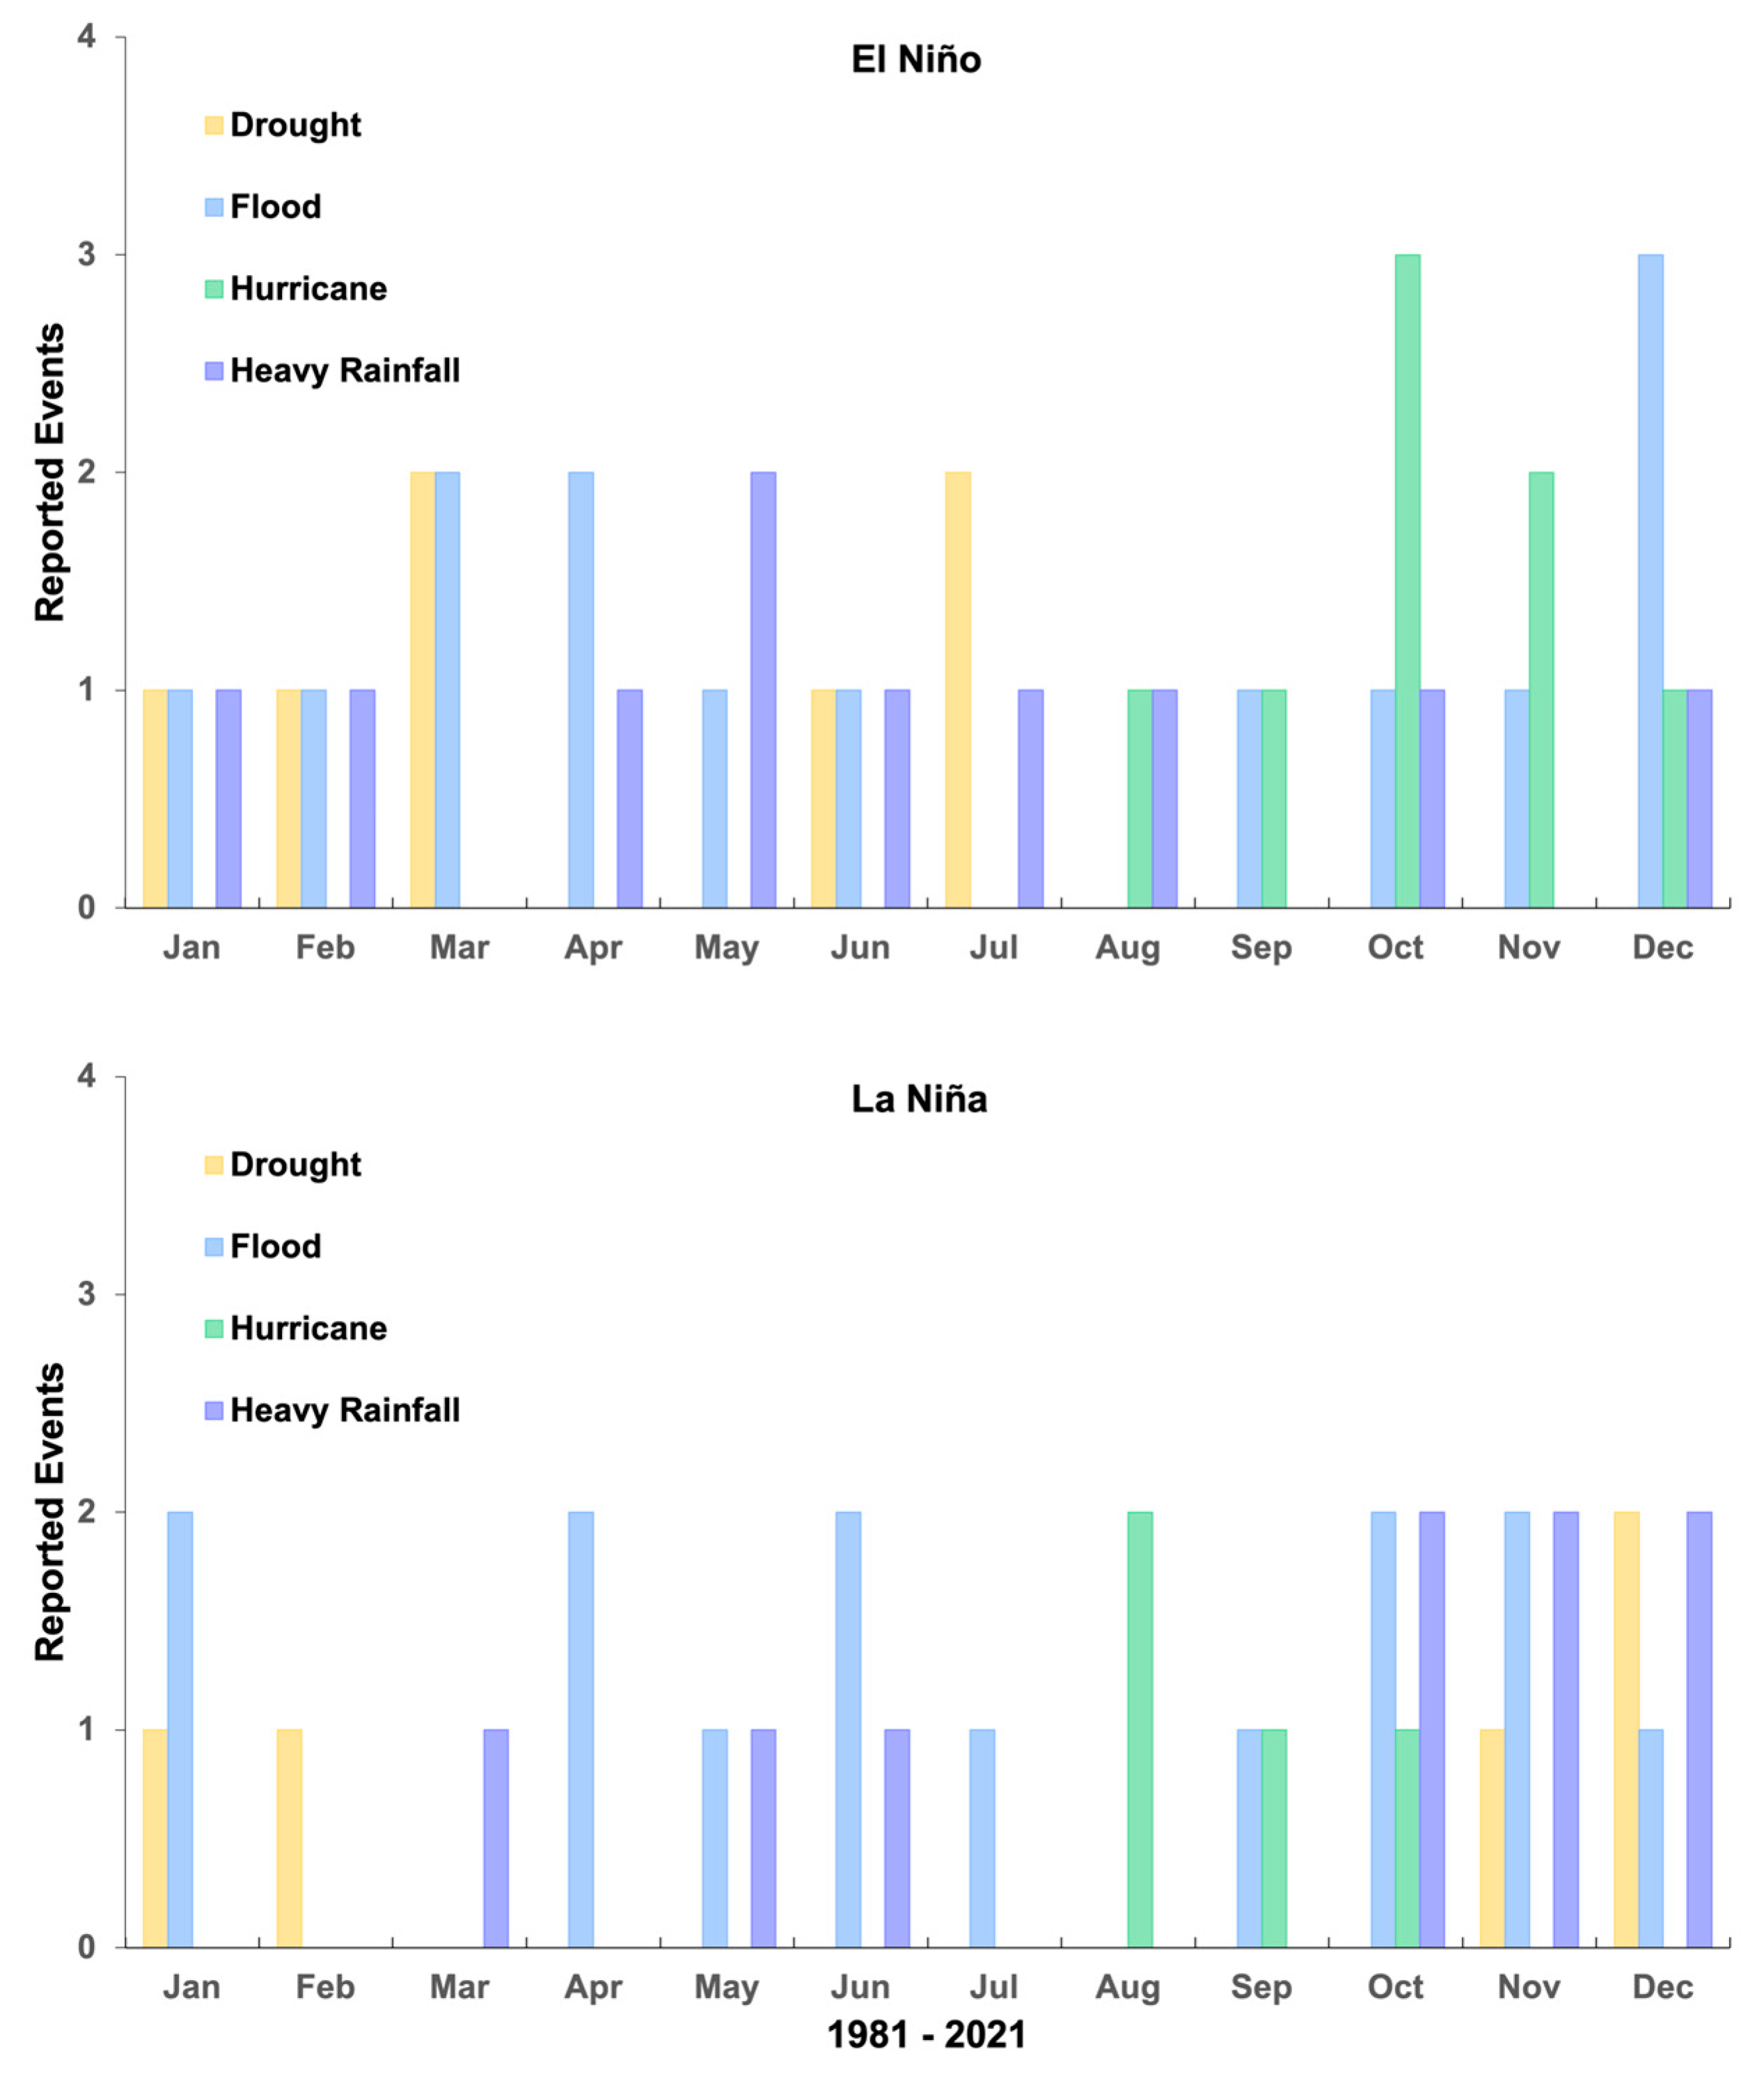
Among the four categories depicted in
Figure 10, patterns in droughts and hurricanes emerge as the most robust temporal signal.
Figure 10 illustrates that hurricanes tend to occur more frequently towards the second wet season (wet II) of El Niño, while droughts are distributed across both dry seasons. Interestingly, during La Niña, there are no droughts in the second dry season (dry II), but they occur in what would be the second wet season (wet II). Although the lack of locality information makes it challenging to pinpoint where these events occurred, it is plausible that the observed drought spells during La Niña coincide with regions showing a lower TMR in
Figure 9, particularly in the southern areas.
It is imperative to emphasize that this dataset, being qualitative, may not establish a direct link to ENSO. Certainly, various weather and climate shocks can manifest independently on El Niño or La Niña; however, the likelihood of encountering these events escalates when teleconnection patterns evolve, especially during specific seasons. To draw conclusive evidence, a more extensive set of quantitative hazard data is essential. However, this study highlights the importance of identifying the impact of ENSO on Jamaica, laying the foundation for exploring qualitative connections between hazards and this climatic phenomenon.
5. Discussion
The positive correlation between TMR and the maximum air temperature (TMax) during El Niño suggests that warmer air temperatures, possibly influenced by the warming of sea surface temperatures in the equatorial Pacific, lead to increased rainfall. However, the spatial distribution of this increased rainfall is quite specific, primarily affecting the northwestern and western parts of the island. El Niño typically leads to below-normal seasonal precipitation aligned with global observations. Contrary to El Niño, La Niña shows a reversed relationship with a negative correlation between TMR and Tmax. This is indicative of cooler temperatures potentially leading to increased rainfall, especially in the northeastern part of the island during the dry seasons.
The probability of heavy rainfall is significantly higher during La Niña events, particularly in the wet season II. This could have substantial implications for water resource management, agriculture, and disaster preparedness in these regions. Understanding these correlations and spatial variations is crucial for effective agricultural planning, water resource management, and preparing for weather-related hazards. For instance, regions prone to increased rainfall during La Niña could focus on flood mitigation strategies, while areas with less rainfall during El Niño might prioritize water conservation.
While this study offers valuable insights, it is important to acknowledge the stochastic nature of rainfall. The correlations, though significant, still operate within a realm of unpredictability inherent to weather systems.
Future research could further explore the underlying mechanisms driving these correlations, perhaps extending the analysis to other climatic variables or broader geographic areas such as the total Caribbean region to see if similar patterns hold.
Practical Applications
The findings with regard to distinct rainfall patterns associated with El Niño and La Niña during different seasons provides valuable information for various practical applications:
Agricultural Planning and Crop Management: Understanding the likelihood of rainfall allows farmers and agricultural planners to optimize crop selection, irrigation schedules, and planting dates. For example, during La Niña periods, farmers in the northeast part of the island could prepare for higher rainfall, selecting crops that thrive in wetter conditions and adjusting irrigation practices. Conversely, during El Niño, farmers might choose drought-resistant crops, especially in regions expecting less rainfall.
Water Resource Management: Variations in rainfall probability and distribution can guide water resource management strategies. In regions expecting higher rainfall during La Niña, water authorities could plan for enhanced water capture and storage. In contrast, during El Niño, when lower rainfall is expected, strategies might focus on water conservation and efficient usage to mitigate potential shortages.
Flood Risk Management: Areas that are prone to increased rainfall during La Niña, like the northeast part of the island and the Blue Mountains region, can benefit from enhanced flood preparedness and mitigation measures. This could include reinforcing flood defenses, improving drainage systems, and developing evacuation plans.
Drought Management: During periods of El Niño, regions with a higher probability of lower rainfall, particularly in the southern parts of the island, should implement drought management strategies. This might involve water rationing, drought-resistant landscaping, and public awareness campaigns about water conservation.
Infrastructure and Urban Planning: Knowledge of spatial rainfall patterns can inform infrastructure development, ensuring that buildings, roads, and drainage systems are designed to handle the specific rainfall conditions expected in each region. This is crucial for both flood-prone and drought-affected areas.
Climate Change Adaptation Strategies: Understanding the changing patterns of El Niño and La Niña can contribute to long-term climate change adaptation plans. This might involve adjusting agricultural practices, water resource management, and infrastructure development to cope with the changing climate dynamics.
Disaster Preparedness and Response: Emergency services can use these predictions to prepare for and respond to weather-related disasters more effectively. This includes pre-positioning resources in areas likely to experience extreme weather and developing targeted response plans.
Tourism and Recreation Planning: The tourism sector can adjust its activities and marketing strategies based on expected weather conditions, for instance, by promoting indoor activities during high rainfall periods or outdoor activities in drier seasons.
6. Conclusions
This study examined the impact of ENSO on rainfall patterns in Jamaica, using CHIRPS data from 1981 to 2021. We investigated the relationships between El Niño and La Niña ENSO phases in four rainfall seasons, analyzing the maximum, minimum, average, and total rainfall, as well as trends and correlations with other environmental factors. We also calculated correlations and totals for each of the 370 location points in Jamaica, categorized under El Niño and La Niña, and the four yearly climatological seasons. The findings reveal distinct patterns during El Niño and La Niña events, as explained below.
TMR and climatic variables: The correlation between TMR and air temperature (both Tmax and Tmin) is significantly positive and stronger during El Niño compared to La Niña events. This suggests that during El Niño events, higher air temperatures are more reliably associated with increased rainfall on the island. Conversely, during La Niña events, this relationship is not as pronounced. Despite the strong temperature correlations, the influence of wind speed and evapotranspiration on TMR remains relatively unchanged, with only minor fluctuations in the spatial correlation being observed.
Higher TMR Probability During La Niña: Across all seasons, La Niña consistently exhibits a higher probability of exceeding various rainfall thresholds compared to El Niño. This indicates that during La Niña events, Jamaica is more likely to experience greater total monthly rainfall, which can have implications for water resource management, agriculture, and disaster preparedness on the island.
Seasonal Variations in TMR Probability: The probability of higher rainfall amounts is not uniformly distributed throughout the year; rather, it varies significantly with the seasons. During the dry seasons (I and II), although the likelihood of rainfall is generally lower, La Niña still shows a higher probability of exceeding certain rainfall thresholds than El Niño. In contrast, the wet seasons (I and II) demonstrate a substantial increase in the probability of higher rainfall levels during La Niña, with wet season II being particularly prone to very high rainfall events.
Spatial Differences in Rainfall Impact: The impact of ENSO phases on rainfall probability is not spatially uniform across Jamaica. Different regions of the island exhibit varying susceptibilities to changes in TMR during El Niño and La Niña events. For instance, certain parts of the island are more likely to receive increased rainfall during La Niña events, particularly in the northeastern regions including the Blue Mountains during the dry seasons and more uniformly across the northern part of the island during the wet seasons. This spatial variability necessitates region-specific strategies for water resource management and flood risk mitigation.
7. Recommendations and Calls to Action
The distinct rainfall patterns and probabilities of cyclical events described in this research suggest that more targeted approaches to DRR are both possible and critical for Jamaica and the region. Jamaica is highly vulnerable to extreme weather and climate events, including floods, landslides, tropical storms, and cyclical ENSO events. Further, this study accentuates the critical importance of decoding historical patterns and their implications before implementing robust early warning systems. The approach advocates for translating early warnings into proactive measures, ideally through locally driven mechanisms and with international support.
The vulnerability of SIDS has gained prominence in the context of policymaking and climate change adaptation. The situation becomes even more precarious within the context of ENSO, with projections suggesting a potential doubling of extreme El Niño and La Niña events by the end of the 21st century, as reported by NOAA [
35]. Whether it is regarding flooding or droughts, the persistent high vulnerability highlights susceptibility, accentuating the potential for significant socioeconomic impacts [
36]. This reinforces the urgency to address these vulnerabilities through targeted interventions and strategic investments, aligning with the broader call for international support for nations most vulnerable to climate change impacts [
37]. The findings in this study act as a catalyst for a forward-looking call to action, urging consideration and potential linkage to international forums such as the United Nations Climate Change Conference.
The authors suggest that ongoing collaboration among SIDS and internationally is essential to implementing multi-sectoral DRR strategies. These strategies should include community empowerment and cross-sectoral planning for disasters and climate change resilience. The democratization of data and scientific information, as well as increased support for monitoring, should also be prioritized. Furthermore, although Jamaica has already integrated climate change adaptation and mitigation into its national policies and has established effective coordination between agencies, as demonstrated in the Socio-economic and Financial Implications Assessment of Climate Change on Jamaica [
38], it is crucial to involve academic, governmental, and public partnerships to ensure that current tools and frameworks, which may be exclusive to government-only activities, work for all sectors of society. Therefore, it is recommended to continue developing strategies and approaches that involve all sectors of society in the design and implementation of DRR plans.


 ,
, 


