
Screening Disinfection Byproducts in Arid-Coastal Wastewater: A Workflow Using GC×GC-TOFMS, Passive Sampling, and NMF Deconvolution Algorithm
 ,
,
Abstract
:
1. Introduction
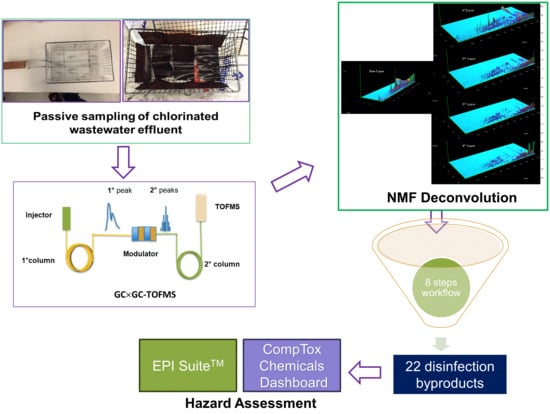
- (a)
- PDMS passive samplers: These samplers provide cleaner extracts and lower detection limits compared to conventional sampling methods, enabling reduced matrix interference and more accurate DBP analysis.
- (b)
- GC×GC-TOFMS: This advanced instrumentation offers enhanced separation power, facilitating better identification of DBPs compared to conventional GC-MS techniques.
- (c)
- NMF deconvolution algorithm: Spectral overlap can occur even with advanced instrumentation. By utilizing the NMF deconvolution algorithm, overlapping peaks can be resolved and accuracy can be improved during compound identification, ensuring reliable analysis of DBPs.
- (d)
- Stepwise exclusion of candidate structures: This approach utilizes a set of criteria to minimize misassignments of peaks and narrow down the candidate list of DBPs, ensuring more reliable analysis results.
- (e)
- Rapid hazard assessment: By incorporating tools like EPI SuiteTM and CompTox Chemicals Dashboard, potential risks associated with identified DBPs can be quickly understood, providing insights into their potential environmental impacts.
2. Materials and Method
2.1. Passive Sampler Preparation
2.2. Field Deployment of Passive Samplers
2.3. Retrieval and Extraction of Passive Samplers
2.4. GC×GC TOFMS Analysis
2.5. NMF Deconvolution
2.6. Sequential Filtering Process for Accurate Identification of Disinfection Byproducts
2.7. Hazard Screening Analysis
3. Results and Discussion
3.1. Synergy of Passive Samplers and GC×GC
3.2. Enhancing the Identification of Disinfection Byproducts through NMF Deconvolution
3.3. Implementation of Sequential Filtering Process for Accurate Identification of Disinfection Byproducts
3.4. Hazard Profiling of Detected Wastewater DBPs
4. Limitations and Future Outlook
5. Conclusions
Supplementary Materials
Author Contributions
Funding
Institutional Review Board Statement
Informed Consent Statement
Data Availability Statement
Acknowledgments
Conflicts of Interest
References
- Hameed, M.; Moradkhani, H.; Ahmadalipour, A.; Moftakhari, H.; Abbaszadeh, P.; Alipour, A. A Review of the 21st Century Challenges in the Food-Energy-Water Security in the Middle East. Water 2019, 11, 682. [Google Scholar] [CrossRef]
- Shah, E.; Liebrand, J.; Vos, J.; Veldwisch, G.J.; Boelens, R. The UN World Water Development Report 2016, Water and Jobs: A Critical Review. Dev. Chang. 2018, 49, 678–691. [Google Scholar] [CrossRef]
- Voulvoulis, N. Water Reuse from a Circular Economy Perspective and Potential Risks from an Unregulated Approach. Curr. Opin. Environ. Sci. Health 2018, 2, 32–45. [Google Scholar] [CrossRef]
- Partyka, M.L.; Bond, R.F. Wastewater Reuse for Irrigation of Produce: A Review of Research, Regulations, and Risks. Sci. Total Environ. 2022, 828, 154385. [Google Scholar] [CrossRef] [PubMed]
- Quartaroli, L.; Cardoso, B.H.; de Paula Ribeiro, G.; da Silva, G.H.R. Wastewater Chlorination for Reuse, an Alternative for Small Communities. Water Environ. Res. 2018, 90, 2100–2105. [Google Scholar] [CrossRef]
- Li, Z.; Liu, X.; Huang, Z.; Hu, S.; Wang, J.; Qian, Z.; Feng, J.; Xian, Q.; Gong, T. Occurrence and Ecological Risk Assessment of Disinfection Byproducts from Chlorination of Wastewater Effluents in East China. Water Res. 2019, 157, 247–257. [Google Scholar] [CrossRef] [PubMed]
- Li, X.F.; Mitch, W.A. Drinking Water Disinfection Byproducts (DBPs) and Human Health Effects: Multidisciplinary Challenges and Opportunities. Environ. Sci. Technol. 2018, 52, 1681–1689. [Google Scholar] [CrossRef]
- Harman, C.; Allan, I.; Thomas, K.V. Passive Sampling of Organic Contaminants in Waters. In Comprehensive Sampling and Sample Preparation; Academic Press: Cambridge, MA, USA, 2012; ISBN 9780123813749. [Google Scholar]
- Phong, T.K.; Phuc, D.H.; Tuan, L.A.; Phi, T.H.; Hiramatsu, K. Applications of Passive Sampling Techniques in Monitoring Organic Pollutants in the Environment. J. Fac. Agric. Kyushu Univ. 2012, 57, 169–174. [Google Scholar] [CrossRef] [PubMed]
- Taylor, A.C.; Fones, G.R.; Vrana, B.; Mills, G.A. Applications for Passive Sampling of Hydrophobic Organic Contaminants in Water—A Review. Crit. Rev. Anal. Chem. 2021, 51, 20–54. [Google Scholar] [CrossRef]
- Leslie, H.A.; Oosthoek, A.J.P.; Busser, F.J.M.; Kraak, M.H.S.; Hermens, J.L.M. Biomimetic Solid-Phase Microextraction to Predict Body Residues and Toxicity of Chemicals That Act by Narcosis. Environ. Toxicol. Chem. 2002, 21, 229–234. [Google Scholar] [CrossRef]
- Lohmann, R.; Booij, K.; Smedes, F.; Vrana, B. Use of Passive Sampling Devices for Monitoring and Compliance Checking of POP Concentrations in Water. Environ. Sci. Pollut. Res. 2012, 19, 1885–1895. [Google Scholar] [CrossRef] [PubMed]
- Escher, B.I.; Hermens, J.L.M. Peer Reviewed: Internal Exposure: Linking Bioavailability to Effects. Environ. Sci. Technol. 2004, 38, 455A–462A. [Google Scholar] [CrossRef] [PubMed]
- Difilippo, E.L.; Eganhouse, R.P. Assessment of PDMS-Water Partition Coefficients: Implications for Passive Environmental Sampling of Hydrophobic Organic Compounds. Environ. Sci. Technol. 2010, 44, 6917–6925. [Google Scholar] [CrossRef]
- Verbruggen, E.M.J.; Vaes, W.H.J.; Parkerton, T.F.; Hermens, J.L.M. Polyacrylate-Coated SPME Fibers as a Tool to Simulate Body Residues and Target Concentrations of Complex Organic Mixtures for Estimation of Baseline Toxicity. Environ. Sci. Technol. 2000, 34, 324–331. [Google Scholar] [CrossRef]
- Hawthorne, S.B.; Jonker, M.T.O.; Van Der Heijden, S.A.; Grabanski, C.B.; Azzolina, N.A.; Miller, D.J. Measuring Picogram per Liter Concentrations of Freely Dissolved Parent and Alkyl PAHs (PAH-34), Using Passive Sampling with Polyoxymethylene. Anal. Chem. 2011, 83, 6754–6761. [Google Scholar] [CrossRef] [PubMed]
- Fries, E.; Zarfl, C. Sorption of Polycyclic Aromatic Hydrocarbons (PAHs) to Low and High Density Polyethylene (PE). Environ. Sci. Pollut. Res. 2012, 19, 1296–1304. [Google Scholar] [CrossRef] [PubMed]
- Tucca, F.; Moya, H.; Barra, R. Ethylene Vinyl Acetate Polymer as a Tool for Passive Sampling Monitoring of Hydrophobic Chemicals in the Salmon Farm Industry. Mar. Pollut. Bull. 2014, 88, 174–179. [Google Scholar] [CrossRef] [PubMed]
- Cristóvão, M.B.; Bento-Silva, A.; Bronze, M.R.; Crespo, J.G.; Pereira, V.J. Detection of Anticancer Drugs in Wastewater Effluents: Grab versus Passive Sampling. Sci. Total Environ. 2021, 786, 147477. [Google Scholar] [CrossRef]
- Posada-Ureta, O.; Olivares, M.; Zatón, L.; Delgado, A.; Prieto, A.; Vallejo, A.; Paschke, A.; Etxebarria, N. Uptake Calibration of Polymer-Based Passive Samplers for Monitoring Priority and Emerging Organic Non-Polar Pollutants in WWTP Effluents. Anal. Bioanal. Chem. 2016, 408, 3165–3175. [Google Scholar] [CrossRef]
- Chen, Y.; Wen, Y.; Tang, Z.; Li, L.; Cai, Y.; Zhou, Q. Removal Processes of Disinfection Byproducts in Subsurface-Flow Constructed Wetlands Treating Secondary Effluent. Water Res. 2014, 51, 163–171. [Google Scholar] [CrossRef]
- Winnike, J.H.; Wei, X.; Knagge, K.J.; Colman, S.D.; Gregory, S.G.; Zhang, X. Comparison of GC-MS and GC×GC-MS in the Analysis of Human Serum Samples for Biomarker Discovery. J. Proteome Res. 2015, 14, 1810–1817. [Google Scholar] [CrossRef] [PubMed]
- Pico, Y.; Alfarhan, A.H.; Barcelo, D. How Recent Innovations in Gas Chromatography-Mass Spectrometry Have Improved Pesticide Residue Determination: An Alternative Technique to Be in Your Radar. TrAC—Trends Anal. Chem. 2020, 122, 115720. [Google Scholar] [CrossRef]
- Muscalu, A.M.; Górecki, T. Comprehensive Two-Dimensional Gas Chromatography in Environmental Analysis. TrAC—Trends Anal. Chem. 2018, 106, 225–245. [Google Scholar] [CrossRef]
- Higgins Keppler, E.A.; Jenkins, C.L.; Davis, T.J.; Bean, H.D. Advances in the Application of Comprehensive Two-Dimensional Gas Chromatography in Metabolomics. TrAC—Trends Anal. Chem. 2018, 109, 275–286. [Google Scholar] [CrossRef] [PubMed]
- Zushi, Y.; Hashimoto, S.; Tanabe, K. Nontarget Approach for Environmental Monitoring by GC × GC-HRTOFMS in the Tokyo Bay Basin. Chemosphere 2016, 156, 398–406. [Google Scholar] [CrossRef] [PubMed]
- Hashimoto, S.; Zushi, Y.; Takazawa, Y.; Ieda, T.; Fushimi, A.; Tanabe, K.; Shibata, Y. Selective and Comprehensive Analysis of Organohalogen Compounds by GC × GC–HRTofMS and MS/MS. Environ. Sci. Pollut. Res. 2018, 25, 7135–7146. [Google Scholar] [CrossRef] [PubMed]
- Murrell, K.A.; Dorman, F.L. Characterization and Quantification of Methyl-Benzotriazoles and Chloromethyl-Benzotriazoles Produced from Disinfection Processes in Wastewater Treatment. Sci. Total Environ. 2020, 699, 134310. [Google Scholar] [CrossRef] [PubMed]
- Korytár, P.; Leonards, P.E.G.; De Boer, J.; Brinkman, U.A.T. Group Separation of Organohalogenated Compounds by Means of Comprehensive Two-Dimensional Gas Chromatography. J. Chromatogr. A 2005, 1086, 29–44. [Google Scholar] [CrossRef] [PubMed]
- Bordajandi, L.R.; Ramos, J.J.; Sanz, J.; González, M.J.; Ramos, L. Comprehensive Two-Dimensional Gas Chromatography in the Screening of Persistent Organohalogenated Pollutants in Environmental Samples. J. Chromatogr. A 2008, 1186, 312–324. [Google Scholar] [CrossRef]
- Ishida, K.P.; Luna, R.F.; Richardot, W.H.; Lopez-Galvez, N.; Plumlee, M.H.; Dodder, N.G.; Hoh, E. Nontargeted Analysis of Trace Organic Constituents in Reverse Osmosis and UV-AOP Product Waters of a Potable Reuse Facility. ACS Environ. Sci. Technol. Water 2022, 2, 96–105. [Google Scholar] [CrossRef]
- LECO ChromaTOF Tile. Available online: https://www.leco.com/products/chromatof-tile/ (accessed on 18 April 2024).
- SepSolve Analytical ChromCompare+. Available online: https://www.sepsolve.com/data-analysis-software/chromcompare.aspx (accessed on 18 April 2024).
- Trinklein, T.J.; Cain, C.N.; Ochoa, G.S.; Schöneich, S.; Mikaliunaite, L.; Synovec, R.E. Recent Advances in GC×GC and Chemometrics to Address Emerging Challenges in Nontargeted Analysis. Anal. Chem. 2023, 95, 264–286. [Google Scholar] [CrossRef] [PubMed]
- Murtada, K.; Bowman, D.; Edwards, M.; Pawliszyn, J. Thin-Film Microextraction Combined with Comprehensive Two-Dimensional Gas Chromatography Time-of-Flight Mass Spectrometry Screening for Presence of Multiclass Organic Pollutants in Drinking Water Samples. Talanta 2022, 242, 123301. [Google Scholar] [CrossRef] [PubMed]
- Trinklein, T.J.; Synovec, R.E. Simulating Comprehensive Two-Dimensional Gas Chromatography Mass Spectrometry Data with Realistic Run-to-Run Shifting to Evaluate the Robustness of Tile-Based Fisher Ratio Analysis. J. Chromatogr. A 2022, 1677, 463321. [Google Scholar] [CrossRef] [PubMed]
- Hashimoto, S.; Zushi, Y.; Fushimi, A.; Takazawa, Y.; Tanabe, K.; Shibata, Y. Selective Extraction of Halogenated Compounds from Data Measured by Comprehensive Multidimensional Gas Chromatography/High Resolution Time-of-Flight Mass Spectrometry for Non-Target Analysis of Environmental and Biological Samples. J. Chromatogr. A 2013, 1282, 183–189. [Google Scholar] [CrossRef] [PubMed]
- Hashimoto, S.; Takazawa, Y.; Fushimi, A.; Tanabe, K.; Shibata, Y.; Ieda, T.; Ochiai, N.; Kanda, H.; Ohura, T.; Tao, Q.; et al. Global and Selective Detection of Organohalogens in Environmental Samples by Comprehensive Two-Dimensional Gas Chromatography-Tandem Mass Spectrometry and High-Resolution Time-of-Flight Mass Spectrometry. J. Chromatogr. A 2011, 1218, 3799–3810. [Google Scholar] [CrossRef] [PubMed]
- Zushi, Y.; Hashimoto, S.; Tamada, M.; Masunaga, S.; Kanai, Y.; Tanabe, K. Retrospective Analysis by Data Processing Tools for Comprehensive Two-Dimensional Gas Chromatography Coupled to High Resolution Time-of-Flight Mass Spectrometry: A Challenge for Matrix-Rich Sediment Core Sample from Tokyo Bay. J. Chromatogr. A 2014, 1338, 117–126. [Google Scholar] [CrossRef]
- Zushi, Y.; Hashimoto, S.; Tanabe, K. Global Spectral Deconvolution Based on Non-Negative Matrix Factorization in GC × GC-HRTOFMS. Anal. Chem. 2015, 87, 1829–1838. [Google Scholar] [CrossRef] [PubMed]
- Du, X.; Zeisel, S.H. Spectral Deconvolution for Gas Chromatography Mass Spectrometry-Based Metabolomics: Current Status and Future Perspectives. Comput. Struct. Biotechnol. J. 2013, 4, e201301013. [Google Scholar] [CrossRef]
- Schymanski, E.L.; Singer, H.P.; Slobodnik, J.; Ipolyi, I.M.; Oswald, P.; Krauss, M.; Schulze, T.; Haglund, P.; Letzel, T.; Grosse, S.; et al. Non-Target Screening with High-Resolution Mass Spectrometry: Critical Review Using a Collaborative Trial on Water Analysis. Anal. Bioanal. Chem. 2015, 407, 6237–6255. [Google Scholar] [CrossRef]
- Myers, A.L.; Jobst, K.J.; Mabury, S.A.; Reiner, E.J. Using Mass Defect Plots as a Discovery Tool to Identify Novel Fluoropolymer Thermal Decomposition Products. J. Mass Spectrom. 2014, 49, 291–296. [Google Scholar] [CrossRef]
- Cariou, R.; Omer, E.; Léon, A.; Dervilly-Pinel, G.; Le Bizec, B. Screening Halogenated Environmental Contaminants in Biota Based on Isotopic Pattern and Mass Defect Provided by High Resolution Mass Spectrometry Profiling. Anal. Chim. Acta 2016, 936, 130–138. [Google Scholar] [CrossRef] [PubMed]
- Pena-Abaurrea, M.; Jobst, K.J.; Ruffolo, R.; Shen, L.; McCrindle, R.; Helm, P.A.; Reiner, E.J. Identification of Potential Novel Bioaccumulative and Persistent Chemicals in Sediments from Ontario (Canada) Using Scripting Approaches with GC×GC-TOF MS Analysis. Environ. Sci. Technol. 2014, 48, 9591–9599. [Google Scholar] [CrossRef]
- Loos, M.; Gerber, C.; Corona, F.; Hollender, J.; Singer, H. Accelerated Isotope Fine Structure Calculation Using Pruned Transition Trees. Anal. Chem. 2015, 87, 5738–5744. [Google Scholar] [CrossRef] [PubMed]
- Rebryk, A.; Haglund, P. Non-Targeted Screening Workflows for Gas Chromatography–High-Resolution Mass Spectrometry Analysis and Identification of Biomagnifying Contaminants in Biota Samples. Anal. Bioanal. Chem. 2021, 413, 479–501. [Google Scholar] [CrossRef] [PubMed]
- Fuentes-Ferragud, E.; Miralles, P.; López, A.; Ibáñez, M.; Coscollà, C. Non-Target Screening and Human Risk Assessment for Adult and Child Populations of Semi-Volatile Organic Compounds in Residential Indoor Dust in Spain. Chemosphere 2023, 340, 139879. [Google Scholar] [CrossRef] [PubMed]
- Nielsen, N.J.; Christensen, P.; Poulsen, K.G.; Christensen, J.H. Investigation of Micropollutants in Household Waste Fractions Processed by Anaerobic Digestion: Target Analysis, Suspect- and Non-Target Screening. Environ. Sci. Pollut. Res. 2023, 30, 48491–48507. [Google Scholar] [CrossRef] [PubMed]
- Golpe, M.C.; Ramil, M.; Rodríguez, I. Comprehensive Characterization of Volatile and Semi-Volatile Compounds in e-Liquids for Electronic Cigarette Using Gas Chromatography Accurate Mass Spectrometry. J. Chromatogr. A 2023, 1703, 464114. [Google Scholar] [CrossRef] [PubMed]
- Nabi, D.; Gros, J.; Dimitriou-Christidis, P.; Arey, J.S. Mapping Environmental Partitioning Properties of Nonpolar Complex Mixtures by Use of GC × GC. Environ. Sci. Technol. 2014, 48, 6814–6826. [Google Scholar] [CrossRef]
- Arey, J.S.; Nelson, R.K.; Xu, L.; Reddy, C.M. Using Comprehensive Two-Dimensional Gas Chromatography Retention Indices to Estimate Environmental Partitioning Properties for a Complete Set of Diesel Fuel Hydrocarbons. Anal. Chem. 2005, 77, 7172–7182. [Google Scholar] [CrossRef]
- Seeley, J.V.; Libby, E.M.; Edwards, K.A.H.; Seeley, S.K. Solvation Parameter Model of Comprehensive Two-Dimensional Gas Chromatography Separations. J. Chromatogr. A 2009, 1216, 1650–1657. [Google Scholar] [CrossRef]
- Arey, J.S.; Martin Aparicio, A.; Vaiopoulou, E.; Forbes, S.; Lyon, D. Modeling the GCxGC Elution Patterns of a Hydrocarbon Structure Library To Innovate Environmental Risk Assessments of Petroleum Substances. Environ. Sci. Technol. 2022, 56, 17913–17923. [Google Scholar] [CrossRef] [PubMed]
- Lim, S.; Shi, J.L.; von Gunten, U.; McCurry, D.L. Ozonation of Organic Compounds in Water and Wastewater: A Critical Review. Water Res. 2022, 213, 118053. [Google Scholar] [CrossRef] [PubMed]
- Sanchís, J.; Redondo-Hasselerharm, P.E.; Villanueva, C.M.; Farré, M.J. Non Targeted Screening of Nitrogen Containing Disinfection By-Products in Formation Potential Tests of River Water and Subsequent Monitoring in Tap Water Samples. Chemosphere 2022, 303, 135087. [Google Scholar] [CrossRef] [PubMed]
- Lu, Y.; Song, Z.M.; Wang, C.; Liang, J.K.; Hu, Q.; Wu, Q.Y. Combining High Resolution Mass Spectrometry with a Halogen Extraction Code to Characterize and Identify Brominated Disinfection Byproducts Formed during Ozonation. Sci. Total Environ. 2021, 796, 149016. [Google Scholar] [CrossRef] [PubMed]
- Lu, Y.; Song, Z.M.; Wang, C.; Liang, J.K.; Xu, N.; Hu, Q.; Wu, Q.Y. Combination of High Resolution Mass Spectrometry and a Halogen Extraction Code to Identify Chlorinated Disinfection Byproducts Formed from Aromatic Amino Acids. Water Res. 2021, 190, 116710. [Google Scholar] [CrossRef] [PubMed]
- Ehalt MacEdo, H.; Lehner, B.; Nicell, J.; Grill, G.; Li, J.; Limtong, A.; Shakya, R. Distribution and Characteristics of Wastewater Treatment Plants within the Global River Network. Earth Syst. Sci. Data 2022, 14, 559–577. [Google Scholar] [CrossRef]
- Pourchet, M.; Debrauwer, L.; Klanova, J.; Price, E.J.; Covaci, A.; Caballero-Casero, N.; Oberacher, H.; Lamoree, M.; Damont, A.; Fenaille, F.; et al. Suspect and Non-Targeted Screening of Chemicals of Emerging Concern for Human Biomonitoring, Environmental Health Studies and Support to Risk Assessment: From Promises to Challenges and Harmonisation Issues. Environ. Int. 2020, 139, 105545. [Google Scholar] [CrossRef] [PubMed]
- Nendza, M.; Kühne, R.; Lombardo, A.; Strempel, S.; Schüürmann, G. PBT Assessment under REACH: Screening for Low Aquatic Bioaccumulation with QSAR Classifications Based on Physicochemical Properties to Replace BCF in Vivo Testing on Fish. Sci. Total Environ. 2018, 616–617, 97–106. [Google Scholar] [CrossRef] [PubMed]
- Pandian, A.M.K.; Rajamehala, M.; Singh, M.V.P.; Sarojini, G.; Rajamohan, N. Potential Risks and Approaches to Reduce the Toxicity of Disinfection By-Product—A Review. Sci. Total Environ. 2022, 822, 153323. [Google Scholar] [CrossRef]
- Dong, S.; Masalha, N.; Plewa, M.J.; Nguyen, T.H. Toxicity of Wastewater with Elevated Bromide and Iodide after Chlorination, Chloramination, or Ozonation Disinfection. Environ. Sci. Technol. 2017, 51, 9297–9304. [Google Scholar] [CrossRef]
- Ding, X.; Zhu, J.; Zhang, J.; Dong, T.; Xia, Y.; Jiao, J.; Wang, X.; Zhou, W. Developmental Toxicity of Disinfection By-Product Monohaloacetamides in Embryo-Larval Stage of Zebrafish. Ecotoxicol. Environ. Saf. 2020, 189, 110037. [Google Scholar] [CrossRef] [PubMed]
- Richardson, S.D.; Plewa, M.J.; Wagner, E.D.; Schoeny, R.; DeMarini, D.M. Occurrence, Genotoxicity, and Carcinogenicity of Regulated and Emerging Disinfection by-Products in Drinking Water: A Review and Roadmap for Research. Mutat. Res.—Rev. Mutat. Res. 2007, 636, 178–242. [Google Scholar] [CrossRef] [PubMed]
- Muellner, M.G.; Wagner, E.D.; Mccalla, K.; Richardson, S.D.; Woo, Y.T.; Plewa, M.J. Haloacetonitriles vs. Regulated Haloacetic Acids: Are Nitrogen-Containing DBFs More Toxic? Environ. Sci. Technol. 2007, 41, 645–651. [Google Scholar] [CrossRef] [PubMed]
- Dong, F.; Chen, J.; Li, C.; Ma, X.; Jiang, J.; Lin, Q.; Lin, C.; Diao, H. Evidence-Based Analysis on the Toxicity of Disinfection Byproducts in Vivo and in Vitro for Disinfection Selection. Water Res. 2019, 165, 114976. [Google Scholar] [CrossRef] [PubMed]
- Yu, S.; Lin, T.; Chen, W.; Tao, H. The Toxicity of a New Disinfection By-Product, 2,2-Dichloroacetamide (DCAcAm), on Adult Zebrafish (Danio Rerio) and Its Occurrence in the Chlorinated Drinking Water. Chemosphere 2015, 139, 40–46. [Google Scholar] [CrossRef] [PubMed]
- Williams, A.J.; Grulke, C.M.; Edwards, J.; McEachran, A.D.; Mansouri, K.; Baker, N.C.; Patlewicz, G.; Shah, I.; Wambaugh, J.F.; Judson, R.S.; et al. The CompTox Chemistry Dashboard: A Community Data Resource for Environmental Chemistry. J. Cheminform. 2017, 9, 61. [Google Scholar] [CrossRef] [PubMed]
- Allan, I.J.; Garmo, Ø.A.; Rundberget, J.T.; Terentjev, P.; Christensen, G.; Kashulin, N.A. Detection of Tris(2,3-Dibromopropyl) Phosphate and Other Organophosphorous Compounds in Arctic Rivers. Environ. Sci. Pollut. Res. 2018, 25, 28730–28737. [Google Scholar] [CrossRef]
- Smedes, F.; Geertsma, R.W.; Van Der Zande, T.; Booij, K. Polymer-Water Partition Coefficients of Hydrophobic Compounds for Passive Sampling: Application of Cosolvent Models for Validation. Environ. Sci. Technol. 2009, 43, 7047–7054. [Google Scholar] [CrossRef]
- Reichenbach, S.E.; Ni, M.; Kottapalli, V.; Visvanathan, A. Information Technologies for Comprehensive Two-Dimensional Gas Chromatography. Chemom. Intell. Lab. Syst. 2004, 71, 107–120. [Google Scholar] [CrossRef]
- Loos, M.; Singer, H.; Gerber, C. EnviPat Web Interface. Available online: https://www.envipat.eawag.ch/index.php (accessed on 15 November 2023).
- Wallace, W.E. NIST Chemistry WebBook, SRD 69, Retention Indices by NIST Mass Spectrometry Data Center. Available online: https://webbook.nist.gov/chemistry (accessed on 1 November 2023).
- Seeley, J.V.; Seeley, S.K. Model for Predicting Comprehensive Two-Dimensional Gas Chromatography Retention Times. J. Chromatogr. A 2007, 1172, 72–83. [Google Scholar] [CrossRef]
- Ulrich, N.; Endo, S.; Brown, T.N.; Watanabe, N.; Bronner, G.; Abraham, M.H.; Goss, K.-U. UFZ-LSER Database v 3.2.1. Available online: http://www.ufz.de/lserd (accessed on 11 November 2023).
- Dryden, I.L.; Mardia, K.V. Statistical Shape Analysis, with Applications in R, 2nd ed.; John Wiley & Sons: Hoboken, NJ, USA, 2016; ISBN 9781119072492. [Google Scholar]
- Osman, O.; Ahmad, F.; Aina, O.D. Chemical Fingerprinting of Saline Water Intrusion into Sewage Lines. Water Sci. Technol. 2017, 76, 2044–2050. [Google Scholar] [CrossRef] [PubMed]
- Chowdhury, S. Effects of Seawater Intrusion on the Formation of Disinfection Byproducts in Drinking Water. Sci. Total Environ. 2022, 827, 154398. [Google Scholar] [CrossRef] [PubMed]
- Ged, E.C.; Boyer, T.H. Effect of Seawater Intrusion on Formation of Bromine-Containing Trihalomethanes and Haloacetic Acids during Chlorination. Desalination 2014, 345, 85–93. [Google Scholar] [CrossRef]
- EPA. U.S. Estimation Programs Interface SuiteTM for Microsoft®® Windows; United States Environmental Protection Agency: Washington, DC, USA, 2015.
- ECHA. Guidance on Information Requirements and Chemical Safety Assessment—Chapter R.11: PBT/VPvB Assessment; European Chemicals Agency: Helsinki, Finland, 2017.
- US EPA CompTox Chemicals Dashboard. Available online: https://comptox.epa.gov/dashboard (accessed on 1 May 2023).


| Number ID | Retention I (min) | Retention II (s) | Compound Name | Library CAS # | Match Factor | Reverse Match Factor | Layers |
|---|---|---|---|---|---|---|---|
| 1 | 19.73 | 2.12 | Benzenamine, 2,4-dichloro- | 554-00-7 | 933 | 941 | 1 |
| 2 | 18.65 | 2.17 | Benzonitrile, 2,6-dichloro- | 1194-65-6 | 921 | 928 | 1 |
| 3 | 25.26 | 2.73 | Benzenamine, 2,3,4-trichloro- | 634-67-3 | 905 | 909 | 1 |
| 4 | 11.93 | 1.5 | Acetaldehyde, tribromo- | 115-17-3 | 893 | 898 | 1 |
| 5 | 21.9 | 2.37 | 2-Bromo-4-chloroaniline | 873-38-1 | 893 | 911 | 1 |
| 6 a | 13.45 | 0.41 | Bromodichloroacetaldehyde | 34619-29-9 | 888 | 900 | 1 |
| 7 | 17.89 | 1.75 | Benzaldehyde, 2,4-dichloro- | 874-42-0 | 872 | 926 | 1 |
| 8 | 22.55 | 2.58 | 1H-Pyrazole, 3,4-dibromo- | 5932-18-3 | 869 | 908 | 1 |
| 9 a | 11.72 | 1.34 | Acetic acid, dibromo-, methyl ester | 6482-26-4 | 869 | 904 | 1 |
| 10 | 23.85 | 2.17 | 4-Bromo-2,6-dichloroaniline | 697-86-9 | 859 | 901 | 1 |
| 11 a | 26.67 | 3.35 | Benzene, 1,1’-(bromomethylene)bis- | 776-74-9 | 854 | 932 | 1 |
| 12 | 10.2 | 0.98 | Chlorodibromoacetaldehyde | 64316-11-6 | 851 | 909 | 1 |
| 13 | 10.31 | 0.52 | Hexane, 2-bromo- | 3377-86-4 | 841 | 883 | 2 |
| 14 | 16.48 | 1.65 | Phenol, 4-chloro- | 106-48-9 | 836 | 905 | 1 |
| 15 a | 26.88 | 2.53 | Phenol, 2,4,6-tribromo- | 118-79-6 | 834 | 930 | 2 |
| 16 a | 10.85 | 1.19 | 2-Propanone, 1,1,3-trichloro- | 921-03-9 | 832 | 864 | 1 |
| 17 | 40.75 | 3.92 | Acridine, 4,5-dibromo- | 209460-03-7 | 830 | 872 | 1 |
| 18 | 21.36 | 2.73 | 1,1,3,3-Tetrabromoacetone | 22612-89-1 | 821 | 862 | 1 |
| 19 | 16.37 | 1.96 | Tribromoacetic acid, methyl ester | 3222-05-7 | 821 | 898 | 1 |
| 20 a | 22.33 | 1.5 | 2,4,6-Trichlorophenyl isocyanate | 2505-31-9 | 818 | 911 | 2 |
| 21 | 26.12 | 2.48 | 2,6-Dibromo-4-chloroaniline | 874-17-9 | 810 | 864 | 1 |
| 22 a | 21.68 | 1.86 | Benzenamine, 2,4,5-trichloro- | 636-30-6 | 810 | 854 | 1 |
| ID | Compound Name | CAS | Molecular Ion in Reference Data | Cosine Similarity on Isotopic Patterns | Theoretical Monoisotopic Mass (Da) | Measured Possible Monoisotopic Mass (Da) | Mass Error (ppm) | dI b |
|---|---|---|---|---|---|---|---|---|
| 1 | Benzenamine, 2,4-dichloro- | 554-00-7 | appeared | 0.998 | 160.9799 | 160.9691 | 67.1 | 7 |
| 2 | Benzonitrile, 2,6-dichloro- | 1194-65-6 | appeared | 0.998 | 170.9643 | 170.9521 | 71.4 | 9 |
| 3 | Benzenamine, 2,3,4-trichloro- | 634-67-3 | appeared | 0.997 | 194.9409 | 194.9260 | 76.6 | NA |
| 4 | Acetaldehyde, tribromo- | 115-17-3 | not appeared | NA | 277.7578 | NA | NA | NA |
| 5 | 2-Bromo-4-chloroaniline | 873-38-1 | appeared | 0.995 | 204.9294 | 204.9137 | 76.7 | 7 |
| 6 | Bromodichloroacetaldehyde | 34619-29-9 | not appeared | NA | 189.8588 | NA | NA | NA |
| 7 | Benzaldehyde, 2,4-dichloro- | 874-42-0 | appeared | 0.75 a | 173.9639 | 173.9500 | 79.9 | NA |
| 8 | 1H-Pyrazole, 3,4-dibromo- | 5932-18-3 | appeared | 0.999 | 223.8585 | 223.8421 | 73.3 | NA |
| 9 | Acetic acid, dibromo-, methyl ester | 6482-26-4 | appeared | 1 | 229.8578 | 229.8424 | 66.9 | −19 |
| 10 | 4-Bromo-2,6-dichloroaniline | 697-86-9 | appeared | 0.998 | 238.8904 | 238.8728 | 73.9 | NA |
| 11 | Benzene, 1,1′-(bromomethylene)bis- | 776-74-9 | not appeared | NA | 246.0044 | NA | NA | 25 |
| 12 | Chlorodibromoacetaldehyde | 64316-11-6 | not appeared | NA | 233.8083 | NA | NA | NA |
| 13 | Hexane, 2-bromo- | 3377-86-4 | faint peak | NA | 164.0201 | NA | NA | −122 |
| 14 | Phenol, 4-chloro- | 106-48-9 | appeared | 0.999 | 128.0029 | 127.9937 | 72.2 | −30 |
| 15 a | Phenol, 2,4,6-tribromo- | 118-79-6 | appeared | 1 | 327.7734 | 327.7469 | 80.8 | 67 |
| 16 a | 2-Propanone, 1,1,3-trichloro- | 921-03-9 | faint peak | 0.995 | 159.9249 | 159.9128 | 75.8 | 2 |
| 17 | Acridine, 4,5-dibromo- | 209460-03-7 | appeared | 0.999 | 334.8945 | 334.8681 | 78.8 | NA |
| 18 | 1,1,3,3-Tetrabromoacetone | 22612-89-1 | faint peak | 0.402 | 369.6839 | 369.6469 | 100.2 | NA |
| 19 | Tribromoacetic acid, methyl ester | 3222-05-7 | faint peak | 0.519 | 307.7683 | 307.7469 | 69.6 | 14 |
| 20 a | 2,4,6-Trichlorophenyl isocyanate | 2505-31-9 | appeared | 0.998 | 220.9202 | 220.9028 | 78.6 | NA |
| 21 | 2,6-Dibromo-4-chloroaniline | 874-17-9 | appeared | 1 | 282.8399 | 282.8178 | 78.2 | NA |
| 22 a | Benzenamine, 2,4,5-trichloro- | 636-30-6 | appeared | 0.994 | 194.9409 | 194.9271 | 70.7 | −34 |
Disclaimer/Publisher’s Note: The statements, opinions and data contained in all publications are solely those of the individual author(s) and contributor(s) and not of MDPI and/or the editor(s). MDPI and/or the editor(s) disclaim responsibility for any injury to people or property resulting from any ideas, methods, instructions or products referred to in the content. |
© 2024 by the authors. Licensee MDPI, Basel, Switzerland. This article is an open access article distributed under the terms and conditions of the Creative Commons Attribution (CC BY) license (https://creativecommons.org/licenses/by/4.0/).
Share and Cite
Siddiqui, M.U.; Sibtain, M.; Ahmad, F.; Zushi, Y.; Nabi, D. Screening Disinfection Byproducts in Arid-Coastal Wastewater: A Workflow Using GC×GC-TOFMS, Passive Sampling, and NMF Deconvolution Algorithm. J. Xenobiot. 2024, 14, 554-574. https://doi.org/10.3390/jox14020033
Siddiqui MU, Sibtain M, Ahmad F, Zushi Y, Nabi D. Screening Disinfection Byproducts in Arid-Coastal Wastewater: A Workflow Using GC×GC-TOFMS, Passive Sampling, and NMF Deconvolution Algorithm. Journal of Xenobiotics. 2024; 14(2):554-574. https://doi.org/10.3390/jox14020033
Chicago/Turabian StyleSiddiqui, Muhammad Usman, Muhammad Sibtain, Farrukh Ahmad, Yasuyuki Zushi, and Deedar Nabi. 2024. "Screening Disinfection Byproducts in Arid-Coastal Wastewater: A Workflow Using GC×GC-TOFMS, Passive Sampling, and NMF Deconvolution Algorithm" Journal of Xenobiotics 14, no. 2: 554-574. https://doi.org/10.3390/jox14020033