Article

A Parallax Shift Effect Correction Based on Cloud Top Height for FY-4A Lightning Mapping Imager (LMI)

1
School of Remote Sensing and Geomatics Engineering, Nanjing University of Information Science and Technology, Nanjing 210044, China
2
Key Laboratory of Middle Atmosphere and Global Environment Observation, Institute of Atmospheric Physics, Chinese Academy of Sciences, Beijing 100029, China
3
National Satellite Meteorological Center, Chinese Meteorological Administration, Beijing 100081, China
4
Institute of Urban Meteorology, China Meteorological Administration, Beijing 100089, China
5
Key Laboratory of Humid Subtropical Eco-Geographical Process (Ministry of Education), College of Geographical Sciences, Fujian Normal University, Fuzhou 350007, China
6
College of Earth and Planetary Science, University of Chinese Academy of Sciences, Beijing 100049, China
7
The Academy of Digital China, Fuzhou University, Fuzhou 350108, China
8
Beijing Institute of Space Mechanics and Electricity, Beijing 100094, China
*
Author to whom correspondence should be addressed.
Remote Sens. 2023, 15(19), 4856; https://doi.org/10.3390/rs15194856
Submission received: 25 August 2023 / Revised: 4 October 2023 / Accepted: 5 October 2023 / Published: 7 October 2023

Abstract

:
The Lightning Mapping Imager (LMI) onboard the Fengyun-4A (FY-4A) satellite is the first independently developed satellite-borne lightning imager in China. It enables continuous lightning detection in China and surrounding areas, regardless of weather conditions. The FY-4A LMI uses a Charge-Coupled Device (CCD) array for lightning detection, and the accuracy of lightning positioning is influenced by cloud top height (CTH). In this study, we proposed an ellipsoid CTH parallax correction (ECPC) model for lightning positioning applicable to FY-4A LMI. The model utilizes CTH data from the Advanced Geosynchronous Radiation Imager (AGRI) on FY-4A to correct the lightning positioning data. According to the model, when the CTH is 12 km, the maximum deviation in lightning positioning caused by CTH in Beijing is approximately 0.1177° in the east–west direction and 0.0530° in the north–south direction, corresponding to a horizontal deviation of 13.1558 km, which exceeds the size of a single ground detection unit of the geostationary satellite lightning imager. Therefore, it is necessary to be corrected. A comparison with data from the Beijing Broadband Lightning Network (BLNET) and radar data shows that the corrected LMI data exhibit spatial distribution that is closer to the simultaneous BLNET lightning positioning data. The coordinate differences between the two datasets are significantly reduced, indicating higher consistency with radar data. The correction algorithm decreases the LMI lightning location deviation caused by CTH, thereby improving the accuracy and reliability of satellite lightning positioning data. The proposed ECPC model can be used for the real-time correction of lightning data when CTH is obtained at the same time, and it can be also used for the post-correction of space-based lightning detection with other cloud top height data.

Graphical Abstract

1. Introduction

Lightning is a dangerous and destructive atmospheric phenomenon commonly observed during severe convective activities [1]. Lightning location can be primarily divided into space-based and ground-based detection. Space-based lightning imagers enable wide-area real-time continuous observations, while ground-based lightning location networks provide real-time continuous high-precision detection within specific regions [2,3]. Currently, there are two lightning imagers operating on geostationary orbit satellites. The Geostationary Operational Environmental Satellite R-series (GOES-R) from the United States carries the Geostationary Lightning Mapper (GLM), the first GOES-R-series satellite launched on 19 November 2016 [4]. China’s new generation of geostationary meteorological satellites is the Fengyun-4A series equipped with the Lightning Mapping Imager (LMI). The first FY-4-series satellite launched on 11 December 2016 [5,6,7].
The lightning imaging payload onboard geostationary satellites employ Charge-Coupled Device (CCD) arrays for lightning detection through capturing radiance that penetrates through the cloud tops. The lightning occurrence location is calculated based on the projection relationship using CCD array detection data. However, the coordinates obtained represent the intersection point of the extension line connecting the illuminated cloud-top region and the instrument’s detection unit with the Earth’s surface, rather than the actual location where the lightning occurred. Consequently, cloud top height (CTH) affects the lightning localization results of the imaging instrument. CTH can introduce parallax displacement issues during the calculation and integration of data, resulting in the calculated detection point not corresponding to the actual lightning occurrence location [8,9]. Furthermore, due to the curved surface of the Earth, the detection range of each CCD unit gradually increases from the nadir point to the edge of the instrument’s field of view. As a result, detection efficiency decreases, and deviation become more noticeable in the peripheral regions of the detection range [10,11,12,13].
To address the issue of parallax displacement caused by CTH in satellite observations, Greuell and Roebeling [14], among others, have attempted to use a simplified model assuming local flatness of the Earth’s surface for CTH correction. However, this model is not suitable for satellite observations with a large observational range. Li et al. [15] have attempted to address this issue using a spherical model. Vicente et al. [16] proposed a theoretical model for CTH correction based on the geometric characteristics of parallax displacement, where the semi-axis of an ellipsoid increases with CTH [17]. In their subsequent years of research, they have proposed additional expansion models based on satellites with different spatial resolutions. Hideaki et al. (2020) used the phase-only correlation (POC) method and two-dimensional fast Fourier transform for the accurate correction of HIMAWARI-8 data [18]. However, none of the aforementioned models are directly applicable to FY-4A LMI. Chen et al. (2012) conducted theoretical research based on the Earth ellipsoid model and the characteristics of geostationary satellites [19]. However, they did not conduct a comparative study with actual lightning detection data, and the applicability of their model remains questionable. Currently, there is no well-established model for CTH parallax correction using FY-4A LMI location data. Furthermore, the CTH parallax correction method proposed by the aforementioned researchers is not directly applicable to FY-4A geostationary satellites in China. In this study, an ellipsoid CTH parallax correction (ECPC) model specifically designed for FY-4A LMI was developed using CTH data from FY-4A AGRI. This model was utilized to correct the lightning positioning data, and the accuracy of the correction was evaluated through comparing it with ground-based Beijing Broadband Lightning Network (BLNET) observations and radar data.

2. Data and Methodology

2.1. The FY-4A LMI Data

The LMI on FY-4A is China’s first satellite-based lightning detector capable of detecting both cloud-to-ground and intra-cloud lightning. It utilizes a 400 × 300 × 2 CCD array plane, operating at a wavelength of 777.4 nm, with a frame rate of 2 ms. The field of view of LMI covers China and its adjacent sea areas, with a spatial resolution of 7.8 km at the nadir [20,21,22]. Through the utilization of a Real-time Event Processor (RTEP), LMI dynamically calculates the average optical brightness of the background. This calculated value serves as the threshold for background identification. Consequently, pixels in each frame that surpass the background threshold are extracted and defined as “event” data. Meanwhile, concurrently adjacent event data within the same frame are grouped together to form “group” data. These group data are then subjected to a clustering analysis algorithm, specifically designed to classify and cluster the data into the category of “flash” data [4,23].
This study utilized the LMI Level-2 products provided by the National Satellite Meteorological Center of the China Meteorological Administration, including event, group, and flash data (http://satellite.nsmc.org.cn/PortalSite/Data/Satellite.aspx, accessed on 4 August 2019). The dataset encompasses information such as occurrence time, radiant energy, and geographic coordinates. The primary approach of this research involved the application of an ECPC model to rectify the latitude and longitude of the data. Subsequently, a spatiotemporal threshold based on clustering algorithm was employed to match the corrected data with ground-based data, facilitating the evaluation of correction accuracy.

2.2. The FY-4A Advanced Geosynchronous Radiation Imager (AGRI) Data

When lightning occurs within a cloud, it is challenging to determine its three-dimensional position accurately through two-dimensional CCD plane detection. According to the simulation study conducted by Chen et al. (2012) [19], when the lightning source is located at the center of the cloud, photons also concentrate at the center of the cloud top. Considering the occurrence of lightning, the latitude and longitude of the cloud top area can represent the latitude and longitude of the lightning within the cloud. Therefore, in this study, CTH data are employed as the CTH parameter for model calibration.
The AGRI is another payload carried onboard the Fengyun-4A satellite, which has notable advancements compared to its predecessor, the Fengyun-2-series geostationary satellite. The number of channels has been increased from 5 to 14 in the AGRI. The infrared channel calibration precision has been enhanced from 1 K to a range of 0.1 to 0.5 K. The spatial resolution of the visible channel has been improved from 1.25 km to a range of 0.5 to 1 km. Moreover, the spatial resolution of the infrared channels has been elevated from 5 km to 2 km for the near-infrared channel and 4 km for other infrared channels. As a result, the AGRI can provide comprehensive atmospheric and land surface parameter information [24,25,26].
The ECPC model developed in this study utilizes real-time CTH data from the AGRI, with a spatial resolution of 4 km (http://satellite.nsmc.org.cn/PortalSite/Data/Satellite.aspx, accessed on 4 August 2019). This data source offers CTH information at intervals of at least every 15 min. The performance of this data is comparable to the CTH product generated by the Himawari-8 satellite [27].

2.3. Ground-Based Total Lightning Data of BLNET

To assess the effectiveness of LMI products, it is imperative to have accurate and dependable ground-based lightning location data. In this study, we rely on data from the Beijing Lightning Network (BLNET) as a reference point to refine LMI data. The BLNET encompasses a network of 16 stations strategically positioned throughout the Beijing area. These stations are equipped with both fast and slow electric field change measurement instruments, commonly known as fast and slow antennas. Additionally, they are equipped with Very-High-Frequency (VHF) radiometers designed for detecting lightning radiation [28,29]. This comprehensive instrumentation enables the observation of lightning at multiple frequencies. The inherent horizontal positioning deviation within the detection network is minimal, measuring less than 200 m. Even at a distance of 100 km from the network, the horizontal positioning deviation remains below 3 km [30]. The BLNET dataset thus provides a robust and reliable foundation for enhancing the accuracy of LMI data in this study [1,3]. Within the framework of the BLNET, instances of detected radiation events originating from nearby sources, spaced up to 15 km apart in space and occurring within 400 milliseconds of each other, are classified as components of a single lightning discharge event (BLNET flash). This categorization methodology has been supported by previous works [31,32,33].

2.4. Radar Data

The radar echo data can partially reflect the intensity of weather activities. The radar data utilized in this study are obtained from the S-band Doppler weather radar at the Beijing Meteorological Observatory. Remarkably, the radar has an effective detection radius of 230 km. Operating on a volume scan cycle of 6 min, the radar system employs a polar coordinate format. This format encompasses a radial resolution of 1 km and an azimuthal resolution of 1°, which facilitates the storage of raw data. To process the data, the radar data in the polar coordinate format are converted into a three-dimensional gridded dataset, with a resolution of 0.01° in longitude, 0.01° in latitude, and 1 km in altitude. The transformation is achieved through bilinear interpolation [34].

2.5. The Impact of CTH on Lightning Localization Data

The FY-4A LMI utilizes a CCD array to detect lightning, which involves transforming data from a two-dimensional plane to a three-dimensional curved surface. The process of pixel localization involves combining the radiative data of the pixel with the background information. The localized radiance is determined based on the intersection point between the extension of the line connecting the illuminated cloud-top region (denoted as ‘Thc’ in Figure 1) and the sensing unit of the instrument with the Earth’s surface. It is important to note that this does not pinpoint the exact location of lightning occurrence but rather establishes a correspondence between the localized radiance and the Earth’s surface. As shown in Figure 1, ‘Thc’ represents the illuminated cloud-top region. The actual geographical coordinates of where lightning occurs should align with the latitude and longitude of point ‘T’. This point, marked as ‘T’, signifies the intersection of the vector pointing from ‘Thc’ to the center of the Earth and the Earth’s surface. However, due to the localization algorithm’s outcomes, the resulting latitude and longitude correspond to point ‘T’. This situation links the accuracy of lightning localization to the altitude of the CTH (‘hc’). Furthermore, it is important to highlight that being closer to the edge of the observation range leads to increased deviations in localization. This proximity to the observation range’s periphery contributes to a higher likelihood of localization deviations.

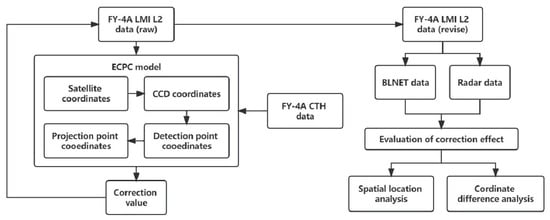
2.6. Construction of ECPC Model

Figure 2 illustrates the computational workflow of the ECPC model for lightning localization. The model operates under the premise of a stationary satellite platform. It commences via incorporating essential parameters, including the sub-satellite point’s geographical coordinates, to calculate the satellite’s coordinates within the geocentric coordinate system. Subsequent to this, a coordinate transformation is employed to derive the satellite’s coordinates within the spatial Cartesian coordinate system. The third phase involves the computation of satellite coordinates for each CCD unit of the lightning imager. Sequentially, leveraging perturbation vectors such as the satellite’s three-axis deviation angles and instrument inclinations, the coordinates of individual projection points on the CCD focal plane are determined. Ultimately, through the introduction of CTH parameters, leading to alterations in the Earth ellipsoid equation, a system of equations is simultaneously solved. This solution yields the correspondence between the CCD focal plane detection unit of the lightning imager and the geographical latitude and longitude of Earth pixels. Consequently, this approach facilitates the derivation of correction values for each detection point, catering to specific CTH conditions.
Taking inspiration from the algorithms proposed by Lu [35] for the Fengyun series of satellites, we have developed a new calculation process. Firstly, distinct coordinate systems are defined to facilitate computations: the geocentric coordinate system, the satellite coordinate system, and the spatial Cartesian coordinate system. The geocentric system is established with the Earth’s center, denoted as S 0 , as the origin. The X-axis is directed towards the intersection of the prime meridian and the equator, forming the foundation of the geocentric coordinate system. The satellite is positioned within the equatorial plane, with an altitude of H. The angle between the line connecting the satellite to the Earth’s center and the Y-axis is denoted as γ. As illustrated by the X, Y, and Z axes in Figure 3, CTH (the height of the cloud top) is denoted as h c in order to correct for its impact on lightning localization. Consequently, the adjustment involves adding the CTH h c to the Earth ellipsoid’s semi-major axis and subtracting h c from the altitude of the flight, H, that is, a h c = a + h c and H h c = H h c . Determine the coordinates   S   ( X s , Y s , Z s ) of the instrument in the geocentric coordinate system.
X s = ( a h c + H h c ) × sin ( y 0 ) Y s = ( a h c + H h c ) × cos ( y 0 ) Z s = 0
We have established a satellite coordinate system with the photographic center S as the origin, the X-axis aligned with the satellite’s heading, the Y-axis aligned with the direction of the geocentric coordinate system’s Z-axis, and the Z-axis aligned with the direction of the geocentric coordinate system’s X-axis, as depicted by the X″, Y″, and Z″ axes in Figure 3. The attitude angles of the lightning imager on the satellite are denoted as angle   ( a x , a y , a z ) , with X as the principal axis. The point T on the Earth’s surface is represented as the point T S on the camera’s focal plane. The CCD focal plane array consists of two concatenated arrays, each with dimensions 400 × 300. Therefore, M = 600 and N = 400 . Let the dimension of the detection unit be denoted as L U . If the detection point is in the m-th row and n-th column of the CCD array, the coordinates of detection point T on the camera’s focal plane are represented as point T s . In the satellite coordinate system, they are also denoted as point T s ( x , y , f ) .
x = ( m M 2 + 0.5 ) × L U y = ( n N 2 + 0.5 ) × L U
where f ’ is the focal length of the instrument.
For computational convenience, a spatial Cartesian coordinate system is established with the Earth’s center   S 0   ( X 0 , Y 0 , Z 0 ) as the origin. The X-axis is aligned with the line connecting the Earth’s center and the point where the equator intersects with the meridian at 104.7°E. The Y-axis points in the direction of the satellite’s heading, and the Z-axis points towards the North Pole. This configuration is illustrated by the X′, Y′, and Z′ axes in Figure 3. The coordinates of the instrument S in the geocentric coordinate system, represented by point   S   ( X S , Y S , Z S ) , are transformed into the coordinates   S 1   ( X S 1 , Y S 1 , Z S 1 ) in the spatial Cartesian coordinate system.
[ X S 1 Y S 1 Z S 1 ] = [ cos ( l o n ) sin ( l o n ) 0 sin ( l o n ) cos ( l o n ) 0 0 0 1 ] [ X S Y S Z S ]
In the equation, l o n represents the longitude of the satellite’s location, which is 104.7°.
Through utilizing the spatial Cartesian coordinates of the instrument, attitude angles, flight altitude, and the ratio of focal length, one can determine the geographical coordinates of detection point T E after considering attitude deviations. Taking the sub-satellite point’s position in the spatial Cartesian coordinate system as the point of tangency on the Earth’s surface, we create plane E . Let the intersection of the line connecting point T s on the camera’s focal plane to detection point T with plane E be point T E . Consequently, the coordinates of point T E in the spatial Cartesian coordinate system are denoted as point   T E   ( X E , Y E , Z E ) .
C = [ cos ( a x ) 0 sin ( a x ) 0 1 0 sin ( a x ) 0 cos ( a x ) ] [ 1 0 0 0 cos ( a z ) sin ( a z ) 0 sin ( a z ) cos ( a z ) ] [ cos ( a y ) sin ( a z ) 0 sin ( a z ) cos ( a y ) 0 0 0 1 ]
[ X E Y E Z E ] = C × [ 1 0 0 0 cos ( a E ) sin ( a E ) 0 sin ( a E ) cos ( a E ) ] × H h c f × [ f x y ] + [ X s 1 Y s 1 Z s 1 ]
where in a x , a y , and a z represent the attitude angles of the lightning imager, C denotes the attitude deviation matrix, and a E signifies the elevation angle of the lightning imager.
The pre-deviation detection points are depicted in the red portion of Figure 4, while the distribution of points obtained after deviation is illustrated in the blue portion of Figure 4. The red section displays the distribution of points prior to undergoing attitude deviation. The circle on the right side of Figure 4 represents the spatial position of the satellite.
Through utilizing the satellite coordinate   S 1   ( X S 1 , Y S 1 , Z S 1 ) and the projection coordinate   T E   ( X E , Y E , Z E ) of the detection point, the coordinates of detection point T in the spatial Cartesian coordinate system can be determined and represented as point   T 1   ( X S 2 , Y S 2 , Z S 2 ) .
{ Y S 2 = Y S Y E X S X E X S 2 + Y E X E Y S Y E X S X E = k Y X X S 2 + b Y X Z S 2 = Z S Z E X S X E X S 2 + Z E X E Z S Z E X S X E = k Z X X S 2 + b Z X ( X S 2 X 0 ) 2 a h c 2 + ( Y S 2 Y 0 ) 2 a h c 2 + ( Z S 2 Z 0 ) 2 b h c 2 = 1
The resulting simultaneous equations are as follows:
{ A = a h c 2 b h c 2 + a h c 2 b h c 2 k Y X 2 + a h c 4 k Z X 2 B = 2 a h c 2 b h c 2 X 0 + 2 a h c 2 b h c 2 k Y X ( b Y X Y 0 ) + 2 a h c 4 k Z X ( b Z X Z 0 ) C = a h c 2 b h c 2 X 0 2 + a h c 2 b h c 2 ( b Y X Y 0 ) 2 + a h c 4 ( b Z X Z 0 ) 2 a h c 4 b h c 2 A X S 2 2 + B X S 2 2 + C = 0
The distribution of the obtained detection points is illustrated in the green portion of Figure 4.
Converting the obtained detection point’s spatial Cartesian coordinates   T 1   ( X S 2 , Y S 2 , Z S 2 ) from the satellite coordinate system to the geocentric coordinate system yields coordinates denoted as point T ( X , Y , Z ) .
[ X Y Z ] = [ cos ( l o n ) sin ( l o n ) 0 sin ( l o n ) cos ( l o n ) 0 0 0 1 ] 1 [ X S 2 Y S 2 Z S 2 ]
Converting the obtained detection point’s geocentric coordinates T ( X , Y , Z ) to geographic coordinates in the geodetic coordinate system proceeds as follows:
{ e 2 = a h c 2 b h c 2 a h c 2 θ = arctan ( Z S 2 a h c X S 2 2 + Y S 2 2 b h c )
{ L = arctan ( Y S 2 X S 2 ) B = arctan ( Z S 2 + e 2 b h c sin 3 θ X S 2 2 + Y S 2 2 e 2 a h c cos 3 θ ) N = a h c 1 e 2 sin 2 B H = X S 2 2 + Y S 2 2 cos B N
The provided coordinates for detection point T , which include the CTH parameter h c , can be utilized to derive the corrected coordinates. Through removing the CTH parameter h c and employing the original Earth ellipsoid parameters, the uncorrected coordinates can be computed. This process allows for the determination of the longitude and latitude differences for each detection point before and after correction.

3. Results

The analysis involves a comparative study between satellite observations from the FY-4A LMI and ground-based observations from the BLNET for the summer of 2019. The objective is to select suitable sample data for the experiment. A fixed CTH of 12 km is set to calculate the longitudinal and latitudinal deviations produced by the LMI during lightning localization. The distribution characteristics of positioning deviations are analyzed with respect to variations in CTH. The actual detected CTH (FY-4A CTH) is employed as a parameter to correct the LMI lightning localization data. The lightning localization results before and after CTH correction are thoroughly analyzed. Finally, leveraging radar echo data and BLNET records, the effectiveness of the ECPC model in lightning localization is assessed from both spatial positioning and coordinate discrepancy perspectives.

3.1. Comparison of Lightning Localization Data between FY-4A LMI and BLNET

The study area is selected within the effective coverage range of the BLNET (115.5°E~117.5°E, 39.5°N~41°N), as depicted in Figure 5. The figure illustrates the detection count of FY-4A LMI events and BLNET radiation events during the summer of 2019. On the dates included in the statistics, the LMI detected a total of 12,660 events, while the BLNET detected a total of 107,294 radiation events. The overall detection efficiency of the LMI is 11.799% of the BLNET.
It is important to note that Figure 5 provides a rough indication of the relative detection efficiency between the LMI and the BLNET. However, it should be recognized that the BLNET’s detection efficiency is not 100%. Moreover, the nature of the BLNET being a local network introduces limitations in detecting lightning at the network edges and beyond. LMI primarily detects radiance that penetrates to the cloud top. Compared to cloud-to-ground lightning, the LMI exhibits higher detection efficiency for cloud-to-cloud lightning. Lightning occurring within deep convective clouds, even if it is intense, may not generate radiance that reaches the cloud top for the LMI to capture. Conversely, lightning close to the cloud top, even if relatively weak, has the potential to be detected by the LMI as long as it surpasses the background threshold. The factors influencing the LMI’s detection efficiency are multifaceted. Furthermore, it is worth noting that the background threshold is higher during daytime, making it more challenging for lightning of the same intensity to be detected compared to nighttime conditions. Additionally, the LMI’s detection performance can differ at different stages of severe weather, whereas the BLNET maintains a relatively stable detection efficiency. These factors contribute to the LMI’s lower detection efficiency in comparison to the BLNET.
Due to the different detection performances of the LMI at various stages of severe convective weather [20], the evaluation of the model’s correction effect requires a complete episode of severe convective weather and a large amount of data to comprehensively reflect the numerical performance of LMI data before and after correction in statistical experiments. In this study, lightning detection data from the entire summer of 2019 were screened, and ultimately, lightning observation data during a severe convective weather system on 4 August 2019 (when the LMI detected the highest number) were used as the research subject. Table 1 provides a quantitative overview of the lightning detection counts obtained by the LMI and BLNET within the observed region.

3.2. Simulation of Correction with the Proposed EXPC Model under 12 km CTH Scenerio

Through utilizing the ECPC model, the influence of different cloud-top heights on lightning localization can be computed, given the parameters of the FY-4A satellite and the LMI instrument. Table 2 presents the parameters and their corresponding values used in the model calculations.
In regions with mid-latitude climates, cumulonimbus clouds typically have an average CTH of around 12 km [34,36]. Consider the case of lightning detection using the FY-4A LMI with the parameters outlined in Table 2. The CTH correction values for all lightning positions are projected onto the ground area covered by the satellite’s detection capability. This approach yields longitudinal and latitudinal CTH correction deviations for lightning positioning (Figure 6 and Figure 7).
At a CTH of 12 km, the most pronounced CTH deviation occurs in the northeast and northwest corners of the imager’s field of view. After implementing the CTH correction, the most substantial longitudinal deviation to the east is 0.7413°, whereas the maximum longitudinal deviation to the west is 1.1731°. Similarly, the minimum latitudinal deviation to the north is 0.0352°, and the maximum latitudinal deviation to the north is 0.3801°.
In the Beijing region, the longitudinal deviation necessitates a westward correction of 0.05°, roughly halfway between two adjacent detection points. Correspondingly, the latitudinal deviation calls for a southward correction of 0.11°, which is approximately equivalent to the distance between two vertically neighboring detection points. Furthermore, Figure 6 reveals a gradual increase in latitudinal deviation from south to north due to the widening observation angle.
The results displayed in Figure 7 highlight a slight inclination in the distribution of the detection points’ longitudinal deviations, attributed to the three-axis attitude deviation of the FY-4A geostationary satellite. The distribution is symmetric concerning 104.7°E, progressively expanding towards the northeast and northwest directions.
Figure 8 provides a statistical analysis of the longitudinal and latitudinal deviations of edge pixels at various CTHs ranging from 0 to 20 km. Notably, both longitude and latitude correction values exhibit a positive correlation with CTH. As CTH increases, deviations in edge pixel positions within the image become more prominent, occasionally exceeding the single CCD unit’s detection range. Consequently, when employing a geostationary satellite lightning imager for lightning position detection, CTH correction is indispensable to ensure precise positioning accuracy.
Due to the LMI’s observations of China and its surrounding regions during the period from April to September (Northern Hemisphere summer), and its shift to observations of Western Australia and its surrounding areas during January to March and October to December (Southern Hemisphere summer), Table 3 shows provides a reference for the longitude and latitude correction values for selected big cities in these two countries. It is important to note that for China, negative longitude correction values indicate westward correction, while negative latitude correction values indicate southward correction. For Australia, negative longitude correction values indicate westward correction, while negative latitude correction values indicate northward correction. Additionally, the table only represents correction values for the listed latitude and longitude positions at the specified CTH. For areas located on the edges of provinces or at a significant distance from the listed latitude and longitude positions, corrections should also be considered in conjunction with Figure 7 and Figure 8.

3.3. Correction of CTH Detection for FY-4A LMI

Figure 9 illustrates the CTH data distribution obtained from the FY-4A satellite matched with LMI event, group, flash, and BLNET flash during the severe convective weather systems on 4 August 2019.
From the graph, it can be observed that the CTH distribution of LMI and BLNET data during severe convective weather systems generally aligns with the characteristics of cumulonimbus CTHs. The overall distribution of CTH for event, group, and flash data exhibits a similar trend. Group and flash data show a higher level of consistency, while event data has a larger proportion of CTHs below 9 km, which is not present in the group and flash data. This discrepancy may be attributed to lightning occurring within the cloud, particularly in deep convective clouds, where the radiance from lightning disperses outward [37]. As a result, the radiance detected at the top of lower cloud layers by the LMI form the event data, which clusters around the centroid and transforms into group data, thus disappears from the final analysis. The BLNET statistics also reveal a significant representation of low cloud layer data, especially below 4 km, which is likely associated with lightning channels extending outside the clouds that are detected.
Furthermore, from the scatter plot, it can be observed that there is a higher level of agreement between LMI and BLNET data after UTC 16. During the period from UTC 8 to 11 (corresponding to 16–19 local Beijing time), the LMI detection count is considerably lower than that of BLNET due to the higher background threshold applied by the LMI during daylight hours.
It is important to note that the CTH data is collected in discrete time intervals ranging from 15 to 60 min, while the lightning data from the LMI has a time resolution of 2 ms. Consequently, when lightning events occur between two adjacent time intervals, it is not possible to determine the exact CTH at the moment of the lightning event. In this study, the CTH data from the preceding and following time intervals are utilized as a reference, assuming a linear transition in CTH at the same location between these two times intervals. Linear interpolation is then performed based on the timing of the lightning event, using the time difference between the preceding and following CTH data, to estimate the CTH at the time of the lightning event. However, it should be noted that CTH does not necessarily exhibit uniform vertical variation, and deviations can be introduced due to horizontal cloud displacement. For instances when lightning events fall within a single CTH data interval, the CTH of the grid cell containing the lightning event is directly used as an approximation for the CTH at the time of the event. Therefore, the CTH statistics presented in the figure represent approximations of the CTH at the time of lightning occurrences, rather than the actual values.
Figure 10 illustrates the latitude and longitude correction values, as well as the corresponding spatial lengths, computed using the proposed ECPC model on the LMI data. The latitude and longitude differences exhibit a strong positive correlation. Based on the findings from Figure 8, it is evident that the correction values for latitude and longitude differences are positively influenced by an increasing CTH. However, due to the varying geographical locations at the same CTH, there exists a slight deviation between the correction values and the fitted line. Nevertheless, the overall correction values align closely with the simulated correction results presented in Figure 6 and Figure 7.
Considering Beijing’s location in the mid-latitude region, it is important to note that for a spatial scale of 1°, the north–south dimension has a larger corresponding spatial extent (1°N) compared to the east–west dimension (1°E). Furthermore, the latitude correction values consistently exceed the longitude correction values. As such, it can be inferred that CTH has a greater impact on the deviation in the north–south direction within the Beijing region.
The graph also depicts the spatial lengths derived from the latitude and longitude correction values. With a spatial resolution of 7.8 km between neighboring pixels, it is important to account for the perspective effect. Consequently, the projected detection area of each unit in the Beijing region assumes a diamond-shaped pixel on the ground surface. Notably, the distances between neighboring pixels differ in the north–south (11.9 km) and east–west (8.5 km) directions, as indicated by the red dashed line in the chart. Given that a majority of the deviation values across the three datasets exceed 7 km, it becomes necessary to apply corrections to the lightning location data for improved accuracy.

3.4. Evaluation of the Correction Effect of the Lightning Location and the ECPC Model

The impact of convective weather intensity and cloud structure on LMI optical detection capability is complex. Intense convective weather often generates numerous small-sized flashes [38,39,40]. The LMI is prone to missing compact lightning generated during the intense phase of thunderstorms [20].
Considering the aforementioned factors, the study opted for two specific timeframes: 4 August 2019, at 21:11 (UTC), characterized by robust convective activity and frequent lightning occurrences, and at 22:29 (UTC), during a period of weaker convective activity and reduced lightning frequency. The analysis involved examining the spatial distribution of points detected by the LMI before and after correction for both scenarios. Ground-based BLNET flash data and combined radar reflectivity data were utilized as comparative benchmarks. Additionally, the study computed the disparities in coordinates between pre-correction and post-correction LMI data, aligning them with corresponding BLNET data. This assessment aimed to gauge the efficacy of the ECPC model across various phases of convective weather.

3.4.1. Spatial Distribution of LMI and BLNET lightning during the Vigorous Stage of a Severe Convective Weather System

Figure 11a–c depict the spatial distribution of LMI data before and after correction, as well as BLNET data, during the peak development phase of severe convective weather systems. These findings are overlaid with radar composite reflectivity data (recorded on 4 August 2019, at 21:11).
The analysis reveals that the lightning detected by the BLNET is primarily concentrated in regions with strong radar echoes. Specifically, in region ➀ (116.5°E, 40°N), where the radar composite reflectivity reaches 60 dBZ or higher and intense and frequent lightning is observed, the detected lightning positions from the BLNET closely correspond to the characteristics of the radar echoes. In contrast, a noticeable deviation in position is observed between the uncorrected LMI data and the BLNET data. This discrepancy can be attributed to various factors. It is observed that during this period, the study area experiences a high CTH, and the majority of lightning events occur within deep convective clouds. The event data represent the location of clouds illuminated by lightning as detected by the LMI. However, due to the optical limitations of the LMI system, the detection of lightning by the LMI is constrained, resulting in a significantly lower volume of LMI data compared to the BLNET data.
In area ➁, characterized by weaker convective activity in the northern region, lightning occurred in a relatively shallow cloud. The lightning flashes in this region are also positioned close to the outer periphery of BLNET detection coverage, which results in a slightly reduced efficiency of BLNET detection. However, a higher number of LMI data points are detected in this particular region. The lightning distribution patterns before and after the correction corroborate well with the findings obtained from the analysis of CTH shown in Figure 9.
From Figure 11a, it can be observed that both the dense lightning region ➀ and the scattered lightning region ➁ exhibit an overall east–northeast shift (approximately 0.2°) in the position distribution of uncorrected LMI event detections compared to the BLNET data. However, after applying the ECPC model correction, the LMI detection points align more accurately with the BLNET data points, indicating a significant improvement in the correction effect. In Figure 11b, the group data, generated through event clustering, present a reduced volume of data. Once corrected, the positions of the group data align more closely with the BLNET detection points. Nevertheless, due to the inherent spatial resolution limitations of the LMI instrument (undersampled at 7.8 km) and the reconstructed nature of the group data, achieving an absolute match between the data points and the precise locations of lightning occurrences remains challenging. Figure 11c displays the flash data, derived from further clustering the group data on a temporal scale, which exhibits a distribution pattern similar to that of the group data.
Overall, the model correction significantly improves the spatial distribution agreement between the LMI and ground-based BLNET data. However, a slight eastward deviation is still observed in the distribution of the corrected LMI data compared to the BLNET data. This discrepancy may be attributed to the optical nature of radiance, which can sometimes exit the cloud laterally and be captured by the LMI rather than penetrating directly above the cloud top. This phenomenon results in a slight positional offset from the actual lightning occurrence.

3.4.2. Spatial Distribution of LMI and BLNET lightning during the Weakening Stage of Severe Convective Weather Activity

Figure 12a–c show the spatial distribution of the three types of LMI data before and after the model correction compared with ground-based BLNET data, overlaid with radar composite reflectivity data during the late phase of the severe convective weather system (4 August 2019, at 22:29).
Overall, there is a noticeable decrease in lightning activity, primarily distributed in the central and northeastern regions of Beijing. In Figure 12a, the LMI event data before correction are mostly distributed in the northeast direction of the BLNET flash detection points, while after correction, they align more closely with the ground-based data and are more consistent with areas of higher radar reflectivity.
From Figure 12b,c, it is evident that the corrected LMI group and flash data in the central region of Beijing (Area ➀, near 116.7°E, 40.3°N) closely match with the BLNET data. In the northeastern region (Area ➁, near 117.3°E, 40.5°N), there is a deviation between LMI and BLNET data positions. This deviation is due to the fact that group and flash data are derived from event data, and they do not represent the actual positions. Additionally, the radiance penetration time through thin cloud layers is shorter than through thick cloud layers, leading to the assumption that the lightning initially occurred in a slightly northeast location during the calculation process, resulting in an overall north–eastward deviation in the positions of group and flash data compared to the BLNET. This can be verified based on the distribution of event data in Area ➁ as shown in Figure 12a, where the corrected event data align above the BLNET data. Area ➁ is closer to the edge of the BLNET detection range, and the absence of BLNET detection for lightning corresponding to LMI data may also contribute to the positional deviation.

3.4.3. Quantitative Analysis on the Differences between Matched LMI and BLNET Data

To conduct a more detailed assessment of the ECPC model’s effectiveness, a specific analysis involves quantifying the numerical alterations in LMI data coordinates before and after correction, facilitated through aligning LMI data with BLNET data. A crucial aspect in this evaluation is the selection of matching thresholds. Matching and clustering have similar principles, so we choose the official LMI data clustering threshold, where experimental results suggest favorable outcomes when employing a spatial threshold of 16.5 km and a time threshold of 330 ms (threshold of LMI clustering algorithm) [23].
For the purpose of this analysis, LMI data serve as a reference, and the nearest BLNET data within the specified threshold range are considered part of the same lightning event. A single BLNET flash typically comprises more than one BLNET radiation event. When matching the data, the LMI may match different radiation events from the same flash. This can introduce more uncertainty into the final results. Moreover, because the spatial resolution of LMI events in the Beijing area is approximately 10 km, while the BLNET’s deviation is within 200 m, an event represents an individual illuminated CCD. A single event could correspond to one or even multiple adjacent flashes in reality. Thus, LMI events and BLNET radiation events, at their respective lowest data levels, are not of the same hierarchy. Comparing and matching data at different levels of the BLNET could raise further questions. Consequently, we ultimately decided to use BLNET flash data as the reference (a single BLNET flash being closer to a real flash), which allows for a clearer assessment of the coordinate changes before and after LMI correction.
After implementing the correction, there might be instances where data that were previously within the threshold range now fall outside of it, and vice versa. To maintain consistent sample sizes and provide a more visual depiction of positional changes in lightning data pre- and post correction, Figure 13 illustrates the distribution of coordinate disparities (depicted in blue) between successfully matched LMI data and corresponding BLNET data. Additionally, it showcases coordinate disparities (shown in orange) for data that remain unmatched in the absence of correction.
Observations from the figure indicate a gradual decrease in the count of event, group, and flash data as clustering and calculations are applied. The probability density curve reveals that before correction, coordinate disparities for all three types of LMI data primarily cluster within the 15–25 km range. Following correction, these disparities become concentrated around 5–15 km. On the whole, correction significantly reduces coordinate disparities, leading to a more converged distribution. Significantly, the consistent distribution characteristics of coordinate disparities across all three data types affirm the effectiveness of the ECPC model for LMI data. Due to the inherent characteristics of the LMI instrument itself (with spatial resolutions of 7.8 km at nadir, 11.9 km in the north–south direction in Beijing, and 8.5 km in the east–west direction), further reduction in coordinate disparities with matched ground-based detection data (with horizontal deviations within 200 m) presents a challenging endeavor. It is worth noting that the BLNET flash data matched with the LMI most likely represents the same flash, but due to the differences in platform and detection principles between the two, even if they fall within the threshold range, they may not necessarily be the same flash.

4. Discussions and Conclusions

This study is rooted in the principles of stationary satellite photogrammetry, aiming to develop a correction model for CTH parallax using the FY-4A LMI. The FY-4A CTH data are employed for this correction process. An insightful analysis is conducted through juxtaposing observations from LMI and BLNET lightning sources with radar data collected during a summer convective weather system over Beijing in 2019. An ECPC model is developed for this purpose. The evaluation of the efficacy of the LMI ECPC model yields the subsequent results:
  • The deviation in vertically pointing full-disc data towards the geocenter exhibits a progressive increase as one moves away from the center of the observation range (nadir). Regarding the LMI observations, when considering the average height of convective clouds (12 km), the deviation of the CCD projection plane demonstrates a rise with latitude due to the northward shift in the LMI observation perspective. Consequently, this phenomenon induces a heightened influence of CTH on lightning positioning from the southern to the northern regions. Additionally, the eastward correction values experience a gradual escalation from the central axis of the observation range towards the extremities of the detection scope. Simultaneously, the northward correction values incrementally increase from lower to higher latitudes. Across numerous regions, particularly those proximate to the observation range’s periphery, the spatial extent of these correction values surpasses the spatial resolution of the CCD detection unit. Consequently, the imperative to rectify the lightning positioning data derived from the LMI becomes evident.
  • Using Beijing as a case study, the disparity in coordinate positions yields a relatively modest impact on the precision of lightning positioning. The extent of correction values is primarily contingent upon CTH. Analyzing the distribution patterns of correction values derived from real CTH measurements and simulated corrections with a fixed CTH unveils a discernible positive correlation. This signifies the congruence and practicability of the ECPC model, both theoretically and empirically. In particular, the correction values related to latitude exhibit a considerably more pronounced magnitude than those associated with longitude. This phenomenon is attributed to the inherent characteristics of the LMI instrument itself, as well as the spatial orientation of the observed area. Beijing’s geographical location positions it close to the observation range’s center, thereby rendering it less susceptible to longitude-based influences. However, being situated within a mid-latitude region, the instrument’s latitude deviation incrementally intensifies from south to north. Consequently, the latitude deviation surpasses the longitude deviation, resulting in an overall northward shift in the data.
  • Through a comprehensive comparison involving pre- and post-correction LMI data, BLNET data, and radar data, noteworthy observations have come to light. It is evident that the data points identified using the BLNET align remarkably well with areas characterized by robust radar echoes. Conversely, the LMI data prior to correction demonstrate a north-easterly bias in relation to the BLNET data. Following the application of the correction model, the event data display substantial convergence with the BLNET data. Furthermore, the calculated lightning positions for both group and flash data closely mirror the ground-based detection data. The impact of the correction model is particularly pronounced in instances of mild convective weather events. In essence, these outcomes underscore the pronounced efficacy of the correction model, particularly during episodes of weaker convective weather activities.
  • This research systematically undertakes a quantitative assessment of the coordinate disparities among the three distinct LMI datasets and the ground-based BLNET data post correction within the context of a potent convective weather system. Notably, the coordinate disparities of the corrected data experience a substantial reduction, fostering a greater degree of convergence within the overall distribution of coordinate differences. Comparing the distribution traits of the data before and after correction across the three LMI datasets reveals a fundamental similarity. This similarity underscores the effectiveness and widespread applicability of the lightning-mapping ECPC model across all three categories of LMI data. In summary, these findings affirm the model’s efficacy and universality in ameliorating coordinate discrepancies for the diverse LMI data types, substantiating its reliability and value across various scenarios.
Based on the outcomes derived from this investigation, the ECPC model employed for lightning positioning within the framework of the LMI exhibits substantial effectiveness and significance. This model effectively mitigates the impact of CTH on lightning positioning, leading to an enhanced alignment between the corrected positions and the ground-based detection data. Notably, CTH data emerge as a pivotal factor significantly influencing the overall correction accuracy and efficacy. Leveraging CTH data for correction purposes has yielded promising results, which not only expand the potential applications of FY-4A data but also furnish a reference point for enhancing data precision and dependability. Furthermore, these findings offer valuable insights for the prospective development of China’s next-generation lightning imaging systems. This study’s success serves as a stepping stone for refining design and algorithmic enhancements in forthcoming lightning imaging endeavors. Ultimately, this research contributes to advancing data accuracy, reliability, and the broader utility of satellite-based lightning mapping technology.

Author Contributions

Conceptualization, D.C., X.Q., S.B. and F.L.; Methodology, Y.Z., X.Q., J.Y., D.C., Z.C. and H.Z.; Funding acquisition, X.Q.; Investigation, Y.Z., X.Q., D.C. and J.Y.; Data curation, Y.Z., D.C., D.W., S.B., R.L., H.Z., D.L. and H.L.; Writing—original draft preparation, Y.Z., X.Q., J.Y., D.C. and Z.C.; Writing—review and editing, Y.Z., X.Q., J.Y., D.C., F.L. and Z.C.; Translation, Y.Z., F.L., W.C. and X.Q. All authors have read and agreed to the published version of the manuscript.

Funding

This research was funded by the National Natural Science Foundation of China, grant number 42230609.

Data Availability Statement

FY-4A LMI and FY-4A AGRI CTH publicly available datasets were analyzed in this study. This data can be found here: [http://satellite.nsmc.org.cn/PortalSite/Data/Satellite.aspx, accessed on 4 August 2019]. BLNET data and Radar data sharing is not applicable to this article.

Acknowledgments

The authors wish to thank the National Satellite Meteorological Center for providing the FY-4A LMI data and CTH data.

Conflicts of Interest

The authors declare no conflict of interest.

References

  1. Qie, X.; Zhang, Y.; Zhang, D.; Yin, Y.; Yu, Y.; Lu, G.; Jiang, R. Principles and Forecast of Thunderbolt Weather System; Science Press: Beijing, China, 2023. (In Chinese) [Google Scholar]
  2. Wang, Y.; Qie, X.; Wang, D.; Liu, M.; Su, D.; Shen, Y.; Wu, Z.; Liu, D.; Sun, Z. Beijing Lightning NETwork (BLNET): Configuration and Preliminary Results of Lightning Location. Chin. J. Atmos. Sci. 2015, 39, 571–582. (In Chinese) [Google Scholar]
  3. Zhang, Y.; Zhang, Y.; Zou, M.; Wang, J.; Li, Y.; Tan, Y.; Feng, Y.; Zhang, H.; Zhu, S. Advances in Lightning Monitoring and Location Technology Research in China. Remote Sens. 2022, 14, 1293. [Google Scholar] [CrossRef]
  4. Yang, J.; Zhang, Z.; Wei, C.; Lu, F.; Guo, Q. Introducing the New Generation of Chinese Geostationary Weather Satellites, Fengyun-4. Bull. Am. Meteorol. Soc. 2017, 98, 1637–1658. [Google Scholar] [CrossRef]
  5. Goodman, S.J.; Blakeslee, R.J.; Koshak, W.J.; Mach, D.; Bailey, J.; Buechler, D.; Carey, L.; Schultz, C.; Bateman, M.; McCaul, E.; et al. The GOES-R Geostationary Lightning Mapper (GLM). Atmos. Res. 2013, 125–126, 34–49. [Google Scholar] [CrossRef]
  6. Peterson, M.; Lay, E. GLM Observations of the Brightest Lightning in the Americas. J. Geophys. Res. Atmos. 2020, 125, e2020JD033378. [Google Scholar] [CrossRef]
  7. Rutledge, S.A.; Hilburn, K.A.; Clayton, A.; Fuchs, B.; Miller, S.D. Evaluating Geostationary Lightning Mapper Flash Rates within Intense Convective Storms. J. Geophys. Res. Atmos. 2020, 125, e2020JD032827. [Google Scholar] [CrossRef]
  8. Roebeling, R.A.; Holleman, I. SEVIRI rainfall retrieval and validation using weather radar observations. J. Geophys. Res. Atmos. 2009, 114. [Google Scholar] [CrossRef]
  9. Henken, C.C.; Schmeits, M.J.; Deneke, H.; Roebeling, R.A. Using MSG-SEVIRI Cloud Physical Properties and Weather Radar Observations for the Detection of Cb/TCu Clouds. J. Appl. Meteorol. Clim. 2011, 50, 1587–1600. [Google Scholar] [CrossRef]
  10. Wang, C.; Luo, Z.J.; Huang, X. Parallax correction in collocating CloudSat and Moderate Resolution Imaging Spectroradiometer (MODIS) observations: Method and application to convection study. J. Geophys. Res. Atmos. 2011, 116. [Google Scholar] [CrossRef]
  11. Chen, J.; Yang, J.; An, W.; Chen, Z. An Attitude Jitter Correction Method for Multispectral Parallax Imagery Based on Compressive Sensing. IEEE Geosci. Remote Sens. Lett. 2017, 14, 1903–1907. [Google Scholar] [CrossRef]
  12. Frantz, D.; Haß, E.; Uhl, A.; Stoffels, J.; Hill, J. Improvement of the Fmask algorithm for Sentinel-2 images: Separating clouds from bright surfaces based on parallax effects. Remote Sens. Environ. 2018, 215, 471–481. [Google Scholar] [CrossRef]
  13. Guo, Q.; Feng, X.; Yang, C.; Chen, B. Improved Spatial Collocation and Parallax Correction Approaches for Calibration Accuracy Validation of Thermal Emissive Band on Geostationary Platform. IEEE Trans. Geosci. Remote Sens. 2018, 56, 2647–2663. [Google Scholar] [CrossRef]
  14. Greuell, W.; Roebeling, R.A. Toward a Standard Procedure for Validation of Satellite-Derived Cloud Liquid Water Path: A Study with SEVIRI Data. J. Appl. Meteorol. Clim. 2009, 48, 1575–1590. [Google Scholar] [CrossRef]
  15. Li, S.; Sun, D.; Yu, Y. Automatic cloud-shadow removal from flood/standing water maps using MSG/SEVIRI imagery. Int. J. Remote Sens. 2013, 34, 5487–5502. [Google Scholar] [CrossRef]
  16. Vicente, G.A.; Davenport, J.C.; Scofield, R.A. The role of orographic and parallax corrections on real time high resolution satellite rainfall rate distribution. Int. J. Remote Sens. 2002, 23, 221–230. [Google Scholar] [CrossRef]
  17. Bieliński, T. A Parallax Shift Effect Correction Based on Cloud Height for Geostationary Satellites and Radar Observations. Remote Sens. 2020, 12, 365. [Google Scholar] [CrossRef]
  18. Takenaka, H.; Sakashita, T.; Higuchi, A.; Nakajima, T. Geolocation Correction for Geostationary Satellite Observations by a Phase-Only Correlation Method Using a Visible Channel. Remote Sens. 2020, 12, 2472. [Google Scholar] [CrossRef]
  19. Chen, S.; Yang, Y.; Cui, T. Study of the cloud effect on lightning detection by geostationary satellite. Chin. J. Geophys. 2012, 55, 797–803. (In Chinese) [Google Scholar]
  20. Hui, W.; Zhang, W.; Lyu, W.; Li, P. Preliminary Observations from the China Fengyun-4A Lightning Mapping Imager and Its Optical Radiation Characteristics. Remote Sens. 2020, 12, 2622. [Google Scholar] [CrossRef]
  21. Cao, D.; Lu, F.; Zhang, X.; Yang, J. Lightning Activity Observed by the FengYun-4A Lightning Mapping Imager. Remote Sens. 2021, 13, 3013. [Google Scholar] [CrossRef]
  22. Chen, Z.; Qie, X.; Sun, J.; Xiao, X.; Zhang, Y.; Cao, D.; Yang, J. Evaluation of Fengyun-4A Lightning Mapping Imager (LMI) Performance during Multiple Convective Episodes over Beijing. Remote Sens. 2021, 13, 1746. [Google Scholar] [CrossRef]
  23. Cao, D. The Development of Product Algorithm of the Fengyun-4 Geostationary Lightning Mapping Imager. Adv. Meteorol. Sci. Technol. 2016, 6, 94–98. (In Chinese) [Google Scholar]
  24. Min, M.; Wu, C.; Li, C.; Liu, H.; Xu, N.; Wu, X.; Chen, L.; Wang, F.; Sun, F.; Qin, D.; et al. Developing the science product algorithm testbed for Chinese next-generation geostationary meteorological satellites: Fengyun-4 series. J. Meteorol. Res. 2017, 31, 708–719. [Google Scholar] [CrossRef]
  25. Zhang, P.; Chen, L.; Xian, D.; Xu, Z. Recent Progress of Fengyun Meteorology Satellites. Chin. J. Space Sci. 2018, 38, 788–796. [Google Scholar] [CrossRef]
  26. Wang, G.; Shen, X. The FY-4 radiometer imager and the application of its data in the satellite meteorology. Chin. J. Nat. 2018, 40, 1–11. (In Chinese) [Google Scholar]
  27. Tan, Z.; Ma, S.; Zhao, X.; Yan, W.; Lu, W. Evaluation of Cloud Top Height Retrievals from China’s Next-Generation Geostationary Meteorological Satellite FY-4A. J. Meteorol. Res. 2019, 33, 553–562. [Google Scholar] [CrossRef]
  28. Wang, Y.; Qie, X.; Wang, D.; Liu, M.; Su, D.; Wang, Z.; Liu, D.; Wu, Z.; Sun, Z.; Tian, Y. Beijing Lightning Network (BLNET) and the observation on preliminary breakdown processes. Atmos. Res. 2015, 171, 121–132. [Google Scholar] [CrossRef]
  29. Yuan, S.; Qie, X.; Jiang, R.; Wang, D.; Wang, Y.; Wang, C.; Srivastava, A.; Tian, Y. In-cloud discharge of positive cloud-to-ground lightning and its influence on the initiation of tower-initiated upward lightning. J. Geophys. Res. Atmos. 2021, 126, e2021JD035600. [Google Scholar] [CrossRef]
  30. Srivastava, A.; Tian, Y.; Qie, X.; Wang, D.; Sun, Z.; Yuan, S.; Wang, Y.; Chen, Z.; Xu, W.; Zhang, H.; et al. Performance assessment of Beijing Lightning Network (BLNET) and comparison with other lightning location networks across Beijing. Atmos. Res. 2017, 197, 76–83. [Google Scholar] [CrossRef]
  31. Wang, D.; Sun, Z.; Yuan, S.; Lu, J.; Qie, X.; Liu, M.; Xu, Y.; Lu, G.; Tian, Y. Beijing Broadband Lightning NETwork and the Spatiotemporal Evolution of Lightning Flashes during a Thunderstorm. Chin. J. Atmos. Sci. 2020, 44, 851–864. (In Chinese) [Google Scholar]
  32. Qie, X.; Yuan, S.; Chen, Z.; Wang, D.; Liu, D.; Sun, M.; Sun, Z.; Srivastava, A.; Zhang, H.; Lu, J.; et al. Understanding the dynamical-microphysical-electrical processes associated with severe thunderstorms over the Beijing metropolitan region. Sci. China Earth Sci. 2021, 64, 10–26. [Google Scholar] [CrossRef]
  33. Yu, H.; Zhang, H.; Liu, D.; Chen, Z.; Tian, Y.; Yuan, S.; Wang, D.; Lu, J.; Zhou, J.; Qie, X. Relationship between Lightning Activities and Radar Echoes of Squall Line Convective Systems. Chin. J. Atmos. Sci. 2022, 46, 835–844. [Google Scholar]
  34. Lu, J.; Qie, X.; Jiang, R.; Xiao, X.; Liu, D.; Li, J.; Yuan, S.; Chen, Z.; Wang, D.; Tian, Y.; et al. Lightning activity during convective cell mergers in a squall line and corresponding dynamical and thermodynamical characteristics. Atmos. Res. 2021, 256, 105555. [Google Scholar] [CrossRef]
  35. Lu, F.; Zhang, X.; Xu, J. Image Navigation for the FY2 Geosynchronous Meteorological Satellite. J. Atmos. Ocean. Technol. 2008, 25, 1149–1165. [Google Scholar] [CrossRef]
  36. Lu, J.; Qie, X.; Xiao, X.; Jiang, R.; Mansell, E.R.; Fierro, A.O.; Liu, D.; Chen, Z.; Yuan, S.; Sun, M.; et al. Effects of Convective Mergers on the Evolution of Microphysical and Electrical Activity in a Severe Squall Line Simulated by WRF Coupled with Explicit Electrification Scheme. J. Geophys. Res. Atmos. 2022, 127, e2021JD036398. [Google Scholar] [CrossRef]
  37. Peterson, M.; Light, T.E.L.; Mach, D. The Illumination of Thunderclouds by Lightning: 1. The Extent and Altitude of Optical Lightning Sources. J. Geophys. Res. Atmos. 2022, 127, e2021JD035579. [Google Scholar] [CrossRef]
  38. Weiss, S.A.; MacGorman, D.R.; Calhoun, K.M. Lightning in the Anvils of Supercell Thunderstorms. Mon. Weather Rev. 2012, 140, 2064–2079. [Google Scholar] [CrossRef]
  39. Bruning, E.C.; MacGorman, D.R. Theory and Observations of Controls on Lightning Flash Size Spectra. J. Atmos. Sci. 2013, 70, 4012–4029. [Google Scholar] [CrossRef]
  40. Zheng, D.; Wang, D.; Zhang, Y.; Wu, T.; Takagi, N. Charge Regions Indicated by LMA Lightning Flashes in Hokuriku’s Winter Thunderstorms. J. Geophys. Res. 2019, 124, 7179–7206. [Google Scholar] [CrossRef]
Figure 1. Schematic representation of the influence of CTH correction on lightning localization.
Remotesensing 15 04856 g001
Figure 2. Computational workflow of ECPC model for lightning localization using a stationary satellite. The different colored boxes in the image represent the coordinates in their respective coordinate systems, with orange indicating geocentric coordinate system, blue indicating space coordinate system, and green indicating satellite coordinate system.
Remotesensing 15 04856 g002
Figure 3. Diagram illustrating coordinate systems.
Remotesensing 15 04856 g003
Figure 4. Schematic illustration of detection point deviation and projection.
Remotesensing 15 04856 g004
Figure 5. Detection count of FY-4A LMI events and BLNET radiation events during the summer of 2019.
Remotesensing 15 04856 g005
Figure 6. Latitudinal deviation in lightning positioning under 12 km CTH (negative values indicate southward correction).
Remotesensing 15 04856 g006
Figure 7. Longitudinal deviation in lightning positioning under 12 km CTH (negative values indicate westward correction; positive values indicate eastward correction).
Remotesensing 15 04856 g007
Figure 8. Latitudinal and longitudinal deviations in image edge pixel localization as a function of CTH variation.
Remotesensing 15 04856 g008
Figure 9. FY-4A CTH and corresponding frequency statistics matched with LMI and BLNET on 4 August 2019. (a,b) LMI event, (c,d) LMI group, (e,f) LMI flash, and (g,h) BLNET flash. The corresponding frequency statistics for each category are displayed in (b), (d), (f), and (h), respectively.
Remotesensing 15 04856 g009
Figure 10. Correction values of latitude–longitude differences and spatial distance of LMI. (a,b) LMI event, (c,d) LMI group, and (e,f) LMI flash.
Remotesensing 15 04856 g010
Figure 11. The overlay of LMI (a) event, (b) group, and (c) flash data before and after correction with ground-based BLNET detection data and radar composite reflectivity at 21:11 on 4 August 2019. The BLNET flash data are represented by black dots, the uncorrected LMI data by pink inverted triangles, and the corrected LMI data by red upright triangles.
Remotesensing 15 04856 g011
Figure 12. The overlay of LMI (a) event, (b) group, and (c) flash data before and after correction with ground-based BLNET detection data and radar composite reflectivity at 22:29 on 4 August 2019. Black dots represent BLNET flash data, pink inverted triangles represent LMI data before correction, and red upright triangles represent LMI data after correction.
Remotesensing 15 04856 g012aRemotesensing 15 04856 g012b
Figure 13. Distribution of coordinate differences between LMI (a) events, (b) groups, and (c) flashes before and after correction and matching with BLNET flashes. Orange indicates the distribution of coordinate differences between the original LMI data and BLNET flash data. Blue indicates the distribution of coordinate differences between the LMI data after correction and BLNET flash data. Deep orange indicates the overlapping region between orange and blue. The yellow line represents the probability curve for the blue region, while the purple line indicates the probability curve for the orange region.
Remotesensing 15 04856 g013aRemotesensing 15 04856 g013b
Table 1. Number of lightning observations for LMI and BLNET.
DateLMIBLNET
EventGroupFlashRadiation EventFlash
4 August 201939991119292149588160
Table 2. Parameters used in the calculation.
ParameterVariableValue
Satellite position 90 ° + γ 104.7 °
Satellite orbital altitude H 35 , 800   km
Ellipsoid long half axis a 637 , 8137   m
Ellipsoid short half axis b 635 , 6752   m
Instrument tilt angle a E 5.1 °
Number of detection units M × N × 2 400 × 300 × 2
Detection unit size L U 24   μ m
X-axis attitude angle a x 0.09213 °
Y-axis attitude angle a y 1.836605 °
Z-axis attitude angle a z 0.089565 °
Focal length f 119.6   mm
Table 3. Horizontal deviations in some representative locations, within the LMI’s coverage (Northern Hemisphere summer and Southern Hemisphere summer) under a scenario of 12 km CTH.
CountryCityLongitude, LatitudeLongitude
Correction Values (°)
Latitude
Correction Values (°)
Distance
(km)
ChinaBeijing116.47°E, 39.90°N−0.0475−0.112813.1558
Tianjin117.18°E, 39.15°N−0.0494−0.109412.8649
Shanghai121.48°E, 31.23°N−0.0542−0.080210.2854
Chongqing106.53°E, 29.53°N−0.0056−0.07418.2390
Shijiazhuang114.46°E, 38.03°N−0.0369−0.104712.0583
Taiyuan112.56°E, 37.86°N−0.0294−0.103811.8025
Xi’an108.90°E, 34.26°N−0.0141−0.090010.0691
Jinan117.00°E, 36.63°N−0.0452−0.099111.7128
Zhengzhou113.70°E, 34.80°N−0.0310−0.092010.5931
Shenyang123.40°E, 41.83°N−0.0831−0.122315.2192
Changchun125.31°E, 43.86°N−0.0998−0.133016.7900
Harbin126.68°E, 45.75°N−0.1153−0.143618.2767
Nanjing118.83°E, 32.03°N−0.0461−0.082810.1645
Hangzhou120.15°E, 30.23°N−0.0487−0.07679.7135
Hefei117.30°E, 31.85°N−0.0407−0.08219.8883
Nanchang115.86°E, 28.68°N−0.0335−0.07168.5911
Fuzhou119.30°E, 26.08°N−0.0420−0.06398.2399
Wuhan114.29°E, 30.61°N−0.0299−0.07799.1051
Changsha113.00°E, 28.18°N−0.0245−0.06998.1192
Chengdu104.08°E, 30.65°N0.0018−0.07778.6222
Guangzhou113.25°E, 23.13°N−0.0229−0.05546.5783
Guiyang106.70°E, 26.58°N−0.0056−0.06507.2330
Haikou110.31°E, 19.95°N−0.0142−0.04685.4007
Kunming102.68°E, 25.00°N0.0056−0.06056.7360
Lanzhou103.81°E, 36.05°N0.0031−0.097010.7654
Xining101.75°E, 36.63°N0.0107−0.098710.9920
Hohhot111.80°E, 40.81°N−0.0291−0.116513.1557
Nanning108.33°E, 22.80°N−0.0096−0.05436.1044
Lhasa90.13°E, 29.65°N0.0449−0.07479.3570
Yinchuan106.26°E, 38.33°N−0.0058−0.105711.7380
Urumqi87.60°E, 43.80°N0.0811−0.132316.0595
Hong Kong114.16°E, 22.30°N−0.0251−0.05316.4335
Macau113.58°E, 22.23°N−0.0233−0.05306.3514
Taipei121.51°E, 25.05°N−0.0477−0.06128.3213
AustraliaBroome122.24°E, 17.92°S−0.0450−0.04206.6657
Onslow115.10°E, 21.73°S−0.0275−0.05166.3922
Perth115.82°E, 31.96°S−0.0357−0.08239.7335
Kalgoorlie121.44°E, 30.76°S−0.0535−0.078710.1208
Disclaimer/Publisher’s Note: The statements, opinions and data contained in all publications are solely those of the individual author(s) and contributor(s) and not of MDPI and/or the editor(s). MDPI and/or the editor(s) disclaim responsibility for any injury to people or property resulting from any ideas, methods, instructions or products referred to in the content.

