Article

Aging in First and Second Life of G/LFP 18650 Cells: Diagnosis and Evolution of the State of Health of the Cell and the Negative Electrode under Cycling

1
Université Claude Bernard Lyon 1, Ampère, UMR5005, INSA Lyon, Ecole Centrale de Lyon, CNRS, F-69100 Villeurbanne, France
2
EIGSI La Rochelle, EIGSI Lab., F-17000 La Rochelle, France
3
Univ. Grenoble Alpes, Univ. Savoie Mont Blanc, CNRS, Grenoble INP, LEPMI, F-38000 Grenoble, France
4
EVE System, F-69440 Taluyers, France
*
Authors to whom correspondence should be addressed.
Batteries 2024, 10(4), 137; https://doi.org/10.3390/batteries10040137
Submission received: 22 January 2024 / Revised: 7 March 2024 / Accepted: 9 April 2024 / Published: 18 April 2024
(This article belongs to the Special Issue Second-Life Batteries)

Abstract

:
Second-life applications for lithium-ion batteries offer the industry opportunities to defer recycling costs, enhance economic value, and reduce environmental impacts. An accurate prognosis of the remaining useful life (RUL) is essential for ensuring effective second-life operation. Diagnosis is a necessary step for the establishment of a reliable prognosis, based on the aging modes involved in a cell. This paper introduces a method for characterizing specific aging phenomenon in Graphite/Lithium Iron Phosphate (G/LFP) cells. This method aims to identify aging related to the loss of active material at the negative electrode (LAMNE). The identification and tracking of the state of health (SoH) are based on Incremental Capacity Analysis (ICA) and Differential Voltage Analysis (DVA) peak-tracking techniques. The remaining capacity of the electrode is thus evaluated based on these diagnostic results, using a model derived from half-cell electrode characterization. The method is used on a G/LFP cell in the format 18650, with a nominal capacity of 1.1 Ah, aged from its pristine state to 40% of state of health.

1. Introduction

The mobility sector is experiencing significant transformations due to various environmental reforms. This includes the expected phase-out of internal combustion engine vehicles in Europe, anticipated between 2030 and 2050. Today, the electrification of vehicles depends on lithium-ion batteries for energy storage, whether in hybrid electric vehicles, plug-in hybrid electric vehicles (PHEVs and HEVs), or battery electric vehicles (BEVs) [1]. The lifespan of these batteries is limited and varies based on the selected chemistry, storage conditions, and use. As a battery ages, its capacity decreases, diminishing the overall vehicle driving range. Reaching end-of-life for these batteries does not necessarily mean they are unusable in electric vehicles or stationary applications. Instead, it means a significant reduction in the battery’s capacity and a smaller vehicle range. The literature suggests a capacity decrease of 20% to 30% for an electric vehicle at the end of its first life. Consequently, these batteries still retain a substantial energy storage capacity, typically between 70% and 80% of their initial capacity [2,3].
In the coming years, a significant quantity of batteries will require recycling. Although recycling and recovering 50% of the battery mass has been made mandatory within the European Union by Directive 2006/66/EC, it will have to reach 65% by 2025. This operation comes with both economic and environmental costs. Electric vehicle batteries are considered as industrial waste, and the responsibility for managing and financing recycling falls upon the battery producer. Second-life applications for lithium-ion batteries are an opportunity for the industry to postpone recycling costs, enhance the economic value of lithium-ion batteries, and reduce environmental impact. However, the reintroduction of batteries into circulation must be guaranteed by the manufacturer for a specific duration or number of cycles. Reselling second-life batteries requires an accurate prognosis of the remaining useful life to ensure the component can meet the need of the intended application, especially since an acceleration of capacity fade can occur; this is sometimes referred to as the aging knee. Even though the aging of lithium-ion batteries is extensively studied for first-life applications, ranging from 100% to 70% state of health (SoH), limited research has been carried out on the aging in second-life applications.
Some aging studies show data above the standard limit of 70% of the state of health and observe an acceleration of the capacity fade of the cell. Lithium-ion cells may encounter an acceleration of capacity fade. Klett et al. observed an acceleration of capacity loss in a cell down to 30% state of health in the case of repeated charge and discharge at a constant current [4]. Baumhöfer et al. observed aging of a similar nature for 48 cells with varying speeds of dynamics. All cells exhibit an acceleration of aging appearing after 1000 or 1300 cycles [5]. Harris et al. conducted tests on 24 pouch cells under identical conditions and found a significant disparity in aging. Some cells underwent a rapid acceleration of aging, reaching a state of health below 50%, while others did not show any acceleration within the time allowed by the study [6]. Mathieu et al. proposed modifying a fast-charging technique to delay the onset of accelerated aging [7]. The end-of-charge voltage is also a studied parameter that can delay accelerated aging occurrence in certain experiments [8]. Ecker et al. showed a dependence where the onset of aging acceleration is faster in the case of a deeper discharge or in the case of a partial discharge with cycling at a low voltage window [9]. Therefore, the occurrence of the aging knee depends on many factors and can appear at a different time or a different rate between cells used in the exact same conditions. Incremental Capacity Analysis (ICA) and Differential Voltage Analysis (DVA) are derivative techniques used on a cell’s pseudo-OCV. This derivative tool is used in numerous studies to assess the evolution of battery state of health or specific aging mechanisms [10,11,12,13,14]. Dubarry et al. have worked on the impact of the graphite electrode on the cell’s capacity by tracking characteristic points using ICA and DVA without model description [15] or through experimental tests [16]. The ICA and DVA techniques can be employed for data processing post-treatment or embedded in an electric vehicle [17]. Birkl et al. demonstrate the impact of the loss of active material on the negative electrode’s behavior in a lithium-ion cell by reducing its cross-sectional area. A direct impact is observed on ICA and DVA curves [18].
This article presents a method to characterize industrial cells to track the evolution of the state of health of the negative electrode (SoHNE) under cycling in first- and second-life applications. This paper does not intend to explain the cause of this aging. The aging study involves three G/LFP cells aged down to 40% of state of health (SoH). This SoH value of the cell is representative of the end of life of a second-life application. Aging data are used to follow-up the SoH of the cell (SoH) and the negative electrode (SoHNE) every 100 cycles. The lithium iron phosphate (LFP) is used as the positive electrode. The state of health of the positive electrode is not considered in this study because it is a stable electrode material with minimal aging under cycling or storage [4,19,20,21]. A method for characterizing the electrode will be presented and then utilized to estimate the state of health of the negative electrode. This paper, along with the proposed diagnostic technique, aims to accurately evaluate the evolution of the negative electrode’s capacity. A loss of capacity at the negative electrode (LAMNE) can occur due to non-uniform aging phenomena: local lithium deposition on the electrode, graphite exfoliation or isolation, or bulky deposits on the electrode. Local lithium deposition can lead to an increased capacity fade and localized Loss of Lithium Inventory (LLI) within the cell. Prior to presenting the diagnosis method, the cell’s negative electrode is characterized.

2. Experimental

2.1. G/LFP Cell Aging Experiment

The experiments were conducted on three graphite/LFP cells in the format 18650 with a nominal capacity of 1.1 Ah. A thermal chamber at 50 °C was used to age three cells, with a depth of discharge (DoD) set to 100%. The discharge cycle features a current profile derived from the WLTP test procedure in Figure 1, continuing until the cell voltage reached 2.5 V. The discharge current profile, simulating electric vehicle usage, was calculated from the ‘Worldwide harmonized Light vehicles Test Procedures’ (WLTP) standard [22]. This cycle featured an average discharge rate of -C/3, a maximum discharge C-rate of −2.7 C, and a maximum regenerative C-rate of 1.2 C. This discharge cycle accounted for energy regeneration during vehicle braking.
The state of health (SoH) of the cell, defined by Equation (1), reached 40 to 30% at the end of the experiment. SoH, as defined in Equation (1) is the ratio of the cell’s usable capacity at a given aging state (Qcell) to its initial capacity ( Q c e l l 0 ), with the latter measured in the first cycle. The capacity loss is the difference between Qcell and Q c e l l 0 .
S o H c e l l = 100 × Q c e l l Q c e l l 0
The characterization was conducted after every 100 aging cycles in two distinct stages. In the first stage, the cells’ capacity was characterized using a constant current (CC) discharge at a rate of C/3, followed by a constant current and constant voltage charge (CC-CV) until reaching the maximum voltage of 3.65 V and a cut-off current of C/10. The second stage involved a low-rate discharge and charge characterization at C/25, which was used to determine the cell’s open-circuit voltage (pseudo-OCV) profile. The first stage of characterization provided data on the remaining capacity of the battery which linked to the evolution of LLI, while the second stage was used to estimate the negative electrode capacity which is linked to LAMNE.
As shown in Figure 2, cell 1 experienced a linear decline in SoH during the first 700 Equivalent Full Cycles (EFC) and an acceleration of the slope after 700 EFC and 85% of SoH. Cells 2 and 3 have a similar aging pattern with an acceleration of capacity fade around 1200 FEC and 75%. Cells do not age at the same rate but undergo the same forms of aging with two slopes. The first slope corresponds to a first-life application, and it is commonly considered as LLI. One EFC corresponds to a transfer of charge equal to the cell’s nominal capacity. Subsequently, there was a marked decrease in cell capacity.

2.2. Negative Electrode Material Characterization

The pristine cell is dismantled and each electrode is characterized in a coin cell to obtain the pseudo-OCP of each electrode. The pristine cell is opened at SoC = 0%. The negative electrode is then in a delithiated state, and the positive electrode is relatively lithiated. The pseudo-Open Circuit Potential (pseudo-OCP) can be measured thanks to the coin cell at a low C/25 rate during lithiation or delithiation. The electrical characterization of electrode materials is conducted using a half-cell setup in the CR2032 button cell represented in Figure 3. This setup is achieved by dismantling a new cell at a state of charge of 0%. In this reassembling in half cell, each electrode is set in a coin cell, face to face with a lithium foil used as counter electrode. Each electrode, comprising the current collector and the active material, is then characterized like the full cell with a C/25 charge and discharge current. In the context of the coin cell, the capacity of the coin cell is considered as the surface ratio of the sample by the full electrode multiplied by the nominal capacity of the cell. The use of a C/25 rates to obtain the pseudo-OCP allows us to overlook the cell’s impedance and the resulting overvoltage on the pseudo-OCP.
Cells are dismantled at 0% of SoC. In this state, the negative electrode should be mostly delithiated and the positive electrode mostly lithiated. After the reassembly in a half cell of each electrode, the negative electrode needs to be fully delithiated and the positive electrode is fully lithiated in order to reach the limit of use of each electrode prior to measuring each pseudo-OCP. Thus, the delithiation of the negative electrode gives 0 mAh as expected and few milliampere-hour were still available in the positive electrode: 0.572 mAh in the coin cell, corresponding to 23% of the total capacity of the positive electrode. As a result, we are able to measure the remaining capacity of each electrode. Tests were carried out on several coin cells, and the same results were obtained for each electrode. Only one coin cell is presented for each electrode in Figure 4. The remaining capacity of each electrode is measured. This unused capacity in the positive electrode led to a capacity offset between the potential curves of the two electrodes in a full cell, which is named ΔQoffset, as illustrated in Figure 5a. The capacity offset corresponds to the loss of capacity in the cell due to the first formation of an SEI (Solid Electrolyte Interphase) on the graphite electrode. This value is necessary to build a full cell model based on each electrode pseudo-OCP to reconstruct the pseudo-OCV as illustrated in Figure 5a. This value can increase in use, due to increasing SEI on the electrode, leading to an additional capacity loss ΔQLLI.
During the charging process of an 18650 graphite/LFP cell, it is important to note that the LFP electrode undergoes delithiation, while the graphite electrode undergoes lithiation. Consequently, the pseudo-OCP of each electrode is obtained during delithiation for the LFP and lithiation for the graphite. The measured residual capacity in the electrode corresponds to the ΔQoffset in Figure 5. To replicate these operational conditions, the coin cell designated for the LFP electrode is charged, whereas the coin cell for the graphite electrode is discharged. Figure 4 displays the OCP for both the LFP electrode and the graphite electrode under these specific operating conditions. Measuring the pseudo-OCPs of each electrode from Figure 4 is a key feature to reconstructing the pseudo-OCV of a full cell in Figure 5a.
The pseudo-OCP for the graphite electrode in Figure 4a shows multiple distinct potential plateaus that correlate with the electrode’s lithiation stages [23]. These states are represented as successive potential plateaus and voltage jumps during the lithiation or delithiation processes. A noticeable potential jump occurs at each transition between these plateaus. These transition points are documented in the literature, with each corresponding to a specific state of lithiation [24]. These potential jumps appear as characteristic peaks from Differential Voltage Analysis (DVA) while the potential plateaus appear as characteristic peaks from Incremental Capacity Analysis (ICA). However, the OCP of the positive LFP electrode, shown in Figure 4b, exhibits a flat profile, unlike the negative electrode. This flat profile is a direct consequence of the material’s two-phase operating properties [9,15]. Due to the absence of peaks, the state of health (SoH) of the LFP electrode cannot be effectively monitored using the proposed method.

3. Method of Estimation for the Loss of Active Material at the Negative Electrode

This section presents a diagnosis method used to detect the aging of active material at the negative electrode. First, the evolution of the cell’s pseudo-OCV is presented for two typical aging scenarios. The respective impact of LLI and LAMNE on the cell’s pseudo-OCV is demonstrated. Then, the diagnosis method for LAMNE is presented and then, SoHNE can be retrieved.

3.1. Influence of LLI and LAMNE on the Cell Pseudo-OCV

The cell’s pseudo-OCV can be reconstructed based on each electrode pseudo-OCP as presented in Figure 5a. Figure 5b,c present the impacts of the two aging scenarios that can appear in a cell: LLI and LLI + LAMNE. Their respective impacts on the negative electrode pseudo-OCP and the cell pseudo-OCV are depicted in Figure 5b,c. This reconstruction correlates the potential jumps and plateaus of the graphite electrode on the cell pseudo-Open Circuit Voltage (OCV) because of the flat profile of the pseudo-OCP of the positive electrode. The pseudo-OCP for a full-size electrode is the same as the pseudo-OCP obtained with the data collected in coin cells, taking into account a scaling factor that depends on the ratio of the surface area of the coin cell sample to that of the full cell electrode. For a fresh cell, there is an offset between the pseudo-OCVs of each electrode due to the initial formation of the SEI after cell fabrication in Figure 5. This value ΔQoffset is obtained in Section 2.2. Figure 5b displays the pseudo-OCP of both electrodes and the OCV of the cell assuming the first aging scenario with LLI only. In this case, the gap between the OCPs of the two electrodes widens. Figure 5c depicts the second aging scenario that combined aging involving both LLI and LAMNE. Here, the offset between the OCPs of the two electrodes increases in the same way as in Figure 5b. But, in Figure 5c, the spacing between the potential jumps diminishes at the same time. This is due to a shrinkage of the negative electrode pseudo-OCP. This finding is consistent with the analysis by Birkl et al. showing the impact of a drop in the quantity of exploitable graphite compared to a reference cell [18]. Depending on the aging type, certain peaks might become indiscernible in the cell’s OCV, rendering them unusable. For instance, in Figure 5b, the peak L i C 12 (for a state of charge of the negative electrode, SoCNE, of 60%) vanishes from the pseudo-OCV curve due to extensive aging caused by LLI.
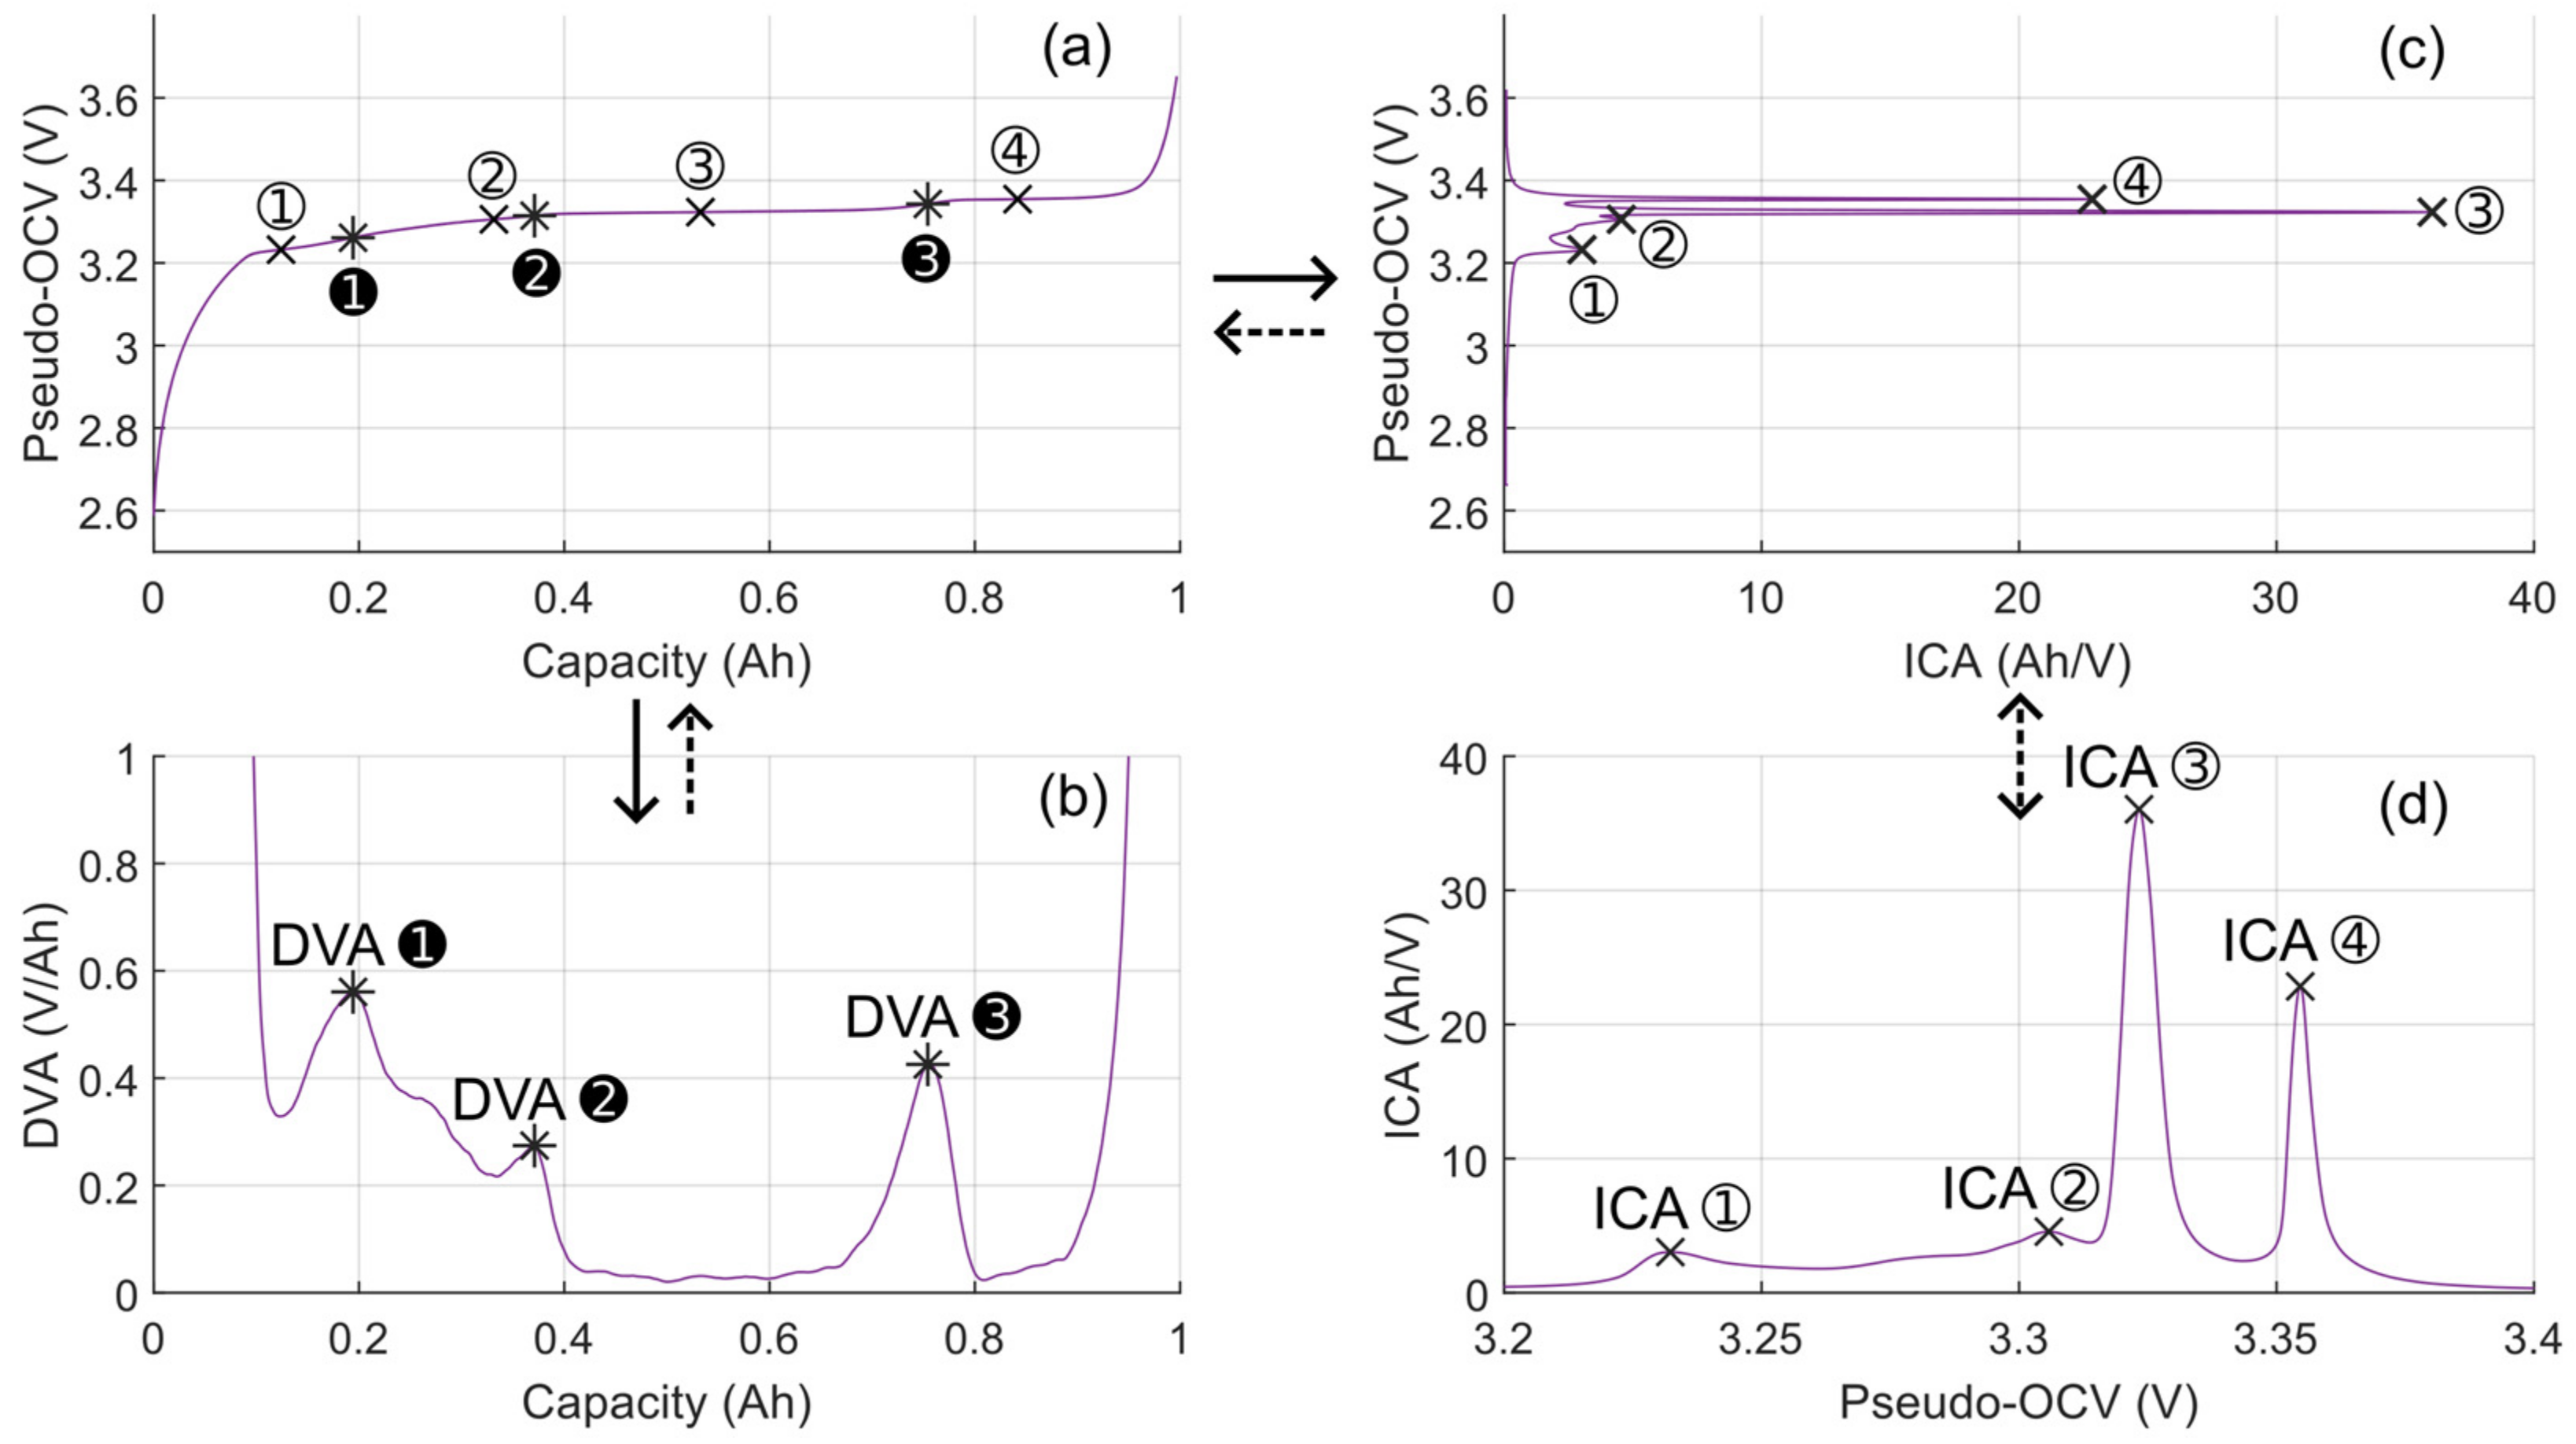
The detection of potential jumps and plateaus can be difficult with pseudo-OCV curves. The determination of these features can be effectively facilitated using Incremental Capacity Analysis (ICA) and Differential Voltage Analysis (DVA) techniques as they appear as peaks (Figure 6). Only the pseudo-OCV was filtered using mobile average prior to using ICA and DVA. Resampling of the pseudo-OCV was also necessary prior to the computation of ICA techniques. Indeed, potential jumps on the pseudo-OCV appear as peaks on the DVA curves (i.e., ❶, ❷, and ❸). Similarly, the potential plateaus appear as peaks on the ICA curves (i.e., ①, ②, ③, and ④). These methods are principally employed for identifying voltage drops and plateaus within a cell’s pseudo-OCV. In the context of our study, ICA and DVA are applied to the pseudo-OCV of the cell and the pseudo-Open Circuit Potential (pseudo-OCP) of the negative electrode. Peaks observed in the ICA and DVA data serve as indicators, pinpointing the precise locations of voltage drops and the central points of voltage plateaus.
The pseudo-OCV curve shrinkage, resulting from capacity loss ( Q l o s s ) depends on the aging phenomenon. Figure 7a,b represent the evolution of a cell’s pseudo-OCV (every 500 cycles) in the cases of LLI and LLI + LAMNE aging, respectively. Figure 7b is obtained from experimental data, while Figure 7a is obtained from a simulation of aging of a cell without LAMNE using pseudo-OCP curves, as shown in Figure 5a,b. An offset of 0.05 V is applied between each pseudo-OCV to improve the reading. Indeed, peaks from DVA do not move with aging instead of ICA peaks due to LLI, as illustrated in Figure 7a. ICA peaks ③ and ④ have a change of localization due to plateau shrinkage. The shift in peaks caused by the LAMNE is presented in Figure 7b, which considers combined aging (LLI and LAMNE). All the peaks move the capacity of the negative electrode: a lower charged capacity between each peak is correlated to a lower lithiation or delithiation of the electrode for the same change in the electrode state of charge. Values are listed in Table 1. These values are based on the measurements of the negative electrode in Figure 4a.
The proposed diagnosis method uses the capacity variation between pairs of peaks to estimate the electrode capacity, and finally, to estimate the electrode state of health. The electrode capacity fading due to LAMNE can be estimated thanks to the shrinking distance between the three DVA peaks, as their positions do not change with aging due to LLI. The same comment can be made for ICA; i.e., peaks ① and ②, since they do not move with the aging caused by LLI.

3.2. Method for the Estimation of the Negative Electrode State of Health SoHNE

This section introduces a computational method designed to estimate the capacity and the SoHNE based on the peak displacement along with aging. The proposed estimation solution involves detecting the charged capacity ΔQ (represented in Figure 5) between two specific peaks, which are identified during the cell’s characterization process. The peaks are directly dependent on the state of charge of the negative electrode (SoCNE). By measuring a change in capacity between two known peaks, it is then possible to determine the capacity of the electrode between two defined states of charge and, consequently, assess the total capacity of the negative electrode. By knowing two such peaks on the negative electrode, labeled ‘A’ and ‘B’, we can determine the capacity ΔQ of the negative electrode between these points. Therefore, the estimation of the negative electrode’s capacity (QNE) in Equation (2) is accomplished by correlating the capacity measured between two peaks with the standard state of charge of the electrode (SoCNE) defined in Table 1.
Q N E = Δ Q S o C N E A S o C N E B
The SoHNE expressed by Equation (3) is defined similarly to the cell SoH. It is the ratio of the estimated capacity of the negative electrode in a given aging state, QNE, to the measured capacity, QNE0, at the first cycle:
S o H N E = Q N E Q N E 0
These estimators can use various combinations of peaks. Table 2 presents four estimators designed to evaluate the capacity of the negative electrode. Each estimator uses a combination of two peaks, ‘A’ and ‘B’, identified in Table 2. The standard state of charge value (QNE) for each peak is recapped in Table 2.
The four estimators from the presented method are tested on both aging scenarios, LLI and LLI + LAMNE. The theoretical cell capacity is also given. The evolution of the capacity of the cell is the same in both aging scenarios because the same ΔQLLI value was used. Moreover, the pseudo-OCP of the negative is always larger than the working area of the full cell, as it is illustrated in Figure 5. All the estimators are tested every 500 cycles from 0 to 3000 cycles, as represented in Figure 7. The results of the four estimators applied on both aging scenarios are presented in Table 3.
Estimators Neg1 and Neg2, defined for the largest SoCNE range, become inoperable after a certain number of cycles, specifically at 1000 or 1500 cycles depending on the aging scenario. They can be used up to a limit of 85% of SoH, as shown in Figure 8. This limitation can be attributed to the disappearance of peak ❸ corresponding to LiC12 from the pseudo-OCV, as explained in Section 3.1 and depicted in Figure 7b. The disappearance of peak 3 is due to LLI aging in the cell. In contrast, Estimators 3 (Neg3) and 4 (Neg4) do not face this issue, owing to their reliance on peaks at lower states of charge. However, estimators 3 and 4 seem more sensitive to variations and data accuracy due to the use of peaks that are closer to one another in the diagnosis. Nonetheless, Estimators 1 and 2 serve as useful tools for cross checking the results obtained with Estimators 3 and 4 within their operational range.
In the case of aging with LLI only, all estimators give a result of 100% of SoH with an uncertainty of more or less 1%. This result is in good agreement with a case with no aging for the negative electrode. On the contrary, in the case of LLI + LAMNE, a decrease in SoHNE is detected in the second aging scenario, indicating a loss of capacity in the negative electrode.

4. Results and Discussion

In this section, all estimators are tested on three real cells aged from a pristine state to 40% of SoH. Figure 8 presents the evolution of the cell SoH and the result of the estimation of SoHNE from the four estimators Neg1, Neg2, Neg3, and Neg4. Prior to cycling, all estimators are tested on cells 1, 2, and 3. All estimations give similar results for the cell capacity, QNE. All the cells have a loss of capacity resulting in the decrease in the cell’s SoH which corresponds to LLI. LAMNE is detected because of a decrease in SoHNE after a few hundred cycles. SoH and SoHNE do not evolve at the same pace as presented in Figure 8.
The estimations of SoHNE, using estimators 1 and 2, show a divergent aging pattern compared to estimators 3 and 4. Estimators 1 and 2 suggest a quicker aging process until they reach the point of being unusable (between 1000 and 1500 EFC). The peaks of the negative electrode are related to its SoCNE and correspond to constant lithiation states, implying that the proportions of charged capacities between these points should remain constant. However, the observed discrepancies in aging rates between Estimators 1 and 2 and 3 and 4 challenge this assumption. A possible explanation for this discrepancy could be a shift in the position of LiC12 on the cell’s pseudo-OCV. Peak ❸ is then very close to the sharp rise in cell voltage caused by a significant increase in positive electrode potential. By superposition with the negative electrode, this sharp pseudo-OCP curve imposed by the positive electrode leads to a more pronounced shift of the peak on the cell’s pseudo-OCV than the shift that actually occurs in the pseudo-OCP of the negative electrode (cf. Figure 5). This abrupt change in voltage affects the measurement of the position of peak ❸ by causing a shift, hence explaining the estimation discrepancy.
All estimators presented in Figure 8 follow the same aging pattern: a slow decrease in the state of health at the beginning and an acceleration after several hundred cycles of use. This aging pattern could be compared to a polynomial of order two or an exponential function. The shape of the cell SoH can be approximated by two successive slopes. Table 4 compares the average SoH loss per 50 EFC for the 3 cells and for the negative electrodes Neg3 and Neg4, from 0 to 500 EFC, and 1200 to 2500 EFC. The SoHNE loss for the 3 cells per 50 EFC from 0 to 500 EFC is low for both estimators (Neg3) and 4 (Neg3), contrary to the cell SoH. However, both SoH and SoHNE increase significantly with aging, with similar increases. SoH and SoHNE increase almost by 1 for cell 1, 0.4 for cell 2, and 0.3 for cell 3. These results suggest the negative electrode has a huge impact on the cell’s overall state of health, particularly in long-term aging and low cell SoH. As a result, the decrease in the cell SoH is due to LLI and LAMNE. LLI has a high impact in the first life and LAMNE has an impact on long-term aging and the onset of acceleration. The increase in the rate for the capacity loss at the negative electrode is higher than the capacity loss for the cell after 1200 EFC: the appearance of the aging knee is correlated with an acceleration of capacity loss at the negative electrode after 1200 EFC.
All indicators increased by almost the same value for the cell or the negative electrode: +0.9 for the cell 1 and +1.15/+1.28 for Neg3/Neg4; +0.4 for cell 2 and +0.6/+0.62 for Neg3/Neg4; +0.3 for cell 3 and +0.38/+0.41 for Neg3/Neg4. Our hypothesis is a local blockage of access to some of the graphite particles for the remaining cycling lithium in this area. As a result, a fraction of the electrode is lost leading to a loss of the remaining lithium in this area. As a result, a supplementary capacity loss occurs. However, this hypothesis can only be verified by a post-mortem study.
The decrease in the SoHNE and the impact on the cell capacity can be explained by different formation mechanisms leading to a loss of graphite: (i) a fully functional electrode, except for small local areas rendered non-functional due to isolation of the active material by various processes (isolation by an insulating deposit on the electrode surface, loss of contact with the current collector, cracking and exfoliation, etc.); (ii) an electrode with a blockage of a few graphite particles evenly distributed over the electrode; or (iii) a composition of the two previous phenomena. The first mechanism can explain the direct loss of the cell capacity due to the impossibility of inserting lithium into certain zones of the electrode. This assumption is in good agreement with experimental results for cell 1. However, we can observe a difference in slope in long-term aging between the SoH of the cell and the electrode SoHNE for cells 2 and 3. The second proposed mechanism enables lithium to be inserted into an adjacent graphite particle adjacent to the inaccessible one. This mechanism means that some of the lithium is still usable despite a loss of active material at the negative electrode. For cells 2 and 3, the difference in slope between SoHNE and SoH seems to indicate a composition of both mechanisms. A post-mortem study is underway to determine the actual mechanisms involved in G/LFP cells in long-term aging.

5. Conclusions

The estimation method enables a detailed observation of the aging dynamics of the negative electrode, independent of the overall aging of the cell. This method can be applied using several pairs of points. This choice may involve a change in operation over the entire usage or a partial operation. The proposed method reveals the electrode-aging behavior in long-term use. The aging of the cell increases over time. Meanwhile, the negative electrode shows higher aging in long-term use than in first-life applications (for a cell’s SoH over 80%). Moreover, this study has revealed a similar aging pattern between the cell and the negative electrode, with an acceleration of the aging of the cell while the negative electrode degrades rapidly.
Upcoming research efforts will concentrate on exploring the relationship between the aging of the negative electrode and the cell’s overall aging process. A work based on postmortem analysis may provide additional information to explain the aging dynamic of the electrode and the acceleration of capacity fade of the cell. Complementary work on the diagnosis of the negative electrode will aim to develop an operational law that comprehensively considers factors influencing the long-term health state of the cell. Finally, additional experiments on other aging conditions are being conducted using various stress tests to investigate the impact of different types of use on the degradation of the cell and the negative electrode capacity. Studying the impact of the negative electrode aging on the cell is necessary to assess the possibility of reuse in second-life applications.

Author Contributions

Conceptualization, W.W., Y.B., P.V., A.S. and E.R.; methodology, W.W., Y.B., P.V., A.S. and E.R.; visualization, W.W., Y.B., P.V., A.S. and E.R.; data curation, W.W.; writing—original draft, W.W.; formal analysis, W.W., Y.B., P.V., A.S. and E.R.; investigation, W.W.; writing—review and editing, W.W., Y.B., P.V., A.S. and E.R.; funding acquisition, Y.B., P.V., A.S. and E.R.; project administration, Y.B., P.V. and A.S. All authors have read and agreed to the published version of the manuscript.

Funding

This research was funded by EVE System and ANRT, grant number CIFRE 2018/1625.

Data Availability Statement

The raw data supporting the conclusions of this article will be made available by the authors on request.

Conflicts of Interest

The authors declare that they have no known competing financial interests or personal relationships that could have appeared to influence the work reported in this paper. Author Elie Riviere is employee of EVE System company, who provided funding and technical support for the work. The funder had no role in the design of the study; in the collection, analysis, or interpretation of data, in the writing of the manuscript, or in the decision to publish the results.

References

  1. Mann, M.; Babinec, S.; Putsche, V. Energy Storage Grand Challenge: Energy Storage Market Report; U.S. Department of Energy Office of Scientific and Technical Information: Oak Ridge, TN, USA, 2020. [CrossRef]
  2. Martinez-Laserna, E.; Sarasketa-Zabala, E.; Sarria, I.V.; Stroe, D.-I.; Swierczynski, M.; Warnecke, A.; Timmermans, J.-M.; Goutam, S.; Omar, N.; Rodriguez, P. Technical Viability of Battery Second Life: A Study From the Ageing Perspective. IEEE Trans. Ind. Appl. 2018, 54, 2703–2713. [Google Scholar] [CrossRef]
  3. Quinard, H.; Redondo-Iglesias, E.; Pelissier, S.; Venet, P. Fast Electrical Characterizations of High-Energy Second Life Lithium-Ion Batteries for Embedded and Stationary Applications. Batteries 2019, 5, 33. [Google Scholar] [CrossRef]
  4. Klett, M.; Eriksson, R.; Groot, J.; Svens, P.; Högström, K.C.; Lindström, R.W.; Berg, H.; Gustafson, T.; Lindbergh, G.; Edström, K. Non-uniform aging of cycled commercial LiFePO4//graphite cylindrical cells revealed by post-mortem analysis. J. Power Sources 2014, 257, 126–137. [Google Scholar] [CrossRef]
  5. Baumhöfer, T.; Brühl, M.; Rothgang, S.; Sauer, D.U. Production caused variation in capacity aging trend and correlation to initial cell performance. J. Power Sources 2014, 247, 332–338. [Google Scholar] [CrossRef]
  6. Harris, S.J.; Harris, D.J.; Li, C. Failure statistics for commercial lithium ion batteries: A study of 24 pouch cells. J. Power Sources 2017, 342, 589–597. [Google Scholar] [CrossRef]
  7. Mathieu, R.; Briat, O.; Gyan, P.; Vinassa, J.-M. Fast charging for electric vehicles applications: Numerical optimization of a multi-stage charging protocol for lithium-ion battery and impact on cycle life. J. Energy Storage 2021, 40, 102756. [Google Scholar] [CrossRef]
  8. Mathieu, R.; Briat, O.; Gyan, P.; Vinassa, J.-M. Comparison of the impact of fast charging on the cycle life of three lithium-ion cells under several parameters of charge protocol and temperatures. Appl. Energy 2021, 283, 116344. [Google Scholar] [CrossRef]
  9. Ecker, M.; Nieto, N.; Käbitz, S.; Schmalstieg, J.; Blanke, H.; Warnecke, A.; Sauer, D.U. Calendar and cycle life study of Li(NiMnCo)O2-based 18650 lithium-ion batteries. J. Power Sources 2014, 248, 839–851. [Google Scholar] [CrossRef]
  10. Dubarry, M.; Liaw, B.Y.; Chen, M.-S.; Chyan, S.-S.; Han, K.-C.; Sie, W.-T.; Wu, S.-H. Identifying battery aging mechanisms in large format Li ion cells. J. Power Sources 2011, 196, 3420–3425. [Google Scholar] [CrossRef]
  11. Bloom, I.; Jansen, A.N.; Abraham, D.P.; Knuth, J.; Jones, S.A.; Battaglia, V.S.; Henriksen, G.L. Differential voltage analyses of high-power, lithium-ion cells: 1. Technique and application. J. Power Sources 2005, 139, 295–303. [Google Scholar] [CrossRef]
  12. Pastor-Fernández, C.; Uddin, K.; Chouchelamane, G.H.; Widanage, W.D.; Marco, J. A Comparison between Electrochemical Impedance Spectroscopy and Incremental Capacity-Differential Voltage as Li-ion Diagnostic Techniques to Identify and Quantify the Effects of Degradation Modes within Battery Management Systems. J. Power Sources 2017, 360, 301–318. [Google Scholar] [CrossRef]
  13. Ma, Z.; Jiang, J.; Shi, W.; Zhang, W.; Mi, C.C. Investigation of path dependence in commercial lithium-ion cells for pure electric bus applications: Aging mechanism identification. J. Power Sources 2015, 274, 29–40. [Google Scholar] [CrossRef]
  14. Berecibar, M.; Gandiaga, I.; Villarreal, I.; Omar, N.; Van Mierlo, J.; Van Den Bossche, P. Critical review of state of health estimation methods of Li-ion batteries for real applications. Renew. Sustain. Energy Rev. 2016, 56, 572–587. [Google Scholar] [CrossRef]
  15. Dubarry, M.; Truchot, C.; Liaw, B.Y. Synthesize battery degradation modes via a diagnostic and prognostic model. J. Power Sources 2012, 219, 204–216. [Google Scholar] [CrossRef]
  16. Dubarry, M.; Truchot, C.; Liaw, B.Y.; Gering, K.; Sazhin, S.; Jamison, D.; Michelbacher, C. Evaluation of commercial lithium-ion cells based on composite positive electrode for plug-in hybrid electric vehicle applications. Part II. Degradation mechanism under 2C cycle aging. J. Power Sources 2011, 196, 10336–10343. [Google Scholar] [CrossRef]
  17. Riviere, E.; Sari, A.; Venet, P.; Meniere, F.; Bultel, Y. Innovative Incremental Capacity Analysis Implementation for C/LiFePO4 Cell State-of-Health Estimation in Electrical Vehicles. Batteries 2019, 5, 37. [Google Scholar] [CrossRef]
  18. Birkl, C.R.; Roberts, M.R.; McTurk, E.; Bruce, P.G.; Howey, D.A. Degradation diagnostics for lithium ion cells. J. Power Sources 2017, 341, 373–386. [Google Scholar] [CrossRef]
  19. Liu, P.; Wang, J.; Hicks-Garner, J.; Sherman, E.; Soukiazian, S.; Verbrugge, M.; Tataria, H.; Musser, J.; Finamore, P. Aging Mechanisms of LiFePO4 Batteries Deduced by Electrochemical and Structural Analyses. J. Electrochem. Soc. 2010, 157, A499. [Google Scholar] [CrossRef]
  20. Castro, L.; Dedryvère, R.; Ledeuil, J.-B.; Bréger, J.; Tessier, C.; Gonbeau, D. Aging Mechanisms of LiFePO4//Graphite Cells Studied by XPS: Redox Reaction and Electrode/Electrolyte Interfaces. J. Electrochem. Soc. 2012, 159, A357–A363. [Google Scholar] [CrossRef]
  21. Kassem, M.; Delacourt, C. Postmortem analysis of calendar-aged graphite/LiFePO4 cells. J. Power Sources 2013, 235, 159–171. [Google Scholar] [CrossRef]
  22. United Nations. Proposal for a New Global Technical Regulation on the Worldwide Harmonized Light Vehicles Test Procedure (WLTP). 2013. Available online: https://unece.org/DAM/trans/doc/2014/wp29/ECE-TRANS-WP29-2014-027e.pdf (accessed on 5 January 2024).
  23. Ohzuku, T.; Iwakoshi, Y.; Sawai, K. Formation of Lithium-Graphite Intercalation Compounds in Nonaqueous Electrolytes and Their Application as a Negative Electrode for a Lithium Ion (Shuttlecock) Cell. J. Electrochem. Soc. 1993, 140, 2490–2498. [Google Scholar] [CrossRef]
  24. Yazami, R.; Reynier, Y. Thermodynamics and crystal structure anomalies in lithium-intercalated graphite. J. Power Sources 2006, 153, 312–318. [Google Scholar] [CrossRef]
Figure 1. (a) Vehicle speed and (b) discharge current derived from the WLTP test procedure.
Batteries 10 00137 g001
Figure 2. Evolution of the cell’s state of health during the experiment.
Batteries 10 00137 g002
Figure 3. Detailed structure of a CR2032 button cell for the electrochemical characterization of electrode materials.
Batteries 10 00137 g003
Figure 4. Characterization of the pseudo-Open Circuit Potential (Pseudo-OCP) for (a) the negative electrode and (b) the positive electrode. Characterization was performed on CR2032 button cells; electrodes were taken from a new 18650 cell. SoCNE are rounded values from Table 1.
Batteries 10 00137 g004
Figure 5. Pseudo-OCP for the LFP electrode and the graphite electrode and reconstructed pseudo-OCV for a cell in the case of (a) a fresh cell, (b) an aged cell with Loss of Lithium Inventory (LLI) and without loss of active material in the negative electrode (LAMNE), and (c) an aged cell with LLI and LAMNE. SoCNE are rounded values from Table 1.
Batteries 10 00137 g005
Figure 6. (a) Detection of peaks on the pseudo-OCV of a cell is performed using (b) Differential Voltage Analysis (DVA) and (c) Incremental Capacity Analysis (ICA) techniques. (d) Presents the same data as in (c) with reversed axes to simplify interpretation.
Batteries 10 00137 g006
Figure 7. Example of evolution of the pseudo-OCV of a cell during aging for (a) the loss of pure cycling lithium in scenario 1 (LLI) and (b) the combination of LLI and loss of active material at the negative electrode in scenario 2 (LLI + LAMNE). An offset of +0.05 V is applied to each pseudo-OCP.
Batteries 10 00137 g007
Figure 8. Cells’ SoH are shown in black. Evaluation of the SoHNE during cycling for (a) cells 1, (b) cell 2, and (c) cell 3 using estimators Neg1, Neg2, Neg3, and Neg4.
Batteries 10 00137 g008
Table 1. Reference values obtained from the characterization of the graphite electrode and references to the corresponding peak.
Theoretical Lithiation State C L i C 54 L i C 36 L i C 18 L i C 12
Corresponding peakSoC = 0% *
Measured SoCNE (fresh electrode)09.4%15.4%27.4%60.4%
* The end of discharge or the start of charge, correspond to SoC = 0%.
Table 2. Proposed diagnosis indicators.
Estimation MethodPeak ASoCNE (A)Peak BSoCNE (B)
Neg1SoC = 0% *0%60.4%
Neg29.4%60.4%
Neg39.4%27.4%
Neg415.4%27.4%
* The end of discharge or the start of charge, correspond to SoC = 0%.
Table 3. Results of the estimation method for SoHNE on both simulated aging scenarios: LLI and LLI + LAMNE. Estimators Neg1 and Neg2 are unusable when peak ❸ disappears.
Estimation MethodCycle 0Cycle 500Cycle 1000Cycle 1500Cycle 2000Cycle 2500Cycle 3000
Aging scenario with LLI onlyCell’s SoH100%89%82%74%68%63%58%
Neg1100%99%99%////
Neg2100%100%99%////
Neg3100%101%101%101%100%99%99%
Neg4100%101%100%100%100%99%99%
Aging scenario with LLI + LAMNECell’s SoH100%89%82%74%68%63%58%
Neg1100%98%95%88%///
Neg2100%98%95%88%///
Neg3100%94%91%85%79%76%74%
Neg4100%92%88%83%77%74%72%
Table 4. Average capacity loss for cell 2 and estimators 3 and 4 between 0 and 500, and 1200 and 2500 full equivalent cycles.
SoHAverage SoH Loss (for 50 EFC) between 0 and 500 EFCAverage SoH Loss (for 50 EFC) for the Last 1300 EFC
Cell 1Cell1.1%2.0%
Neg30.07%1.22%
Neg40.18%1.46%
Cell 2Cell1.0%1.4%
Neg30.08%0.68%
Neg40.13%0.75%
Cell 3Cell1.1%1.4%
Neg30.01%0.39%
Neg40.03%0.44%
Disclaimer/Publisher’s Note: The statements, opinions and data contained in all publications are solely those of the individual author(s) and contributor(s) and not of MDPI and/or the editor(s). MDPI and/or the editor(s) disclaim responsibility for any injury to people or property resulting from any ideas, methods, instructions or products referred to in the content.

