
Proposal of Practical Sound Source Localization Method Using Histogram and Frequency Information of Spatial Spectrum for Drone Audition

Department of Mechanical Engineering, School of Engineering, Tokyo Institute of Technology, 2-12-1 Ookayama, Meguro-ku, Tokyo 152-8552, Japan
*
Author to whom correspondence should be addressed.
Drones 2024, 8(4), 159; https://doi.org/10.3390/drones8040159
Submission received: 25 March 2024
/
Revised: 10 April 2024
/
Accepted: 16 April 2024
/
Published: 18 April 2024
(This article belongs to the Special Issue Technologies and Applications for Drone Audition)
Abstract
:A technology to search for victims in disaster areas by localizing human-related sound sources, such as voices and emergency whistles, using a drone-embedded microphone array was researched. One of the challenges is the development of sound source localization methods. Such a sound-based search method requires a high resolution, a high tolerance for quickly changing dynamic ego-noise, a large search range, high real-time performance, and high versatility. In this paper, we propose a novel sound source localization method based on multiple signal classification for victim search using a drone-embedded microphone array to satisfy these requirements. In the proposed method, the ego-noise and target sound components are extracted using the histogram information of the three-dimensional spatial spectrum (azimuth, elevation, and frequency) at the current time, and they are separated using continuity. The direction of arrival of the target sound is estimated from the separated target sound component. Since this method is processed with only simple calculations and does not use previous information, all requirements can be satisfied simultaneously. Evaluation experiments using recorded sound in a real outdoor environment show that the localization performance of the proposed method was higher than that of the existing and previously proposed methods, indicating the usefulness of the proposed method.
1. Introduction
Rescuing the victims of natural disasters such as earthquakes is one of the most important tasks. The 2023 Turkey-Syria earthquake killed more than fifty thousand people [1,2]. The key factor in search and rescue operations for victims is promptness. It is said that survival rates decrease beyond 72 h after a disaster, which is known as the “Golden 72 h”. In recent years, various disaster robots have been developed for search and rescue operations [3]. In particular, drones, which can move quickly regardless of ground conditions, are attracting attention for prompt search and rescue operations, and search and rescue methods that utilize the characteristics of drones are being researched. Many of these methods are vision-based [4,5]. However, vision-based methods face difficulty in searches under poor lighting conditions or when victims are buried in rubble. In fact, in the 1995 Great Hanshin Earthquake, 77% of the fatalities were crushed victims who were buried in collapsed buildings and other structures [6], and the development of technology to search for victims who cannot be searched for with vision is needed.
Therefore, instead of visual information, using auditory information as an acoustic signal obtained from a drone-embedded microphone was considered. The research on handling acoustic signals with a drone-embedded microphone is called “Drone Audition”, and various studies on drone audition have been reported. In drone audition research, sound source localization (SSL) and sound source separation/enhancement (SSS/SSE) are often addressed. For example, Go et al. attached four microphone arrays to the underside of a drone and localized the source of impulse sounds using beamforming [7]. Wang et al. mounted a microphone array to the top of a drone and proposed a deep neural network (DNN)-based speech enhancement method [8]. Strauss et al. produced and published a dataset of acoustic signals recorded via a drone-embedded microphone array to advance drone audition research [9].
As part of research on drone audition, we investigated a technology to search for victims by localizing human-related sound sources (target sound sources), such as voices and emergency whistles, using a drone-embedded microphone array. This technology localizes the direction of arrival (DOA) of the target sound based on the time difference of arrival (TDOA) from the target to each microphone, and it searches for the location of the victim. Using acoustic signals, searching operations can be carried out even in poor lighting conditions or when victims are buried in rubble, which is a weakness of vision-based methods. One of the challenges of SSL using drone-embedded microphone arrays is achieving high SSL performance. Some approaches have been studied to overcome this challenge. The first is the development of microphone arrays. To increase the noise tolerance for SSL, microphone arrays consisting of different types and arrangements of microphones have been proposed [7,10,11,12]. The second is the development of SSL methods. To suppress the decline of localization performance due to the ego-noise of drones, low-noise propellers have been developed [13,14,15]. The third is the development of high-performance SSL methods. As described below, to improve various performances such as noise tolerance, real-time performance, and so on, SSL methods have been proposed.
In this paper, we addressed to develop a novel SSL method for practical use. The performance requirements for SSL methods in drone audition are as follows.
- High resolution: High-resolution SSL of the direction of the target sound source is required to accurately locate a victim.
- High noise tolerance: Because drones generate a large amount of ego-noise, high noise tolerance is required. In addition, ego-noise changes dynamically over time, so tolerance for dynamic noise is also required.
- Large search range: For prompt search operations, the range that can be localized in a single measurement must be large.
- High real-time performance: Real-time performance is important for prompt search operations. For high real-time performance, the computational cost must be low.
- High versatility: The method must be able to localize in any situation and with any drone.
To locate victims using acoustic signals, algorithms based on multiple signal classification (music) A common method is the SEVD-music (music based on Standard EigenValue Decomposition) [16], which is the original music method. The SEVD-music algorithm does not have noise suppression calculations, so it has a low noise tolerance. However, it achieves high real-time performance and versatility. To ensure noise tolerance, Nakamura et al. proposed GEVD-music (music based on Generalized EigenValue Decomposition) [17]. The GEVD-music models pre-records ego-noise and whiten noise through generalized eigenvalue decomposition. However, its tolerance for dynamic noise is low, and its computational cost is high. It also has low versatility because the ego-noise of the used drone must be recorded beforehand. To reduce the computational cost of the GEVD-music, Nakamura et al. proposed GSVD-music (music based on Generalized Singular Value Decomposition) [18] using generalized singular value decomposition instead of generalized eigenvalue decomposition. However, the computational cost is still high for real-time search operations. To improve the tolerance for dynamic noise and the versatility of GEVD-music and GSVD-music, Okutani et al. and Ohata et al. also proposed iGEVD-music (incremental GEVD-music) [19] and iGSVD-music (incremental GSVD-music) [20], which model noise by assuming the recorded sound a few seconds before the current time to be noise. These methods are able to cope with slowly changing dynamic noise. However, the ego-noise of a drone often changes quickly, and these methods cannot cope with this. As another approach to improving noise tolerance and reducing computational costs, Hoshiba et al. proposed the angle-limited SEVD-music, for which the DOA of ego-noise is specified and excluded from the SEVD-music search range [21]. Although this method ensures the tolerance for static noise and real-time performance, it could not cope with dynamic noise or different drones’ ego-noise with different noise characteristics because the excluded range is a fixed value. It also reduces the search range. Hoshiba et al. also proposed AFRF-music (music with Active Frequency Range Filtering), which dynamically creates a frequency filter by simply using the four arithmetic operations to eliminate the effect of ego-noise [22]. This method has a low computational cost and high versatility, and it can cope with slowly changing dynamic noise. However, similar to iGEVD-music and iGSVD-music, it cannot cope with quickly changing noise because the filter is created from the recorded sound a few seconds before the current time. The characteristics of each method are shown in Table 1.
The aim of this paper is to develop an SSL method with a drone-embedded microphone array that satisfies all of the following requirements: a tolerance for quickly changing dynamic noise, a large search range, high real-time performance, and high versatility. We propose HIST-music (music with HISTogram information), which dynamically estimates the ego-noise and target sound components of the spatial spectrum calculated via SEVD-music using the histogram information at the current time, and it separates them using continuity [23]. This method theoretically satisfies the above four requirements. However, depending on the DOA of the target sound, the localization performance decreases because the ego-noise and target sound components cannot be accurately separated. Therefore, we propose HIST-music-3D (three-dimensional HIST-music), which adds frequency information to the HIST-music method to accurately separate the ego-noise and target sound components. It is expected to improve localization performance by exploiting the difference in frequency characteristics between ego-noise and the target sound. The remainder of this paper is organized as follows: Section 2 describes the algorithms of HIST-music and HIST-music-3D. Section 3 evaluates and discusses the performance of the proposed method. Section 4 presents the conclusion.
2. Methods
This section describes the algorithms of the basic SSL method, SEVD-music, the proposed method, HIST-music, and its extended version, HIST-music-3D.
2.1. SEVD-Music
The M-channel input acoustic signal of the f-th frame is Fourier transformed to via the short-time Fourier transform (STFT). Here, is the frequency bin number. Using , the correlation matrix is defined as follows.
Here, is the number of frames used to average the correlation matrix, and is the complex conjugate transpose of Z. SEVD-music calculates eigenvectors via the standard eigenvalue decomposition of the .
Here, is the matrix with diagonal components that are eigenvalues in descending order, and is the matrix containing eigenvectors corresponding to . Using E and the transfer function corresponding to the sound source direction in the drone’s coordinates, the spatial spectrum is calculated as follows.
Here, L is the number of target sound sources, and is the m-th eigenvector in E. is defined as , which are the azimuth and elevation angles of the target sound direction in the drone’s coordinates, respectively. is summed over the direction to estimate the target sound direction.
Here, and are indices corresponding to the upper and lower limits of the frequency bin used for calculation, respectively. and represent the power of the sound arriving from the direction at the f-th frame. To detect the target sound direction , peak detection is performed for as follows.
2.2. HIST-Music
In order to improve the noise tolerance, search range, real-time performance, and versatility of SSL compared to the music-based methods introduced in Section 1, HIST-music was proposed. This method excludes the ego-noise component using only sound recorded at the current time, not pre-recorded or previously recorded sound, in order to increase the tolerance for quickly changing noise and versatility. It also performs only simple calculations to improve real-time performance. The algorithm is described below.
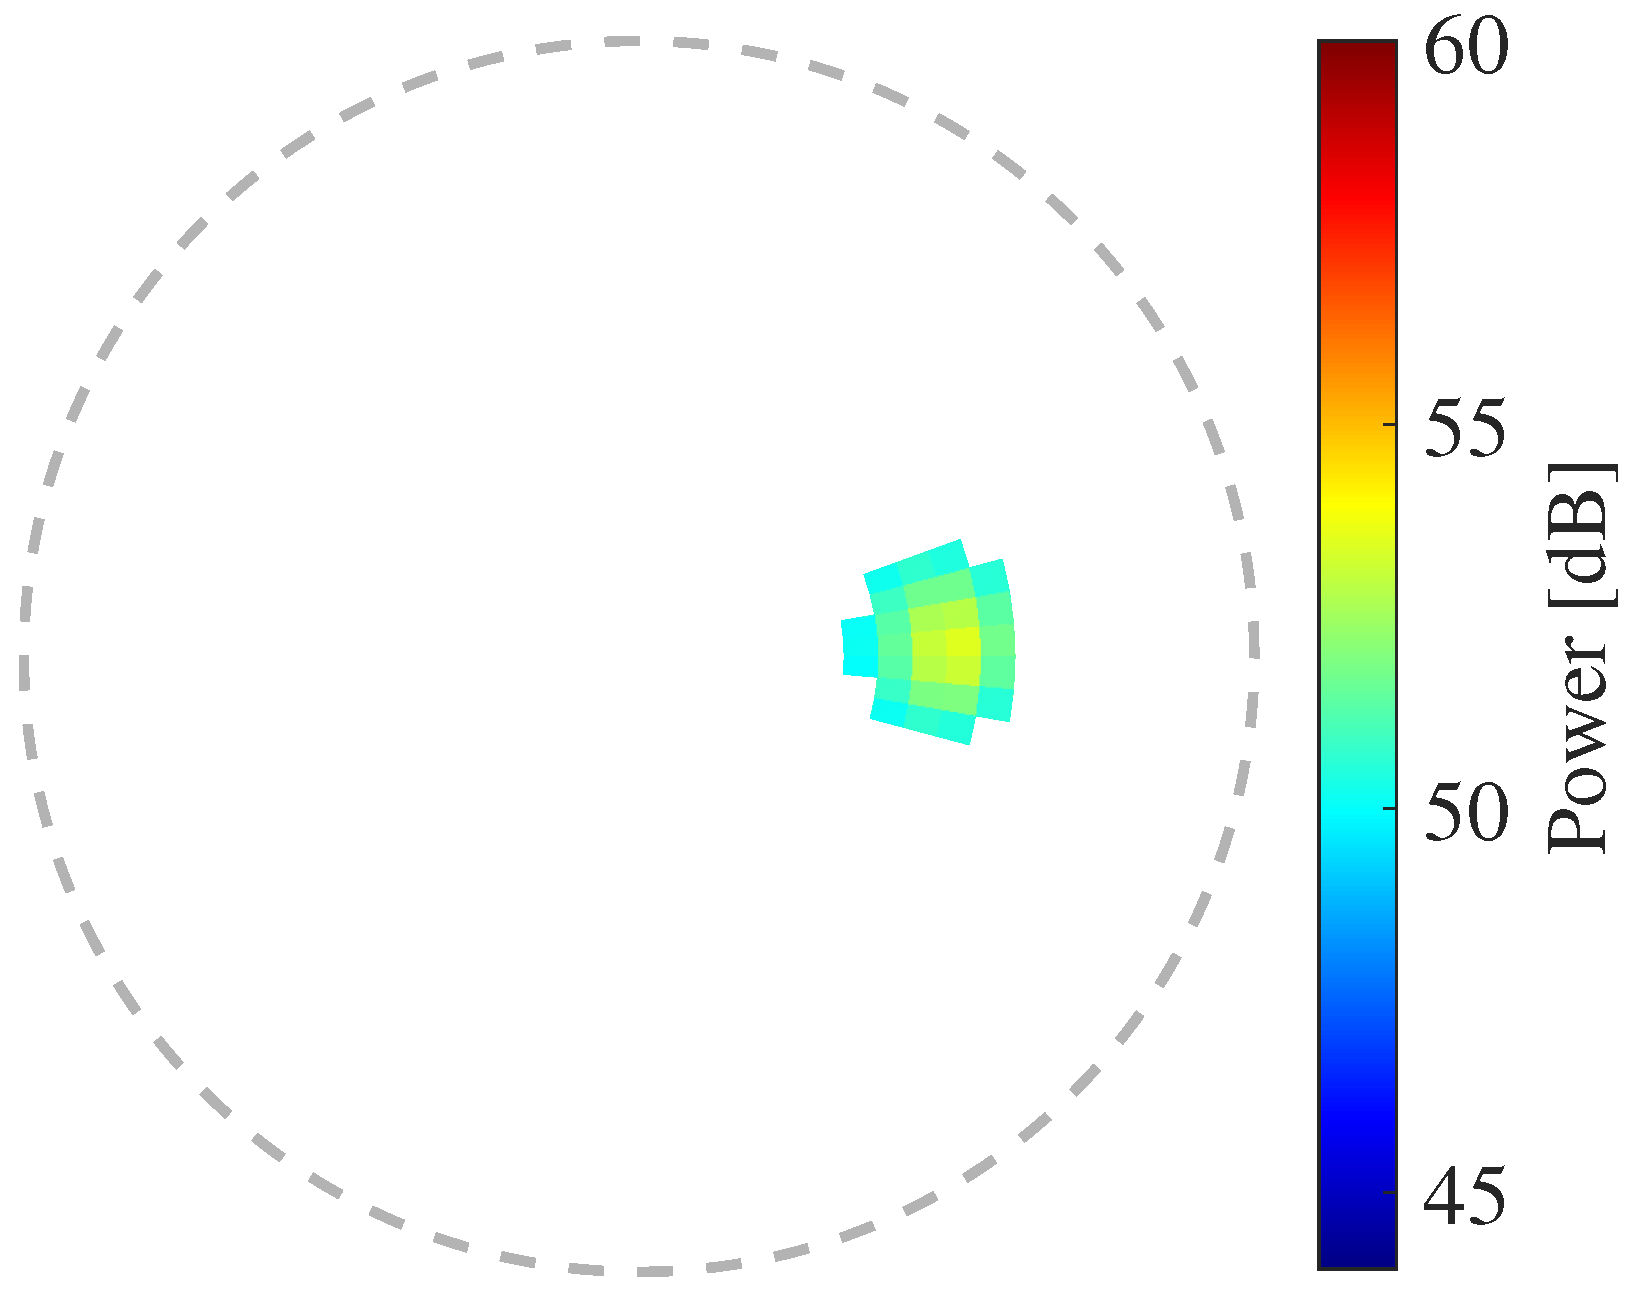
This method considers the case in which a microphone array is installed outside the rotors, as shown in Figure 1. In this case, ego-noise arrives the microphone array from one direction. An example of the spatial spectrum calculated via SEVD-music, plotted with the axes given in Figure 2, is shown in Figure 3. The circumferential and radial directions represent the azimuth and elevation angles, respectively. The sound power arriving from each direction is depicted in a color map. The high values on the left side of Figure 3 are the components of ego-noise, and the peak around is the component of the target sound.
If the peak of the target sound component is lower than the value of the ego-noise component, the target sound cannot be detected via Equation (5). To deal with such a case, HIST-music obtains , the histogram of for all calculated via SEVD-music.
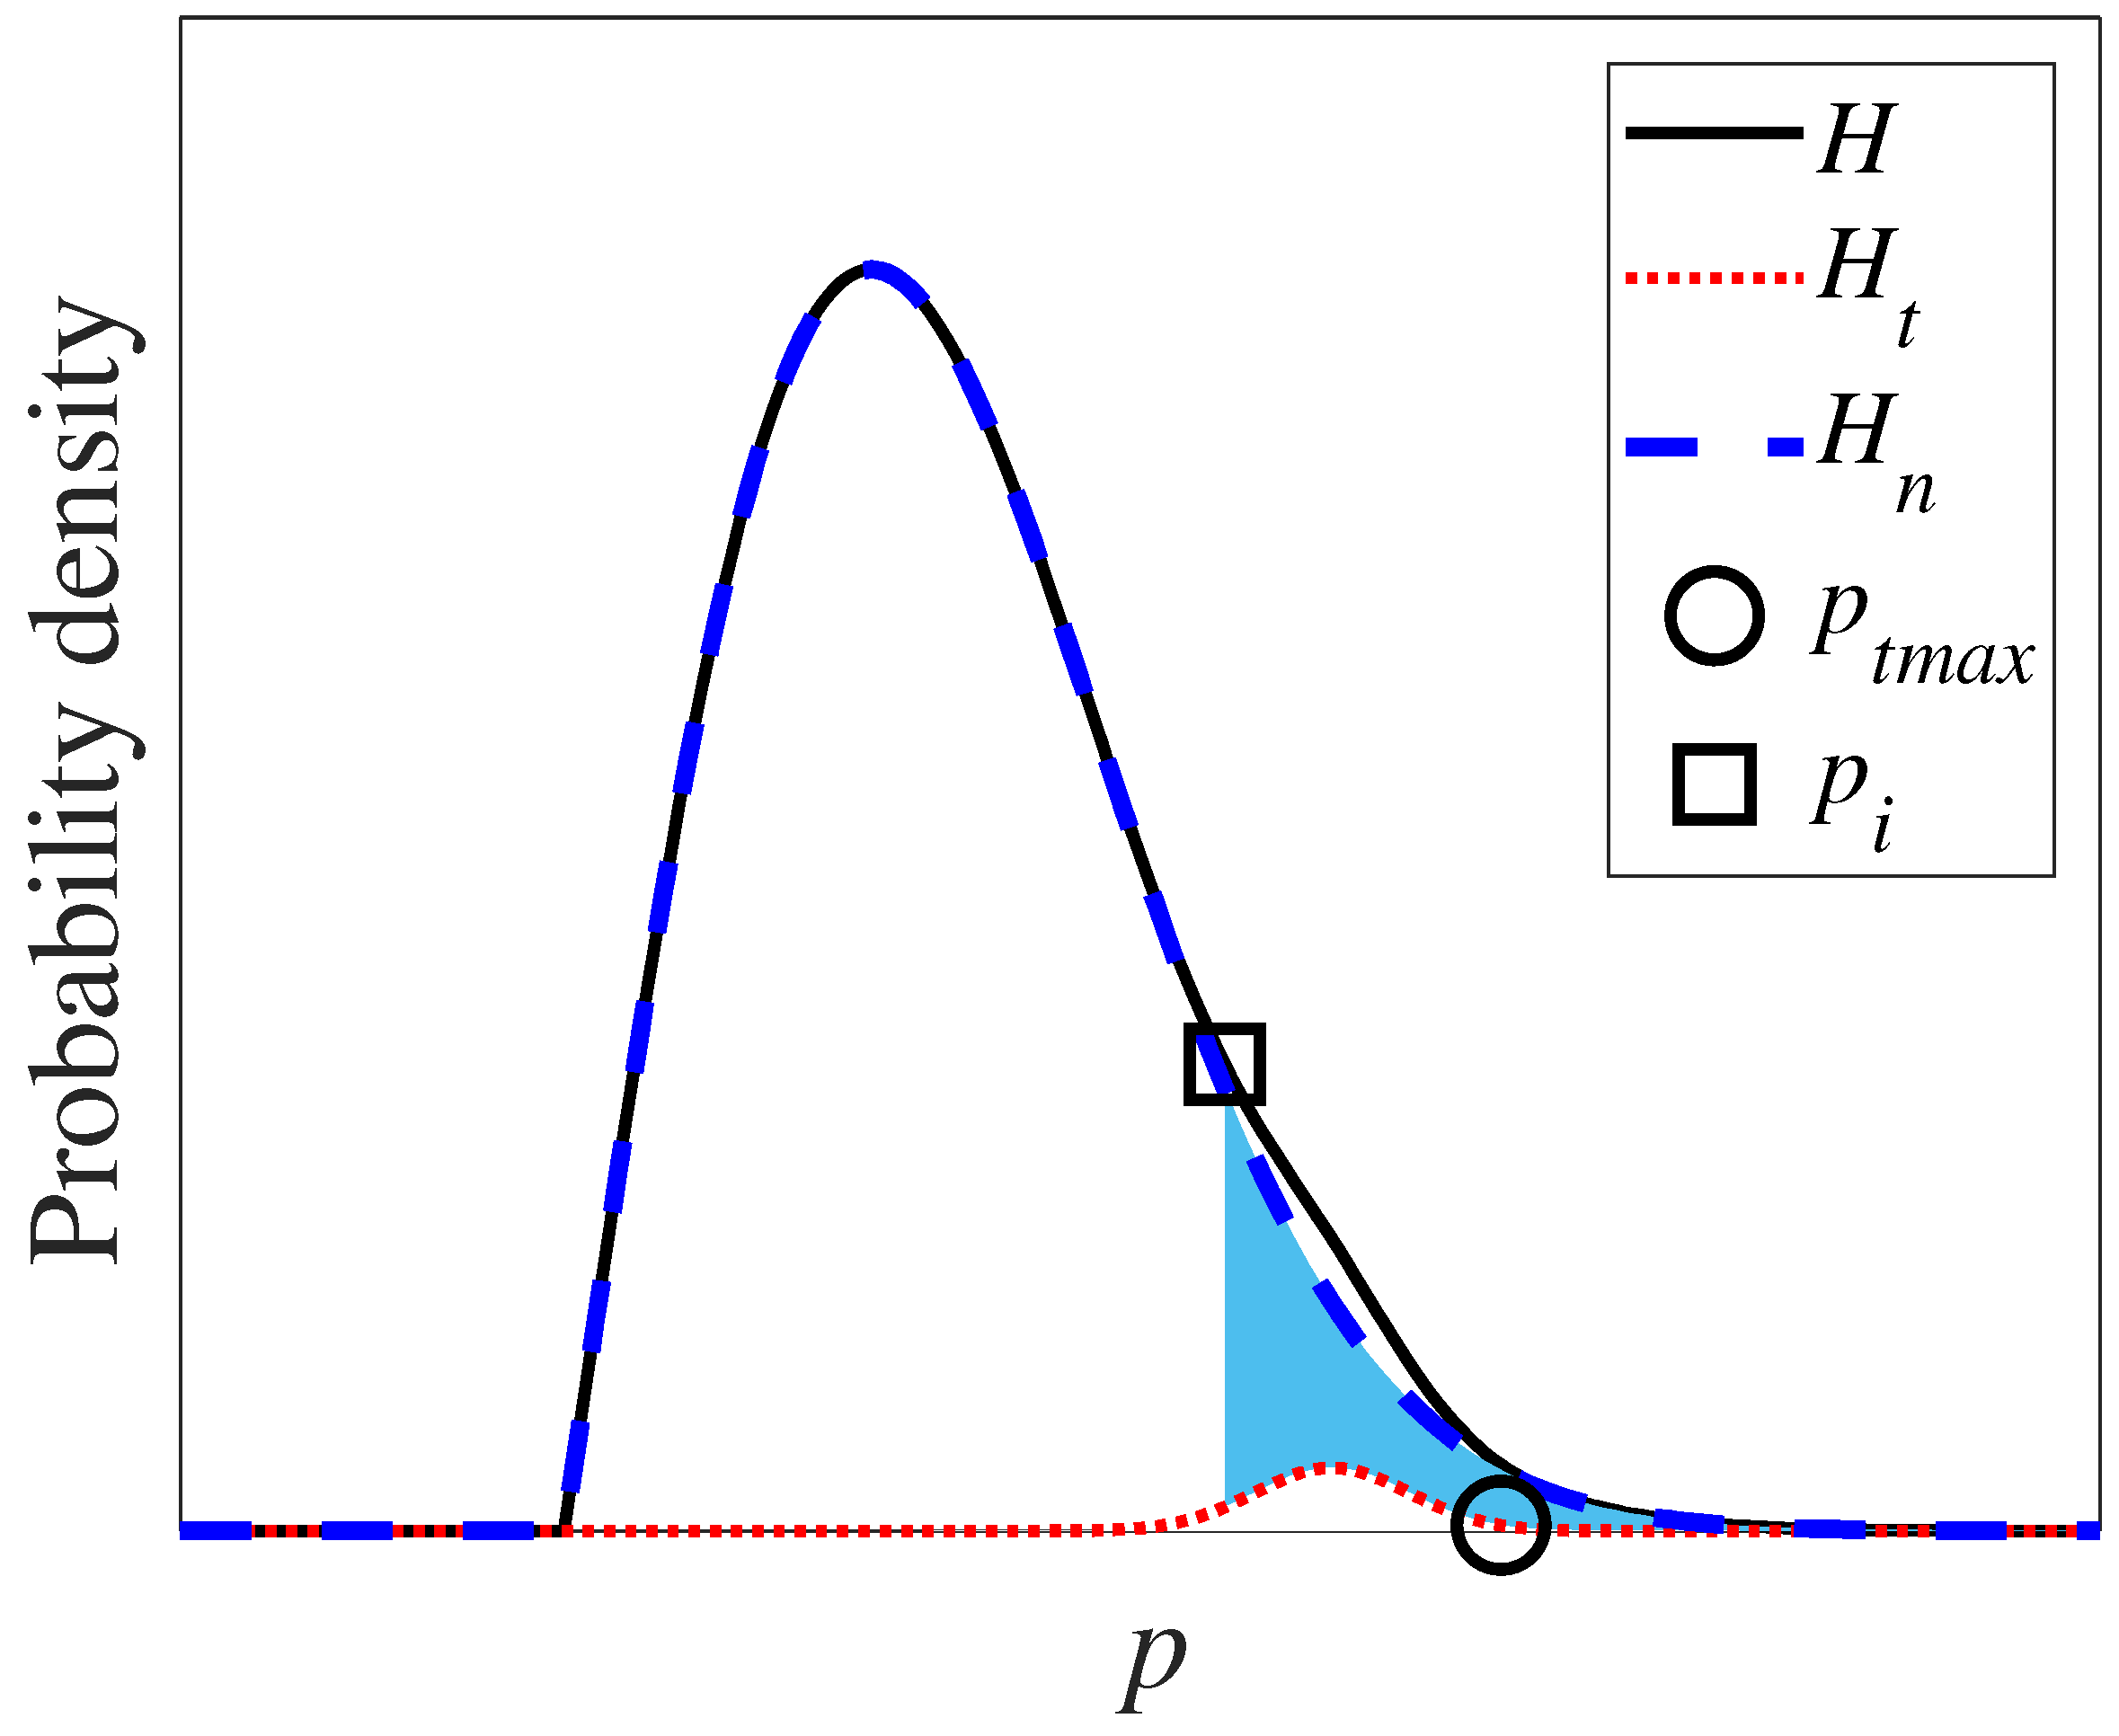
Here, p is the power bin of the spatial spectrum. A schematic diagram of the obtained H is shown in Figure 4. The horizontal axis represents the power bin p, and the vertical axis represents the probability density. The solid black line is the obtained histogram (H), the red dotted line is the histogram of only the target sound component (), and the blue dotted line is the histogram of only the ego-noise component (). The obtained histogram H is, thus, represented as the sum of the histograms of the target sound component and the ego-noise component . This representation was inspired by the work of Mori et al. [24], who represented the echo images of the body as the sum of the histograms of normal and diseased areas. Since most of the spatial spectrum consists of an ego-noise component other than the target sound, the maximum peak of H is due to ego-noise. If a target sound has a lower power than the maximum peak of H, a target sound cannot be detected at all. Therefore, the target sound is assumed to have a higher power than the maximum peak of H. To detect target sounds using Equation (5), the ego-noise component above a reference value lower than the maximum value of the target sound component (the cyan area in Figure 4) must be excluded. Then, when focusing on the right side of the maximum peak of H, it is found that the target sound component generates an inflection point, . is always lower than , so we adopt this point as the reference value.
An example of the results of calculating using actual experimental data is shown in Figure 5. It can be seen that a lower than can be obtained.
Next, the algorithm to exclude only the ego-noise component using is presented. Using , the components with a power higher than , , are extracted from .
Figure 6 shows the extracted result of . It can be seen that the ego-noise and target sound components are extracted. If is simply determined as ego-noise, then the target sound component is also determined as an ego-noise component. Then, the ego-noise component and the target sound component are separated from . Considering that ego-noise arrives the microphone array from one direction, the reference direction is set in the direction from which the ego-noise arrives. In , a continuous component including is determined as the ego-noise component , and the other components are determined as the target component .
Now, only the target sound component can be extracted. Using , the target sound direction can be detected via Equation (5) as follows.
2.3. HIST-music-3D
In previous work, we reported that the performance of HIST-music, introduced in Section 2.2, decreases when the target sound direction is close to the ego-noise direction [23]. Figure 9 shows an example of the spatial spectrum when . If this spatial spectrum is processed via HIST-music, because the directions of the target sound and ego-noise are so close, the target sound component is determined as the ego-noise component, as shown in Figure 10. As a result, the target sound direction cannot be detected.
To solve this problem, we propose HIST-music-3D, which can perform sound source detection even when the direction of the target sound and ego-noise are close to each other by using the difference in frequency characteristics between the target sound and ego-noise and determining the target sound and ego-noise through considering the frequency information. The algorithm is described below.
Instead of , HIST-music-3D uses P in Equation (4), which is a spatial spectrum, before summing in the frequency direction. This method obtains , the histogram of P for all and , as in Equation (6).
Then, the inflection point of the histogram is determined as the reference value, as in Equation (7).
Using , the components with power higher than are extracted from P.
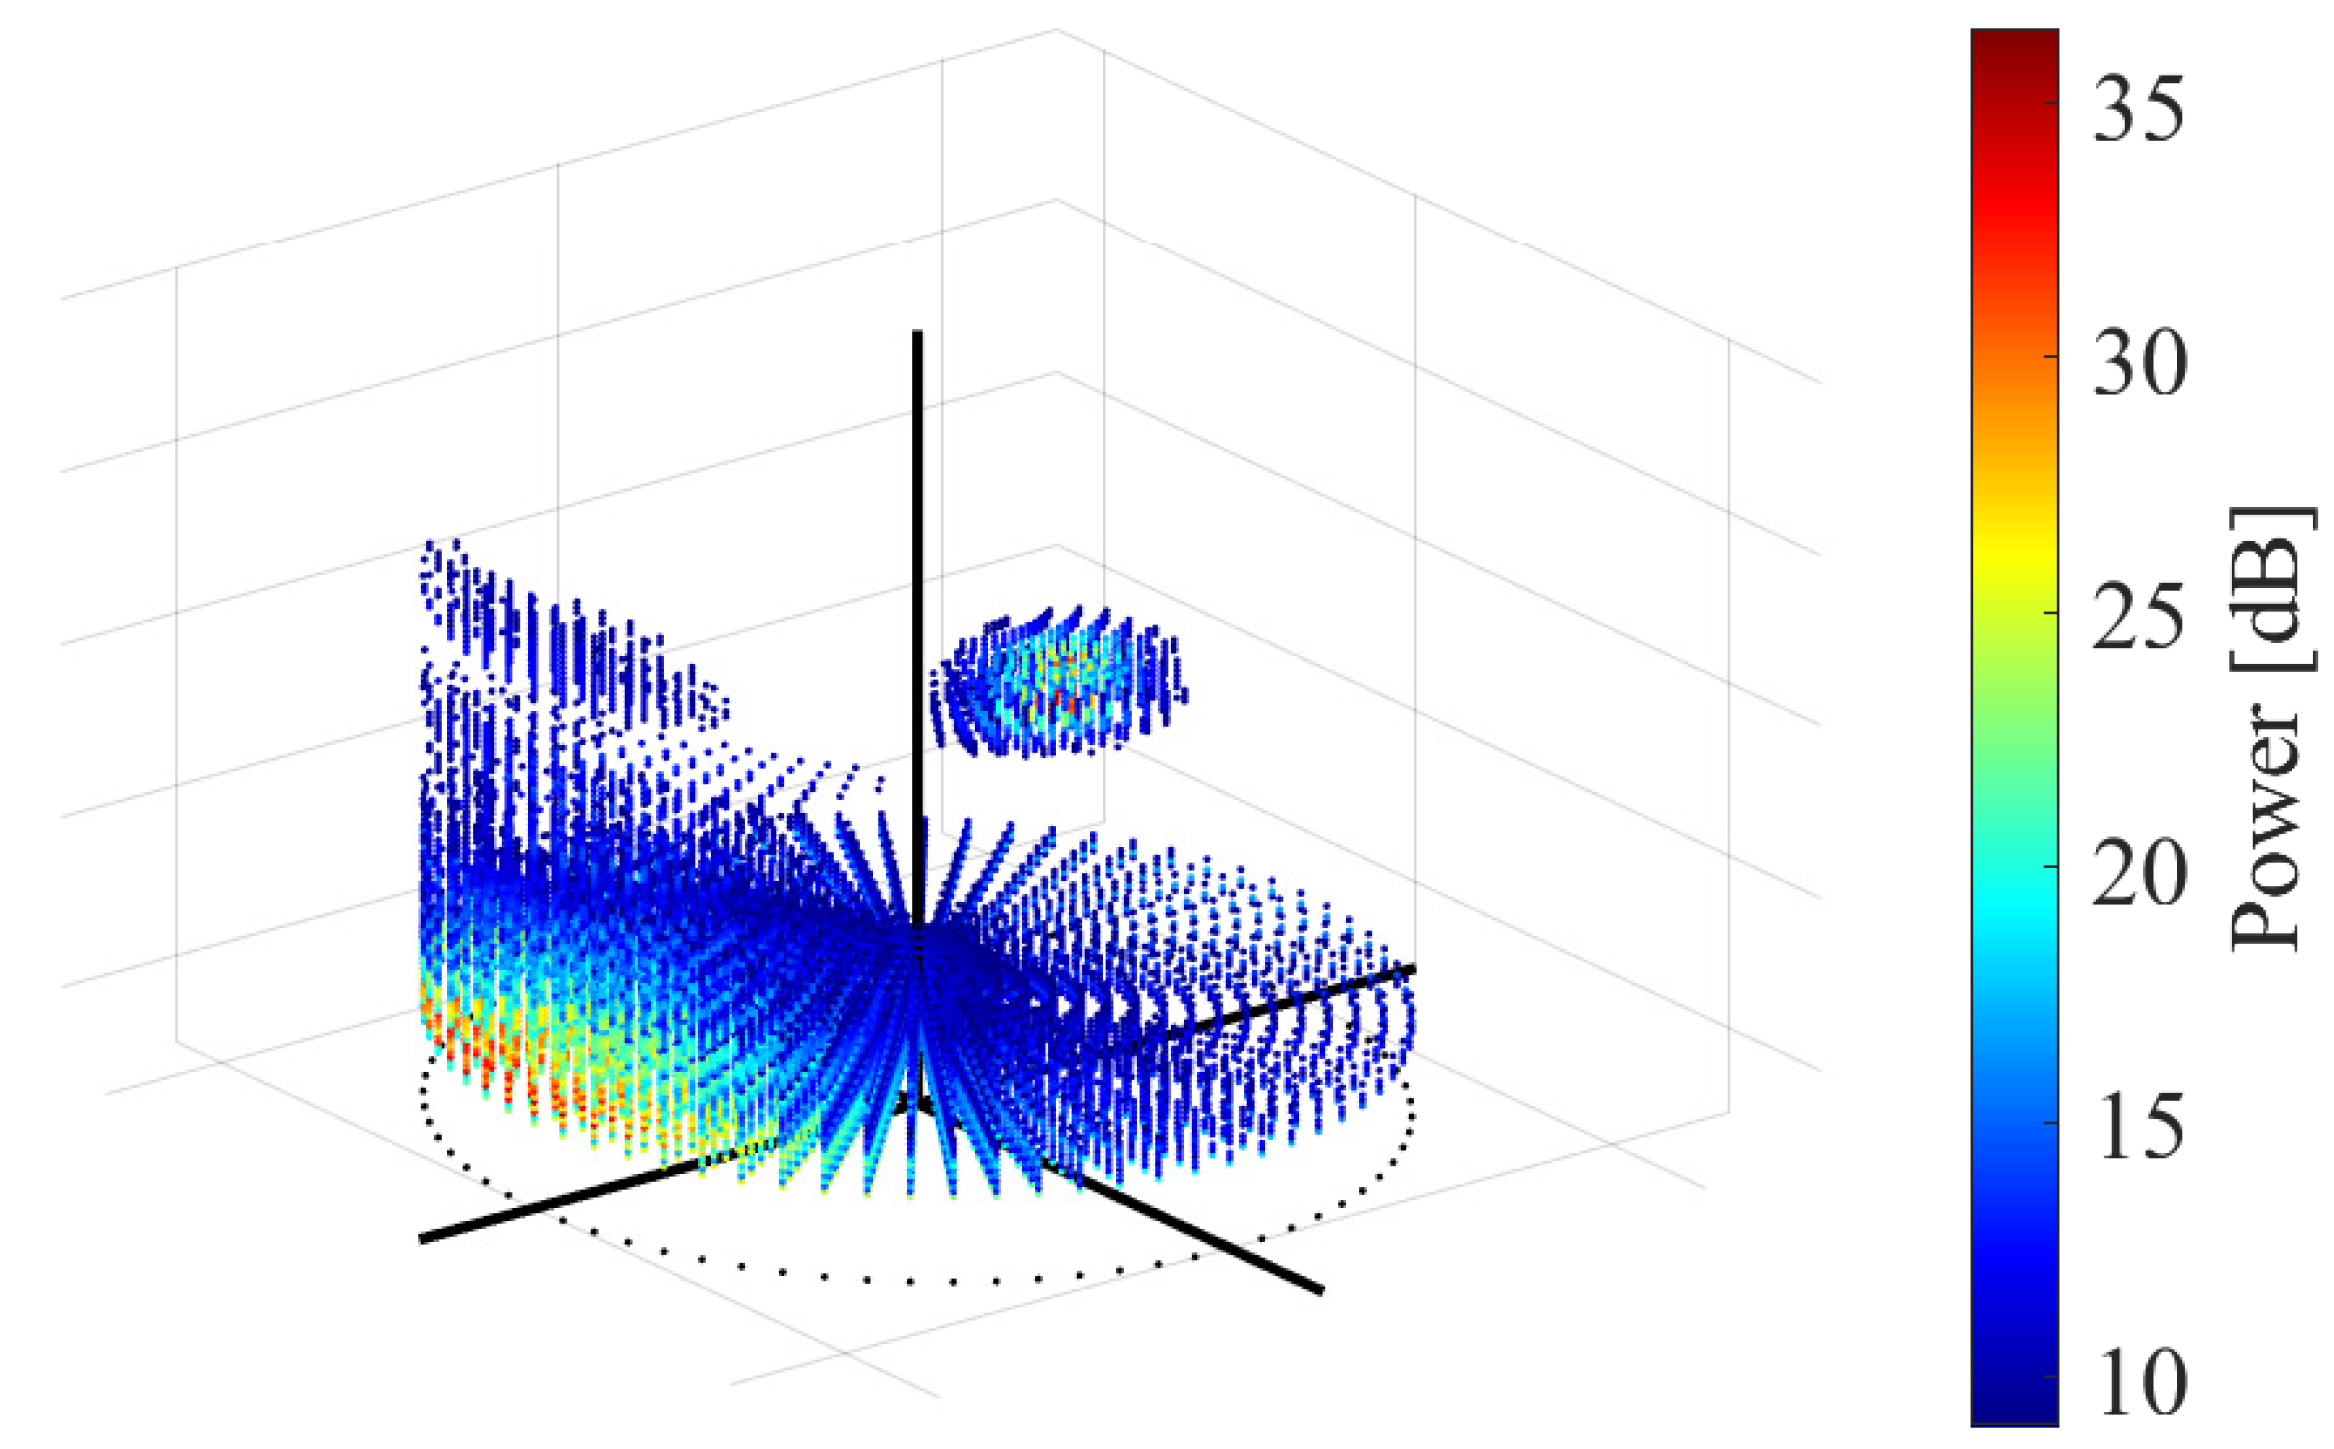
in the case of Figure 9, plotted with the axes given in Figure 11, is shown in Figure 12. The sound power arriving from each direction and each frequency is depicted with a color of point. As shown in the figure, the spatial spectrum is obtained in three dimensions (azimuth , elevation , and frequency ). Due to the difference in frequency characteristics, the components extracted via can be divided into a large cluster (ego-noise component) and a small cluster (target sound component) when viewed as three-dimensional data.
Using the obtained three-dimensional spatial spectrum, the ego-noise and target sound components are separated. As in HIST-music, the reference direction in which the ego-noise arrives is set. The continuous component including is separated as the ego-noise component, and the other components are separated as the target sound component.
The separated results from Figure 12 are shown in Figure 13. As in Figure 7, was set to . The red cluster is the separated ego-noise component , and the blue cluster is the target sound component . As shown in the figure, even if the ego-noise and target sound components cannot be separated by analyzing the two-dimensional spatial spectrum, they can be separated by analyzing the three-dimensional spatial spectrum. is summed over the direction to estimate the target sound direction.
Figure 14 shows the result of , plotted with the axes given in Figure 2. As shown in the figure, a two-dimensional spatial spectrum of only the target sound component can be obtained in the end.
Then, to detect the target sound direction , peak detection is performed for .
3. Evaluation Experiments
To evaluate the performance of the proposed method, evaluation experiments were performed.
3.1. Experimental Procedure
In the experiments, evaluation signals were created by adding ego-noise recorded in a real outdoor environment and target sounds that arrived from various directions generated via numerical calculation. The performance was evaluated by processing SSL using the evaluation signals.
The ego-noise was recorded using DJI (Shenzhen, China) Inspire 2 with an embedded microphone array, as shown in Figure 15a. The drone and the microphone array were connected with a single pipe. The distance between the center of the drone and the microphone array was 600 mm. As the microphone array, a 16-channel spherical microphone array [3], shown in Figure 15b, was used. The microphones are marked with red arrows in Figure 15b. The microphone array consists of 12-channel MEMS microphones in the lower hemisphere and 4-channel MEMS microphones in the upper hemisphere of a 110-mm-diameter body. The position of each microphone is shown in Figure 16. Using this microphone array, ego-noise was recorded at a sampling frequency of 16 kHz and a quantization bit rate of 24 bits while the drone was hovering at an altitude of 10 m and flying at speeds of 1, 2, and 3 m/s.
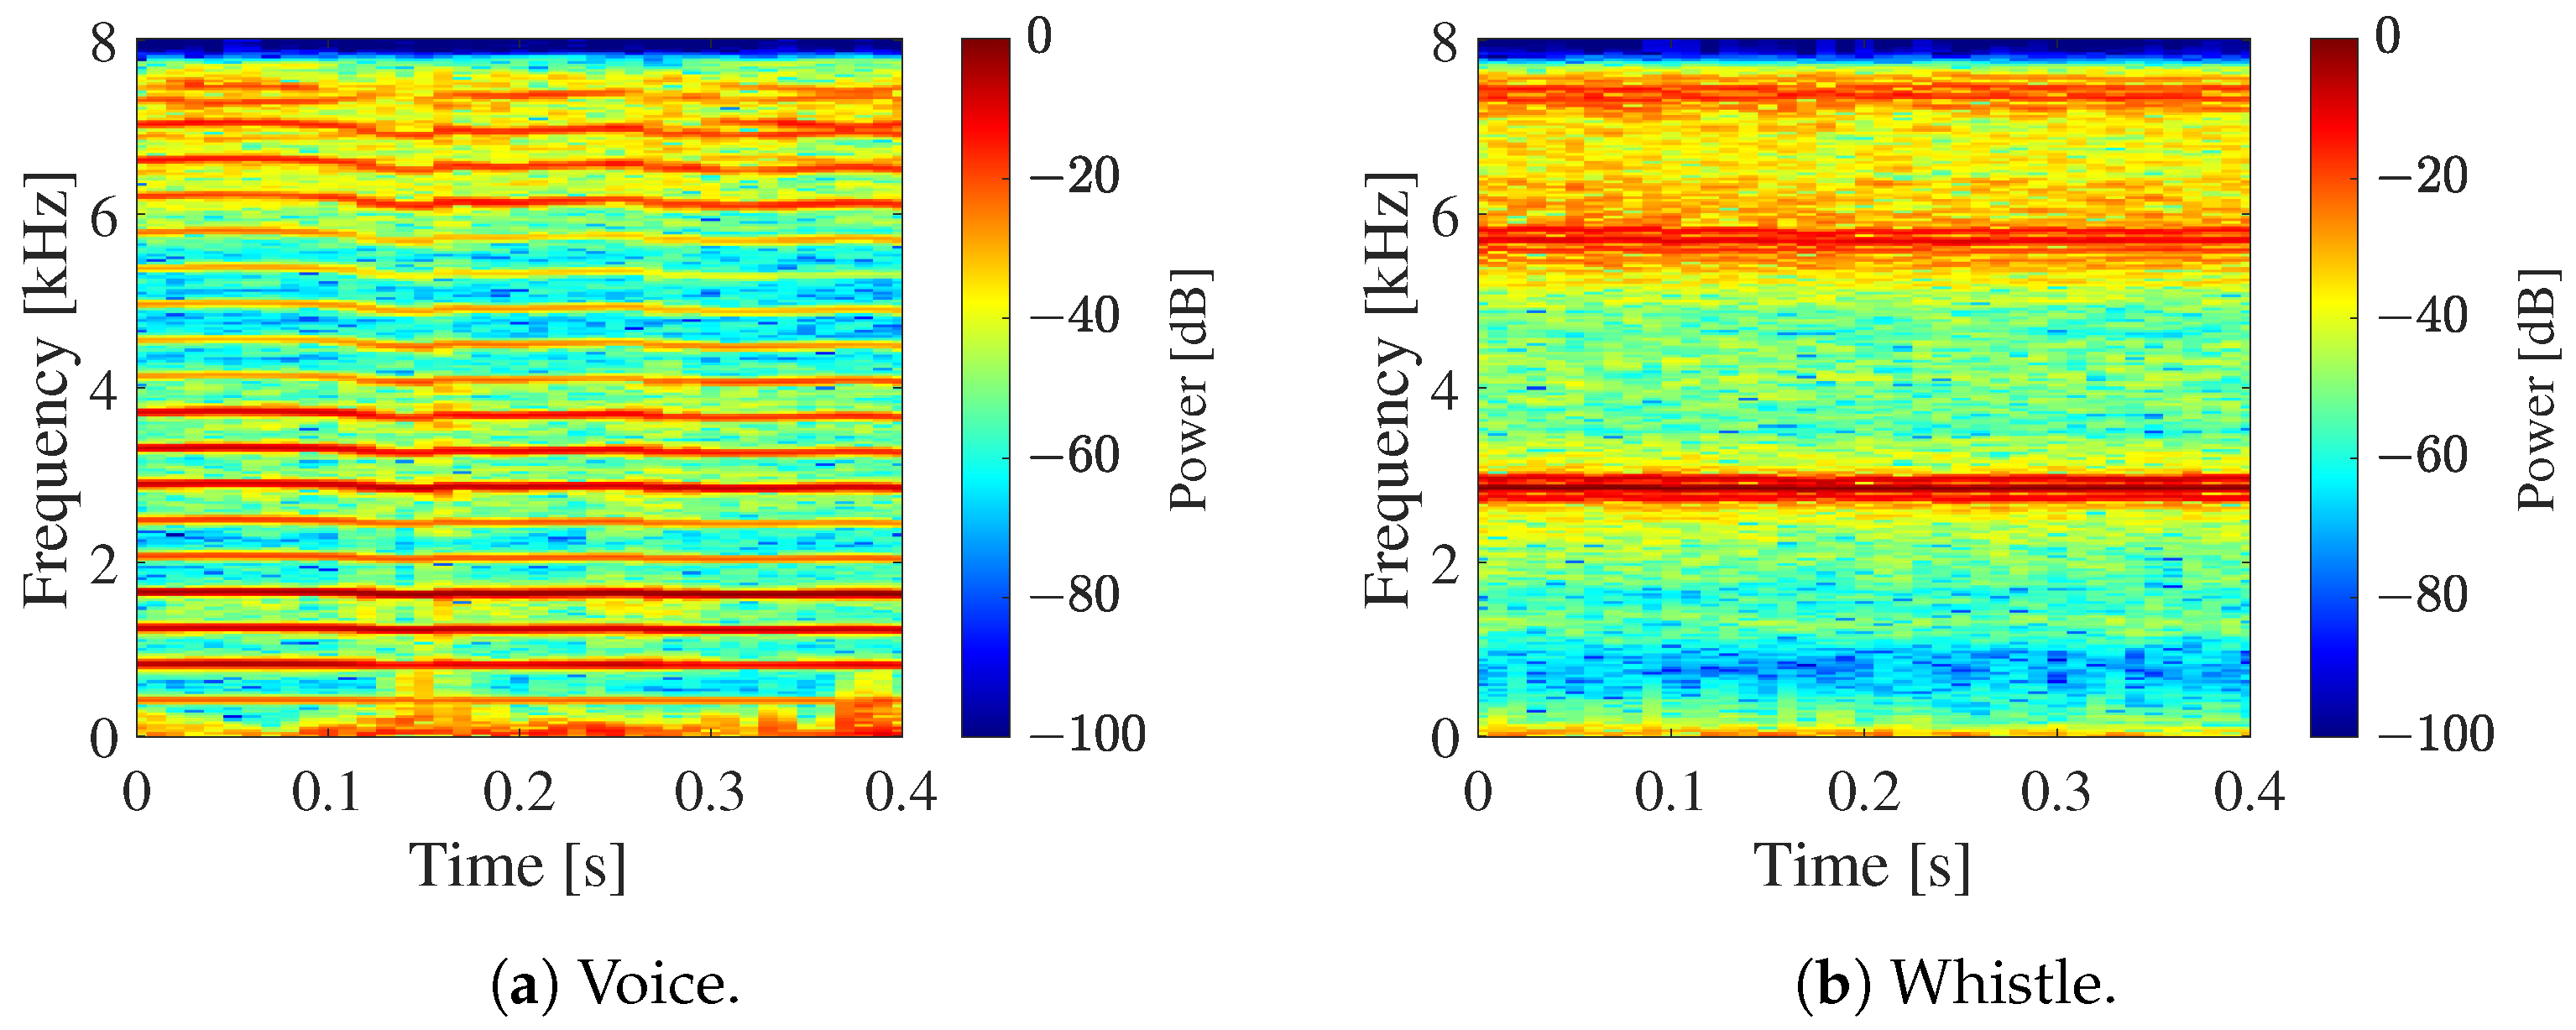
Target sounds were generated using a one-channel sample recorded in an outdoor environment. Considering the positions of 16 microphones, numerical calculations were performed to simulate 16-channel acoustic signals when the target sound arrived from an arbitrary direction. The DOA was set to 5 deg. increments within the range of ∼180 deg. for azimuth angle and ∼0 deg. for elevation angle . As target sound samples, voice and whistle sounds were used. Their spectrograms are shown in Figure 17.
Using the obtained ego-noise and the target sound, evaluation signals were created via addition such that the SNR (Signal-to-Noise Ratio) was to 0 dB in 4 dB increments. The evaluation signals were processed through the conventional and proposed SSL methods and evaluated. The methods used in the evaluation are shown in Table 2. As common analysis conditions for these methods, the length of FFT and overlap in STFT were 512 and 352 points, the number of frames used to average the correlation matrix was (that is, a signal with the length of 0.5 s was used in the process for SSL), the number of target sources was , the analyzed frequency range was Hz and Hz, and the transfer function, G, used in Equation (3) was derived from geometric calculation. As described in Section 1, GEVD-music uses pre-recorded ego-noise to whiten noise. For this, the ego-noise of the same drone recorded on a different day was used. iGEVD-music performed the same whitening by assuming that the recorded sound 2 s before the current time was noise. AFRF-music creates a frequency filter from the frequency spectrum. The filter range was set to 500 Hz. The angle-limited SEVD-music limits the search range of the azimuth angle in the spatial spectrum. Angle-limited SEVD-music (1) was set to deg., and angle-limited SEVD-music (2) was set to deg. In HIST-music and HIST-music-3D, the reference direction was set to .
3.2. Results
The two-dimensional spatial spectra calculated via the methods shown in Table 2 for various evaluation signals under different conditions are presented.
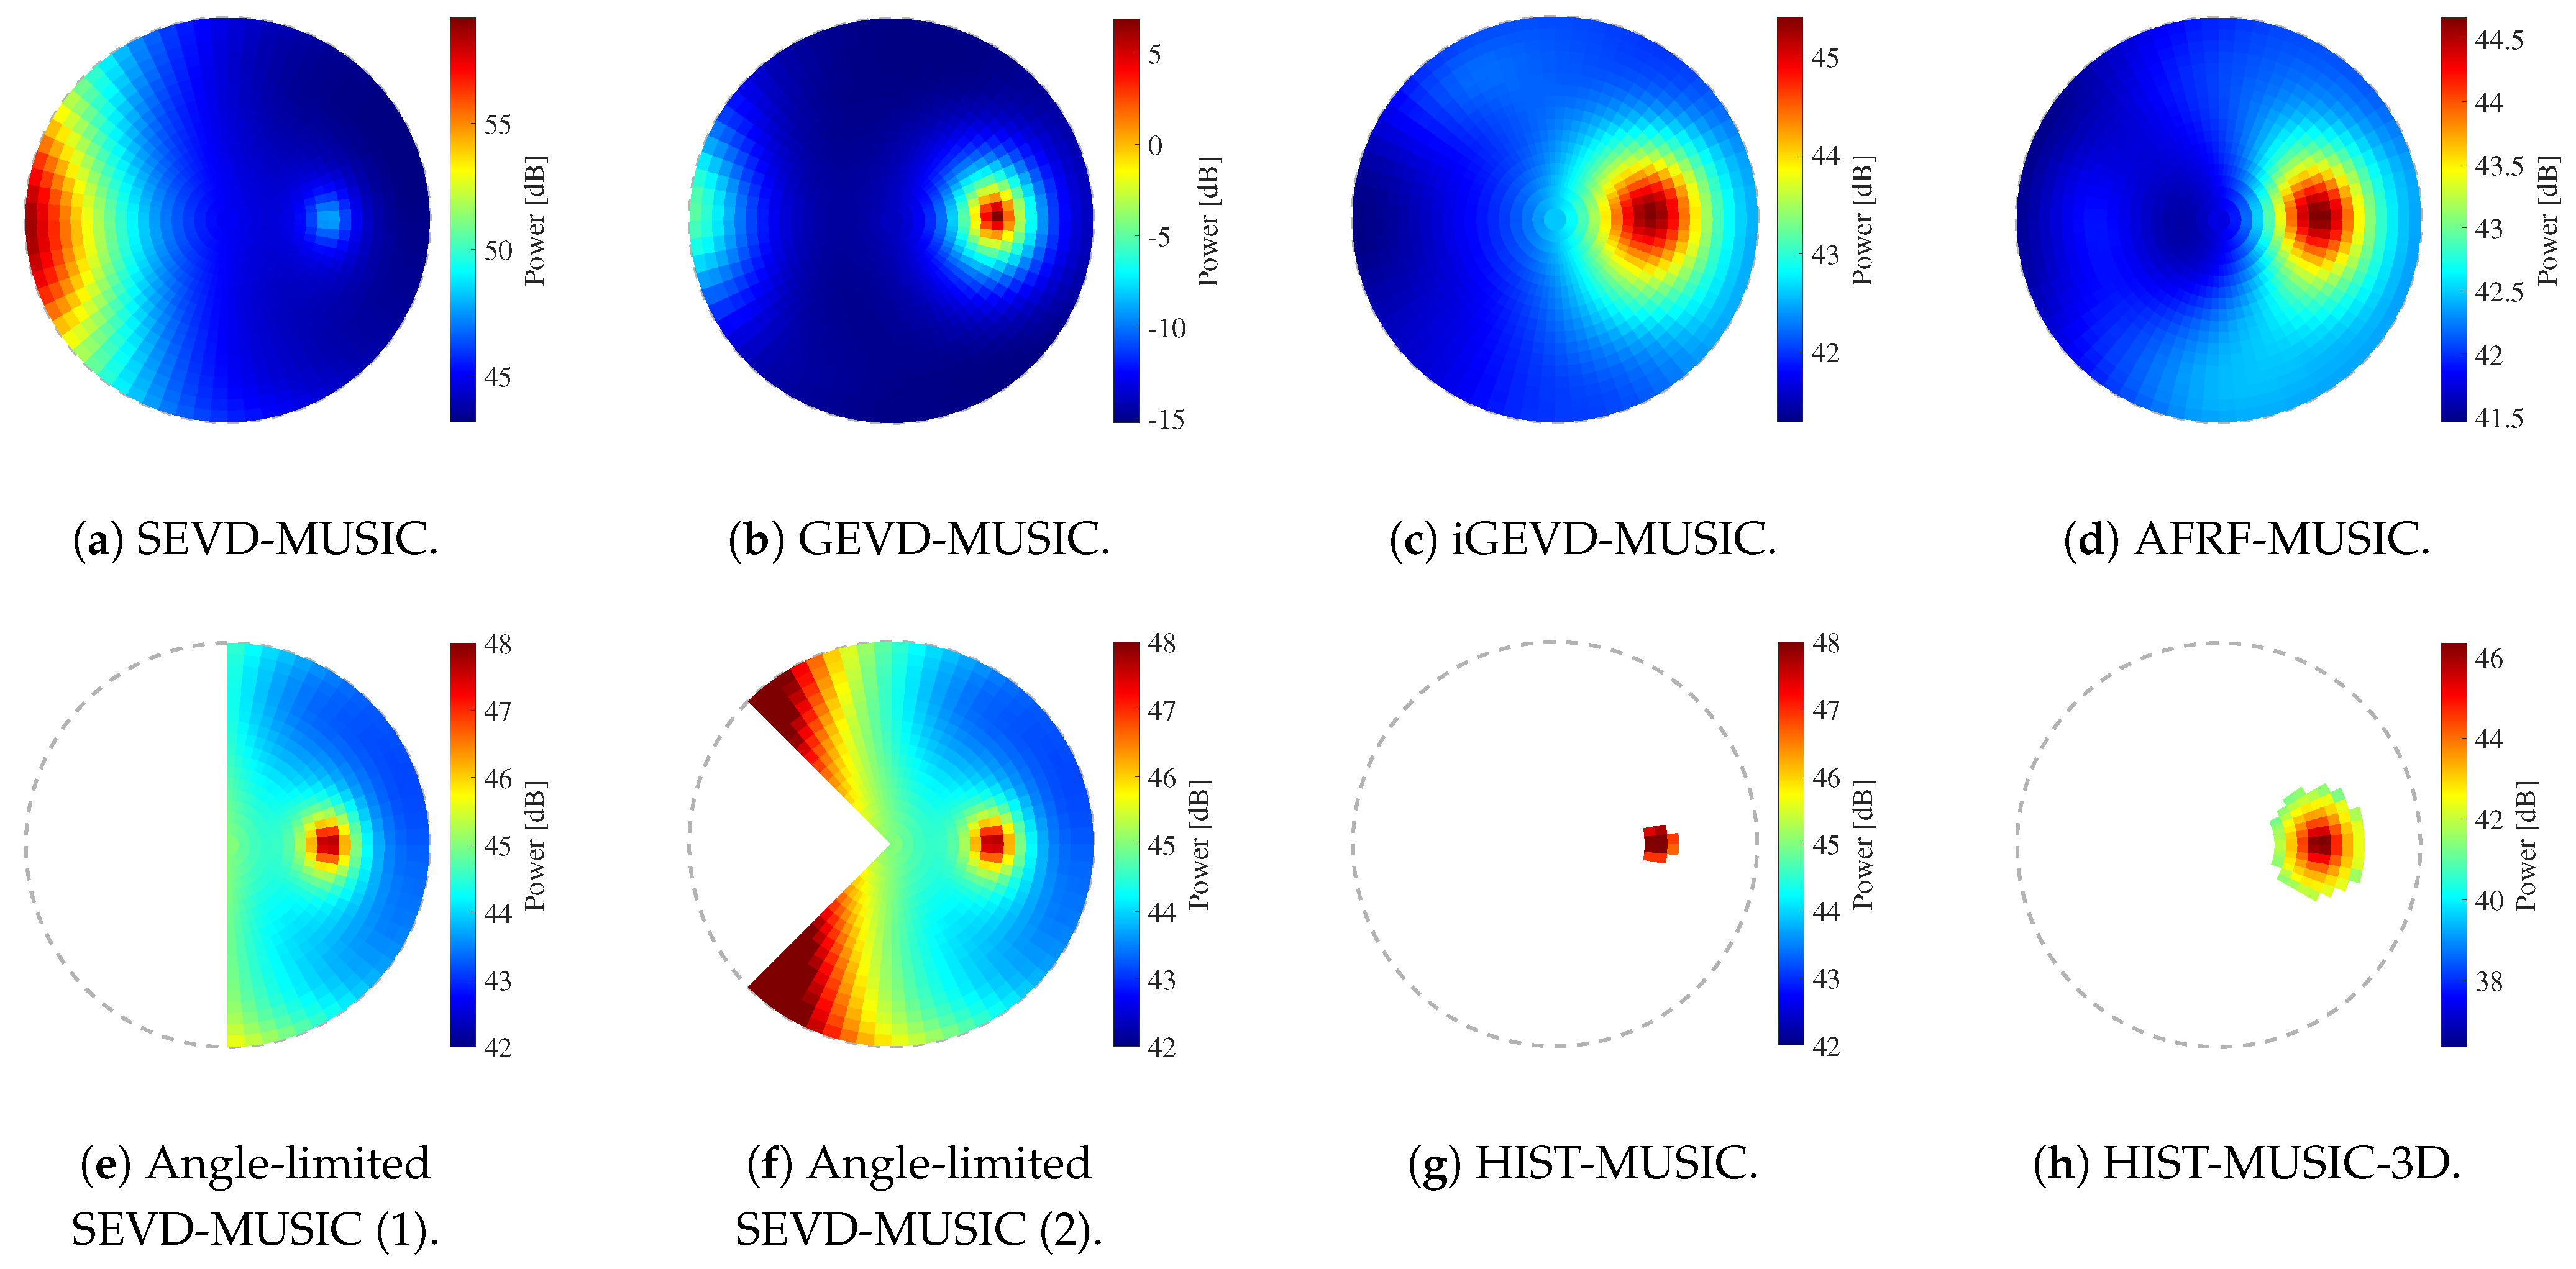
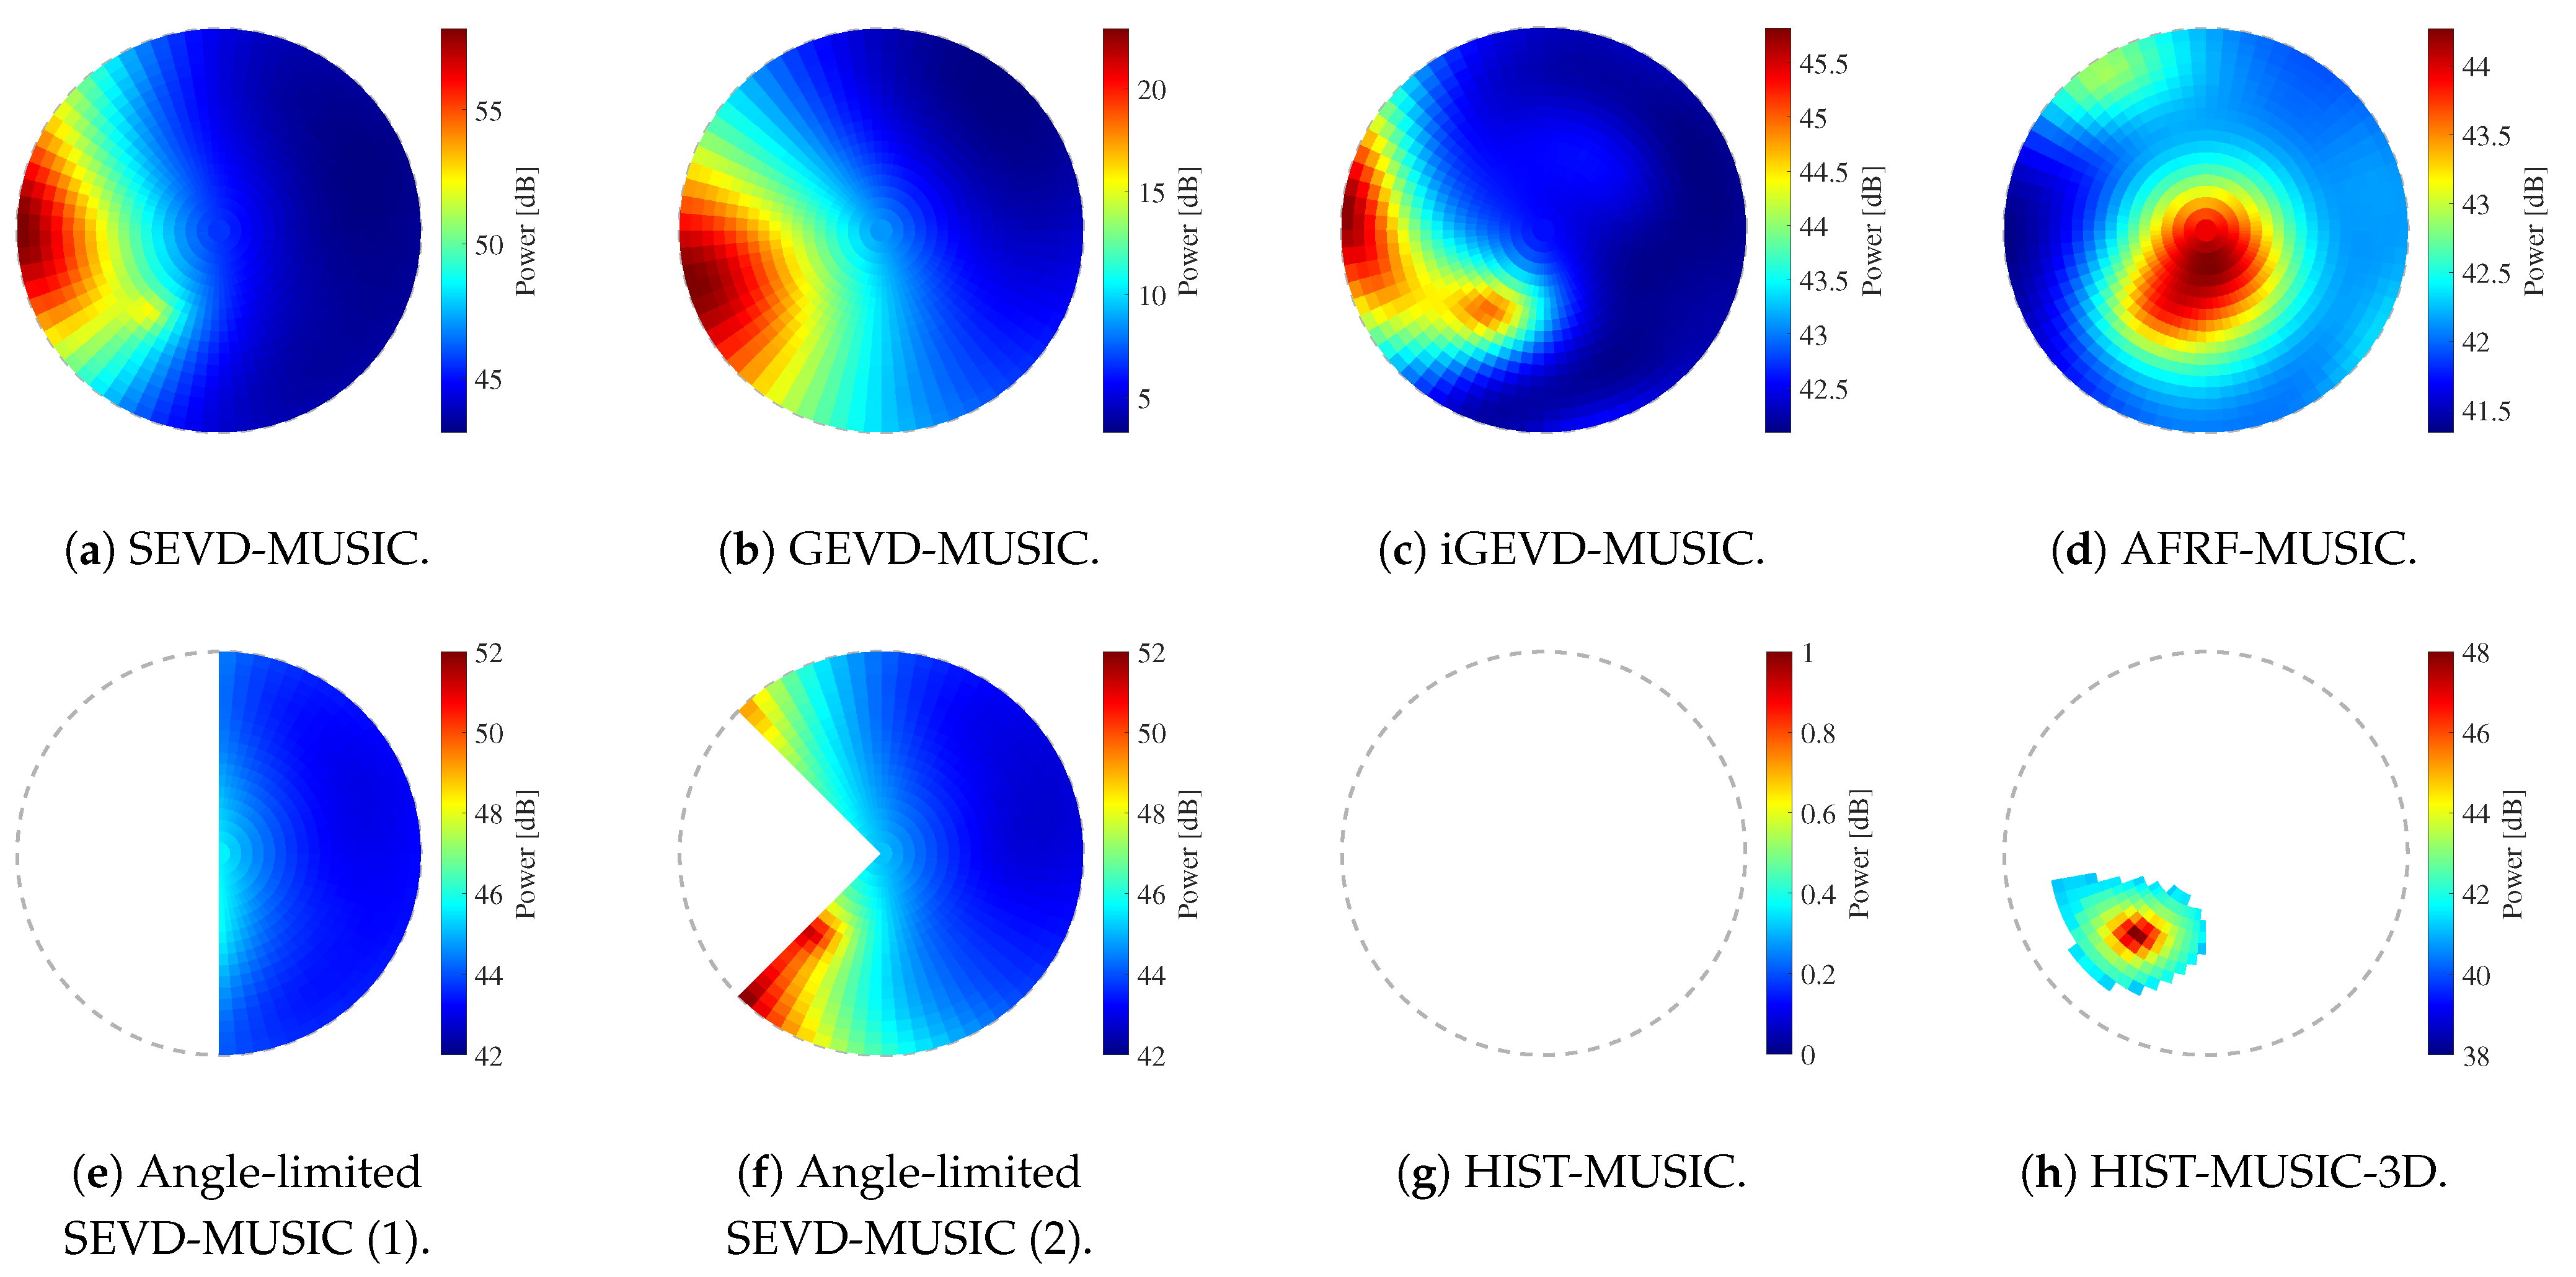
Figure 18 shows the calculated spatial spectra when the SNR was dB, the target sound was the whistle sound, was (0 deg., deg.), and the flight speed was 0 m/s (hovering). Figure 19 shows the spatial spectra when the flight speed was 3 m/s. Figure 20 shows the spatial spectra when was ( deg., deg.) and the flight speed was 3 m/s. These figures are plotted with the axes given in Figure 2. The sound power arriving from each direction is depicted in a color map.
The SEVD-music results show that the ego-noise component exists around . Although the target sound component exists in the direction away from the ego-noise component, the power of the ego-noise component is larger than the target sound component in all three situations, and the DOA of the target sound cannot be detected through peak detection. The GEVD-music and AFRF-music results show that the ego-noise component is removed through each method, and the target sound component has the maximum peak when the drone is hovering, because the changes in the ego-noise over time are small. However, when the drone flies at a speed of 3 m/s, the ego-noise component cannot be removed because the ego-noise changes quickly over time. Therefore, the target sound component cannot be detected. Compared to GEVD-music and AFRF-music, the iGEVD-music results show that the target sound component can be seen relatively well even when flying at 3 m/s; however, the ego-noise component still has the maximum peak. The angle-limited SEVD-music results show that the target sound components at (0 deg., deg.) can be detected by setting the search range to be narrow. However, the target sound component at ( deg., deg.) is not included in the search range and cannot be detected. On the other hand, when the search range is set wider, the ego-noise component is included in the search range, and the detection of the target sound component fails. If the range at which the ego-noise component exists could be known in advance, it would be possible to maximize the search range and improve the tolerance for noise; however, the range of the ego-noise component changes due to flight conditions, as shown in Figure 18f, Figure 19f and Figure 20f, and it is difficult to deal with these changes. These results indicate that there is a trade-off relationship between the tolerance for dynamic noise and the search range, and it is difficult to satisfy both at the same time. The HIST-music results show that the target sound component is successfully detected at . However, when , which is close to the ego-noise direction, the target sound component is determined as the ego-noise component, and the detection fails. In the results of the proposed method, HIST-music-3D, it was found that HIST-music-3D solves all the above problems and successfully detects the target sound component in all three situations.
3.3. Discussion
To discuss the performance of the proposed method, the obtained results were evaluated in terms of their noise tolerance, searchable range, real-time performance, and versatility.
3.3.1. Tolerance for Dynamic Noise and Searchable Range
To evaluate the noise tolerance and searchable range, the localization of the target sound was performed using each SSL method for a total of 3,112,800 evaluation signals, including 50 frames (25 s) each of ego-noise while flying at 0 (hovering), 1, 2, and 3 m/s, two target sound samples (voice and whistle), 1297 DOAs, and six SNRs. Noise tolerance was evaluated based on the success rate of localization for all trials as follows.
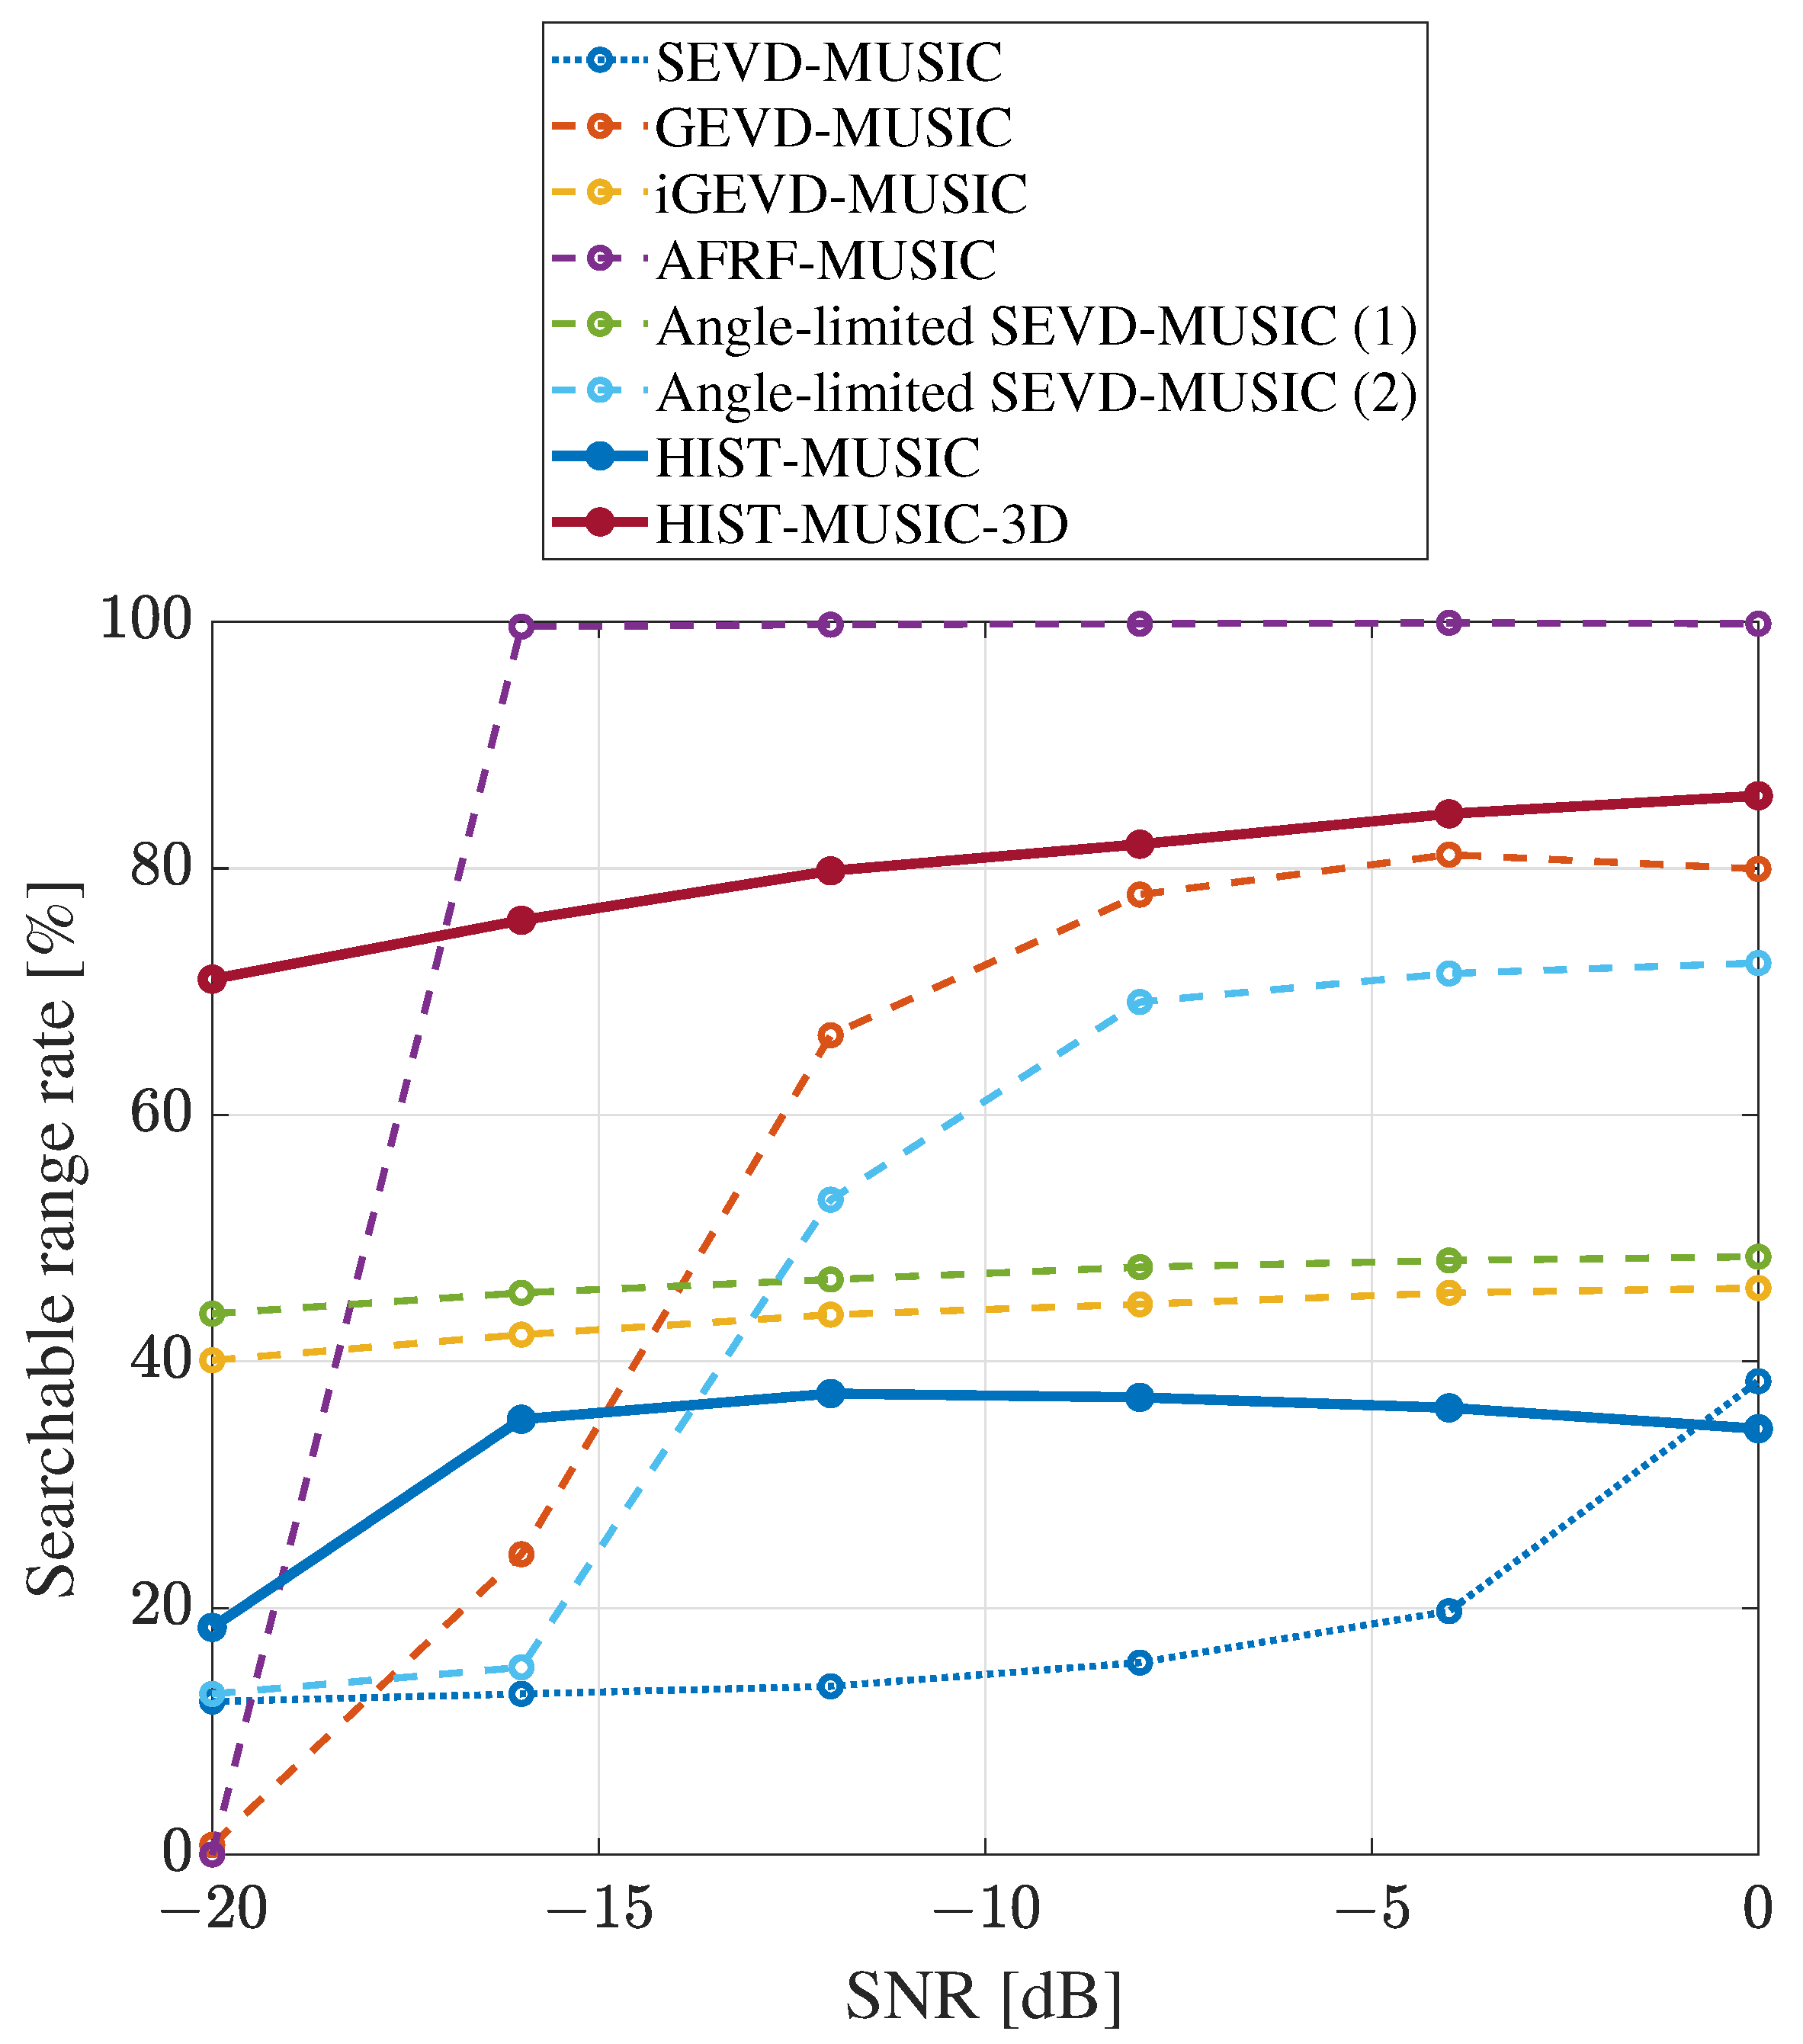
Localization success was defined as a localization within 5 deg. of the true value in DOA of the target sound. In addition, the success rate was calculated for each DOA, and the percentage of DOAs with a success rate higher than 50% was defined and evaluated as the searchable range rate as follows.
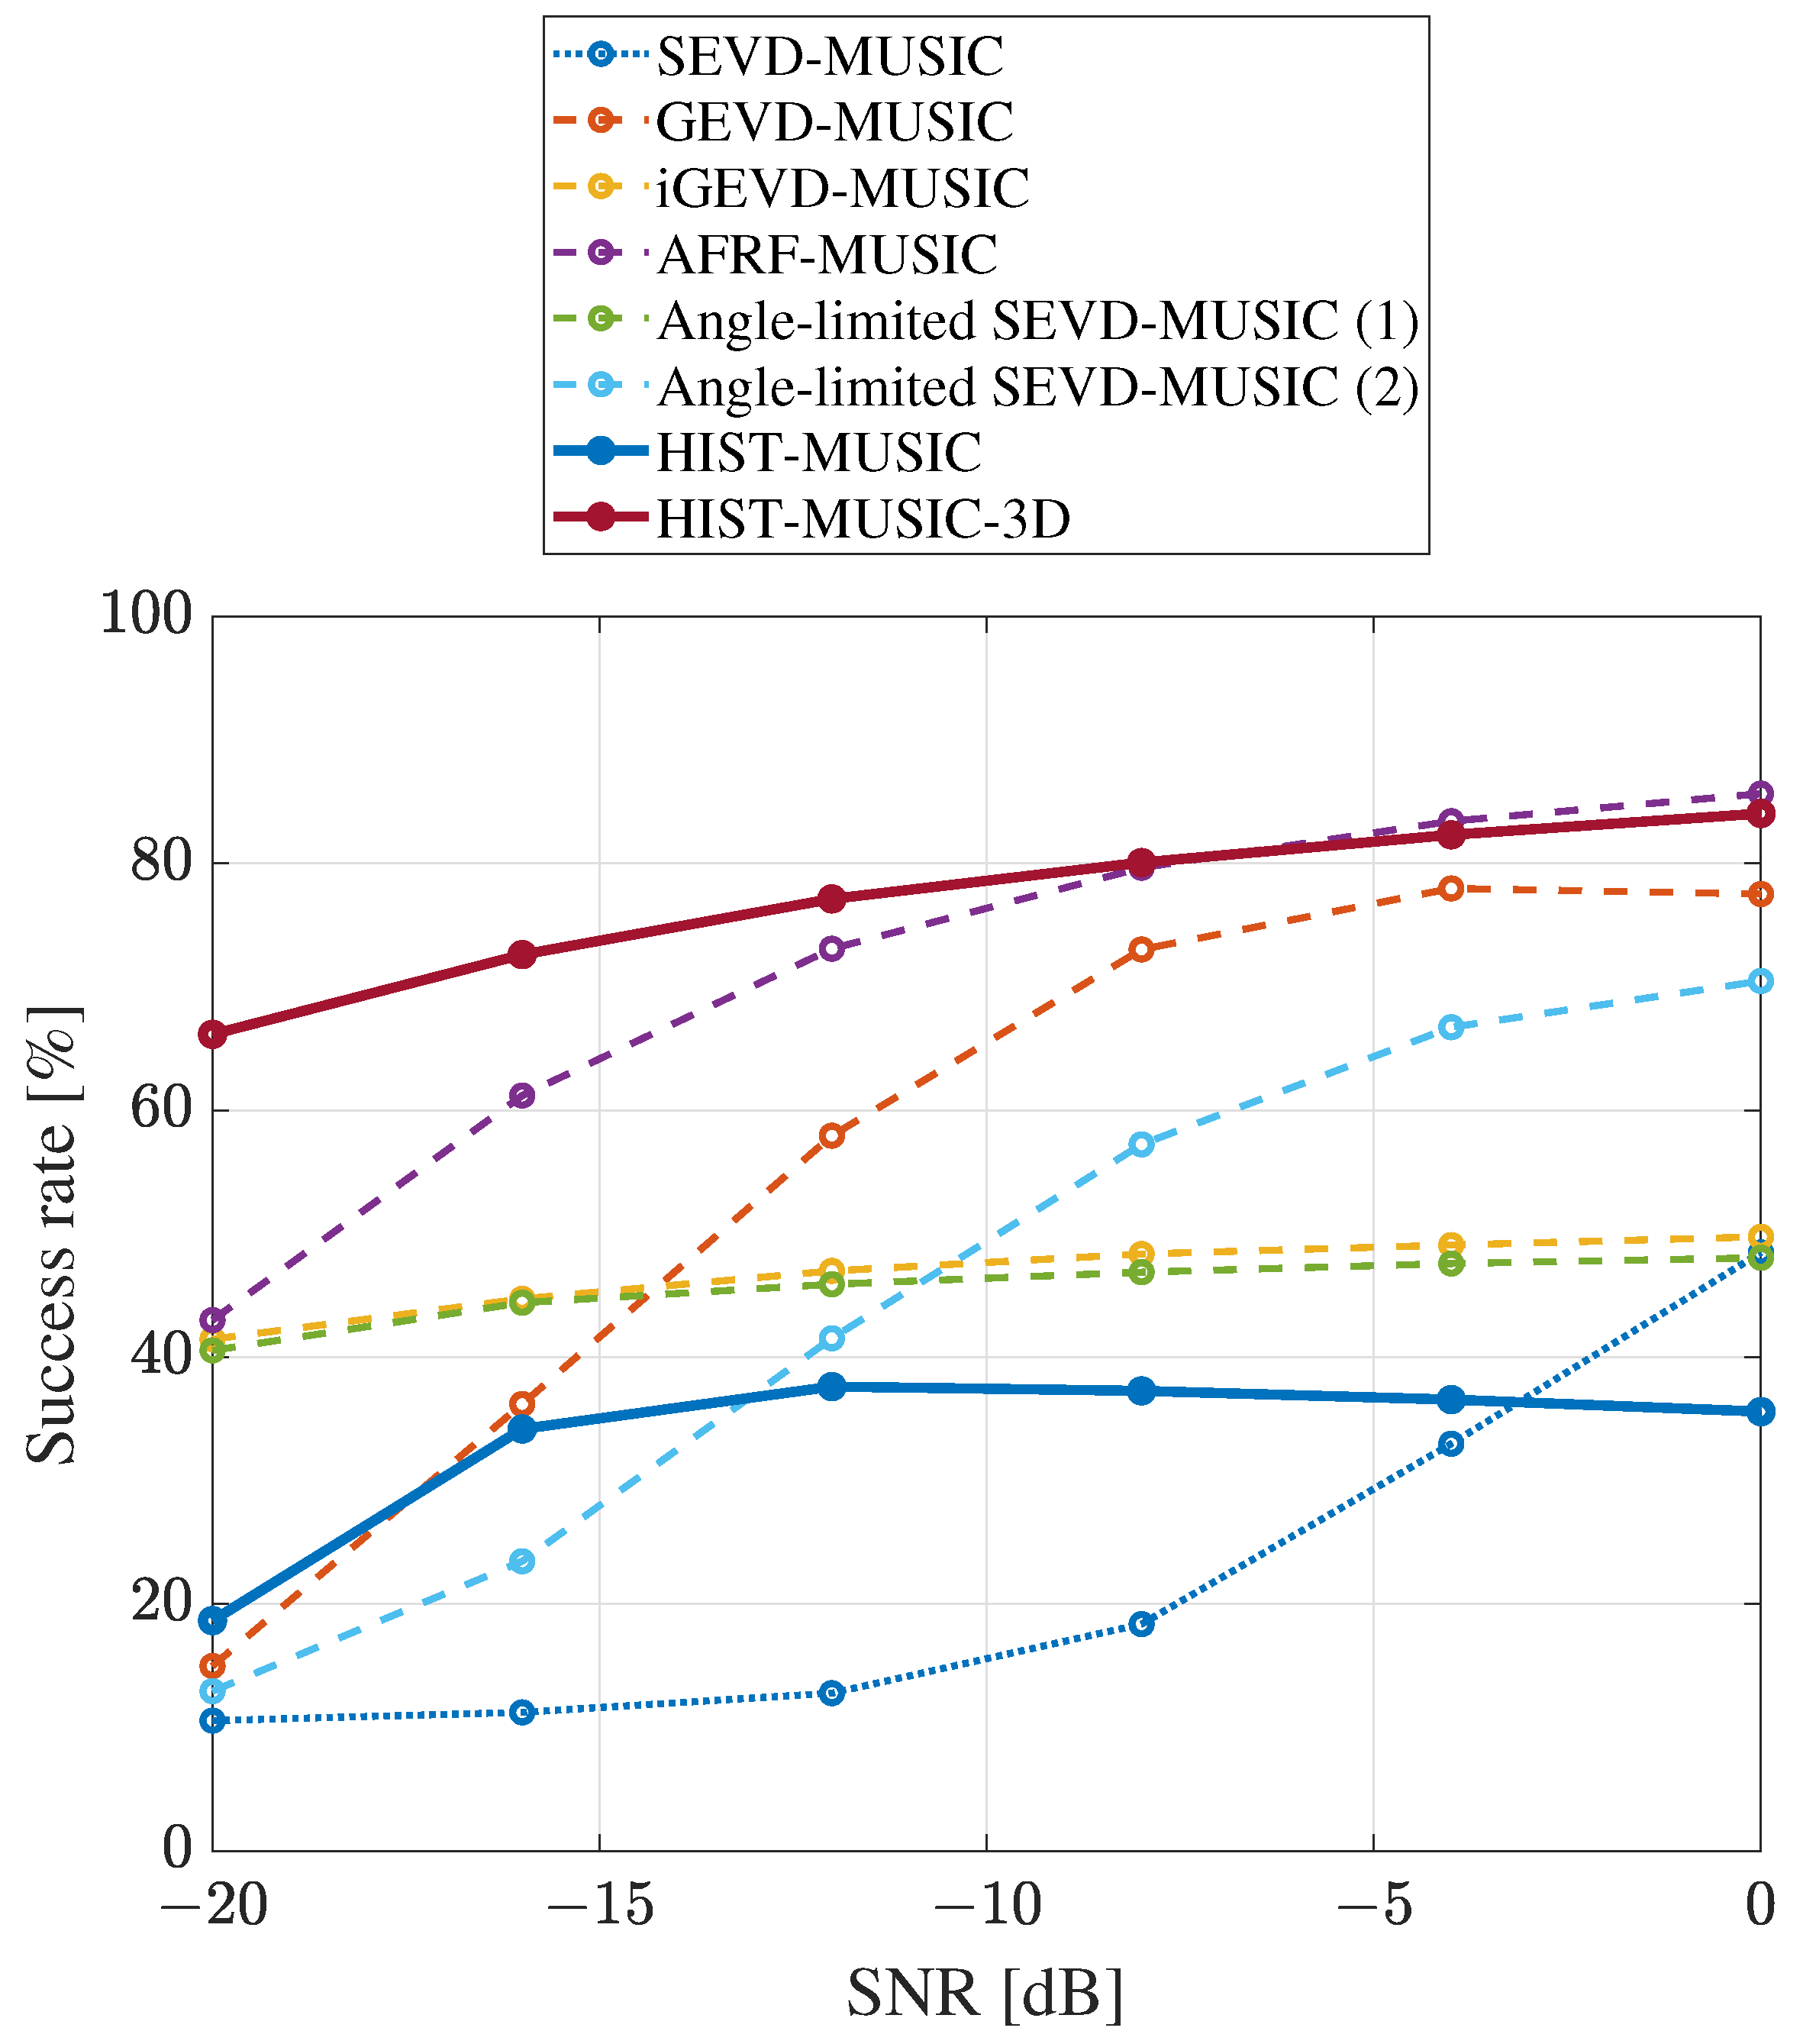
Figure 21 and Figure 22 show the calculated success rate and searchable range rate. The horizontal axis represents the SNR, and the vertical axis represents the success rate and the searchable range rate, respectively.
The success rate and searchable range rate of SEVD-music were less than 50% because SEVD-music does not perform for noise suppression processing. GEVD-music, angle-limited SEVD-music (2), and AFRF-music were all high when the SNR was high; however, they also decreased as the SNR decreased. In particular, AFRF-music had significantly lower searchable ranges at a low SNR. iGEVD-music and angle-limited SEVD-music (1) also had low success rates and searchable range rates at all SNRs. These results are due to the insufficient tolerance for quickly changing dynamic ego-noise. These results indicate that existing methods are not able to achieve a high success rate or a large searchable range at low SNRs. In particular, even methods with theoretically large search ranges have small searchable ranges in a real environment. When considering operations in a real environment, the SNR was assumed to be less than dB, and the ego-noise was assumed to change quickly over time. Therefore, the practicality of these methods is insufficient.
HIST-music was proposed to satisfy the tolerance for quickly changing dynamic noise and a large search range; however, both were less than 40% in a real environment. This is because the target sound component was determined as the ego-noise and excluded from the search range when the DOA of the target sound was close to the ego-noise, as described in Section 2.3. Figure 23a shows the success rate for each set DOA when the SNR was dB. Each set DOA follows the axes given in Figure 2, and the success rate for each set DOA is depicted in a color map. As shown in the figure, the success rate was 0% in the range where ego-noise exists and is close to the ego-noise, which caused the success rate and the searchable range to decrease.
On the other hand, HIST-music-3D had a high success rate and a searchable range rate at all SNRs. In particular, they were the highest in all methods at low SNRs. As in HIST-music, Figure 23b shows the success rate at each set DOA. As shown in the figure, the success rate improved in the range close to the ego-noise, where HIST-music failed localization. Then, the success rate and the searchable range rate increased.
These results show that HIST-music-3D can simultaneously satisfy high tolerance for quickly changing dynamic noise and a large search range.
3.3.2. Real-Time Performance
To evaluate real-time performance, the processing time for evaluation signals using each method was measured. A virtual machine with a four-core CPU, a 1.5 GHz CPU clock, and 4 GB of memory was used for processing, assuming a Jetson Nano. The RTF (Real Time Factor) was used as the evaluation index, which was calculated as follows.
That is, if the RTF < 1, processing is completed within the time length of the signal, which means that SSL can be performed in real time without delay accumulation. Two hundred evaluation signals of 0.5 s were processed, and the average value of the RTF was measured.
Table 3 shows the measurement results of the RTF for each method. SEVD-music does not include the processing of noise suppression; therefore, the RTF is lower than 1. GEVD-music and iGEVD-music whiten the noise by calculating the inverse of the noise correlation matrix. Therefore, they have a high calculation cost, and the RTF was higher than 1. This means that they cannot process in real time. The RTFs of AFRF-music and the angle-limited SEVD-music were significantly lower than that of SEVD-music. SEVD-music calculates the spatial spectrum for each direction and each frequency, while AFRF-music limits the calculated frequency range, and the angle-limited SEVD-music limits the calculated direction. This greatly reduced the calculation cost. HIST-music removes noise by adding simple processing to SEVD-music; therefore, the RTF is almost the same as that of SEVD-music. HIST-music-3D repeats the same simple processing as HIST-music for each frequency bin, resulting in an increase in the RTF of 0.05 compared to SEVD-music. However, the RTF of HIST-music-3D is still lower than 1, indicating that HIST-music-3D can perform real-time SSL.
3.3.3. Versatility
To evaluate versatility, success rates and searchable ranges were calculated for different ego-noises, as in Section 3.3.1. The ego-noise of DJI Inspire 2 with a high-altitude propeller and ACSL (Tokyo, Japan) MS-06LA were used for different ego-noises, and evaluation signals were created. Figure 24 shows examples of spatial spectra obtained by processing the evaluation signals with SEVD-music. As can be seen, the ego-noise has different characteristics from that in Section 3.2. The created evaluation signals were processed with HIST-music and HIST-music-3D, and the results were compared.
Figure 25 and Figure 26 show the calculated success rate and searchable range rate for different ego-noises. The horizontal axis represents the SNR, and the vertical axis represents the success rate and the searchable range rate, respectively. The solid lines show the results for DJI Inspire 2 with the normal propeller shown in Section 3.3.1, the dashed lines show the results for DJI Inspire 2 with a high-altitude propeller, and the dotted lines show the results for ACSL MS-06LA. Figure 27 and Figure 28 show the success rate for each set DOA at the SNR of dB when the ego-noise of DJI Inspire 2 with a high-altitude propeller and ACSL MS-06LA was used. Each set DOA follows the axes given in Figure 2, and the success rate for each set DOA is depicted in a color map. The results of HIST-music show that the success rate and the searchable range differ, depending on the ego-noise. This is because HIST-music does not consider frequency information, so the range where localization fails changes when the ego-noise characteristics change, as shown in Figure 27a and Figure 28a. On the other hand, the results of HIST-music-3D do not change significantly even if the ego-noise is different, and a high success rate and large search range are achieved. This is because HIST-music-3D considers frequency information, so even if the ego-noise characteristics change, the ego-noise component is accurately excluded, and the range in which localization fails does not change, as shown in Figure 27b and Figure 28b. Therefore, it was found that HIST-music-3D has high versatility.
These results confirm that the proposed method, HIST-music-3D, has a high tolerance for quickly changing dynamic noise, a large searchable range, high real-time performance, and high versatility and that it is practical in real environments.
The performance of the conventional methods used for comparison is not necessarily consistent with that introduced in each method [16,17,19,21,22,23], and lower performance was observed in this evaluation experiment. The decline in performance was considered to occur because the previous evaluation experiments were not closer to a real environment, such as using ego-noise while hovering. In this paper, the evaluation experiments were performed under more severe conditions assumed in a real environment; therefore, the performance of the conventional method declined. The proposed method was developed using data obtained under such severe conditions, and thus, the performance was improved compared to the conventional method. On the other hand, it is necessary to know the performance limitations of the proposed method for its practical use in search and rescue operations, for example, for how low an SNR the target sound can be localized, whether it is possible to localize sounds other than voice and whistle sounds, whether it can handle a variety of drone models, and so on. These performance limitations need to be clarified in future work.
The issue of the proposed method is the flying speed of the drone that can localize the sound source. In this experiment, the maximum speed of the drone was 3 m/s. Including our proposed method, music-based SSL methods do not consider that the target sound direction relative to the microphone array changes within the processing frame (0.5 s in this experiment). For example, if the drone is flying at a speed of 3 m/s, the maximum change in the target sound direction in a processing frame is 8.5 deg., and if it is flying at a speed of 10 m/s, the maximum change is 26.6 deg. If there is a large change in the target sound direction within a processing frame, accurate SSL cannot be achieved. Based on this reason and the results of this experiment, the maximum speed of the drone at which drone audition technology is useful is considered to be a few m/s. However, for prompt search and rescue tasks, SSL at faster drone speeds needs to be addressed in future work.
4. Conclusions
In this paper, we have proposed a novel SSL method using a drone-embedded microphone array to satisfy four requirements for drone audition: a high tolerance for quickly changing dynamic noise, a large searchable range, high real-time performance, and high versatility. The proposed method dynamically extracts ego-noise and target sound components from a three-dimensional spatial spectrum with directional and frequency axes at the current time using histogram information. The DOA of the target sound is estimated by separating them using continuity and extracting only the target sound component. These are performed using only simple calculations. Therefore, all the requirements are satisfied simultaneously. Evaluation experiments using the ego-noise recorded in a real outdoor environment show that the localization performance of the proposed method is higher than that of the existing and previously proposed methods, indicating the usefulness of the proposed method.
Author Contributions
Conceptualization, K.H., I.K. and N.I.; methodology, K.H., I.K. and N.I.; software, I.K.; validation, K.H., I.K. and N.I.; formal analysis, I.K.; investigation, K.H., I.K. and N.I.; resources, K.H. and N.I.; data curation, I.K.; writing—original draft preparation, K.H.; writing—review and editing, K.H., I.K. and N.I; visualization, I.K.; supervision, K.H.; project administration, K.H.; funding acquisition, K.H. All authors have read and agreed to the published version of the manuscript.
Funding
This work was funded by JSPS (Japan Society for the Promotion of Science) KAKENHI Grant No. JP22K14218 and the Ono Charitable Trust for Acoustics.
Data Availability Statement
Data are contained within the article.
Conflicts of Interest
The authors declare no conflicts of interest.
References
- World Health Organization. Türkiye Earthquake: External Situation Report no. 4: 6–12 March 2023. Available online: https://www.who.int/europe/publications/i/item/WHO-EURO-2023-7145-46911-68727 (accessed on 24 March 2023).
- World Health Organization. Whole of Syria: Situation Report, 3–12 March 2023. Available online: https://www.emro.who.int/images/stories/syria/whole-of-syria-sit-rep-6-12-march-2023.pdf (accessed on 24 March 2023).
- Tadokoro, S. Disaster Robotics: Results from the ImPACT Tough Robotics Challenge; Springer: Berlin, Germany, 2019; pp. 1–528. [Google Scholar]
- Quan, A.; Herrmann, C.; Soliman, H. Project Vulture: A Prototype for Using Drones in Search and Rescue Operations. In Proceedings of the 15th International Conference on Distributed Computing in Sensor Systems (DCOSS), Santorini, Greece, 29–31 May 2019; pp. 619–624. [Google Scholar] [CrossRef]
- Sambolek, S.; Ivasic-Kos, M. Automatic Person Detection in Search and Rescue Operations Using Deep CNN Detectors. IEEE Access 2021, 9, 37905–37922. [Google Scholar] [CrossRef]
- Tanida, N. What happened to elderly people in the great Hanshin earthquake. BMJ 1996, 313, 1133–1135. [Google Scholar] [CrossRef] [PubMed]
- Go, Y.-J.; Choi, J.-S. An Acoustic Source Localization Method Using a Drone-Mounted Phased Microphone Array. Drones 2021, 5, 75. [Google Scholar] [CrossRef]
- Wang, L.; Cavallaro, A. Deep Learning Assisted Time-Frequency Processing for Speech Enhancement on Drones. IEEE Trans. Emerg. Top. Comput. Intell. 2021, 5, 871–881. [Google Scholar] [CrossRef]
- Strauss, M.; Mordel, P.; Miguet, V.; Deleforge, A. DREGON: Dataset and Methods for UAV-Embedded Sound Source Localization. In Proceedings of the IEEE/RSJ International Conference on Intelligent Robots and Systems (IROS), Madrid, Spain, 1–5 October 2018; pp. 1–8. [Google Scholar] [CrossRef]
- Ishiki, T.; Washizaki, K.; Kumon, M. Evaluation of Microphone Array for Multirotor Helicopters. J. Robot. Mechatron. 2017, 29, 168–176. [Google Scholar] [CrossRef]
- Nonami, K.; Hoshiba, K.; Nakadai, K.; Kumon, M.; Okuno, H.G.; Tanabe, Y.; Yonezawa, K.; Tokutake, H.; Suzuki, S.; Yamaguchi, K.; et al. Recent R&D Technologies and Future Prospective of Flying Robot in Tough Robotics Challenge. In Disaster Robotics; Tadokoro, S., Ed.; Springer: Cham, Switzerland, 2019; pp. 77–142. [Google Scholar] [CrossRef]
- Madokoro, H.; Yamamoto, S.; Watanabe, K.; Nishiguchi, M.; Nix, S.; Woo, H.; Sato, K. Prototype Development of Cross-Shaped Microphone Array System for Drone Localization Based on Delay-and-Sum Beamforming in GNSS-Denied Areas. Drones 2021, 5, 123. [Google Scholar] [CrossRef]
- Noda, R.; Nakata, T.; Senda, K.; Liu, H. Multi-scale morphological effect on noise level and frequency characteristics of drone propellers. In Proceedings of the Quiet Drones, Paris, France, 19–21 October 2020. [Google Scholar]
- Hoshiba, K.; Noda, R.; Nakata, T.; Liu, H.; Senda, K.; Nakadai, K.; Kumon, M.; Okuno, H.G. Development of surface-processed low-noise propeller for search and rescue tasks with drone audition. In Proceedings of the Quiet Drones, Paris, France, 19–21 October 2020. [Google Scholar]
- Noda, R.; Nakata, T.; Senda, K.; Liu, H. Development of Microstructured Low Noise Propeller for Aerial Acoustic Surveillance. In Proceedings of the 2021 IEEE/SICE International Symposium on System Integration (SII), Iwaki, Japan, 11–14 January 2021; pp. 482–486. [Google Scholar] [CrossRef]
- Schmidt, R.O. Multiple emitter location and signal parameter estimation. IEEE Trans. Antennas Propag. 1986, 34, 276–280. [Google Scholar] [CrossRef]
- Nakamura, K.; Nakadai, K.; Asano, F.; Hasegawa, Y.; Tsujino, H. Intelligent sound source localization for dynamic environments. In Proceedings of the IEEE/RSJ International Conference on Intelligent Robots and Systems (IROS), St. Louis, MO, USA, 10–15 October 2009; pp. 664–669. [Google Scholar] [CrossRef]
- Nakamura, K.; Nakadai, K.; Ince, G. Real-time super-resolution Sound Source Localization for robots. In Proceedings of the IEEE/RSJ International Conference on Intelligent Robots and Systems (IROS), Vilamoura-Algarve, Portugal, 7–12 October 2012; pp. 694–699. [Google Scholar] [CrossRef]
- Okutani, K.; Yoshida, T.; Nakamura, K.; Nakadai, K. Outdoor auditory scene analysis using a moving microphone array embedded in a quadrocopter. In Proceedings of the IEEE/RSJ International Conference on Intelligent Robots and Systems (IROS), Vilamoura-Algarve, Portugal, 7–12 October 2012; pp. 3288–3293. [Google Scholar] [CrossRef]
- Ohata, T.; Nakamura, K.; Mizumoto, T.; Tezuka, T.; Nakadai, K. Improvement in outdoor sound source detection using a quadrotor-embedded microphone array. In Proceedings of the IEEE/RSJ International Conference on Robots and Intelligent Systems (IROS), Chicago, IL, USA, 14–18 September 2014; pp. 1902–1907. [Google Scholar] [CrossRef]
- Hoshiba, K.; Washizaki, K.; Wakabayashi, M.; Ishiki, T.; Kumon, M.; Bando, Y.; Gabriel, D.; Nakadai, K.; Okuno, H.G. Design of UAV-Embedded Microphone Array System for Sound Source Localization in Outdoor Environments. Sensors 2017, 17, 2535. [Google Scholar] [CrossRef] [PubMed]
- Hoshiba, K.; Nakadai, K.; Kumon, M.; Okuno, H.G. Assessment of music-Based Noise-Robust Sound Source Localization with Active Frequency Range Filtering. J. Robot. Mechatron. 2018, 30, 426–435. [Google Scholar] [CrossRef]
- Komatsuzaki, I.; Hoshiba, K.; Takeda, Y.; Sugahara, Y. Propopsal of noise-robust sound source localization method using histogram information for quickly changing dynamic noise. In Proceedings of the 40th Annual Conference of the Robotics Society if Japan, Tokyo, Japan, 5–9 September 2022. (In Japanese). [Google Scholar]
- Mori, S.; Hirata, S.; Yamaguchi, T.; Hachiya, H. Quantitative evaluation method for liver fibrosis based on multi-Rayleigh model with estimation of number of tissue components in ultrasound B-mode image. Jpn. J. Appl. Phys. 2018, 57, 07LF17. [Google Scholar] [CrossRef]
Figure 1.
Example of microphone array installation on a drone.

Figure 2.
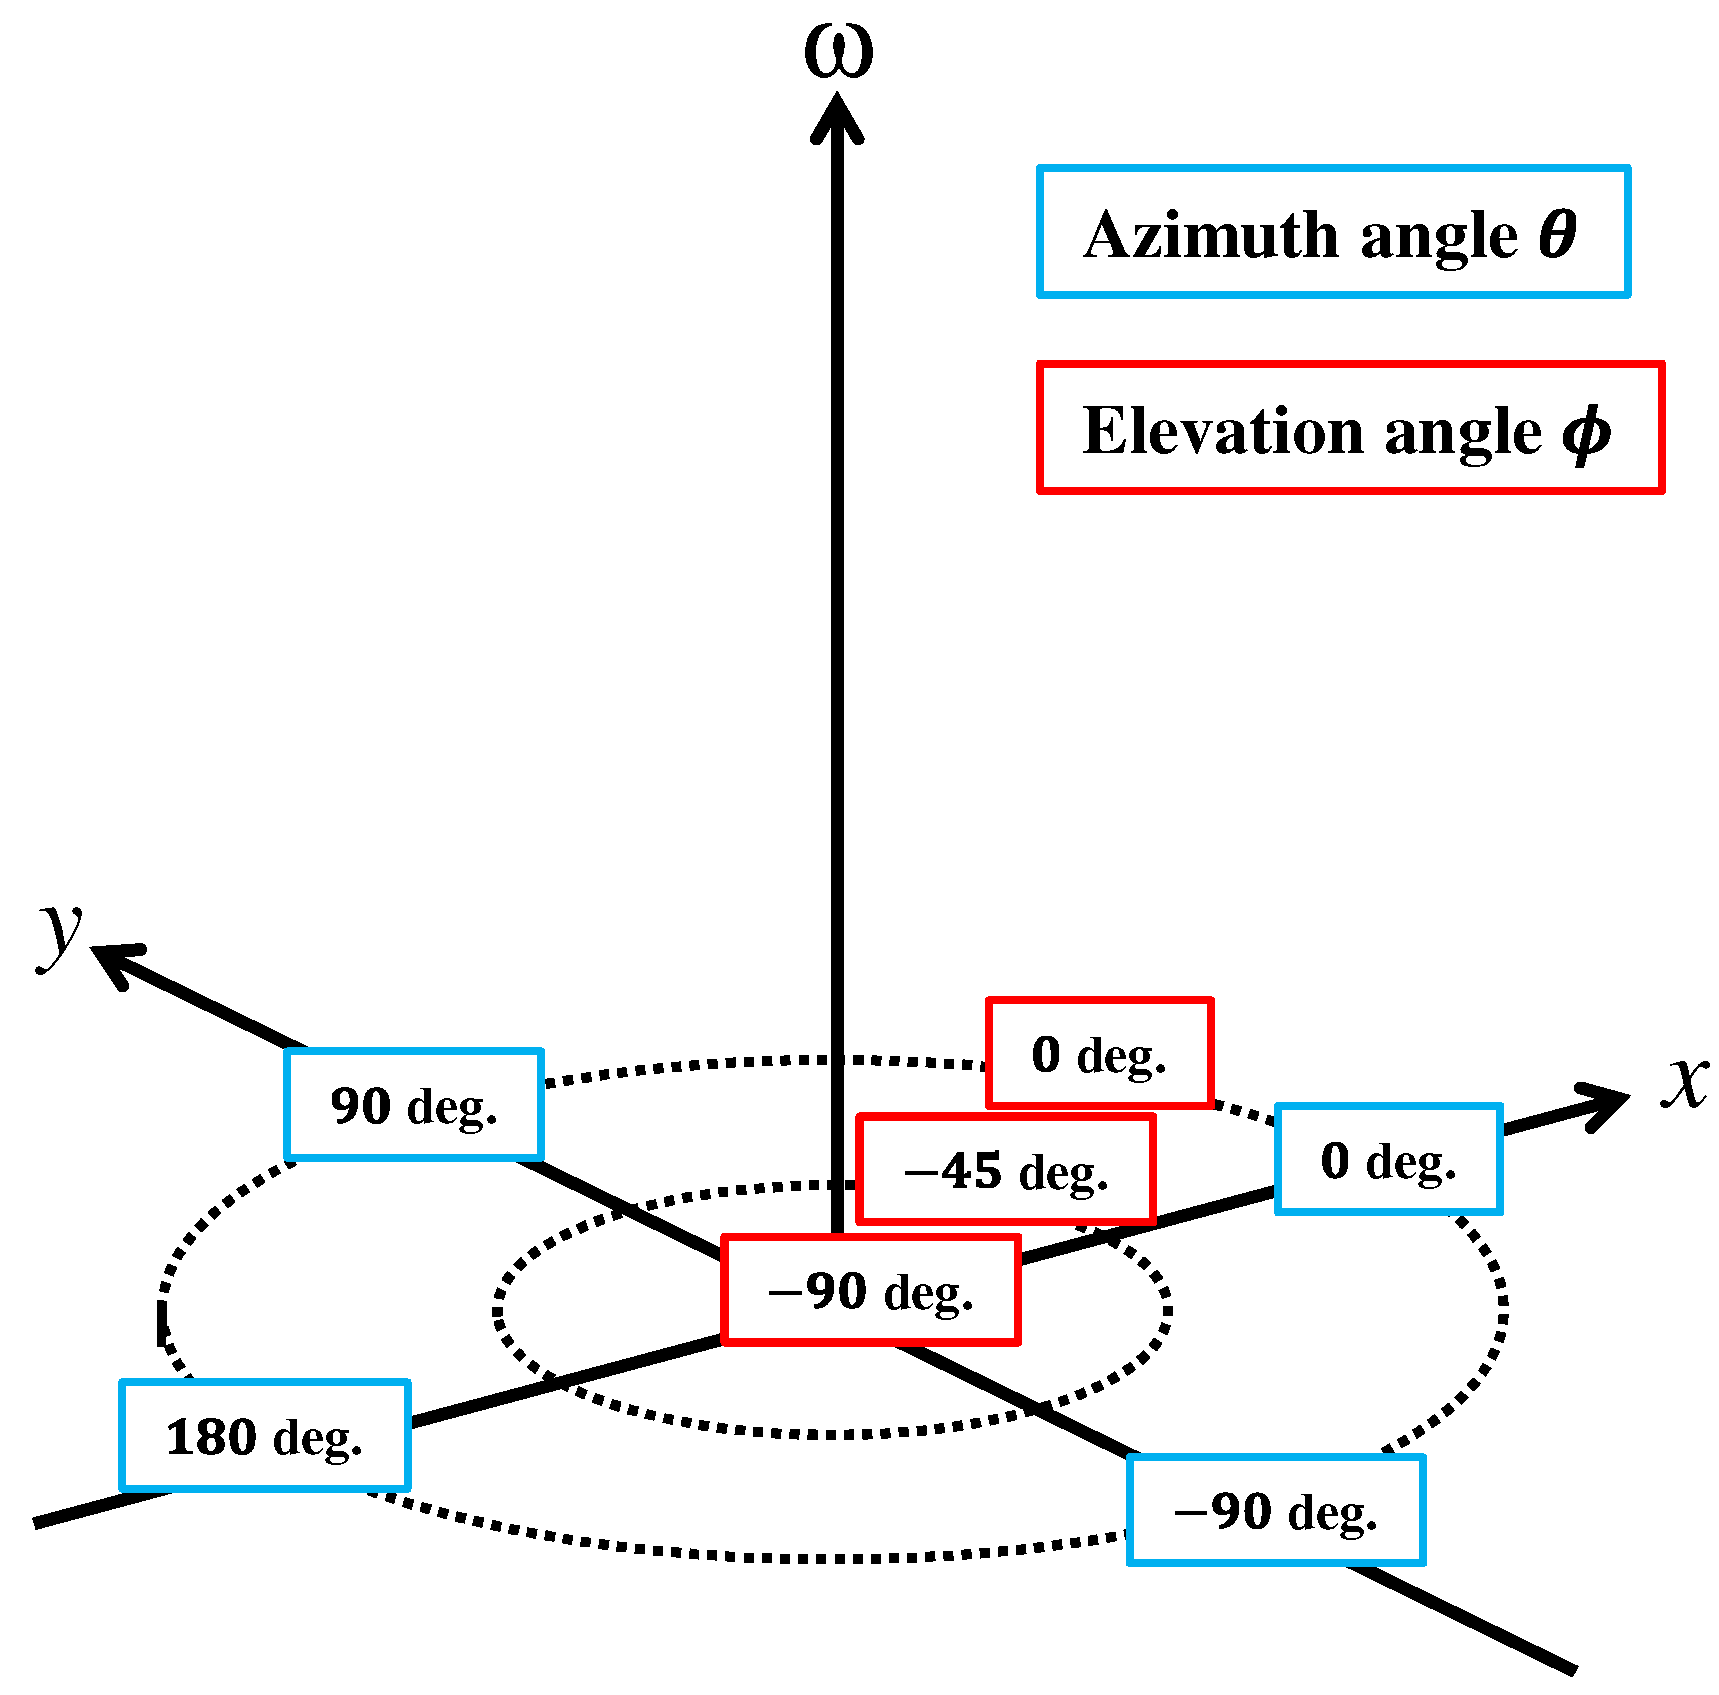
Setting of the coordinate system of the azimuth angle and the elevation angle when plotting spatial spectra.
Figure 2.
Setting of the coordinate system of the azimuth angle and the elevation angle when plotting spatial spectra.

Figure 3.
Example of spatial spectrum calculated via SEVD-music. is .

Figure 4.
Schematic diagram of histograms. The solid black line is the obtained histogram, H, the red dotted line is the histogram of the target sound component, , the blue dotted line is the histogram of the ego-noise component, , the circle mark is the maximum value of the target sound component, , and the square mark is the inflection point of H, .

Figure 5.
Histograms of actual experimental spatial spectrum. The solid black line is the obtained histogram, H, the red dotted line is the histogram of the target sound component, , the blue dotted line is the histogram of the ego-noise component, , the circle mark is the maximum value of the target sound component, , and the square mark is the inflection point of H, .

Figure 6.
Components with a higher power than the reference value in the spatial spectrum shown in Figure 3, .
Figure 6.
Components with a higher power than the reference value in the spatial spectrum shown in Figure 3, .

Figure 7.
Separated result of the ego-noise component from Figure 6. is the reference direction.
Figure 7.
Separated result of the ego-noise component from Figure 6. is the reference direction.

Figure 8.
Separated result of the target component from Figure 6.
Figure 8.
Separated result of the target component from Figure 6.

Figure 9.
Example of spatial spectrum calculated via SEVD-music. is .

Figure 10.
Separated result of the ego-noise component from Figure 9 using HIST-music.
Figure 10.
Separated result of the ego-noise component from Figure 9 using HIST-music.

Figure 11.
Setting of the coordinate system of azimuth angle , elevation angle , and frequency when plotting three-dimensional spatial spectra.
Figure 11.
Setting of the coordinate system of azimuth angle , elevation angle , and frequency when plotting three-dimensional spatial spectra.

Figure 12.
Obtained in three dimensions. is .

Figure 13.
Separated result of the ego-noise component and the target sound component from Figure 12. The red cluster is , and the blue cluster is . is the reference direction.
Figure 13.
Separated result of the ego-noise component and the target sound component from Figure 12. The red cluster is , and the blue cluster is . is the reference direction.

Figure 14.
Two-dimensional spatial spectrum , which is the sum of over the direction.

Figure 15.
Drone and microphone array used in the experiments.

Figure 16.
Microphone positions in the microphone array.

Figure 17.
Spectrograms of target sound samples.

Figure 18.
Calculated spatial spectra. SNR: dB, target sound: whistle, : , flight speed: hovering.

Figure 19.
Calculated spatial spectra. SNR: dB; target sound: whistle; : ; flight speed: 3 m/s.

Figure 20.
Calculated spatial spectra. SNR: dB; target sound: whistle; : ; flight speed: 3 m/s.

Figure 21.
Success rate of SSL for each SSL method.

Figure 22.
Searchable range rate of SSL for each SSL method.

Figure 23.
Success rate for each set DOA at the SNR of dB.

Figure 24.
Examples of spatial spectra processed via SEVD-music.

Figure 25.
Success rate of SSL for different ego-noises.

Figure 26.
Searchable range rate of SSL for different ego-noises.

Figure 27.
Success rate for each set DOA at the SNR of dB when the ego-noise of DJI Inspire 2 with a high-altitude propeller was used.
Figure 27.
Success rate for each set DOA at the SNR of dB when the ego-noise of DJI Inspire 2 with a high-altitude propeller was used.

Figure 28.
Success rate for each set DOA at the SNR of dB when the ego-noise of ACSL MS-06LA was used.
Figure 28.
Success rate for each set DOA at the SNR of dB when the ego-noise of ACSL MS-06LA was used.


Table 1.
Pros and cons of music-based sound source localization methods. ◯ indicates high performance, and × indicates poor performance for each evaluation item.
Table 1.
Pros and cons of music-based sound source localization methods. ◯ indicates high performance, and × indicates poor performance for each evaluation item.
| Method | Tolerance for Static Noise | Tolerance for Dynamic Noise (Slowly Changing) | Tolerance for Dynamic Noise (Quickly Changing) | Search Range | Real-Time Performance | Versatility |
|---|---|---|---|---|---|---|
| SEVD-music | × | × | × | ◯ | ◯ | ◯ |
| GEVD-music | ◯ | × | × | ◯ | × | × |
| GSVD-music | ||||||
| iGEVD-music | ◯ | ◯ | × | ◯ | × | ◯ |
| iGSVD-music | ||||||
| Angle-limited | ◯ | × | × | × | ◯ | × |
| SEVD-music | ||||||
| AFRF-music | ◯ | ◯ | × | ◯ | ◯ | ◯ |
Table 2.
SSL methods used for evaluation.
| 1. SEVD-music |
| 2. GEVD-music |
| 3. iGEVD-music |
| 4. AFRF-music |
| 5. Angle-limited SEVD-music (1) (Azimuth range: deg.) |
| 6. Angle-limited SEVD-music (2) (Azimuth range: deg.) |
| 7. HIST-music |
| 8. HIST-music-3D |
Table 3.
Measurement results of RTF.
| Method | RTF |
|---|---|
| SEVD-music | 0.92 |
| GEVD-music | 1.09 |
| iGEVD-music | 1.23 |
| AFRF-music | 0.18 |
| Angle-limited SEVD-music (1) | 0.54 |
| Angle-limited SEVD-music (2) | 0.73 |
| HIST-music | 0.93 |
| HIST-music-3D | 0.97 |
Disclaimer/Publisher’s Note: The statements, opinions and data contained in all publications are solely those of the individual author(s) and contributor(s) and not of MDPI and/or the editor(s). MDPI and/or the editor(s) disclaim responsibility for any injury to people or property resulting from any ideas, methods, instructions or products referred to in the content. |
© 2024 by the authors. Licensee MDPI, Basel, Switzerland. This article is an open access article distributed under the terms and conditions of the Creative Commons Attribution (CC BY) license (https://creativecommons.org/licenses/by/4.0/).
Share and Cite
MDPI and ACS Style
Hoshiba, K.; Komatsuzaki, I.; Iwatsuki, N. Proposal of Practical Sound Source Localization Method Using Histogram and Frequency Information of Spatial Spectrum for Drone Audition. Drones 2024, 8, 159. https://doi.org/10.3390/drones8040159
AMA Style
Hoshiba K, Komatsuzaki I, Iwatsuki N. Proposal of Practical Sound Source Localization Method Using Histogram and Frequency Information of Spatial Spectrum for Drone Audition. Drones. 2024; 8(4):159. https://doi.org/10.3390/drones8040159
Chicago/Turabian StyleHoshiba, Kotaro, Izumi Komatsuzaki, and Nobuyuki Iwatsuki. 2024. "Proposal of Practical Sound Source Localization Method Using Histogram and Frequency Information of Spatial Spectrum for Drone Audition" Drones 8, no. 4: 159. https://doi.org/10.3390/drones8040159