
Treatment of Water Contaminated by Ship Oil: Study of Adsorption in a Fixed-Bed Column
by
 , ,
, ,
Rachel de M. Ferreira
1,2,* ,
,
Bernardo Dia Ribeiro
2,
Danielle M. A. Stapelfeldt
3 and
Maria de F. R. Moreira
1 1
National School of Public Health, Oswaldo Cruz Foundation, 1480 Leopoldo Bulhões St., Rio de Janeiro 21041-210, RJ, Brazil
2
Biochemical Engineering Department, School of Chemistry, Federal University of Rio de Janeiro—UFRJ, Rio de Janeiro 21941-909, RJ, Brazil
3
Departament of Chemistry, Federal University of Rio de Janeiro, 50 Aluísio da Silva Gomes St., Macaé 27930-560, RJ, Brazil
*
Author to whom correspondence should be addressed.
Analytica 2024, 5(2), 203-218; https://doi.org/10.3390/analytica5020013
Submission received: 22 March 2024
/
Revised: 12 April 2024
/
Accepted: 14 April 2024
/
Published: 1 May 2024
Abstract
:Aquatic macrophytes like Salvinia sp. have rapid proliferation and a great capacity for ecological adaptation. In addition to these characteristics, this study points to their ability to adsorb contaminants such as dyes, metals, and oils. This work aims, through an adsorption study, to propose an alternative treatment using chemically modified Salvinia sp. (SOH) biomass to remove oil from water. Batch adsorption experiments were performed to observe the effects of concentration, pH, time, temperature, desorption, and reuse of the biomass. The adsorption mechanisms, performance, kinetics, isotherm, thermodynamics, and reusability of biomass were evaluated. Both adsorbents were well-defined by the Freundlich model isotherm. According to the results obtained, the qmax was 898.0 mg g−1 for SOH in oil-in-salt water emulsion in 15 min and 930.59 mg g−1 for Salvinia sp. in natura (SS) in the oil-in-water emulsion. In the fixed-bed column adsorption, the adsorption capacity was 2.99 g g−1 for SS and 3.49 g g−1 for SOH, and the saturation capacity was 42.89 g g−1 SS and 42.99 g g−1 SOH. According to the adsorption models, the Bohart–Adams model best fits the experimental data of this study. The SOH adsorbed oil recovery test was successful, with 100% oil recovery.
1. Introduction
Maritime transport is the preferred choice to meet the intercontinental trade needs of the most diverse consumer goods. However, these transports generate a large amount of oil sludge deposited in the waste tanks, which produce complex emulsions. They have many toxic, mutagenic, and carcinogenic components [1,2].
Various conventional remediation techniques for oily wastewater have been used in many methods, employing different technologies. Remediation procedures include adsorption, air flotation, membrane filtration, extraction, electrocoagulation, wet oxidation, electrolytic oxidation, and catalytic ozone oxidation. Although these treatments can be used to clean oily effluents quickly, they are expensive and can produce additional toxic products and secondary contamination. Moreover, they need to reach a satisfactory solution from a resource recycling point of view [1,2,3,4,5,6,7].
Adsorption is one of the most used techniques at present due to its high efficiency in treating effluents and wastewater. It can remove contaminants in high and trace concentrations and broadly applies to various pollutants [2,6,8,9,10]. The sorbent must be highly selective for oil adsorption and have oleophilic and hydrophobic properties for separating oil–water mixtures [11]. Its main advantage is transferring contaminant species from the effluent to a solid phase, thereby reducing the disposal volume to a minimum. As an advantage over other separation operations, adsorption has a low energy consumption, allows for the separation of mixtures, and does not need more components to aid the separation [12,13,14].
Adsorption studies have found diverse materials for oil removal for varied materials and purposes. Among them is research related to the use of activated carbon produced by Casuarina equisitifolia for the removal of hydrocarbons [15], the membrane made of chitosan cellulase for emulsified oil separation [7], graphene aerogel for oil/water emulsion separation [16], functionalized nano-silica for oil removal in oil drilling water [17], and graphene nanoplatelets for oil removal in emulsion [18].
Using alternative adsorbent materials obtained from organic waste is currently considered an effective method for the contaminant removal process in solution, with low cost and low complexity [19,20]. Among these materials is Salvinia sp.; based on our previous studies, the biomass from this macrophyte obtained potential oil adsorption capacity [21]. It was verified that the chemically modified biomass of Salvinia is capable of satisfactorily adsorbing metals [20,22], dyes [23], and oils [21]. Based on this evidence, this study aimed to propose an alternative treatment using chemically modified biomass of Salvinia sp. to remove organic compounds from oil emulsions. The chemical modification of the surface structure of Salvinia sp. biomass is based on the hypothesis that it is possible to chemically modify the structure of the biomass so that it obtains greater adsorptive for the contaminant of interest, in the case of this study, ship engine oil. According to the column adsorption studies and analysis of the adsorption models that best fit the biosorbent in this work, the results obtained serve as a basis for the application of this technique in situ.
2. Materials and Methods
2.1. Biosorbent Preparation and Physicochemical Characterization
Obtaining the biomass of Salvinia sp. in natura (SS) and chemically modified Salvinia sp. (SOH) was performed according to the methodology previously described by Ferreira et al. [21]. Briefly, the macrophytes were collected in the Iriry Lagoon, Rio das Ostras, Brazil, then washed with tap water and, finally, washed with distilled water. They were dried in the sun for approximately 72 h and then dried in an oven at 333 K. After this process, the dry biomass was crushed until a particle size between 2 mm and 0.25 mm was obtained. Then, the crushed biomass was subjected to contact with 1 mol L−1 NaOH solution and, finally, washed with distilled water until a neutral pH was achieved.
Measurements of the specific surface area, micropore volume, and mean pore diameter were performed using the ASAP 2420 Micromeritcs surface area and porosity analyzer. The method was the adsorption of high-purity gaseous nitrogen using a liquid nitrogen bath under cryogenic conditions (T = 77 K).
For X-ray diffraction (XRD) analysis, freeze-dried samples were placed in the sample port of the diffractometer, which was programmed to focus X-rays from a source of Cu Kα (λ = 1, 54,060 Ǻ) on the sample with a variety of angles 2θ between 5 and 50° with intervals of 0.02°, a voltage of 40 kV, and a current of 30 mA.
2.2. Batch Adsorption Tests
Emulsions were prepared for the adsorption tests with Mobil Delvac SAE 40 ship engine oil, an emulsion in distilled water, and another in distilled water and 5 g L−1 NaCl, both at pH = 2. The solution was stirred for 10 min at approximately 18,000 rpm. The extraction of oil from water was conducted.
All tests were carried out in triplicate, and the mean and calculated value of the standard deviation (sd) were considered as the result and placed in the legends of the corresponding graphs.
To study the effect of the initial oil concentration and adsorption isotherms, 50 mg of the biosorbent was weighed and left in agitation for 15 min at 298 K, with 50 mL of the emulsion, whose oil concentrations ranged from 50 to 2000 mg L−1. After the contact time, 5 mL aliquots were removed, and the extraction was performed with chloroform and an analysis of the remaining oil concentration in a UV-visible spectrophotometer (model UV-2600 SHIMADZU, Kyoto, Japan) read at 239 nm. The same procedure described above was performed for systems containing only the emulsions, which this work called a blank.
For the contact time and temperature variation, 150 mg of the biosorbent was weighed and stirred with 150 mL of emulsion with a 100 mg L−1 oil concentration, removing aliquots occasionally. After this, each aliquot was extracted with chloroform to analyze in the UV-visible spectrophotometer. The test was performed at the following temperatures: 288, 298, and 308 K.
The kinetic models were studied by applying them in a nonlinear form, using the Solver method in Excel to obtain the values of the constants referring to the pseudo-second-order kinetic models, Elovich and intraparticle diffusion.
To study the effect of pH variation, we weighed 50 mg of the biosorbent and left it to stir for 15 min with 50 mL of emulsion with a 200 mg L−1 oil concentration, whose pHs were 2, 4, 6, and 8.
2.3. Desorption Test
A total of 50 mg of the biomass was agitated for 15 min with 50 mL of a 200 mg L−1 oil concentration emulsion. After this time, one aliquot of 5 mL was removed for concentration analysis. Then, 5 mL of 10% HNO3 (v/v) was added to the system and agitated for 15 min. Finally, the extraction and quantification of the final oil concentration were performed. The same procedure was conducted with a 5 mol L−1 NaOH solution.
2.4. Recovery Tests
A total of 25 mg of biomass was agitated for 15 min with 25 mL of 200 mg L−1 emulsion. After the extraction process with chloroform was conducted in the system, 25 mL was added and stirred in a closed system. At the end of the period, the organic phase (chloroform + oil) was removed for quantification.
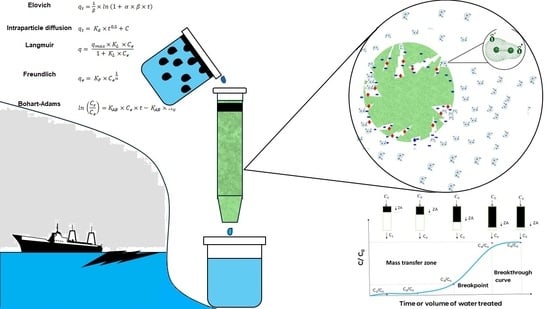
2.5. Fixed-Bed Column Adsorption Tests
This test was performed according to the same system in previous studies by Ferreira et al. [21]. The column is 10 cm high and has a volume of 2.8 mL, with a flow rate of 0.58 mL/min and an average percolation time of 5 min. The column was packaged with 250 mg of biosorbent. The oily emulsion flow was conducted using gravity and controlled using a valve. The flow rate of the solution containing the emulsion was maintained at a constant and uninterrupted rate until the column was saturated. Aliquots were taken from time to time until column point saturation occurred. The biomass was removed from the column and washed extensively with chloroform to verify the biosorption magnitude. The UV-visible spectrophotometer was used to quantify these solutions.
After calculating the column parameters, the adsorption model for Bohart–Adams columns was applied. The study of the model was conducted with the graph of ln (Ct/Co) versus t, which provides the value of the correlation coefficient (R2), kinetic constant (KAB), and saturation concentration (N0).
To obtain the milligram of oil adsorbed per gram of biomass for all adsorption tests, we performed the calculation according to Equation (1). The graphs of the adsorption isotherms for each biosorbent were obtained through the qe × Ce graph.
where qe = mass of oil adsorbed per gram of adsorbent, mg g−1; V0 = initial emulsion volume (blank), L; C0 = initial emulsion concentration, mg L−1; Ve = final volume of the emulsion, L; Ce = final emulsion concentration, and mg L−1; m = biomass mass, g.
The percentage of oil removal efficiency by biosorbents was determined using Equation (2).
2.6. Kinetic and Isothermal Nonlinear Models and Their Statistical Evaluations
The studies of the isotherms were applied to the Langmuir and Freundlich models in nonlinear form, using the Solver method in Excel to obtain the values of the specific constants of the models.
The kinetic nonlinear models of the pseudo-second order, Elovich, and intraparticle diffusion were utilized to approximate the empirical kinetic data. The isothermal experimental data was fitted using the nonlinear models of Freundlich, Langmuir, and Bohart–Adams. These models were selected because they are classical models for adsorption kinetic studies and because, in general, adsorbent biomasses of plant origin tend to behave within the parameters of these models presented in Table 1.
The data on the variation of Gibbs free energy (ΔG), the variation of enthalpy (ΔH), and entropy (ΔS) are obtained through the graph of ln(Kad) versus 1/T (Van’t Hoff graph), obtaining from its linearization the thermodynamic parameters ΔH and ΔS with the angular and linear coefficient of the straight line equation, respectively (Equation (3)). ΔG is obtained using Equation (4) [24,25,26].
where Kad = equilibrium constant in the adsorption process; R = gas constant, 8.314 J mol−1 K−1; and T = temperature, K.
For quantitative analytical tests, statistical tests of dispersion measures were applied as the mean of standard deviation from each test. For the adsorption tests, the paired t-student statistical test was performed to compare the means of independent populations with a confidence level of 95% in Excel. To this end, a normality test was performed using the Shapiro–Wilk test, and a descriptive test of the dataset was followed by the homogeneity test using the Levene test, all performed in Excel using the Real statistics tool. The nonparametric Mann–Whitney test was applied with a 99% confidence level for the nonparametric dataset.
3. Results and Discussion
3.1. Physicochemical Characterization of Biosorbents
The surface area of SOH showed changes in SS, as seen in Figure 1A,B. The isotherm obtained using the BET method shows a linear relationship between the increase in relative pressure and the adsorption of N2. According to the IUPAC classification, Type II is the isotherm that best represents the biomass’s behavior from this study. This isotherm is specific for mesoporous and macroporous adsorbents, in which N2 adsorption occurs in multilayers. This category of isotherm is characterized by having two inflection points. The first, concave to the P/P0 axis, indicates that the monolayer has been filled, while the second, with inflection convex to the P/P0 axis, designates the saturation point. The linear part between the two inflection points marks the multilayer adsorption [27].
The SS biomass isotherm, Figure 1A, obtained a first slightly concave inflection; this suggests that the monolayer may not be filled before adsorption in the upper layers occurs. The SOH biomass presented loops of hysteresis of the H3 type and the SS of the H4 type. According to IUPAC, these types of hysteresis are observed in aggregates of plate-like particles, which give rise to slit-shaped pores and presents swelling of a nonrigid porous structure due to the isotherm presenting a hysteresis loop at low pressures [27].
It is possible to verify that the isotherms obtained for biomasses with relative pressure close to one obtain a more significant vertical rise, reflecting the presence of macropores. If the extension of these macropores is large, the vertical line tendency is greater [27].
Table 2 shows that the BET method’s mean diameter revealed a predominance of mesopores for both biomasses. Comparing SOH with SS, the former showed a decrease in pore size. Consequently, there was a minor increase in the specific surface area of SOH concerning SS.
With this result, it is possible to infer that the chemical modification caused an increase in the surface area of the SOH biomass attributive SS. There is a growing interaction with the adsorbent–adsorbate corresponding to the surface area, increasing the consecutively upgrading biomass adsorptive capacity.
According to the XRD analysis in Figure 2, it is can be observed that both biomasses present a typical signal of amorphous cellulose composite at 2θ = 20° and 26° [23,28,29]. The lowest intensity peaks between 2θ = 35° and 45° may refer to inorganic substances (ash) [30].
In work by Souza and Carvalho [31], the pretreatment using organosolve in the residual eucalyptus biomass revealed an increase in the characteristic peak intensity of the chemically modified biomass compared to in nature. This was justified during the treatment with acid in the most susceptible regions to suffer an attack, which are the amorphous regions composed of hemicellulose and lignin. Given the result, an increase in peak intensity at 2θ = 26° for SOH indicates that Salvinia sp., because it also has lignocellulosic biomass in its composition, may increase peak intensity due to the chemical treatment.
Other physicochemical characterization tests for the biomasses of this study were previously performed by Ferreira et al. [21], in which it was possible to verify the change in the structure of SOH compared to SS, as well as the removal of lignin and cellulose. The results presented in the present study support the hypothesis that chemical modification favors oil adsorption in emulsions.
3.2. Batch Adsorption Tests
The four isotherms were obtained with the biosorbents SS and SOH for the emulsions with oil in distilled and salt water. As shown in Figure 3, both biomasses had good responses to the oil concentration variation in the two emulsion types and efficiency that varied from 83 to 99% of oil removal for all tests. In Figure 3A, the SS, with qmax of 846.51 mg g−1 tended to equilibrium at the points of highest concentration. SOH in Figure 3B, with qmax (836.42 mg g−1) close to SS biomass, obtained an increasing linear response in the adsorptive capacity as the initial oil concentration increased. However, there was no statistically significant evidence that the adsorption of SS was greater than SOH for the isotherm with the emulsion in distilled water with ship oil.
On the other hand, emulsions with saltwater tended to saturate at higher concentrations. The SS in Figure 3C obtained the highest qmax of all isotherms, 930.59 mg g−1, and the lowest saturation point. Although the SS obtained the best response, it presented high instability. Also, SOH in Figure 3D was saturated, but more mildly, and had a higher qmax (898.31 mg g−1) than its emulsion in distilled water. Higher adsorption of SS concerning SOH in the isotherm of emulsion in saltwater with oil was statistically proven.
For emulsions in saltwater, biomass adsorption was higher, and according to the literature, electrolytes tend to influence the solubilization of emulsions. In the case of the monovalent cation, Na+ competes for the water of hydration of the emulsifier, thus causing a decrease in the solubility of the emulsion (salting out), which increases the adsorption of oil on the surface of the adsorbents [18,32]. Therefore, the adsorption response was higher for both biomasses. Adsorption research in oil emulsion with fresh and saltwater for varied materials obtained better results for adsorption in a salt–oil emulsion. A study on adsorption and desorption in an oil emulsion with a membrane composed of thermo-responsive polyvinylidene fluoride and silica showed a considerable increase in adsorption with increasing NaCl concentration in the emulsion [32]. In the case of adsorption on biochar, the maximum amount adsorbed, measured experimentally, was 80% higher in the salty medium than in freshwater, showing that the presence of salt in the emulsion increased the oil adsorption [33].
A review study by Dai et al. [33] verified oil adsorption by biochar. The adsorption mechanism to remove organic pollutants depends on the contaminant’s nature and the chemical properties of the adsorbent surface. Differences in organic structure, electrical surface properties, and surface functional groups of the adsorbent material are essential attributes for different adsorption mechanisms. In the case of plant-origin adsorbents, organic contaminants’ adsorption mechanisms can be divided into electrostatic attraction, pore filling, π-π electron interaction with donor and acceptor, hydrogen bonding, adsorption complexes, and hydrophobic interactions. The adsorption capacity of the material increases with the increase in functional groups containing oxygen, which in part, occurs due to interactions of π-π electrons. Also, according to the study, the carboxylic acid, nitro, and ketone groups on the surface of the biosorbent function as electron acceptors and from the interaction of the π-π electron donor-acceptor with aromatic molecules. Several hydroxyl and amine groups on biosorbent can be π electron donor sites. Like SOH, the surface of biochar is electronegative, which causes electrostatic attraction between the adsorbent and positively charged organic compounds. The magnitude of electrostatic attraction depends on the size of each atomic charge and the distance between two atoms. The biosorbent with low surface oxidation exhibits hydrophobicity and indicates that adsorption occurs by hydrophobic interaction, pore filling, the noncarbonized fraction of partition, and π-π interaction. When the surface of the biosorbent has a negative charge, it is easy to attract the cationic organic compound electrostatically [33].
As biochar and SOH are of plant origin and have similar surface groups, it is possible to infer that the SOH adsorption mechanism occurs similarly. The decrease in hydrophilic compounds, such as cellulose and hemicellulose, removed with chemical modification, confer more hydrophobic character than SOH to SS. In the same way, the decrease in the average pore size can favor the oil adherence on the biomass’s surface.
The results of Langmuir and Freundlich’s nonlinear models from the isotherms above are in Table 3. The Freundlich model was the best fit for biomasses, which have heterogeneous adsorption sites and favorable adsorption, with n values more significant than one for both biosorbents [34].
Based on the results of the physicochemical characterization of the biomasses in the BET analysis, it was observed that the biomasses do not necessarily present complete adsorption of the first layer and have slit-shaped pores, highlighting an irregular structure. As for the Langmuir model, the R2 was lower, which corroborates the postulates for this model, which assumes monolayer adsorption and equally distributed active sites [35].
When comparing the results obtained in Table 4 with those described in the literature, the biomasses of this study are among the best results, especially for oil sorption in oil emulsions, whose maximum adsorption capacities ranged from 75.1 mg g−1 to 118.50 g g−1.
The adsorption kinetics of both biomasses did not show thermodynamic stability and showed desorption points over time for both biomasses, as shown in Figure 4. This result supports the hypothesis that this adsorption variability over time is due to emulsion instability [40].
SS performed better when compared to SOH with qmax in 15 min. After this period, it obtained desorption points two times, adsorbed again in 30 min, and desorbed in 35 and 40 min. However, the adsorption of SS higher than SOH at 298 K for emulsion was not statistically significant.
SOH presented the fastest adsorption kinetics, with its apex in 10 min. It followed the same behavior as the SS, with subsequent desorption points, again, the adsorption process in 30 min and desorption in 35 and 40 min.
This type of fast adsorption for oils was also verified by Barthlott et al. [41]. The surface of Salvinia sp. is in contact with a film of supernatant oil, with complete adsorption of the oil taking place in about 50 s. According to the research, this high speed of adsorption and transport was due to the surface structure, which has a hydrophobic and oleophilic surface. Likewise, the oil transport speed by the leaf occurs due to the high density of trichomes because the average distance of the hairs was 244.29 ± 38.27 µm in Salvinia. According to the authors, the vital prerequisite for a high capillary interaction between leaf hairs is the separation distance; smaller trichomes close together and transport oil much faster.
After adding these results to the Freundlich adsorption models, the adsorption process of both biomasses may be reversible, with the possibility of reusing them to treat effluents.
At temperatures of 288, 298, and 308 K, SS performed better than SOH. However, the adsorption of SS results greater than SOH for the temperatures of 288 and 308 K in the emulsion were not statistically significant.
The temperature variation for the SS in Figure 5A had no direct relationship with the adsorptive capacity, whose temperature relationship with adsorption was 298 K > 288 K > 308 K. However, it showed efficiency of up to 92% for 298 K. The higher temperature had a lower performance for all points but showed strong stability in its curve. There was a statistical difference in oil adsorption between temperatures 398 and 308 K. On the other hand, the temperature variation from 288 to 298 K in oil adsorption was not statistically significant for SS.
All temperatures showed similar behavior in the first 15 min. Adsorption increased, and in subsequent times, there was desorption, followed by new adsorption. Thus, the equilibrium was not reached within 40 min. This equilibrium would occur if the experiments’ time ranges were increased to verify the time required. However, the focus of this study was to verify short periods of adsorption for the application of biosorbents in a fixed-bed column.
The SS performed better than SOH with qmax in 15 min. After this period, desorption points in the SOH also showed similar behavior to SS with temperature variation, Figure 5B shows the relationship between temperature and adsorption equaling 298 K > 288 K > 308 K. There was no statistically significant difference in oil adsorption between 288 K and 298 K for SOH. In contrast, the difference in oil adsorption for SOH between 298 and 308 K reached statistical significance.
The temperature variation curves with time were concave downward at all evaluated temperatures. However, the maximum adsorption points differed at 10, 25, and 35 min for 298, 288, and 398 K, respectively. The adsorption of hydrocarbons by activated carbon from Casuarina equiseitifolia was also not linear, and the adsorption was lower at higher temperatures [15].
In all tests, the biomasses showed instability. However, observing adsorption in all tests within 5 min is interesting, and the biomasses obtained rapid kinetics regardless of temperature.
Nonlinear kinetic models assessed with the three temperatures are shown in Table 5. The intraparticle diffusion model was the most adjusted at all temperatures and biomasses. Thus, it confirmed the adsorption interaction between these biomasses and oil emulsions in more than one step.
Table 6 presents the thermodynamic calculations from the temperature variation. Both biomasses showed positive and low enthalpy values (less than 40 kJ mol−1), showing that the adsorption process is physical and endothermic [42]. The entropy energy of the system was reduced and negative, signaling a minimal change in the system, which demonstrates that the adsorption with oil emulsion may not be fully reversible for the biomasses of this study [43].
The Gibbs energy obtained was positive for the three temperatures with the two biomasses, as described in Table 7, proving that the adsorption process is not spontaneous. ΔG varied little with temperature, especially for SS.
Although the thermodynamic results were unfavorable for SOH, they had good adsorption for different concentrations, times, and temperature variations. Studies have shown that nonspontaneous endothermic processes do not prevent the potential for application of the material as an adsorbent [15,44,45].
The effect of pH variation on oil adsorption for the two biomasses was unusual, as extreme pHs showed higher results (Figure 6); this reaffirms the hypothesis that excess ions in the medium, negative or positive, displace the electron cloud from the long chains of oil hydrocarbons. In this way, they promote a dipole moment and thus facilitate the dipole–dipole interaction with the active sites of the biomasses.
In this way, they promote a dipole moment and thus facilitate the dipole–dipole interaction with the active sites of the biomasses. Statistically, there were no significant differences in oil adsorption between the biomasses for the four evaluated pHs.
Figure 7 illustrates our hypothesis of the dipole moment formation in oil molecules and their interaction with the biomass surface. The pH in the solution also affects the charged distribution of the biomass surface. As discussed by Ferreira et al., in the physicochemical characterization of the points of zero charge (PZC), the medium can increase or decrease the negatively charged or positively charged biosorbent.
Inverse behavior was obtained in the study of nano-silica adsorption in oil, in which the adsorption was higher at pH < pHpzc. This fact was attributed to increased dispersion forces at pH < pHpzc, even as electrostatic repulsive forces dominated at pH > pHpzc [17].
3.3. Fixed-Bed Column Adsorption Tests
Column failure curves for SS and SOH biomass reached a breakpoint at 960 min with both biosorbents, Figure 8. The breakpoint occurred together, 1200 min, for the two biomasses, but at different concentrations. According to the curves obtained, SS showed lower oil adsorption capacity due to a smaller mass transfer zone when compared to SOH, whose breakpoint was higher than SS.
The parameters for both biomasses are in Table 8. It is possible to observe that the parameters calculated for the biosorbents are similar. The biomasses presented a longer reasonable time and high saturation capacity. It is noted that these values are theoretical and are based on the oily emulsion’s constant concentration, even as it is not held to the system walls. Comparing both biomasses was conducted according to the oil retained real value. After that column adsorption, the qe obtained for SOH was 3.49 g g−1, while 2.99 g g−1 was reached for SS. Therefore, it was verified that SOH presented better adsorptive capacity, as previously observed, due to the more significant mass transfer zone.
A study separated condensed oil from produced water using a thin film of amorphous carbon prepared with oil palm leaves using fixed-bed adsorption techniques. As a result, the adsorption was 132.77 mg g−1 in 6 h at room temperature [28].
In another study, toluene, benzene, and σ-Xylene adsorption was conducted in a fixed-bed system filled with organoclay. The useful removal quantities were 0.012, 0.030, and 0.140 mmol g−1 for benzene, toluene, and p-xylene, respectively [46].
In another proposal, removing emulsified and dissolved diesel oil in high-salinity wastewater with graphene oxide as adsorbent obtained a maximum adsorption capacity of 1335 mg g−1 using 200 mg L−1 of diesel and 1 mg of graphene oxide [18].
The adsorption model for Bohart–Adams columns was applied, and their respective constants for the SS and SOH biomasses are represented in Table 9.
The Bohart–Adams model was the one that best fitted the experimental data of this study. Following this presumptions model, lateral interactions affect the adsorption process, just as the nearest neighboring adsorption site affects the diffusion of the adsorbate in the solution to the surface of the adsorbent. KAB constant measures the transfer rate from the adsorbate to the adsorbent, which depends on solute–solute, solute–adsorbent, and solute–neighborhood interactions [32].
3.4. Desorption Test
The desorption tests were performed only for SOH because when an acid or base is added to cause desorption, the natural biomass undergoes chemical reactions on its surface, and it is not possible to compare the subsequent cycles with the initial one.
The test with the HNO3 addition to cause adsorption reversal obtained the opposite result to the expected one as the biomass adsorbed the oil even more. This result demonstrates that SOH adsorbs in a highly acidic medium, too.
The test, with the addition of NaOH, obtained a desorption of 39.43%, which indicates the possibility of reusing the biomass. However, there should be future studies on adsorption cycles, even as improvements in desorption and recovery of biomass methodologies are needed.
3.5. Recovery Test
The oil recovery test adsorbed by SOH was successful in that it recovered 100% of the oil after washing the biomass with chloroform. However, future studies are necessary to investigate the number of cycles of biomass adsorption. In the study with modified chitosan for the adsorption of reactive black 5 dye, adsorption and desorption tests were performed in which the biomass could be used with 100% adsorption in up to five consecutive cycles [47], which indicates that plant biomasses have resistant and durable structures.
4. Conclusions
According to the results of this study, it was possible to evaluate the ability to remove lubricating oils through the adsorption of SS and SOH biomasses, in which they obtained a maximum adsorption capacity of 930.59 and 898.00 mg g−1 in 15 min, respectively. Both biomasses had good responses to the variation in oil concentration in the two types of emulsion and efficiency that varied from 83 to 99% of oil removal.
We conducted interaction studies between organic compounds and these biosorbents. Therefore, a high adsorption capacity of the biomasses was verified with the variation of oil concentration, fast adsorption response in 15 min, and adsorption versatility for different pHs and temperatures. Different parameters evidenced the oleophilic qualities of the biosorbents in question.
We conducted tests to compare the biomasses SS and SOH for all parameters. Although the SS showed higher adsorption capacity in the batch adsorption tests than SOH, the SS showed instability for oil adsorption and a higher release of interferents to the aqueous medium.
We verified the oil removal potential using fixed-bed adsorption columns for the SS and SOH biomasses that obtained a maximum adsorption capacity of 2.99 and 3.49 g g−1, respectively. These results affirm the greater oil retention capacity of SOH compared to SS.
Finally, the results point to the potential use of SOH as a biosorbent for the treatment of oily waters as a potential capacity for the reuse of biomass through solvent washing. However, future studies must investigate the number of biomass cycles and their use on a pilot and industrial scale.
Author Contributions
Conceptualization, D.M.A.S., M.d.F.R.M., R.d.M.F. and B.D.R.; methodology, R.d.M.F.; validation, R.d.M.F.; formal analysis, B.D.R.; investigation, R.d.M.F. and B.D.R.; resources, M.d.F.R.M.; data curation, D.M.A.S.; writing—original draft preparation, R.d.M.F. and B.D.R.; writing—review and editing, D.M.A.S. and M.d.F.R.M.; visualization, D.M.A.S., M.d.F.R.M., R.d.M.F. and B.D.R.; supervision, D.M.A.S. and M.d.F.R.M.; project administration, D.M.A.S. and M.d.F.R.M. funding acquisition M.d.F.R.M. All authors have read and agreed to the published version of the manuscript.
Funding
This research received no external funding.
Data Availability Statement
Data are contained within the article.
Acknowledgments
The RDX analysis was performed by the Laboratory of Catalysis and Sustainable Energy at the Institute of Chemistry of the Federal University of Rio de Janeiro. Furthermore, the Center for Strategic Technologies of the Northeast analyzed the surface area. In addition, thanks to the Research Support Foundation of the State of Rio de Janeiro (FAPERJ).
Conflicts of Interest
The authors declare no conflicts of interest.
References
- Manea, G.K.B.; Freire, V.B.; Junior, R.E.; de Oliveira, E.C. Analytical Compatibility between Various Techniques for Determining Dissolved Manganese in Produced Water. Analytica 2024, 5, 139–152. [Google Scholar] [CrossRef]
- Yu, R.; Yu, X.; Xue, B.; Liao, J.; Zhu, W.; Tian, S. Adsorption of Chlortetracycline from Aquaculture Wastewater Using Modified Zeolites. J. Environ. Sci. Health Part A 2020, 55, 573–584. [Google Scholar] [CrossRef] [PubMed]
- Kureel, M.; Geed, S.; Giri, B.; Rai, B.; Singh, R. Biodegradation and Kinetic Study of Benzene in Bioreactor Packed with PUF and Alginate Beads and Immobilized with Bacillus Sp. M3. Bioresour. Technol. 2017, 242, 92–100. [Google Scholar] [CrossRef] [PubMed]
- Tian, X.; Wang, X.; Peng, S.; Wang, Z.; Zhou, R.; Tian, H. Isolation, Screening, and Crude Oil Degradation Characteristics of Hydrocarbons-Degrading Bacteria for Treatment of Oily Wastewater. Water Sci. Technol. 2018, 78, 2626–2638. [Google Scholar] [CrossRef]
- El-Bendary, N.; El-Etriby, H.K.; Mahanna, H. Reuse of Adsorption Residuals for Enhancing Removal of Ciprofloxacin from Wastewater. Environ. Technol. 2022, 43, 4438–4454. [Google Scholar] [CrossRef] [PubMed]
- Kaoser, S.; Barrington, S.; Elektorowicz, M.; Wang, L. Copper Adsorption with Pb and Cd in Sand-Bentonite Liners under Various pHs. Part II. Effect on Adsorption Sites. J. Environ. Sci. Health Part A 2004, 39, 2241–2255. [Google Scholar] [CrossRef] [PubMed]
- Yu, Y.; Yang, C.; Li, J.; Zhu, Y.; Yan, Z.; Zhang, H. Screening of Inexpensive and Efficient Catalyst for Microwave-Assisted Pyrolysis of Ship Oil Sludge. J. Anal. Appl. Pyrolysis 2020, 152, 104971. [Google Scholar] [CrossRef]
- Mathai, R.V.; Mitra, J.C.; Sar, S.K.; Jindal, M.K. Adsorption of Chromium (VI) from Aqueous Phase Using Aegle Marmelos Leaves: Kinetics, Isotherm and Thermodynamic Studies. Chem. Data Collect. 2022, 39, 100871. [Google Scholar] [CrossRef]
- Khengare, N.J.; Labade, S.N.; Lalge, K.M.; Patil, V.S.; Khilare, C.J.; Sawant, S.S. Effective Removal of Chromium from Aqueous Solution by Adsorption on Powdered Wool: In-Silico Studies of Adsorption Mechanism. Chem. Data Collect. 2022, 41, 100935. [Google Scholar] [CrossRef]
- Niero, G.; Rodrigues, C.A.; Almerindo, G.I.; Corrêa, A.X.R.; Gaspareto, P.; Feuzer-Matos, A.J.; Somensi, C.A.; Radetski, C.M. Using Basic Parameters to Evaluate Adsorption Potential of Alternative Materials: Example of Amoxicillin Adsorption by Activated Carbon Produced from Termite Bio-Waste. J. Environ. Sci. Health Part A 2021, 56, 32–43. [Google Scholar] [CrossRef]
- Tran, D.N.; Kabiri, S.; Sim, T.R.; Losic, D. Selective Adsorption of Oil–Water Mixtures Using Polydimethylsiloxane (PDMS)–Graphene Sponges. Environ. Sci. Water Res. Technol. 2015, 1, 298–305. [Google Scholar] [CrossRef]
- Carvalho, C.D.O.; Rodrigues, D.L.C.; Lima, É.C.; Umpierres, C.S.; Chaguezac, D.F.C.; Machado, F.M. Kinetic, Equilibrium, and Thermodynamic Studies on the Adsorption of Ciprofloxacin by Activated Carbon Produced from Jerivá (Syagrus Romanzoffiana). Environ. Sci. Pollut. Res. 2019, 26, 4690–4702. [Google Scholar] [CrossRef] [PubMed]
- Italiya, G.; Subramanian, S. Role of Emerging Chitosan and Zeolite-Modified Adsorbents in the Removal of Nitrate and Phosphate from an Aqueous Medium: A Comprehensive Perspective. Water Sci. Technol. 2022, 86, 2658–2684. [Google Scholar] [CrossRef] [PubMed]
- de Costa, P.D. Treatment of Oily Waters through Dissolved Air Flotation (FAD) Using Biosurfactants and Adsorption Using Bioadsorbents (Portuguese). Master’s Dissertation, Universidade do Extremo Sul Catarinense, Criciúma, Brazil, 2015. [Google Scholar]
- Abdullah, M.; Azmi, A.N.F.; Azahar, M.Z.M.; Amri, F.N.M.; Kadiran, K.A.; Lat, D.C.; Kasim, H.A.; Khalid, A.H. Application of Casuarina Equisetifolia Needle for the Removal of Heavy and Light Oil Waste. AIP Conf. Proc. 2021, 2339, 020156. [Google Scholar] [CrossRef]
- Huang, J.; Yan, Z. Adsorption Mechanism of Oil by Resilient Graphene Aerogels from Oil–Water Emulsion. Langmuir 2018, 34, 1890–1898. [Google Scholar] [CrossRef] [PubMed]
- Franco, C.A.; Martínez, M.; Benjumea, P.; Patiño, E.; Cortés, F.B. Water Remediation Based on Oil Adsorption Using Nanosilicates Functionalized with a Petroleum Vacuum Residue. Adsorpt. Sci. Technol. 2014, 32, 197–207. [Google Scholar] [CrossRef]
- Diraki, A.; Mackey, H.; McKay, G.; Abdala, A.A. Removal of Oil from Oil–Water Emulsions Using Thermally Reduced Graphene and Graphene Nanoplatelets. Chem. Eng. Res. Des. 2018, 137, 47–59. [Google Scholar] [CrossRef]
- Ferreira, R.D.M.; Domingues, A.L.C.; Takase, I.; Stapelfeldt, D.M.D.A. Studies of Selective Adsorption, Desorption and Reuse of Chemically Altered Biomass Produced from Aquatic Macrophytes for Treatment of Metal-Containing Wastewater. Water Sci. Technol. 2017, 75, 2083–2093. [Google Scholar] [CrossRef] [PubMed]
- de Moraes Ferreira, R.; de Souza, M.D.P.; Takase, I.; de Araujo Stapelfeldt, D.M. Pb(II) Adsorption by Biomass from Chemically Modified Aquatic Macrophytes, Salvinia Sp. and Pistia Stratiotes. Water Sci. Technol. 2016, 73, 2670–2679. [Google Scholar] [CrossRef]
- Ferreira, R.M.; Campista, A.L.D.M.; Stapelfeldt, D.M.A.; Moreira, M.D.F. Emulsified Oil Separation by Bioadsorption: A Sustainable Proposal. Environ. Technol. 2022, 43, 696–708. [Google Scholar] [CrossRef]
- Oliveira, J.C.G.; de Moraes Ferreira, R.; Stapelfeldt, D.M.A. Use of Salvinia Sp on the Adsorption of Hexavalent Chromium. Environ. Sci. Pollut. Res. 2019, 26, 30463–30471. [Google Scholar] [CrossRef] [PubMed]
- De Oliveira, N.M.; Ferreira, R.M.; Barbosa, S.M.; Stapelfeldt, D.M.A. Crystal Violet Dye Adsorption by a Biosorbent Mixture Obtained from Salvinia Biloba and Pistia Stratiotes. J. Basic Appl. Res. Int. 2016, 13, 222–231. [Google Scholar]
- Gök, Ö.; Özcan, A.; Erdem, B.; Özcan, A.S. Prediction of the Kinetics, Equilibrium and Thermodynamic Parameters of Adsorption of Copper (II) Ions onto 8-Hydroxy Quinoline Immobilized Bentonite. Colloids Surf. Physicochem. Eng. Asp. 2008, 317, 174–185. [Google Scholar] [CrossRef]
- Kalavathy, M.H.; Karthikeyan, T.; Rajgopal, S.; Miranda, L.R. Kinetic and Isotherm Studies of Cu (II) Adsorption onto H3PO4-Activated Rubber Wood Sawdust. J. Colloid Interface Sci. 2005, 292, 354–362. [Google Scholar] [CrossRef]
- Karthikeyan, T.; Rajgopal, S.; Miranda, L.R. Chromium (VI) Adsorption from Aqueous Solution by Hevea Brasilinesis Sawdust Activated Carbon. J. Hazard. Mater. 2005, 124, 192–199. [Google Scholar] [CrossRef] [PubMed]
- Sing, K.S. Reporting Physisorption Data for Gas/Solid Systems with Special Reference to the Determination of Surface Area and Porosity (Recommendations 1984). Pure Appl. Chem. 1985, 57, 603–619. [Google Scholar] [CrossRef]
- Fathy, M.; El-Sayed, M.; Ramzi, M.; Abdelraheem, O.H. Adsorption Separation of Condensate Oil from Produced Water Using ACTF Prepared of Oil Palm Leaves by Batch and Fixed Bed Techniques. Egypt. J. Pet. 2018, 27, 319–326. [Google Scholar] [CrossRef]
- Huang, X.; Luo, Q.; Zhu, J.; Li, Z.; Zhao, J.; Pei, C. Development Rheological and Thermal Properties of a Novel Propellant RDX/TEGDN/NBC. SN Appl. Sci. 2020, 2, 1–12. [Google Scholar] [CrossRef]
- Rambo, M.K.D.; Ferreira, M.M.C. Determination of Cellulose Crystallinity of Banana Residues Using Near Infrared Spectroscopy and Multivariate Analysis. J. Braz. Chem. Soc. 2015, 26, 1491–1499. [Google Scholar] [CrossRef]
- de Souza, C.D.R.; de Carvalho, S.F. Avaliação Da Cinética de Adsorção Do Negro de Eriocromo T Em Carvão Ativado Produzido a Partir Do Lodo de ETA. Sci. Amazon. 2020, 9, C1–C7. [Google Scholar]
- Ngang, H.; Ahmad, A.; Low, S.; Ooi, B. Adsorption-Desorption Study of Oil Emulsion towards Thermo-Responsive PVDF/SiO2-PNIPAM Composite Membrane. J. Environ. Chem. Eng. 2017, 5, 4471–4482. [Google Scholar] [CrossRef]
- Dai, Y.; Zhang, N.; Xing, C.; Cui, Q.; Sun, Q. The Adsorption, Regeneration and Engineering Applications of Biochar for Removal Organic Pollutants: A Review. Chemosphere 2019, 223, 12–27. [Google Scholar] [CrossRef] [PubMed]
- Almeida, F.; Meili, L.; Soletti, J.; Esquerre, K.; Ribeiro, L.; de Farias Silva, C. Oil Produced Water Treatment Using Sugarcane Solid Residue as Biosorbent. Rev. Mex. Ing. Quím. 2019, 18, 27–38. [Google Scholar]
- Stafussa, A.P.; Maciel, G.M.; da Silva Anthero, A.G.; da Silva, M.V.; Zielinski, A.A.F.; Haminiuk, C.W.I. Biosorption of Anthocyanins from Grape Pomace Extracts by Waste Yeast: Kinetic and Isotherm Studies. J. Food Eng. 2016, 169, 53–60. [Google Scholar] [CrossRef]
- Cai, L.; Zhang, Y.; Zhou, Y.; Zhang, X.; Ji, L.; Song, W.; Zhang, H.; Liu, J. Effective Adsorption of Diesel Oil by Crab-Shell-Derived Biochar Nanomaterials. Materials 2019, 12, 236. [Google Scholar] [CrossRef] [PubMed]
- Chen, J.; Yu, Y.; Shang, Q.; Han, J.; Liu, C. Enhanced Oil Adsorption and Nano-Emulsion Separation of Nanofibrous Aerogels by Coordination of Pomelo Peel-Derived Biochar. Ind. Eng. Chem. Res. 2020, 59, 8825–8835. [Google Scholar] [CrossRef]
- Liu, L.; Wang, L.; Song, W.; Yang, L.; Yin, L.; Xia, S.; Wang, H.; Strong, P.J.; Song, Z. Crude Oil Removal from Aqueous Solution Using Raw and Carbonized Xanthoceras Sorbifolia Shells. Environ. Sci. Pollut. Res. 2018, 25, 29325–29334. [Google Scholar] [CrossRef] [PubMed]
- Okiel, K.; El-Sayed, M.; El-Kady, M.Y. Treatment of Oil–Water Emulsions by Adsorption onto Activated Carbon, Bentonite and Deposited Carbon. Egypt. J. Pet. 2011, 20, 9–15. [Google Scholar] [CrossRef]
- Su, J.; Flanagan, J.; Hemar, Y.; Singh, H. Synergistic Effects of Polyglycerol Ester of Polyricinoleic Acid and Sodium Caseinate on the Stabilisation of Water–Oil–Water Emulsions. Food Hydrocoll. 2006, 20, 261–268. [Google Scholar] [CrossRef]
- Barthlott, W.; Moosmann, M.; Noll, I.; Akdere, M.; Wagner, J.; Roling, N.; Koepchen-Thomä, L.; Azad, M.; Klopp, K.; Gries, T. Adsorption and Superficial Transport of Oil on Biological and Bionic Superhydrophobic Surfaces: A Novel Technique for Oil–Water Separation. Philos. Trans. R. Soc. A 2020, 378, 20190447. [Google Scholar] [CrossRef]
- Sahmoune, M.N. Evaluation of Thermodynamic Parameters for Adsorption of Heavy Metals by Green Adsorbents. Environ. Chem. Lett. 2019, 17, 697–704. [Google Scholar] [CrossRef]
- Ackacha, M.; Meftah, S. Acacia Tortilis Seeds as a Green Chemistry Adsorbent to Clean up the Water Media from Cadmium Cations. Int. J. Environ. Sci. Dev. 2014, 5, 375–379. [Google Scholar] [CrossRef]
- Li, Y.; Liu, J.; Yuan, Q.; Tang, H.; Yu, F.; Lv, X. A Green Adsorbent Derived from Banana Peel for Highly Effective Removal of Heavy Metal Ions from Water. RSC Adv. 2016, 6, 45041–45048. [Google Scholar] [CrossRef]
- Wu, C.-H.; Kuo, C.-Y.; Guan, S.-S. Adsorption of Heavy Metals from Aqueous Solutions by Waste Coffee Residues: Kinetics, Equilibrium, and Thermodynamics. Desalination Water Treat. 2016, 57, 5056–5064. [Google Scholar] [CrossRef]
- Lima, L.F.; de Andrade, J.R.; da Silva, M.G.; Vieira, M.G. Fixed Bed Adsorption of Benzene, Toluene, and Xylene (BTX) Contaminants from Monocomponent and Multicomponent Solutions Using a Commercial Organoclay. Ind. Eng. Chem. Res. 2017, 56, 6326–6336. [Google Scholar] [CrossRef]
- Rodrigues, D.A.; Moura, J.M.; Dotto, G.L.; Cadaval, T.R.; Pinto, L.A. Preparation, Characterization and Dye Adsorption/Reuse of Chitosan-Vanadate Films. J. Polym. Environ. 2018, 26, 2917–2924. [Google Scholar] [CrossRef]
Figure 1.
N2 adsorption isotherm for SS biosorbents (A) and SOH (B).

Figure 2.
X-ray diffractograms of the biomasses SOH and SS.

Figure 3.
Oil adsorption as a function of the variation of the initial oil concentration by the biosorbents and efficiency. (A) SS in distilled oil-in-water emulsion; (B) SOH distilled oil-in-water emulsion; (C) SS in oil-in-salt water emulsion (5 g L−1 of NaCl); and (D) SOH in oil-in-salt water emulsion (5 g L−1 of NaCl). Experimental conditions: 50 mg of biosorbent, 50 mL of solution at pH 2, contact time equal to 15 min at room temperature (sd 0.98 to 47.12).

Figure 4.
Equilibrium time. Experimental conditions: 150 mg of biomass with 150 mL of water and oil emulsion (200 mg L−1) at 298 K (A) SS and (B) SOH. (sd 0.5 to 1.0).
Figure 4.
Equilibrium time. Experimental conditions: 150 mg of biomass with 150 mL of water and oil emulsion (200 mg L−1) at 298 K (A) SS and (B) SOH. (sd 0.5 to 1.0).

Figure 5.
3D plots for the combined effect of activation temperature and time activation temperature and time on oil removal at 1 g L−1 of dosage of biosorbent, contact time of 40 min, and 200 mg L−1 of oil emulsion concentration for SS (A) and (B) for SOH. (dv 0.9 to 1.5).
Figure 5.
3D plots for the combined effect of activation temperature and time activation temperature and time on oil removal at 1 g L−1 of dosage of biosorbent, contact time of 40 min, and 200 mg L−1 of oil emulsion concentration for SS (A) and (B) for SOH. (dv 0.9 to 1.5).

Figure 6.
Oil adsorption capacity by SOH and SS according to pH. Experimental conditions: 50 mg of biosorbent, 50 mL of emulsion, 200 mg L−1 of oil under agitation for 15 min. (A) SS and (B) SOH. (sd 2.09 to 4.23).
Figure 6.
Oil adsorption capacity by SOH and SS according to pH. Experimental conditions: 50 mg of biosorbent, 50 mL of emulsion, 200 mg L−1 of oil under agitation for 15 min. (A) SS and (B) SOH. (sd 2.09 to 4.23).

Figure 7.
Illustration of the adsorption moment by the dipole–dipole moment interaction.

Figure 8.
Oil adsorption column breakdown curve for SS and SOH biomasses. Experimental conditions: 220 mg of biomass, flow rate 0.58 mL.min−1, emulsion concentration 12,963 mg L−1, pH 2 (sd. 2.09 to 2.77).
Figure 8.
Oil adsorption column breakdown curve for SS and SOH biomasses. Experimental conditions: 220 mg of biomass, flow rate 0.58 mL.min−1, emulsion concentration 12,963 mg L−1, pH 2 (sd. 2.09 to 2.77).


Table 1.
Kinetic and equilibrium models of adsorption.
| Equation | Parameters | ||
|---|---|---|---|
| Kinetics models | Pseudo-second-order | qt = amounts of oil adsorbed per g of biosorbent at equilibrium and at the time, t, respectively, in (mg g−1); t = time (min); k2: pseudo-second-order adsorption rate constant (g mg.min−1). | |
| Elovich | α: initial adsorption rate (mg g min−1); β: desorption constant (mg g−1). | ||
| Intraparticle diffusion | Kd: intraparticle diffusion coefficient (mg g−1 min−0.5); C: constant related to resistance to diffusion (mg g−1) | ||
| Equilibrium models | Langmuir | qmax: maximum adsorption capacity (mg g−1); KL: adsorbate-adsorbent interaction constant (L mg−1); | |
| Freundlich | 1/n: constant related to surface heterogeneity; KF: Freundlich adsorption capacity constant (mg/−1−(1/n) (g−1) L1/n). | ||
| Bohart-Adams | KAB: Bohart-Adams kinetic constant (mL.min−1 g−1); N0: biomass adsorption capacity (cm g−1). |
Table 2.
BET method for biomasses’ surface area and pore diameter values.
| Biomass | SBET (m2 g−1) | SEXT (m2 g−1) | SINT (m2 g−1) | Diameter (Å) |
|---|---|---|---|---|
| SS | 1.0622 | 0.9181 | 0.1441 | 254.011 |
| SSOH | 1.4959 | 1.7712 | −0.2762 | 44.446 |
SBET (m2 g−1): Specific surface area according to the Brunauer, Emmett, and Teller method (BET). SEXT (m2 g−1): External area of solid. SINT (m2 g−1): Internal area of the solid. Diameter (Å): average pore diameter.
Table 3.
Values found for the nonlinear models of Langmuir and Freundlich from the isotherms of the oil emulsions in distilled and saltwater with oil for the SS and SOH biosorbents.
Table 3.
Values found for the nonlinear models of Langmuir and Freundlich from the isotherms of the oil emulsions in distilled and saltwater with oil for the SS and SOH biosorbents.
| Biosorbents | |||||
|---|---|---|---|---|---|
| Emulsion in Distilled Water | Emulsion in Saltwater | ||||
| SS | SOH | SS | SOH | ||
| Langmuir | qmax (mg g−1) | 1074.71 | 15,153.2 | 818.75 | 629.39 |
| KL (L mg−1) | 0.0554 | 0.0098 | 0.3542 | 0.0836 | |
| RL | 0.0165 | 0.0631 | 0.0034 | 0.0186 | |
| R2 | 0.9706 | 0.9999 | 0.8503 | 0.8329 | |
| Freundlich | KF | 14.62 | 14.62 | 246.08 | 246.08 |
| n | 1.0067 | 1.0067 | 2.8837 | 2.8837 | |
| 1/n | 0.9934 | 0.9934 | 0.3468 | 0.3468 | |
| R2 | 0.9999 | 0.9999 | 0.9605 | 0.9286 | |
Table 4.
Adsorptive capacity of varied materials in oil emulsions.
| Adsorbent | Adsorbate | qmax (mg g−1) | References |
|---|---|---|---|
| Sugarcane bagasse | Synthetic emulsion | 207 | [32] |
| Modified crab shell-activated biochar | Synthetic emulsion | 93.9 | [36] |
| Pomelo peel biochar | Synthetic emulsion | 11,850.0 | [37] |
| Xanthoceras sorbifolia shell | Synthetic emulsion | 75.1 | [38] |
| Activated carbon powder | Synthetic emulsion | 468.00 | [39] |
| Hydrophobic alumina | Synthetic emulsion | 180.65 | [17] |
| SS | Synthetic emulsion of distilled water and ship oil | 846.51 | This study |
| SOH | Synthetic emulsion of distilled water and ship oil | 836.42 | This study |
| SS | Synthetic emulsion of saltwater and ship oil | 930.59 | This study |
| SOH | Synthetic emulsion of saltwater and ship oil | 898.00 | This study |
Table 5.
Equations obtained with nonlinear kinetic models for oil.
| Biosorbents | |||||||
|---|---|---|---|---|---|---|---|
| 288 K | 298 K | 308 K | |||||
| SS | SOH | SS | SOH | SS | SOH | ||
| Intraparticle Diffusion | Kd | 30.03 | 22.42 | 22.4 | 0.01 | 30.04 | 22.42 |
| C | 61.83 | 127.95 | 175.009 | 245.26 | 61.83 | 127.95 | |
| R2 | 0.9811 | 0.9811 | 0.9811 | 0.9811 | 0.9811 | 0.9811 | |
| Elovich | α | 2.6914 | 253.02 | 399.89 | 2.5 × 10²² | 5.65 × 10¹⁶ | 2.15 × 10¹¹ |
| β | 0.001 | 0.0198 | 0.0177 | 0.2163 | 0.2017 | 0.1181 | |
| R2 | 0.9998 | 0.9213 | 0.9206 | 0.9189 | 0.9189 | 0.9189 | |
| Pseudo-second order | K2 | 2.3 × 10⁷ | 1.1 × 10⁵ | 1.1 × 10⁵ | 2.3 × 10⁷ | 2.3 × 10⁷ | 2.3 × 10⁷ |
| qe | 198.72 | 230.12 | 277.19 | 245.26 | 198.72 | 230.12 | |
| R2 | 0.7054 | 0.7054 | 0.7054 | 0.7054 | 0.7054 | 0.7054 | |
Table 6.
Values of ΔH and ΔS for biomass in oil.
| Biosorbent | ΔH (kJ/mol) | ΔS (kJ/mol K) |
|---|---|---|
| SS | 1.048 | −3.6 × 10⁻³ |
| SOH | 3.542 | −12.0 × 10⁻³ |
Table 7.
ΔG values for biosorbents in oil at different temperatures.
| ΔG | ||
|---|---|---|
| Temperature (K) | SS | SOH |
| 288 | 2.106 | 7.000 |
| 298 | 2.143 | 7.120 |
| 308 | 2.179 | 7.241 |
Table 8.
Column parameters for SS and SOH biomasses.
| SS | SOH | |
|---|---|---|
| Total time (min) | 1255 | 1258 |
| Working time (min) | 889 | 890 |
| Useful height (cm) | 7.08 | 7.07 |
| Saturation capacity (mg. g−1) | 42,891.09 | 42,993.62 |
| qe (g g−1) | 2.99 | 3.49 |
Table 9.
Parameters obtained using the Bohart–Adams adsorption model for SS and SOH.
| SS | SOH | |
|---|---|---|
| KBA (mL min−1 g−1) | 0.38 | 0.58 |
| N0 (cm g−1) | 10.185 | 13.58 |
| R2 | 0.8767 | 0.9264 |
Disclaimer/Publisher’s Note: The statements, opinions and data contained in all publications are solely those of the individual author(s) and contributor(s) and not of MDPI and/or the editor(s). MDPI and/or the editor(s) disclaim responsibility for any injury to people or property resulting from any ideas, methods, instructions or products referred to in the content. |
© 2024 by the authors. Licensee MDPI, Basel, Switzerland. This article is an open access article distributed under the terms and conditions of the Creative Commons Attribution (CC BY) license (https://creativecommons.org/licenses/by/4.0/).
Share and Cite
MDPI and ACS Style
de M. Ferreira, R.; Ribeiro, B.D.; Stapelfeldt, D.M.A.; de F. R. Moreira, M. Treatment of Water Contaminated by Ship Oil: Study of Adsorption in a Fixed-Bed Column. Analytica 2024, 5, 203-218. https://doi.org/10.3390/analytica5020013
AMA Style
de M. Ferreira R, Ribeiro BD, Stapelfeldt DMA, de F. R. Moreira M. Treatment of Water Contaminated by Ship Oil: Study of Adsorption in a Fixed-Bed Column. Analytica. 2024; 5(2):203-218. https://doi.org/10.3390/analytica5020013
Chicago/Turabian Stylede M. Ferreira, Rachel, Bernardo Dia Ribeiro, Danielle M. A. Stapelfeldt, and Maria de F. R. Moreira. 2024. "Treatment of Water Contaminated by Ship Oil: Study of Adsorption in a Fixed-Bed Column" Analytica 5, no. 2: 203-218. https://doi.org/10.3390/analytica5020013