Article

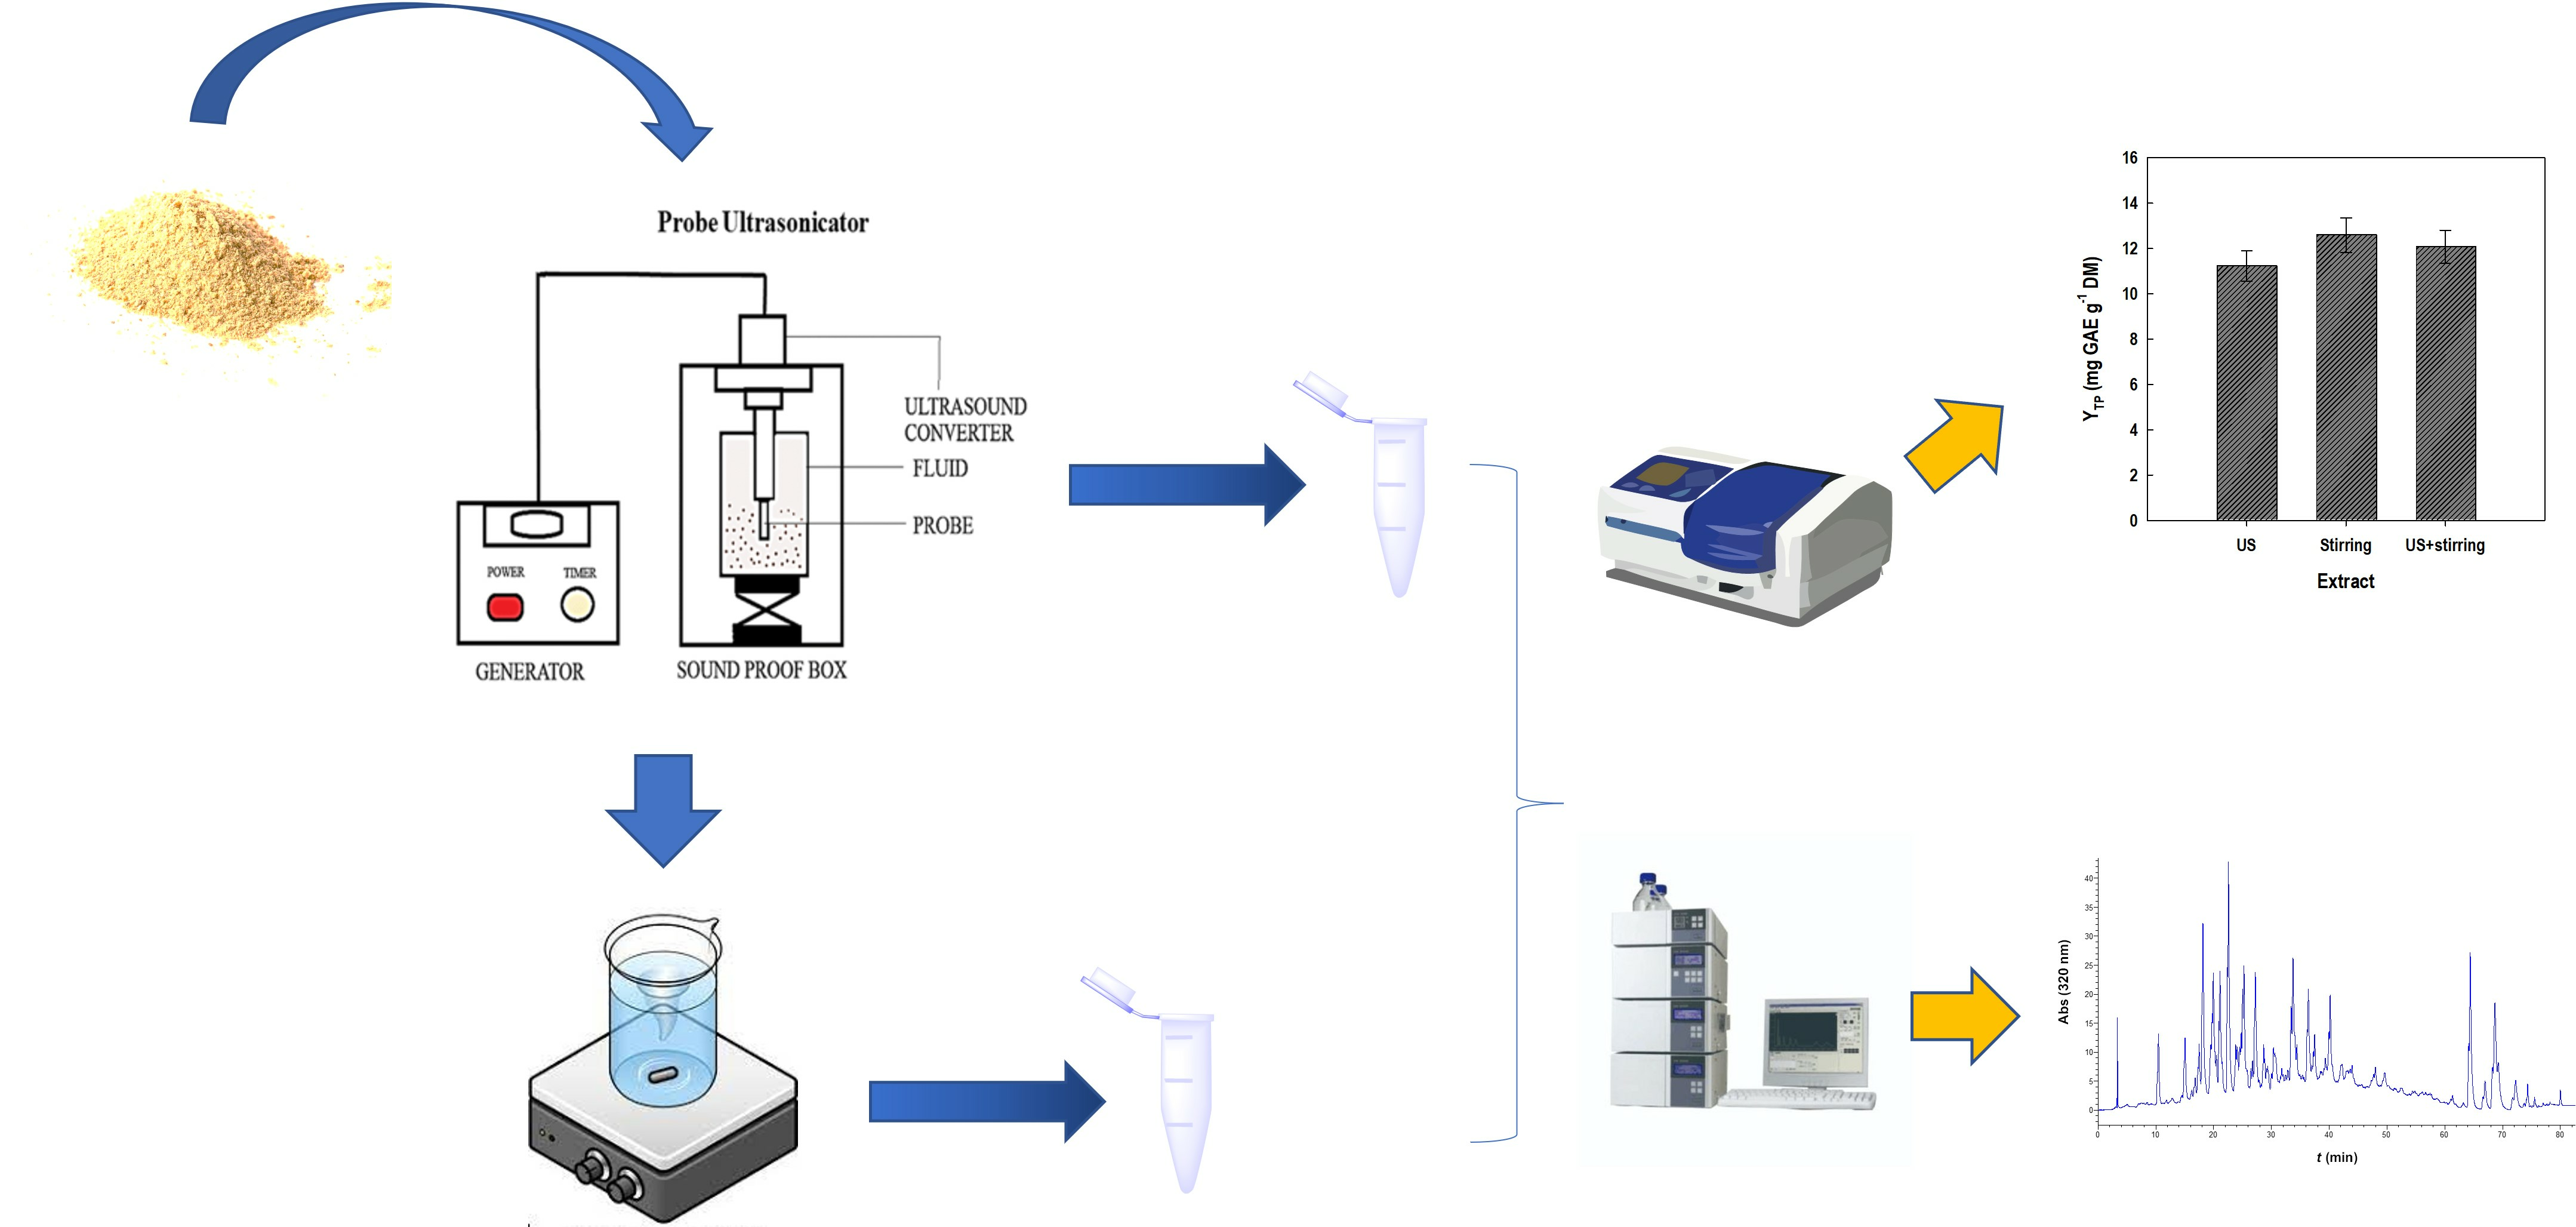
Ultrasonication-Assisted Aqueous Extraction of Waste Orange Peel Polyphenols: Optimization of Process Variables and Effect on Extract Composition

by
Katiana Belsi
,
Xenia Vogiatzi
,
Dimitrios Palaiogiannis
,
Theodoros Chatzimitakos
,
Stavros I. Lalas
and
Dimitris P. Makris
*
Green Processes & Biorefinery Group, Department of Food Science & Nutrition, School of Agricultural Sciences, University of Thessaly, N. Temponera Street, 43100 Karditsa, Greece
*
Author to whom correspondence should be addressed.
Compounds 2024, 4(2), 301-314; https://doi.org/10.3390/compounds4020016
Submission received: 4 March 2024 / Revised: 3 April 2024 / Accepted: 16 April 2024 / Published: 18 April 2024

Abstract

:
The citrus processing industry is responsible for the generation of large volumes of waste side streams, represented principally by fruit peels. These tissues are exceptionally rich in polyphenolic bioactive phytochemicals, and there has been a great industrial interest for their valorization. The examination presented herein targeted at developing a fast and straight-forward aqueous extraction process, based on ultrasonication, for the efficacious recovery of polyphenolic compounds from waste orange peels. After an initial single-factor examination, the response surface optimization showed that a maximum total polyphenol yield of 12.81 mg chlorogenic acid equivalents (GAE) per g−1 dry mass could be achieved by setting sonicator amplitude at 80%, for 15 min, using a duty cycle of 2/2 (2 s on/2 s off). Comparison of this methodology with a stirred-tank extraction demonstrated that the ultrasonication technique was equally effective, requiring ambient temperature and considerably shorter resident time. The combination of both techniques using the ultrasonication process as a pretreatment step did not boost extraction yield, and the extracts produced had similar polyphenolic composition and antioxidant activity. However, a slight enhancement of the recovery of individual constituents was noted. It is proposed that efficient extraction of polyphenolic substances from waste orange peels may be accomplished using the present methodology, which is a low-cost (ambient temperature, short time) and sustainable (water as solvent) process.

Graphical Abstract

1. Introduction

Intensification of crop cultivation and food production has led to an unprecedented generation of associated side streams, which are materials of high organic matter content. As such, this waste biomass is characterized by a high polluting load, and it should be treated and disposed of with particular care. Failing to do so, uncontrolled disposal would inevitably result in eco-system aggravation and severe environmental degradation. Such consequences would, in turn, entail significant public health risks and endanger animal and human wellbeing.
On the understanding that linear economy models can no longer be sustained, the world economy’s orientation towards circular economy strategies is imminent, to preserve bioresources, prevent further environmental debasement, and develop sustainable production technologies. In this context, biorefinery concepts hold key roles in waste exploitation and the production of biomass-based energy, platform chemical compounds, and high value-added commodities. The latter category may include a number of bio-molecules with functional properties, which make them suitable additives in food and cosmetic products, and active constituents in pharmaceuticals and food supplements [1].
Plant processing for food production results in rejecting an array of non-edible tissues, such as roots, leaves, peels, stems, seeds, etc. These tissues constitute a pool of a spectrum of recoverable phytochemicals, including essential oils, carotenoids, water-soluble pigments, polysaccharides, and antioxidants. Polyphenols are a prominent class of bioactive metabolites occurring in many plant food wastes, as their content may reach up to tens of mg per g of dry mass [2]. Polyphenols embrace several subclasses, and a range of structures commonly encountered in rejected plant material have been shown to possess biological properties, such as anti-inflammatory, antimicrobial, chemo-preventive, and antioxidant activity. Thus, by virtue of their bioactivities, polyphenols are a primary target for effective recovery from plant processing residues [3].
The global production of citrus fruits, including oranges, grapefruit, lemon, tangerines, lime, etc., was estimated to be around 158 million tons in 2019 [4]. The greatest share of the citrus fruits is held by orange crops, and in all citrus-producing countries it accounts for approximately 50% of the total citrus production. Oranges are principally destined for juice manufacturing, with the juice representing almost 50% of the fruit weight. Pulp, peels, and seeds, which are the major orange processing wastes, account for the remaining 50%. It has been reported that orange juicing may account for about 8–20 million tons of orange waste annually produced, of which 60–65% (w/w) is represented by orange peels [5]. Orange peels have a high polyphenol content with peculiar profile, and, therefore, it is not surprising that orange peel polyphenol extraction has been a subject of particular interest [6].
The state-of-the-art assortment of extractions technologies includes a plethora of innovative methodologies, and amongst them the ultrasound-assisted extraction holds a prominent position. The radiation of a liquid/solid mixture with ultrasounds generates cavitation phenomena, including cavitation bubbles. As the cavitation bubbles implode on a solid surface (plant cells walls of the material to be extracted), micro-jetting is observed, which, in turn, generates various effects, including erosion, surface peeling, and particle (cell) disintegration (breakdown). Furthermore, cavitation bubble implosion in liquid media provokes macro-turbulences and micro mixing [7]. These mechanisms result in cell wall destruction, allowing intracellular molecules (polyphenols) to be entrained in the liquid medium. Ultrasound-assisted extraction has nowadays gained a significant acceptance as a fast, low-energy, low-cost, and green technology, and numerous investigations have dealt with ultrasound-assisted biomolecule extraction [8,9]. However, most of these studies have been focused on the use of organic solvents, which may possess several undesirable characteristics, such as high vapor pressure, high cost, and flammability. By contrast, extraction based on aqueous systems has been largely disregarded, although it would offer significant advantages over solvent-based extractions, such as a full green character, minimal cost, complete absence of toxicity, no flammability, and relatively low vapor pressure.
On this ground, the aqueous ultrasound-assisted extraction of polyphenols from waste orange peels (WOP) was investigated, to establish a fast and efficient method of polyphenol recovery, by considering two major process variables, the % amplitude of the sonicator, and the ultrasonication time. Critical assessment of the methodology developed was based on the comparison with a batch, stirred-tank extraction, while the combination of these two methodologies was also considered. As far as the authors are aware, such an approach has not been heretofore reported.

2. Materials and Methods

2.1. Chemicals–Reagents

All chromatography solvents were HPLC grade. Hydrochloric acid (37%) was purchased from Panreac (Barcelona, Spain). Absolute ethanol and Folin–Ciocalteu reagent were from Panreac (Barcelona, Spain). Neochlorogenic acid (≥98%), ferulic acid (99%), chlorogenic acid (≥95%), luteolin 7-O-rutinoside (≥95%), caffeic acid (≥98%), hesperidin (≥80%), narirutin (≥98%), L-ascorbic acid, 2,2-diphenyl-1-picrylhydrazyl radical (DPPH), and methanol were obtained from Sigma-Aldrich (St. Louis, Burlington, MA, USA). Sodium carbonate anhydrous was from Penta (Prague, Czech Republic). Trolox™ (6-hydroxy-2,5,7,8-tetramethylchroman-2-carboxylic acid) was purchased from Glentham Life Sciences (Corsham, UK). 2,4,6-Tripyridyl-s-triazine (TPTZ) and iron chloride hexahydrate (FeCl3•6H2O) were from Honeywell/Fluka (Steinheim, Germany).

2.2. Waste Orange Peel (WOP) Collection

Cafeterias and catering units located within the city of Larissa (central Greece) were the source of WOP collected. Collection was accomplished within 3 consecutive days, and the WOP gathered was screened for foreign material and apparently infected tissues. Then, the screened waste was pooled, and only peels (flavedo and albedo) were chosen for further processing, whereas pieces of juicy flesh were excluded. Peels were oven-dried (Binder BD56, Bohemia, NY, USA) for 24 h, at 80 °C, and comminuted by a table mill. The ground material was sieved, and fractions with average particle diameter <300 μm were collected and stored in sealed, plastic containers at −18 °C.

2.3. Ultrasonication-Assisted Aqueous Extraction

Ultrasonication treatments were performed using a BIOBASE UCD-150 ultrasonic cell disrupter (Jinan, China), with maximum nominal power of 150 W, operated at a fixed frequency of 50 Hz, with a probe tip (emitting surface) diameter of 6 mm. The probe was immersed in the treatment vessel, a 25 mL Duran™ vial (DWK Life Sciences, Wertheim, Germany), at a level of approximately 3 mm above the vial bottom. Ultrasonic radiation was delivered at pulse mode, with a duty cycle of 2/2 (2 s on/2 s off), with both the amplitude and irradiation time adjusted as dictated by the experimental design. Temperature was monitored by a thermal sensor embodied within the ultrasonication chamber. The sensor was in direct contact with the surface of the extraction solvent (water), to provide immediate temperature measurement throughout the ultrasonication treatment. Ultrasound-assisted extractions were carried out by placing 20 mL of distilled water and 1 g of WOP powder in the treatment vessel. During the treatments, the vessel was immersed in an ice bath to avoid large temperature increases, as a consequence of energy dissipation within the liquid. Thus, the initial treatment temperature was usually 14 °C, and by the end of the treatment it rose to around 21 °C.
To obtain an account of the actual power (P) dissipated to the system and the ultrasonic intensity, the following determinations were performed [10]:
P = m C p d T d t
UI = P S
AED = P V
where m is the mass of the solvent (water) (in g), Cp the specific heat capacity of water (4.2 J g1 K1), and dT/dt the temperature rise per s, which was determined by fitting temperature change (dT), measured by a thermocouple, versus time [11]. UI is the ultrasonication intensity (W cm2), S the area of the emitting surface of the transducer (cm2), and V the volume of the liquid (water) used for the extraction (in L).

2.4. Batch Stirred-Tank Aqueous Extraction

The methodology deployed was a recently established one [12]. In short, an exact mass of 1 g of WOP was extracted with 20 mL of deionized water, under constant stirring at 500 rpm, for 60 min, at 55 °C. After the extraction was complete, centrifugation at 10,000× g was performed to remove cell debris and obtain a clear extract.

2.5. Experimental Design and Response Surface Methodology

A Box–Behnken design with three central points was chosen to construct a predictive model, based on response surface methodology. By considering the results drawn from the single-factor experiments, the actual levels of the process variables, amplitude (% Ampl), and time (t), were codified as described in detail elsewhere [13]. Both actual and codified values may be seen in Table 1.
The model derived was appraised by performing lack-of-fit and analysis of variance (ANOVA) tests, which enabled the estimation of the significance of the overall model, as well as the significance of each individual term of the model. The mathematical equation describing the predictive model consisted of only significant terms, whereas the non-significant ones (p > 0.05) were omitted.

2.6. Total Polyphenol Yield (YTP), Ferric-Reducing Power (PR), and Antiradical Activity (AAR) Determination

The concentration of total polyphenols in the extracts produced was measured using a well-established protocol, based on the Folin–Ciocalteu reagent [14], and a chlorogenic acid calibration curve. Results were then expressed as mg chlorogenic acid equivalents (CGAE) per g of dry mass (DM). For the assessment of the antioxidant activity, the ferric-reducing power and the antiradical activity were determined, as described elsewhere [15]. Reducing power was given as μmol ascorbic acid equivalents (AAE) per g DM, and the antiradical activity as μmol DPPH per g DM.

2.7. Chromatographic Determinations

Details regarding the tentative identification of some polyphenolic metabolites pertaining to equipment, chromatographic and mass spectrometry settings have been previously provided [16]. Furthermore, quantitative chromatographic determinations including the standards used and the calibration curves constructed have been given in an earlier study [12]. Briefly, the equipment used to carry out liquid chromatography–mass spectrometry was a Spectra System UV 6000LP diode array detector (Finnigan, San Jose, CA, USA), a P4000 LC Pump (Finnigan), and a Finnigan AQA Thermoquest mass analyzer. Mass spectra were acquired in positive ion electrospray, with 20 and 80 eV cone voltage. Quantification of didymin, sinensetin, nobiletin, and dimethylnobiletin was accomplished using luteolin 7-O-glucoside as standard, whereas the rest of the polyphenols were quantified using commercially available standards.

2.8. Statistics–Data Processing

At least two runs were performed for every extraction process tested. All quantitative determinations (spectrophotometric, chromatographic) were carried out in triplicate. The values reported are average ± standard deviation (sd). The software SigmaPlot™ 12.5 (Systat Software Inc., San Jose, CA, USA) was employed to perform all linear regressions. JMP™ Pro 13 software (SAS, Cary, NC, USA) was used to setup the experimental design, carry out statistics pertaining to the response surface methodology (analysis of variance, lack-of-fit), and to perform distribution analysis, at least at a 95% significance level.

3. Results and Discussion

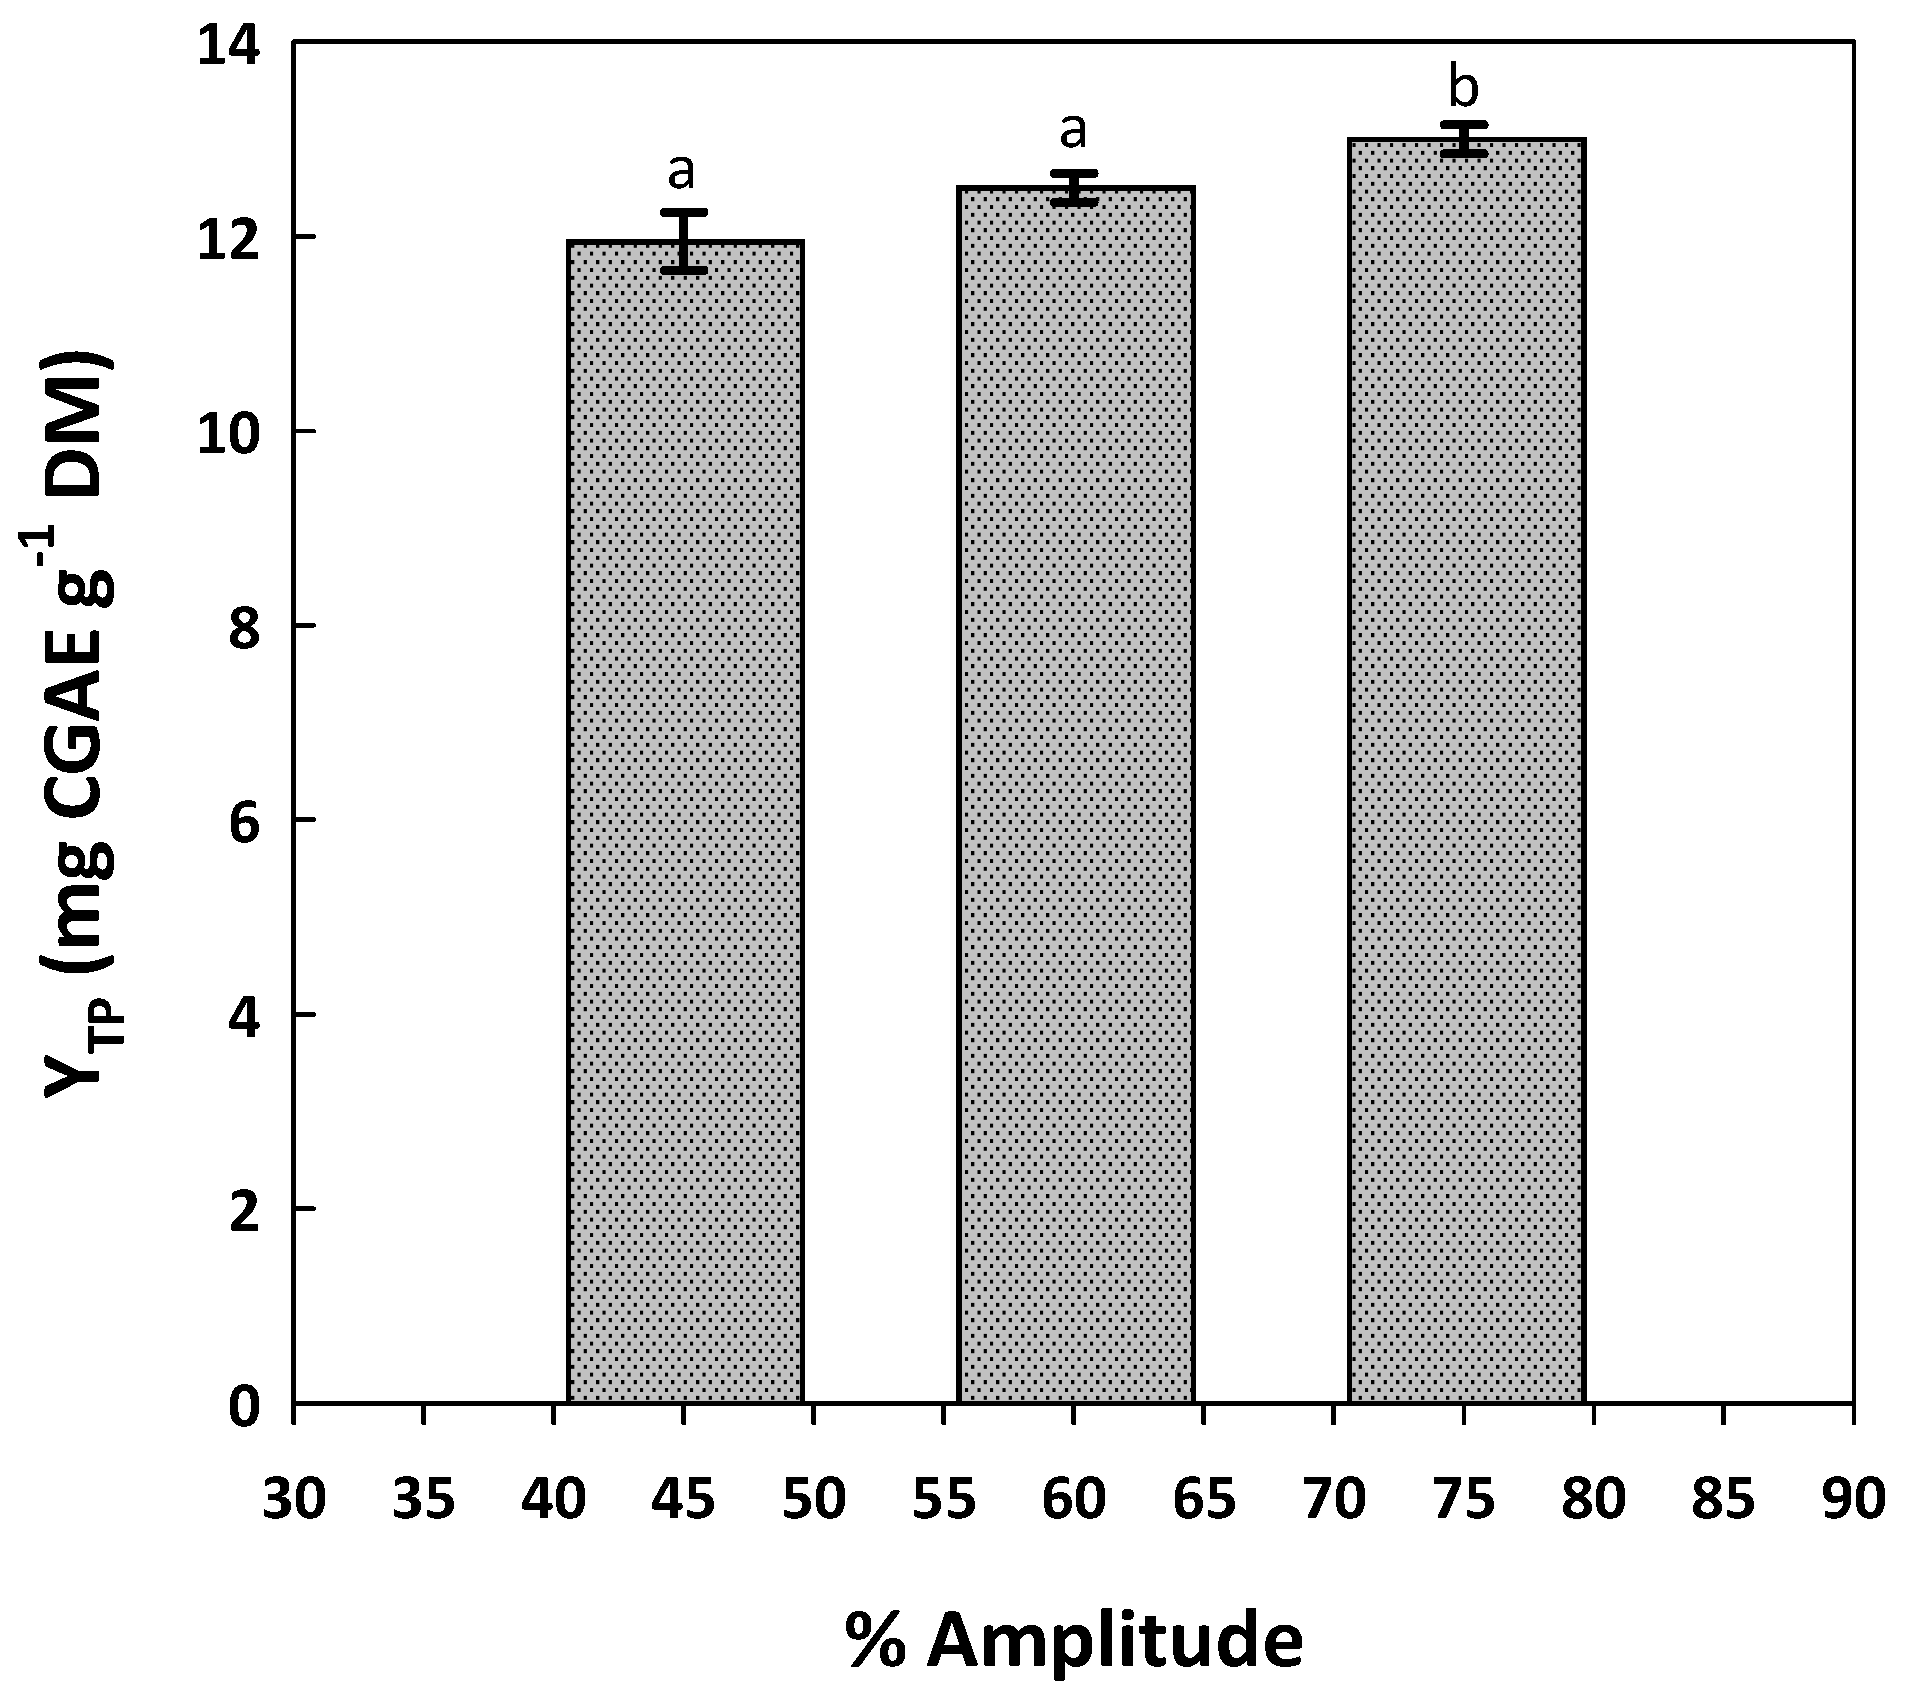
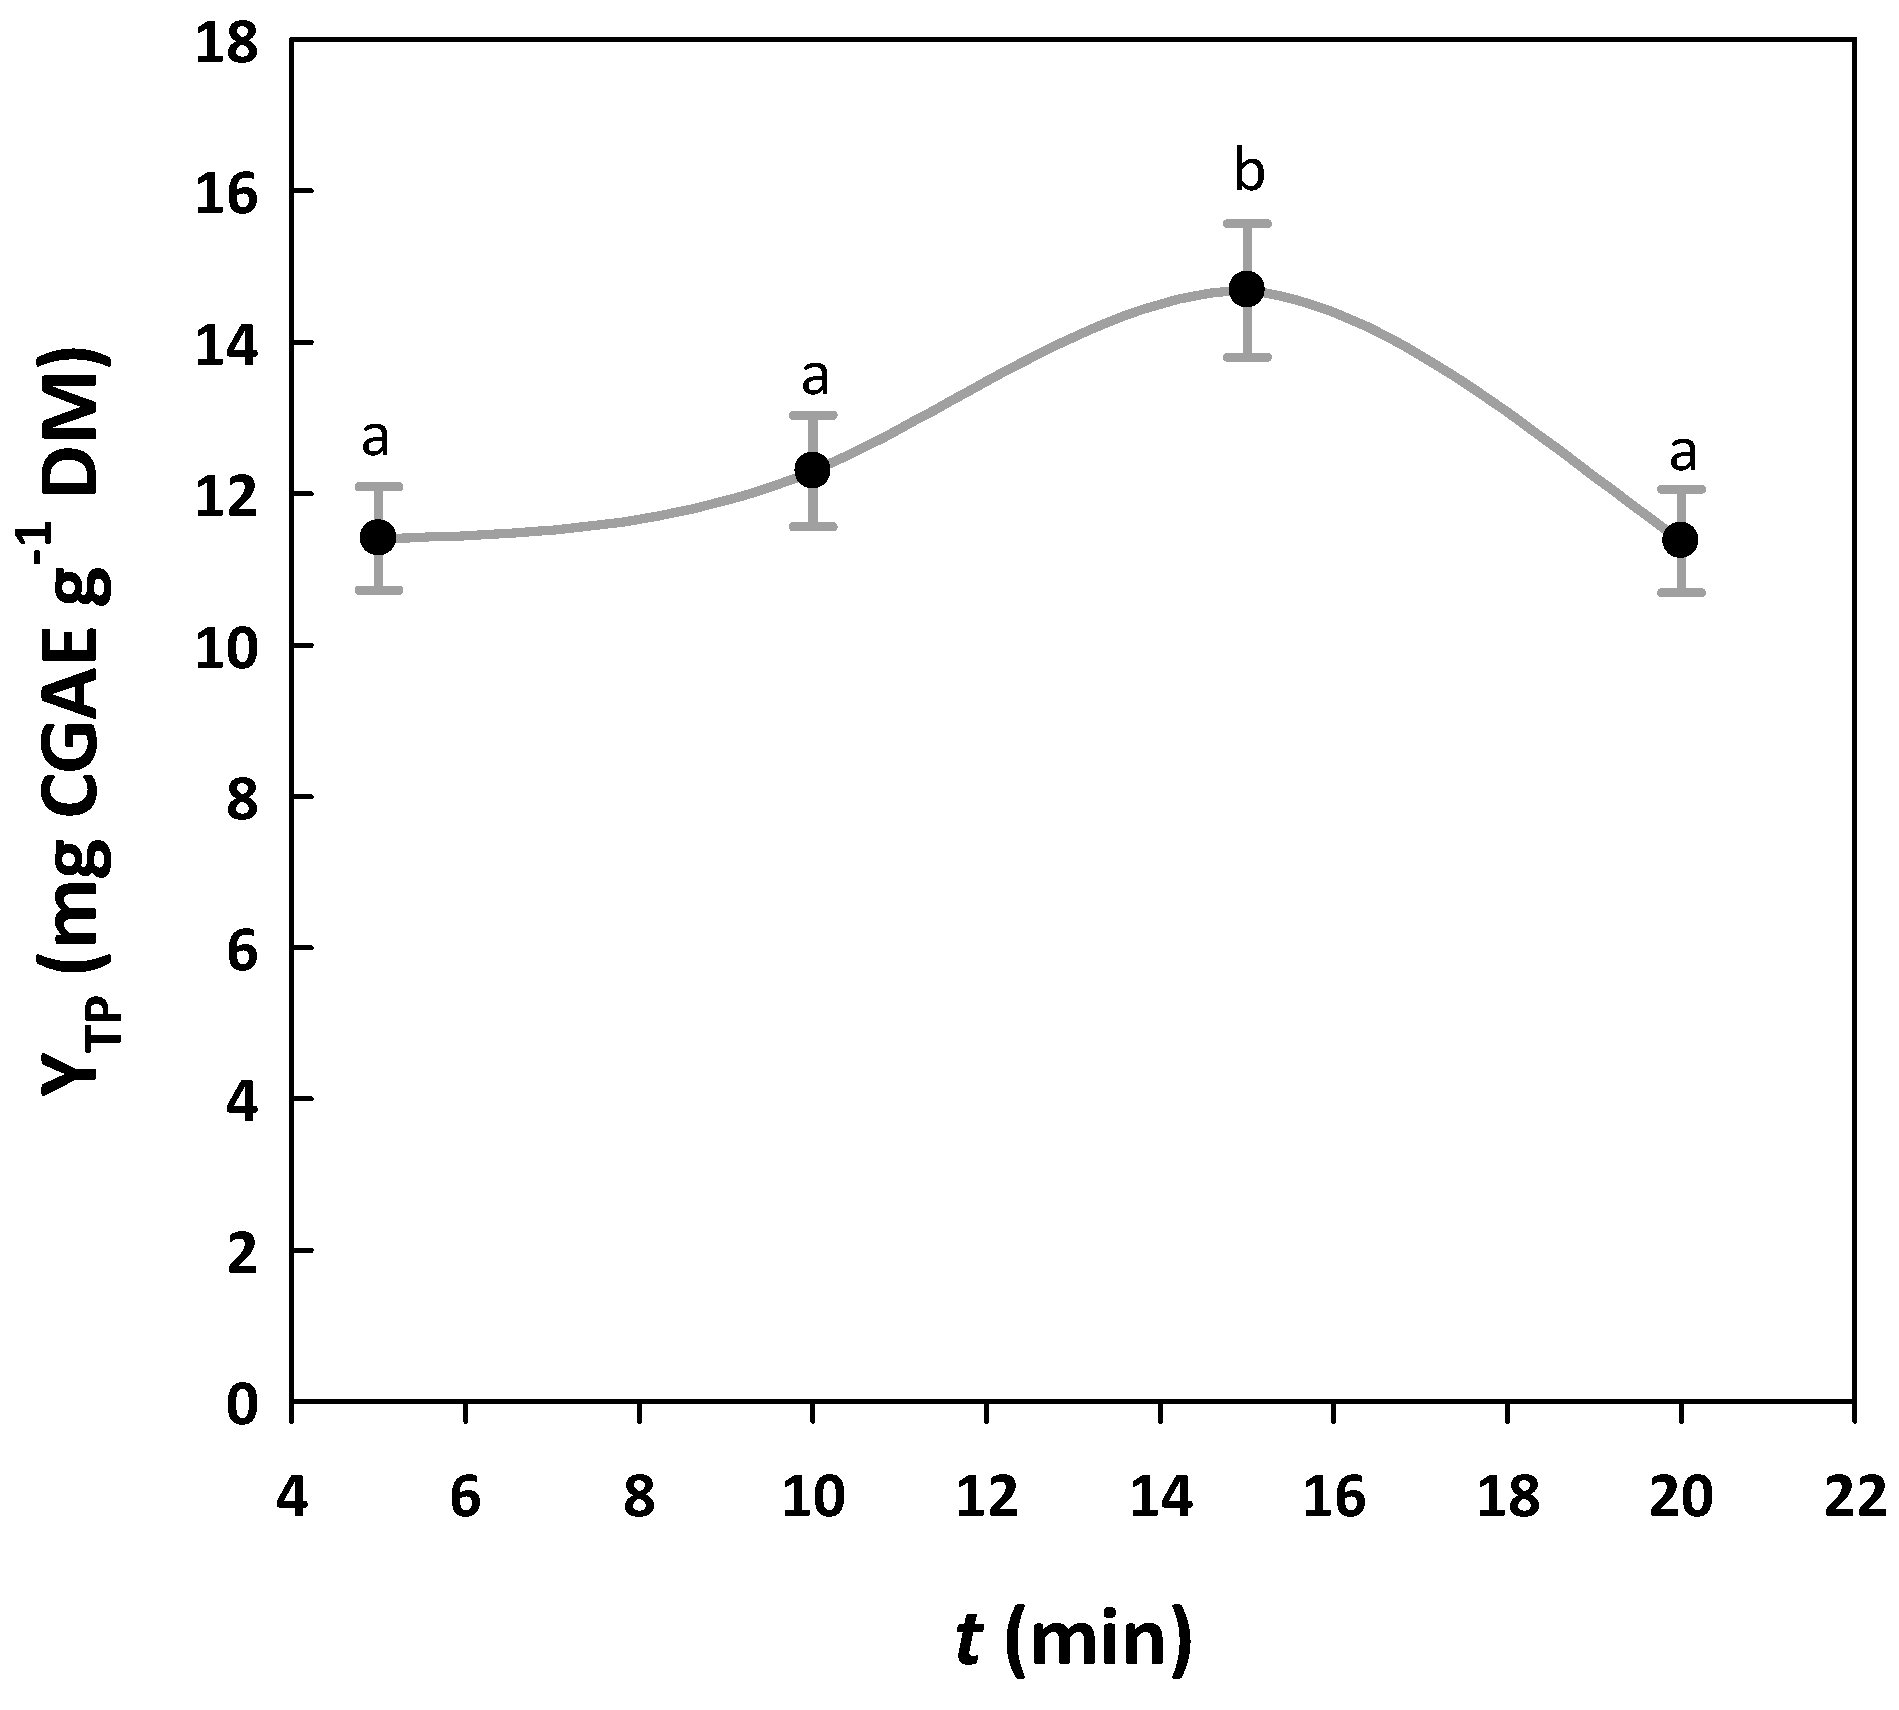
3.1. Single-Factor Examination

Previous investigations on ultrasound-assisted aqueous extraction of polyphenols from WOP demonstrated that both the amplitude (% Ampl) and time (t) of ultrasonication were significant variables related to total polyphenol yield [17]. The outcome of a study on wine lees polyphenol extraction was in absolute accordance [18], highlighting the critical role of these two process parameters. Therefore, the first stage in the development of the extraction methodology was to perform single-factor experiments, to identify the ranges within which total polyphenol yield (YTP) could be maximized. The assay on the effect of % Ampl on YTP, by maintaining a constant t of 10 min, showed that switching % Ampl from 45 to 75% gave a significant increase (Figure 1). However, the YTP values obtained at 45 and 60% Ampl had no statistically significant difference (p > 0.05). Hence, it was evident that a significant increase in YTP could be attained using an amplitude higher than 60%.
Likewise, the time assay performed by keeping % Ampl constant at 75% showed that significantly higher YTP could be achieved at 15 min (Figure 2). By contrast, limiting ultrasonication to 10 min or extending it to 20 min gave significantly lower YTP. These observations were used to set up the experimental design for the response surface optimization.

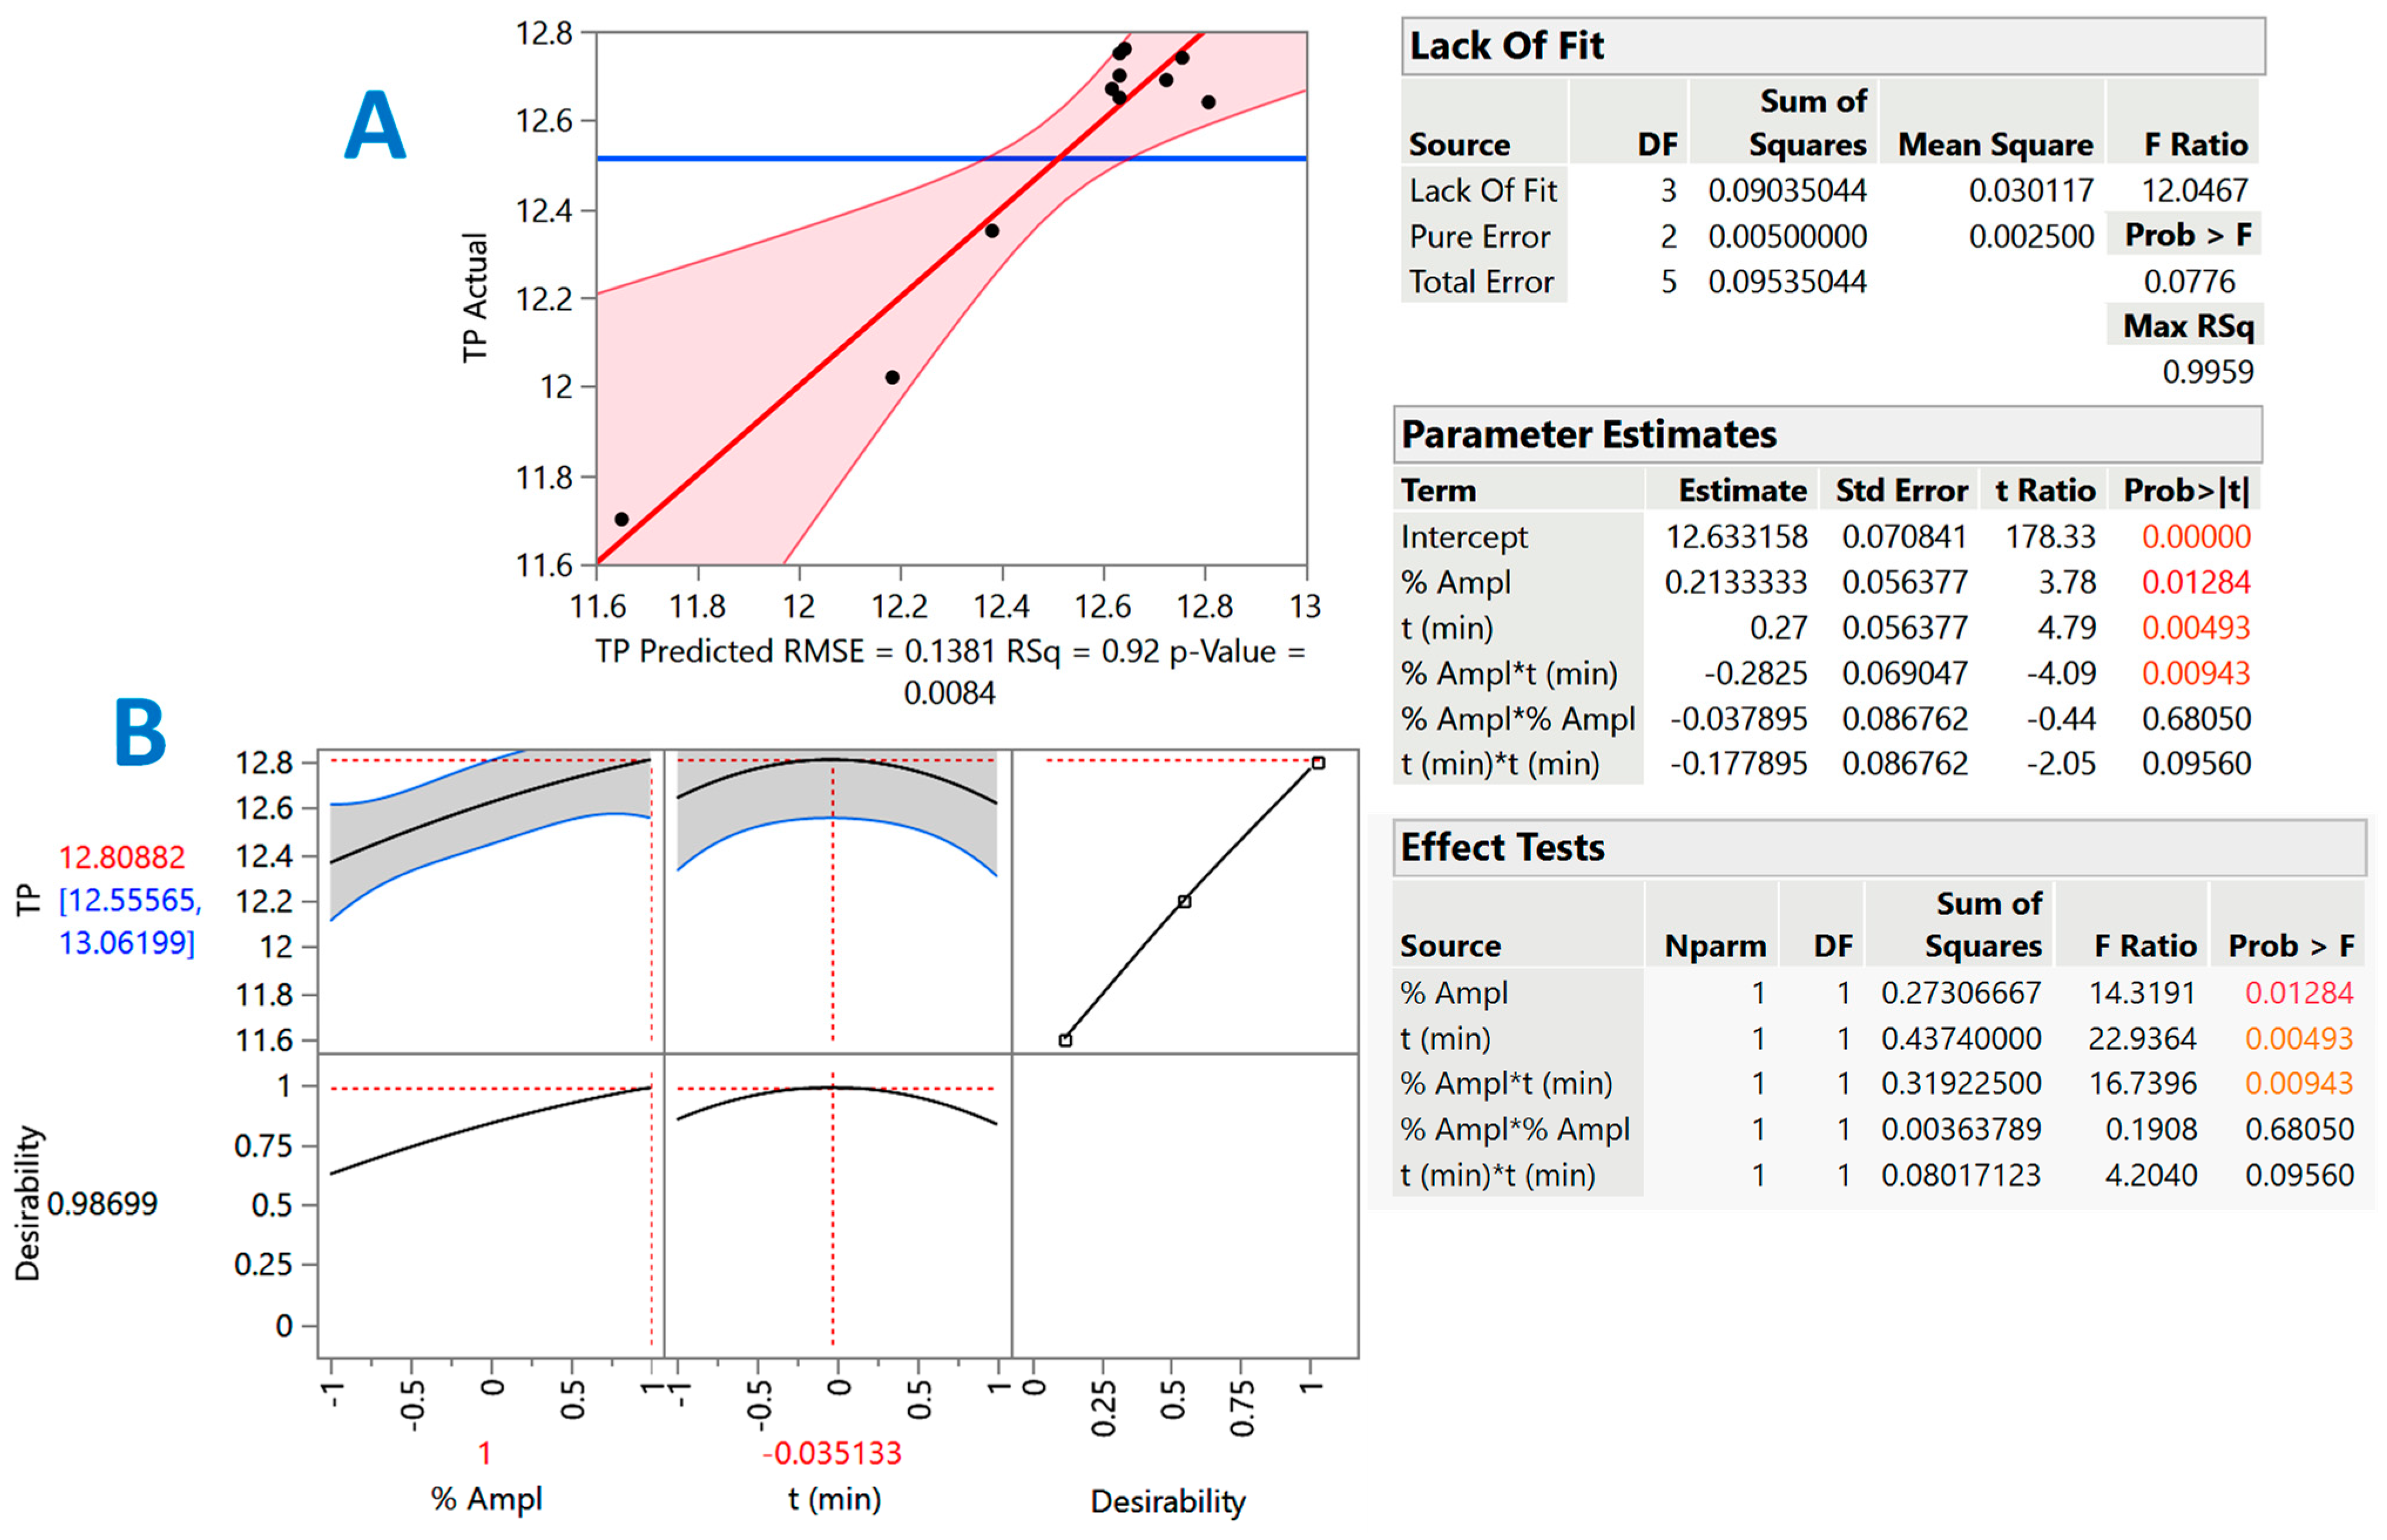
3.2. Design of Experiment and Response Surface Optimization

The methodology applied was designed to assess the effect of % Ampl and t on the response (YTP), and to trace possible synergistic functions between them. The ranges of these two process variables were selected on the basis of the single-factor experiments; however, amplitude higher than 85% was not deemed appropriate, in order (i) to avoid any adverse effect of ultrasonic radiation on polyphenolic compounds [10], and (ii) to prevent erosion effects on the ultrasonication probe [7]. Assessment of the response surface suitability and the model derived was based on the ANOVA and lack-of-fit test (Figure 3), considering the proximity of the predicted and measured values (Table 2). The polynomial equation including only the significant terms, which described the model, was as follows:
YTP = 12.63 + 0.21X1 + 0.27X2 − 0.28X1X2 (R2 = 0.92, p = 0.0084)
The square correlation coefficient (R2) of the model may be regarded as an indicator of the total variability around the mean provided by the model [19]. Thus, taking into account that both the R2 and the p value for lack-of-fit (assuming a 95% confidence interval) were highly significant, then it could be argued that the Equation (4) had very good adjustment to the experimental data. The three-dimensional diagram constructed based on the model (Figure 4), could give an at-a-glance depiction of the effect of the experimental variables (% Ampl, t) on the response (YTP). Both terms X1 (% Ampl) and X2 (t), but also their cross term X1X2 were significant (Figure 3, inset Table “Parameter Estimates”). However, the effect of X1X2 was negative, a fact manifested by the curvature of the response surface (Figure 4).
The amplitude used for the ultrasonication treatment is directly related to the actual ultrasonication power dissipated to the system, which, in turn, defines the level of ultrasonication intensity and specific ultrasonication energy input. Higher amplitude results in higher pressure amplitude of sound wave, which then will enable more violent bubble collapse. A minimum level of UI is required to achieve cavitation threshold [7], and this may be a key event in the extraction performance, since ultrasonic intensity strongly impacts extraction efficiency. In general, increases in ultrasonication power entail enhanced polyphenol extraction yield, as previously observed for WOP [17,20]. However, switching ultrasonication power to higher levels does not always provoke a positive effect on polyphenol extraction. It has been demonstrated that some WOP polyphenols may be insignificantly impacted by increases in ultrasonication power [21], whereas for others negative effects were recorded [22].
Since polyphenol extraction is a time-dependent process, ultrasonication time becomes particularly critical and can significantly affect extraction yield. Yet, in model polyphenol solutions negative effects were also observed, brought about by intense sonication settings, which led to degradation and polymerization [23]. Such an effect was clearly demonstrated for polyphenol extraction from mandarin peels, where increases in ultrasonication power and extraction time beyond certain limits resulted in a significant decline in naringenin extraction yield [24]. Similar results were reported for certain phenolic acids, during ultrasound-assisted extraction of orange peels [25]. Therefore, defining optimum ultrasonication time may reduce adverse impact on polyphenolic compounds and contribute towards achieving higher extraction yields [10].
As can be seen in the desirability diagram (Figure 3B), the optimum ultrasonication time was 15 min and the optimum estimated amplitude was 80%, which corresponded to an actual ultrasonication power of 7.09 W, an acoustic energy density (AED) of 355 W L1, and an ultrasonication intensity (UI) of 6.28 W cm2. The amplitude level of 80% matched exactly the one proposed by earlier investigations on ultrasound-assisted WOP polyphenol extraction [26,27], but also polyphenol extraction from lemon peels, for which a combination of 78% amplitude and 15 min was proposed [28]. With reference to optimal time, previous examinations indicated 3 min as the most appropriate ultrasonication period for aqueous extraction of WOP polyphenol, but at a much higher AED of 790 W L1 [17]. On the other hand, other authors proposed 90% amplitude and 35 min [29], 71% amplitude and 35 min [27], and 66% amplitude and 26 min as the optimal settings, while even longer times of 40 min [24] and 44 min [30] have also been proposed.
The above data refer only to studies performed with ultrasonication probes and not ultrasonication baths, and they should be considered merely as indicative, because the optimal ultrasonication settings for a given process may vary largely. This is because the final outcome depends to a great extent on the nominal power of the ultrasonication probe employed, the extraction temperature, and the solvent used. Ultrasonic power provokes voids in a liquid, known as cavitation bubbles. During ultrasonication, these bubbles grow up to a critical point, beyond which they collapse releasing large amounts of energy. The combination of high temperature/high pressure involved in such a phenomenon disintegrates solid particles, thus, accelerating release of the solute (polyphenols) in the liquid phase [31]. Liquids with relatively high vapor pressure, such as water/ethanol mixtures used in several studies, cavitate at lower intensity. Furthermore, cavitation bubbles are more easily produced as temperature raises, but the effects generated by cavitational collapse are also reduced as temperature increases. In fact, ultrasound effects are known to decline at temperatures higher than 40–50 °C [32]. In other words, lower temperatures, and solvents with relatively lower vapor pressure (water) may be more suitable to obtain maximum sonochemical benefit [33].

3.3. Comparative Evaluation

In a recent previous study, a conventional stirred-tank process was developed for the effective aqueous extraction of WOP polyphenols [12]. Thus, extraction was also performed by applying this methodology, to have a comparative evaluation of the ultrasonication process described herein. In addition, a hybrid extraction procedure by integrating the ultrasonication as pretreatment step and the stirred-tank extraction as the main process was attempted. As illustrated in Figure 5, the processes tested yielded statistically non-significant differences in YTP (p > 0.05), which clearly suggested that both processes were of equal performance. This finding was particularly important, considering that the conventional stirred-tank extraction was accomplished at 55 °C for 60 min, whereas the ultrasonication-assisted extraction was achieved at an average T of 16 °C, for 15 min.
To obtain a more integrated image of the extracts’ potency, the antioxidant activity was also tested. Once again, it was shown that the processes tested afforded extracts that exhibited virtually the same antioxidant potential, since neither AAR nor PR had statistically significant difference (Figure 6). This finding was a further confirmation that (i) the stirred-tank process and the ultrasonication-assisted process were of equivalent performance, and (ii) the combination of ultrasonication and stirred-tank processes offered no advantage with respect to obtaining significantly higher YTP.
An earlier examination on a comparison between ultrasound-assisted and conventional polyphenol extraction from lemon peels ended with a similar result, demonstrating no difference in total polyphenol yield [21,28] and PR [21] between the two techniques. The outcome of investigations on WOP polyphenol extraction [22,29], but also the AAR and PR of WOP extracts [34], ended likewise. By contrast, other studies evidenced a clear superiority of ultrasound-assisted extraction over the conventional one, for the recovery of WOP polyphenols [17,20], but also the AAR [26], and PR [27] of the extracts produced.
Another issue that arose out of the comparison presented in Figure 6 was that the hybrid extraction technique combining ultrasonication as the pretreatment stage and stirred-tank as the main process also afforded statistically non-significant difference in YTP. This finding contrasted earlier examinations, which demonstrated that ultrasonication was not effective enough as a standalone technique, but polyphenol recovery could be boosted when ultrasonication was used prior to the stirred-tank process [15,35,36,37]. However, negative effects of ultrasonication pretreatment have also been shown [38]. On such a ground, it would appear that the maximum amount of extractable polyphenols was recovered during the ultrasonication step, whereas further stirred-tank extraction had no effect on total polyphenol yield. Such an outcome is particularly important, highlighting the high efficiency of the ultrasound-assisted process, compared to the conventional stirred-tank process.
Under optimized conditions, the ultrasound-assisted extraction provided a YTP of 12.80 ± 0.85 mg CGAE g1 DM, while the YTP determined by combining ultrasonication and stirred-tank extraction was 12.50 ± 1.01 mg CGAE g1 DM. The values reported in the literature may vary largely, ranging from 7 to over than 26 mg GAE g1 DM, accomplished with various extraction techniques, including microwave-assisted extraction [6,22], ultrasound-assisted extraction [17], and cyclodextrin-aided extraction [36], etc. Levels of 44.09 mg GAE g1 DM [39] have also been reported, using a glycerol-based organosolv treatment of WOP, but also and as high as 75.77 mg GAE g1 DM, obtained with deep eutectic solvent extraction [40].

3.4. Profile of Polyphenolic Metabolites

To obtain a more analytical image of the polyphenolic content of the extracts produced, and to identify possible effects of the different modes of extraction on individual polyphenolic metabolites, each of the extracts was subjected to HPLC analysis (Figure 7). The tentative identification of metabolites 1–6 was based on comparing their retention times with those of original standards, whereas metabolites 7–10 were identified based on data from liquid chromatography–mass spectrometry analysis, as described in detail elsewhere [12,39]. The quantitative analysis of those constituents revealed that in all cases examined, the extracts were dominated by the flavanones hesperidin and narirutin, followed by chlorogenic acid, and the flavones nobiletin and didymin (Table 3). This pattern was observed in all three extracts examined, suggesting that the extraction mode did not affect the relative amounts of the principal polyphenols.
The richest extract was obtained by the hybrid methodology that combined ultrasonication as pretreatment and stirred-tank as the main extraction process, yet in no case was the recovery yield of any of the compounds considered statistically different from the yields achieved with stirred-tank (p > 0.05). However, compared to the US treatment, the hybrid treatment of US and stirring did enhance the recovery of certain compounds, such as chlorogenic acid, ferulic acid, narirutin, didymin, and nobiletin. Overall, the hybrid technique afforded a yield that was only 11% higher than that achieved with ultrasonication. This finding confirmed the results drawn from the total polyphenol determination, demonstrating that the largest part of the major polyphenols occurring in WOP may be extracted using the ultrasonication method developed.
The principal polyphenolic constituent in all extracts examined was by far hesperidin, which is the major metabolite occurring in orange peels [41,42]. The highest level of hesperidin recovery was 2.11 mg g1 DM, achieved using the hybrid extraction mode (Table 3). This value was significantly higher than 0.20–1.47 mg g1 DM found in other investigations [20,43], but much higher yields of just over 8 mg g1 DM have also been attained [21,22]. The extraction yield of hesperidin, but also other WOP polyphenols, may vary largely, depending on the origin of plant tissue, but also on the extraction solvent and methodology [44]. The technique presented herein may afford in total almost 6.5 mg g1 DM of polyphenolic compounds, requiring water as solvent, atmospheric conditions of temperature and pressure, and only 15 min of treatment. Therefore, it may be regarded as a high-performance extraction process.

4. Conclusions

The development of an ultrasonication-based aqueous extraction of waste orange peel polyphenols showed that efficient recovery may be feasible by appropriately adjusting the sonicator amplitude and the irradiation time. The high efficiency of the method was proven by comparison with a batch, stirred-tank process, where yields in total polyphenols were virtually equal. This was particularly important, considering that ultrasonication was carried out at nearly ambient temperature, whereas the stirred-tank process included moderate heating. Further verification of the ultrasonication-based method was derived from the chromatographic data, which show no significant quantitative differences for major polyphenolic metabolites. Results from the antioxidants tests were along the same line. The combination of both methodologies by employing ultrasonication as pretreatment and stirred-tank extraction as the main process once again revealed no significant differences in total polyphenol yield. However, a small increase in all polyphenolic compounds considered was recorded. The outcome of this study is that ultrasound-assisted extraction of waste orange peel polyphenols may be very effectively performed with a green solvent (water), requiring significantly shorter resident time and lower temperature compared to the stirred-tank one. Such a methodology could be easily scaled up and incorporated into larger biorefinery strategies, thus, contributing to sustainable and highly effective valorization of food waste biomass.

Author Contributions

Conceptualization, D.P.M.; data curation, K.B., X.V., D.P., and T.C.; formal analysis, K.B., X.V., D.P., and T.C.; investigation, K.B., X.V., D.P., and T.C.; methodology, K.B., X.V., D.P., and T.C.; resources, D.P.M. and S.I.L.; supervision, D.P.M.; validation, T.C.; visualization, D.P.M.; writing—original draft, D.P.M.; writing—review and editing, D.P.M. All authors have read and agreed to the published version of the manuscript.

Funding

This research received no external funding.

Data Availability Statement

The data presented in this study are available upon request from the corresponding author. The data are not publicly available because researchers choose to withhold data temporarily to continue their investigations, build on the findings, and use the data for future publications.

Conflicts of Interest

The authors declare no conflicts of interest.

References

  1. Monteiro, A.R.; Battisti, A.P.; Valencia, G.A.; de Andrade, C.J. The production of high-added-value bioproducts from non-conventional biomasses: An overview. Biomass 2023, 3, 123–137. [Google Scholar] [CrossRef]
  2. Oleszek, M.; Kowalska, I.; Bertuzzi, T.; Oleszek, W. Phytochemicals derived from agricultural residues and their valuable properties and applications. Molecules 2023, 28, 342. [Google Scholar] [CrossRef] [PubMed]
  3. Amran, M.A.; Palaniveloo, K.; Fauzi, R.; Satar, N.M.; Mohidin, T.B.M.; Mohan, G.; Razak, S.A.; Arunasalam, M.; Nagappan, T.; Sathiya Seelan, J.S. Value-added metabolites from agricultural waste and application of green extraction techniques. Sustainability 2021, 13, 11432. [Google Scholar] [CrossRef]
  4. Ademosun, A.O. Citrus peels odyssey: From the waste bin to the lab bench to the dining table. Appl. Food Res. 2022, 2, 100083. [Google Scholar] [CrossRef]
  5. Mohsin, A.; Hussain, M.H.; Zaman, W.Q.; Mohsin, M.Z.; Zhang, J.; Liu, Z.; Tian, X.; Salim-ur-Rehman; Khan, I.M.; Niazi, S. Advances in sustainable approaches utilizing orange peel waste to produce highly value-added bioproducts. Crit. Rev. Biotech. 2022, 42, 1284–1303. [Google Scholar] [CrossRef] [PubMed]
  6. M’hiri, N.; Ioannou, I.; Ghoul, M.; Mihoubi Boudhrioua, N. Phytochemical characteristics of citrus peel and effect of conventional and nonconventional processing on phenolic compounds: A review. Food Rev. Inter. 2017, 33, 587–619. [Google Scholar] [CrossRef]
  7. Chemat, F.; Rombaut, N.; Sicaire, A.-G.; Meullemiestre, A.; Fabiano-Tixier, A.-S.; Abert-Vian, M. Ultrasound assisted extraction of food and natural products. Mechanisms, techniques, combinations, protocols and applications. A review. Ultrason. Sonochem. 2017, 34, 540–560. [Google Scholar] [CrossRef] [PubMed]
  8. Medina-Torres, N.; Ayora-Talavera, T.; Espinosa-Andrews, H.; Sánchez-Contreras, A.; Pacheco, N. Ultrasound assisted extraction for the recovery of phenolic compounds from vegetable sources. Agronomy 2017, 7, 47. [Google Scholar] [CrossRef]
  9. Kumar, K.; Srivastav, S.; Sharanagat, V.S. Ultrasound assisted extraction (UAE) of bioactive compounds from fruit and vegetable processing by-products: A review. Ultrason. Sonochem. 2021, 70, 105325. [Google Scholar] [CrossRef]
  10. Wang, P.; Cheng, C.; Ma, Y.; Jia, M. Degradation behavior of polyphenols in model aqueous extraction system based on mechanical and sonochemical effects induced by ultrasound. Separ. Purif. Technol. 2020, 247, 116967. [Google Scholar] [CrossRef]
  11. Kimura, T.; Sakamoto, T.; Leveque, J.-M.; Sohmiya, H.; Fujita, M.; Ikeda, S.; Ando, T. Standardization of ultrasonic power for sonochemical reaction. Ultrason. Sonochem. 1996, 3, S157–S161. [Google Scholar] [CrossRef]
  12. Kalompatsios, D.; Athanasiadis, V.; Palaiogiannis, D.; Lalas, S.I.; Makris, D.P. Valorization of waste orange peels: Aqueous antioxidant polyphenol extraction as affected by organic acid addition. Beverages 2022, 8, 71. [Google Scholar] [CrossRef]
  13. Mota, I.; Rodrigues Pinto, P.C.; Novo, C.; Sousa, G.; Guerreiro, O.; Guerra, A.R.; Duarte, M.F.; Rodrigues, A.E. Extraction of polyphenolic compounds from Eucalyptus globulus bark: Process optimization and screening for biological activity. Ind. Eng. Chem. Res. 2012, 51, 6991–7000. [Google Scholar] [CrossRef]
  14. Cicco, N.; Lanorte, M.T.; Paraggio, M.; Viggiano, M.; Lattanzio, V. A reproducible, rapid and inexpensive Folin–Ciocalteu micro-method in determining phenolics of plant methanol extracts. Microchem. J. 2009, 91, 107–110. [Google Scholar] [CrossRef]
  15. Kaltsa, O.; Lakka, A.; Grigorakis, S.; Karageorgou, I.; Batra, G.; Bozinou, E.; Lalas, S.; Makris, D.P. A green extraction process for polyphenols from elderberry (Sambucus nigra) flowers using deep eutectic solvent and ultrasound-assisted pretreatment. Molecules 2020, 25, 921. [Google Scholar] [CrossRef] [PubMed]
  16. Anagnostopoulou, M.A.; Kefalas, P.; Kokkalou, E.; Assimopoulou, A.N.; Papageorgiou, V.P. Analysis of antioxidant compounds in sweet orange peel by HPLC–diode array detection–electrospray ionization mass spectrometry. Biomed. Chrom. 2005, 19, 138–148. [Google Scholar] [CrossRef] [PubMed]
  17. Dalmau, E.; Rosselló, C.; Eim, V.; Ratti, C.; Simal, S. Ultrasound-assisted aqueous extraction of biocompounds from orange byproduct: Experimental kinetics and modeling. Antioxidants 2020, 9, 352. [Google Scholar] [CrossRef]
  18. Dujmić, F.; Kovačević Ganić, K.; Ćurić, D.; Karlović, S.; Bosiljkov, T.; Ježek, D.; Vidrih, R.; Hribar, J.; Zlatić, E.; Prusina, T. Non-thermal ultrasonic extraction of polyphenolic compounds from red wine lees. Foods 2020, 9, 472. [Google Scholar] [CrossRef] [PubMed]
  19. Bezerra, M.A.; Santelli, R.E.; Oliveira, E.P.; Villar, L.S.; Escaleira, L.A. Response surface methodology (RSM) as a tool for optimization in analytical chemistry. Talanta 2008, 76, 965–977. [Google Scholar] [CrossRef]
  20. Khan, M.K.; Abert-Vian, M.; Fabiano-Tixier, A.-S.; Dangles, O.; Chemat, F. Ultrasound-assisted extraction of polyphenols (flavanone glycosides) from orange (Citrus sinensis L.) peel. Food Chem. 2010, 119, 851–858. [Google Scholar] [CrossRef]
  21. Papoutsis, K.; Pristijono, P.; Golding, J.B.; Stathopoulos, C.E.; Bowyer, M.C.; Scarlett, C.J.; Vuong, Q.V. Screening the effect of four ultrasound-assisted extraction parameters on hesperidin and phenolic acid content of aqueous citrus pomace extracts. Food Biosci. 2018, 21, 20–26. [Google Scholar] [CrossRef]
  22. M’hiri, N.; Ioannou, I.; Boudhrioua, N.M.; Ghoul, M. Effect of different operating conditions on the extraction of phenolic compounds in orange peel. Food Bioprod. Proc. 2015, 96, 161–170. [Google Scholar] [CrossRef]
  23. Wang, J.; Ma, H.; Pan, Z.; Qu, W. Sonochemical effect of flat sweep frequency and pulsed ultrasound (FSFP) treatment on stability of phenolic acids in a model system. Ultrason. Sonochem. 2017, 39, 707–715. [Google Scholar] [CrossRef] [PubMed]
  24. Nipornram, S.; Tochampa, W.; Rattanatraiwong, P.; Singanusong, R. Optimization of low power ultrasound-assisted extraction of phenolic compounds from mandarin (Citrus reticulata Blanco cv. Sainampueng) peel. Food Chem. 2018, 241, 338–345. [Google Scholar] [CrossRef]
  25. Ma, Y.-Q.; Chen, J.-C.; Liu, D.-H.; Ye, X.-Q. Simultaneous extraction of phenolic compounds of citrus peel extracts: Effect of ultrasound. Ultrason. Sonochem. 2009, 16, 57–62. [Google Scholar] [CrossRef] [PubMed]
  26. Ana, C.-C.; Jesús, P.-V.; Hugo, E.-A.; Teresa, A.-T.; Ulises, G.-C.; Neith, P. Antioxidant capacity and UPLC–PDA ESI–MS polyphenolic profile of Citrus aurantium extracts obtained by ultrasound assisted extraction. J. Food Sci. Technol. 2018, 55, 5106–5114. [Google Scholar] [CrossRef] [PubMed]
  27. Nishad, J.; Saha, S.; Kaur, C. Enzyme- and ultrasound-assisted extractions of polyphenols from Citrus sinensis (cv. Malta) peel: A comparative study. J. Food Proc. Preserv. 2019, 43, e14046. [Google Scholar] [CrossRef]
  28. Dahmoune, F.; Boulekbache, L.; Moussi, K.; Aoun, O.; Spigno, G.; Madani, K. Valorization of Citrus limon residues for the recovery of antioxidants: Evaluation and optimization of microwave and ultrasound application to solvent extraction. Ind. Crops Prod. 2013, 50, 77–87. [Google Scholar] [CrossRef]
  29. Razola-Díaz, M.d.C.; Guerra-Hernández, E.J.; Rodríguez-Pérez, C.; Gómez-Caravaca, A.M.; García-Villanova, B.; Verardo, V. Optimization of ultrasound-assisted extraction via sonotrode of phenolic compounds from orange by-products. Foods 2021, 10, 1120. [Google Scholar] [CrossRef]
  30. Shehata, M.G.; Abd El Aziz, N.M.; Youssef, M.M.; El-Sohaimy, S.A. Optimization conditions of ultrasound-assisted extraction of phenolic compounds from orange peels using response surface methodology. J. Food Proc. Preserv. 2021, 45, e15870. [Google Scholar] [CrossRef]
  31. Chemat, F.; Khan, M.K. Applications of ultrasound in food technology: Processing, preservation and extraction. Ultrason. Sonochem. 2011, 18, 813–835. [Google Scholar] [CrossRef] [PubMed]
  32. Pingret, D.; Fabiano-Tixier, A.-S.; Le Bourvellec, C.; Renard, C.M.; Chemat, F. Lab and pilot-scale ultrasound-assisted water extraction of polyphenols from apple pomace. J. Food Eng. 2012, 111, 73–81. [Google Scholar] [CrossRef]
  33. Mason, T.J.; Lorimer, J.P. Applied Sonochemistry: The Uses of Power Ultrasound in Chemistry and Processing; Wiley: Weinheim, Gemangy, 2002. [Google Scholar]
  34. Afifi, S.M.; Kabbash, E.M.; Berger, R.G.; Krings, U.; Esatbeyoglu, T. Comparative untargeted metabolic profiling of different parts of Citrus sinensis fruits via liquid chromatography–mass spectrometry coupled with multivariate data analyses to unravel authenticity. Foods 2023, 12, 579. [Google Scholar] [CrossRef] [PubMed]
  35. Nayak, A.; Bhushan, B.; Rosales, A.; Turienzo, L.R.; Cortina, J. Valorisation potential of Cabernet grape pomace for the recovery of polyphenols: Process intensification, optimisation and study of kinetics. Food Bioprod. Proc. 2018, 109, 74–85. [Google Scholar] [CrossRef]
  36. Lakka, A.; Grigorakis, S.; Kaltsa, O.; Karageorgou, I.; Batra, G.; Bozinou, E.; Lalas, S.; Makris, D.P. The effect of ultrasonication pretreatment on the production of polyphenol-enriched extracts from Moringa oleifera L.(drumstick tree) using a novel bio-based deep eutectic solvent. Appl. Sci. 2019, 10, 220. [Google Scholar] [CrossRef]
  37. Alibante, A.; Lakka, A.; Bozinou, E.; Chatzilazarou, A.; Lalas, S.; Makris, D.P. Integrated green process for the extraction of red grape pomace antioxidant polyphenols using ultrasound-assisted pretreatment and β-cyclodextrin. Beverages 2021, 7, 59. [Google Scholar] [CrossRef]
  38. Lakka, A.; Lalas, S.; Makris, D.P. Hydroxypropyl-β-cyclodextrin as a green co-solvent in the aqueous extraction of polyphenols from waste orange peels. Beverages 2020, 6, 50. [Google Scholar] [CrossRef]
  39. Abdoun, R.; Grigorakis, S.; Kellil, A.; Loupassaki, S.; Makris, D.P. Process optimization and stability of waste orange peel polyphenols in extracts obtained with organosolv thermal treatment using glycerol-based solvents. ChemEngineering 2022, 6, 35. [Google Scholar] [CrossRef]
  40. Gómez-Urios, C.; Viñas-Ospino, A.; Penadés-Soler, A.; Lopez-Malo, D.; Frígola, A.; Esteve, M.; Blesa, J. Natural deep eutectic solvents as main solvent for the extraction of total polyphenols of orange peel. Biol. Life Sci. Forum 2021, 6, 110. [Google Scholar] [CrossRef]
  41. Goulas, V.; Manganaris, G.A. Exploring the phytochemical content and the antioxidant potential of Citrus fruits grown in Cyprus. Food Chem. 2012, 131, 39–47. [Google Scholar] [CrossRef]
  42. Chen, X.-M.; Tait, A.R.; Kitts, D.D. Flavonoid composition of orange peel and its association with antioxidant and anti-inflammatory activities. Food Chem. 2017, 218, 15–21. [Google Scholar] [CrossRef] [PubMed]
  43. Sandhu, H.K.; Sinha, P.; Emanuel, N.; Kumar, N.; Sami, R.; Khojah, E.; Al-Mushhin, A.A. Effect of ultrasound-assisted pretreatment on extraction efficiency of essential oil and bioactive compounds from citrus waste by-products. Separations 2021, 8, 244. [Google Scholar] [CrossRef]
  44. Ben Hsouna, A.; Sadaka, C.; Generalić Mekinić, I.; Garzoli, S.; Švarc-Gajić, J.; Rodrigues, F.; Morais, S.; Moreira, M.M.; Ferreira, E.; Spigno, G. The chemical variability, nutraceutical value, and food-industry and cosmetic applications of citrus plants: A critical Review. Antioxidants 2023, 12, 481. [Google Scholar] [CrossRef] [PubMed]
Figure 1. Effect of % amplitude of ultrasonication on the yield in total polyphenols, during the aqueous extraction of waste orange peels for 10 min, at a constant frequency of 50 Hz. The temperature variation during the extraction process was between 14–19 °C. Designation with different small letters (a, b) shows statistically significant differences (p < 0.05).
Compounds 04 00016 g001
Figure 2. Effect of ultrasonication time on the yield in total polyphenols, during the aqueous extraction of waste orange peels at a constant amplitude of 75% and frequency of 50 Hz. The temperature variation during the extraction process varied was 14–19 °C. Designation with different small letters (a, b) shows statistically significant differences (p < 0.05).
Compounds 04 00016 g002
Figure 3. The actual vs. predicted values graph (A) and the graph depicting the desirability function (B). The inset tables present the analytical statistical data computed for the response surface optimization of the process. Values shown with different color are statistically significant (orange color, p < 0.01; red color, p < 0.05).
Compounds 04 00016 g003
Figure 4. Three-dimensional graph portraying the effect of simultaneous variation in the process variables on the response (YTP).
Compounds 04 00016 g004
Figure 5. Effect of the various extraction modes tested on total polyphenol yield. Assignments: US, ultrasound-assisted extraction, performed under optimized settings (80% amplitude, 15 min); stirred-tank extraction performed under optimized setting (55 °C, 60 min); US and stirring, hybrid mode employing the ultrasound-assisted extraction as pretreatment, followed by the stirred-tank extraction. Assignment all columns with “a” denotes no statistical difference.
Compounds 04 00016 g005
Figure 6. Effect of the various extraction modes tested on the antiradical activity (AAR) and ferric-reducing power (PR) of the extracts generated by deploying different extraction modes. Assignments: US, ultrasound-assisted extraction, performed under optimized settings (80% amplitude, 15 min); stirred-tank extraction performed under optimized setting (55 °C, 60 min); US and stirring, hybrid mode employing the ultrasound-assisted extraction as pretreatment, followed by the stirred-tank extraction.
Compounds 04 00016 g006
Figure 7. A representative chromatogram of a WOP extract produced using the optimal settings of the ultrasonication process (80% amplitude, 15 min). Peak assignment: 1, neochlorogenic acid; 2, chlorogenic acid; 3, caffeic acid; 4, ferulic acid; 5, narirutin; 6, hesperidin, 7, didymin; 8, sinensetin; 9, nobiletin; 10, dimethylnobiletin.
Compounds 04 00016 g007
Table 1. The process variables considered in this study, and their coded and actual values.
VariableCodeLevels
−101
Ampl (%)X1607080
t (min)X2101520
Table 2. Analytical presentation of the actual YTP values determined for each design point considered for the response surface optimization, along with the values predicted by the model.
Design PointProcess VariablesResponse
YTP (mg CGAE g−1 DM)
X1 (%Ampl)X2 (t, min)MeasuredPredicted
1−1 (60)−1 (10)11.7011.65
2−1 (60)1 (20)12.7412.76
31 (80)−1 (10)12.7612.62
41 (80)1 (20)12.6712.62
5−1 (60)0 (15)12.3512.37
61 (80)0 (15)12.6412.78
70 (70)−1 (10)12.0212.17
80 (70)1 (20)12.6912.72
90 (70)0 (15)12.7012.61
100 (70)0 (15)12.6512.61
110 (70)0 (15)12.7512.61
Table 3. Quantitative analysis of major polyphenolic compounds tentatively identified in the WOP extracts tested. Values represent means of triplicate analyses of two individual extractions (± standard deviation).
#CompoundYield (μg g−1 DM)
USStirringUS + Stirring
Phenolic acids
1Neochlorogenic acid458.88 ± 38.02 a476.72 ± 33.43 a534.33 ± 42.11 a
2Chlorogenic acid699.64 ± 54.62 a734.80 ± 60.44 a,b818.02 ± 58.88 b
3Caffeic acid120.14 ± 8.44 a122.06 ± 9.03 a131.51 ± 9.21 a
4Ferulic acid145.18 ± 10.21 a154.97 ± 11.05 a,b170.53 ± 11.74 b
Total1423.841488.551654.40
Flavanones
5Narirutin1016.51 ± 73.11 a1094.86 ± 80.91 a,b1195.84 ± 75.44 b
6Hesperidin1960.95 ± 112.04 a1984.14 ± 135.43 a2111.52 ± 123.02 a
Total2977.473079.003307.36
Flavones
7Didymin498.80 ± 30.30 a512.49 ± 36.54 a,b566.89 ± 29.98 b
8Sinensetin145.13 ± 8.91 a148.22 ± 6.66 a162.01 ± 11.22 a
9Nobiletin 515.76 ± 28.54 a522.65 ± 40.12 a574.22 ± 13.56 b
10Demethylnobiletin230.23 ± 12.69 a231.49 ± 12.24 a253.40 ± 9.71 a
Total1389.911414.841556.52
Sum5791.225982.396518.28
Values assigned with different letters (a, b) within rows are statistically different (p < 0.05).
Disclaimer/Publisher’s Note: The statements, opinions and data contained in all publications are solely those of the individual author(s) and contributor(s) and not of MDPI and/or the editor(s). MDPI and/or the editor(s) disclaim responsibility for any injury to people or property resulting from any ideas, methods, instructions or products referred to in the content.

