

Study of Oxygen Reduction Reaction on Polycrystalline Rhodium in Acidic and Alkaline Media

Department of Electrochemistry, Institute of Chemistry, Technology and Metallurgy, University of Belgrade, Njegoševa 12, 11000 Belgrade, Serbia
*
Author to whom correspondence should be addressed.
Catalysts 2024, 14(5), 327; https://doi.org/10.3390/catal14050327
Submission received: 15 April 2024
/
Revised: 11 May 2024
/
Accepted: 15 May 2024
/
Published: 16 May 2024
(This article belongs to the Special Issue Exploring the Mechanisms and Kinetics of Electrocatalytic Reactions)
Abstract
:This study examines the kinetics and mechanism of the oxygen reduction reaction (ORR) on a polycrystalline rhodium electrode (Rh(poly)) in acidic and alkaline media, using rotating disc electrode measurements. This study found that the ORR activity of the Rh(poly) electrode decreases in the order of 0.1 M NaOH > 0.1 M HClO4 > 0.05 M H2SO4 concerning the half-wave potentials. The Tafel slopes for ORR on Rh(poly) in the cathodic direction are 60 and 120 mV dec−1 at low and high overpotentials, respectively, in perchloric acid and alkaline solutions. However, strongly adsorbed sulfate anions hinder the ORR on Rh(poly) in sulfuric acid, leading to higher Tafel slopes. The highest ORR activity of Rh(poly) in an alkaline media suggests the promoting role of the specifically adsorbed OH− anions and RhOH. In all cases, ORR on Rh(poly) proceeds through the 4e-series reaction pathway.
1. Introduction
The oxygen reduction reaction (ORR) is the main cathodic reaction in electrochemical energy conversion devices, such as fuel cells. An understanding of fundamentals involving reaction mechanisms and kinetics is of the utmost importance for the design of various ORR electrocatalysts suitable for different applications [1,2,3]. In general, the reduction of molecular oxygen can occur through direct or series reaction pathways, without or with hydrogen peroxide as an intermediate, respectively. In a direct reaction pathway, the ORR occurs with the exchange of four electrons, producing water in an acidic medium or a hydroxyl anion in an alkaline medium. In a series reaction pathway, oxygen is either reduced to hydrogen peroxide as a product with the exchange of two electrons (2e-series pathway) or as an intermediate further reduced to water or a hydroxyl anion (4e-series pathway). Among transition metals, Pt has the highest intrinsic activity for reducing oxygen into water, exhibiting the smallest overpotential, followed by Pd, Ir, and Rh [4].
Rhodium (Rh) is a chemically inert transition metal with excellent catalytic properties for various applications in electrocatalysis [5]. That also involves the application of Rh-based catalysts for electrochemical energy conversion reactions [6,7,8,9], including oxygen reduction [10,11]. However, since Rh is scarce and expensive, it is primarily used as a catalyst component. Rh has high activity towards oxygen reduction, comparable to that of platinum. One of the disadvantages of using platinum is that it tends to dissolve in strong acids, which is not the case with Rh. This property makes Rh a good choice, especially for long-term stability in strong acids, like sulfuric acid commonly used in fuel cells. With the increasing use of Rh as a catalyst component for ORR, there is a need to understand the electrocatalytic behavior of bare rhodium.
An in-depth study of Rh single crystals involved the electrochemical characterization of low-index Rh(111), Rh(110), and Rh(100) single crystals [12,13,14]. However, there is a lack of investigation of their electrocatalytic behavior due to the challenges in their preparation [14]. The electrochemical characterization of polycrystalline rhodium (Rh(poly)) was carried out through cyclic voltammetry (CV) in both acidic and alkaline media [15,16,17,18,19]. Unfortunately, the findings on the kinetics and mechanism of ORR on Rh(poly) were not comprehensive and lacked a systematic approach. Steady-state measurements of ORR on Rh(poly) [20] revealed that the reaction mechanism was identical in both acid and alkaline solutions, with a Tafel slope of 60 at low and 120 mV dec−1 at high overpotentials. The reaction order concerning molecular oxygen within the entire pH and potential range is one. These data are consistent with those proposed for polycrystalline Pt obtained by steady-state measurements [21].
The same or similar ORR kinetics apply to electrocatalysts based on supported rhodium nanoparticles (Rh NPs), which have attracted significant attention due to their excellent electrocatalytic performance. Kinetic studies of the oxygen reduction reaction involved different supported rhodium catalysts in various solutions [22,23,24].
This work presents experimental results of cyclic voltammetry characterization and ORR activity measurements on Rh(poly) in both acidic and alkaline media using a rotating disc electrode (RDE). In the presentation of the results, the potential scale was vs. the reference hydrogen electrode (RHE).
This study aims to understand the correlation between the oxidation state of the Rh surface and the influence of the specifically adsorbed solution anions on the ORR activity in different media. That involves the analysis of Tafel slopes and Koutecký–Levich (K–L) diagrams, which provide an in-depth insight into the catalytic properties of polycrystalline rhodium regarding the ORR kinetics and mechanism. Additionally, this study involved a hydrogen peroxide redox reaction to elucidate its impact on the ORR mechanism. The electrochemical behavior of Rh(poly) towards ORR is compared with that of platinum electrodes and supported Rh nanoparticles to comprehend the role and contribution of Rh as a catalyst component.
2. Results and Discussion
2.1. Electrochemical Characterization of Rh(poly) in Acid and Alkaline Media
Figure 1 shows the electrochemical characterization of polycrystalline Rh by cyclic voltammetry in acid and alkaline solutions. Since Rh adsorbs hydrogen and undergoes surface oxidation [25,26,27,28], the CVs recorded over a wide potential range include hydrogen adsorption/desorption (Hupd) processes, a double-layer region, and oxidation/reduction of Rh at higher potentials. Subsequent CVs, recorded with the opening of the positive potential limit, enable following a gradual Rh surface oxidation. The negative and positive limits were chosen to avoid hydrogen and oxygen evolution at lower and higher potentials, respectively, and ranged from 0.07 to 1.37 V.
Figure 1a shows CVs of Rh(poly) in 0.1 M HClO4. In the first CV, recorded in the potential range from 0.07 V to 0.47 V, there are only peaks related to hydrogen adsorption/desorption processes and a narrow double-layer region. In the negative scan direction, hydrogen adsorption on Rh(poly) occurs in the potential range from 0.27 V to 0.07 V, showing a peak at 0.12 V. The desorption of hydrogen occurs in the positive scan direction starting from the negative potential limit up to 0.3 V, with a pronounced peak at 0.15 V.
With the opening of the positive potential limit, after a narrow double-layer region, the increasing current density in the positive scan direction originates from the adsorption of oxygen species and subsequent oxide formation, which begins at 0.45 V and continues up to the last chosen positive potential limit of 1.37 V. Previous studies of the surface Rh oxide formation and reduction processes about the nature of Rh species formed in both perchloric [29] and sulfuric acid solution [30,31] have reported similar findings according to which the oxidation of Rh begins with the gradual formation of RhOH:
and, with increasing potential, it proceeds with the formation of Rh(OH)3 and RhO(OH) species according to the following reactions:
Rh + H2O → RhOH +H+ + e−
RhOH + 2H2O → Rh(OH)3 +2H+ + 2e−
Rh(OH)3 → RhO(OH) + 1/2O2 +2H+ + 2e−
Rh surface oxidation can also occur through other mechanisms, which include the formation of Rh2O, RhO, Rh2O3, and RhO(OH)3 species on the electrode surface [25,32,33].
Based on these findings, it can be observed from Figure 1a that in 0.1 M HClO4, the formation of Rh(OH) begins at the potential of 0.45 V and completes with the formation of a full monolayer at about 1.0 V. With increasing potential, the formation of higher Rh oxides occurs. The gradual opening of the positive potential limit in the potential region of Rh oxide formation leads to a gradual shift in the position of the Rh reduction peak towards more negative potentials. The asymmetry in anodic and cathodic peaks indicates that the Rh oxide formation and reduction are not reversible processes. For higher potential limits, the reduction of Rh oxide occurs over a wider potential region and overlaps with the adsorption of hydrogen in the Hupd region, which is in line with previously reported Rh behavior in both perchloric and sulfuric acid solutions [17,34,35].
Figure 1b shows CVs of Rh(poly) in 0.05 M H2SO4 solution. The voltammetric behavior of the Rh(poly) electrode in sulfuric acid is similar to that in perchloric acid. Hydrogen adsorption/desorption occurs in the potential range from 0.07 V to about 0.30 V, showing the adsorption/desorption peaks at 0.09 V and 0.13 V, respectively. Unlike the weakly adsorbed perchlorate anions, which do not interfere with the hydrogen adsorption/desorption and oxide formation/reduction processes, sulfate anions adsorb strongly on the electrode surface. The specific adsorption of the solution sulfate ions occurs in the double layer and overlaps with both hydrogen adsorption/desorption and oxide formation/reduction, thus contributing to the increased intensity and sharpness of the peaks.
Based on previous findings on the role of specifically adsorbed sulfate anions in the first stages of Pt(poly) surface oxidation [36], the following considerations can apply to Rh(poly). Starting from the onset of Rh surface oxidation, specifically adsorbed HSO4−/SO42− anions are gradually replaced by RhOH formation with increasing potential, according to the following reactions:
where x is the number of Rh surface sites occupied by sulfate anions.
RhxA− + H2O → (x − 1)Rh + RhOH + A− + e−
(x − 1)Rh + H2O → RhOH + H+ + e−
The Rh(poly) surface oxidation begins at a potential of 0.48 V until the formation of a full RhOH monolayer at about 1.07 V. It is worth noting that the onset potential for RhOH formation in the presence of specifically adsorbed sulfate anions is about 30 mV more positive than in the presence of weakly adsorbed perchlorate anions.
For higher potential limits, the formation of higher Rh oxide proceeds further with increasing potential. There is significant irreversibility of the Rh oxide formation/reduction peaks. Moreover, there is a less defined double layer in the cathodic scan direction due to the apparent overlapping of the surface oxide reduction peaks and hydrogen adsorption. That coincides with the previously published CV results for polycrystalline Rh in a sulfuric acid solution [31,32,33,35,37].
Figure 1c shows the CVs of Rh(poly) in 0.1 M NaOH. The CVs exhibit typical features of Rh(poly) in an alkaline media [15,18,38] that differ from those in an acidic media. The first CV recorded for the lowest positive potential limit shows that hydrogen adsorption occurs from 0.34 V down to 0.08 V in the negative scan direction with a peak at 0.16 V. At a potential of 0.08 V, hydrogen evolution begins. On the other hand, hydrogen desorption occurs from 0.08 V to 0.38 V in the positive scan direction with a peak at 0.21 V. The specific adsorption of OH− anions occurs over a wide potential region, which is known as the preoxidation region according to the following reaction:
Rh + OH− → RhOHads−
Rh exhibits a wide double layer over a very narrow potential range due to the superposition of hydrogen adsorption/desorption, specific adsorption of OH− anions, and oxide formation/reduction regions [38]. These peaks’ superposition is more pronounced in an alkaline than in an acidic media.
The oxidation of the Rh surface begins at around 0.45 V with the appearance of the peaks at 0.50 V and 0.75 V and continues at higher potentials. These two peaks correspond to the specifically adsorbed OH− anions and RhOH, respectively [39]. Like in acidic media, as the upper potential limit increases, the Rh oxide formation/reduction becomes more irreversible, which becomes most pronounced for the highest upper limit. In the cathodic scan direction, the oxide reduction overlaps with the hydrogen adsorption, indicating that higher Rh oxides are not completely reduced at lower potentials [39].
2.2. Oxygen Reduction on Rh(poly) in Acidic and Alkaline Media
This study of the ORR on Rh(poly) involved RDE measurements in perchloric and sulfuric acids, as well as in an alkaline solution. The objective was to understand the impact of the oxidation state of the Rh surface, and the adsorption of different solution anions. Additionally, Rh behavior concerning the hydrogen peroxide reduction/oxidation (HPRR/HPOR) was also measured to gain more insights into the ORR reaction mechanism, as it acts as a possible intermediate. Additional information about the ORR mechanism was obtained by comparing the activity of Rh for both ORR and HPRR. For that reason, a brief overview of the overall oxygen reduction reactions and the main elemental steps are presented below. The standard electrode potentials (E0) are provided for each reaction in an acidic medium (1 M [H+], pH = 0) and in an alkaline medium (1M [OH−], pH 14) vs. standard hydrogen electrode (SHE), using the data from ref. [40]. The equilibrium potentials for each reaction in 0.1 M HClO4, 0.05 M H2SO4, and 0.1 M NaOH solutions are given vs. SHE and RHE.
The overall oxygen reduction reaction in an acidic medium is expressed as follows:
O2 + 4H+ + 4e− = 2H2O E0 = 1.23 V
For 0.1 M HClO4 (pH = 1.1) and 0.05 M H2SO4 (pH = 1), the ORR equilibrium potential values are the same, 1.17 V vs. SHE (1.22 V vs. RHE).
In an alkaline solution, the overall reaction is expressed as follows:
O2 + 2H2O + 4e− = 4OH− E0 = 0.4 V
The ORR equilibrium potential for 0.1 M NaOH (pH = 13) is 0.46 V vs. SHE (1.23 V vs. RHE).
In a 2e-series reaction pathway, oxygen is reduced to hydrogen peroxide as a product. In a 4e-series pathway, hydrogen peroxide acts as an intermediate which is further reduced to water in acid or to a hydroxyl anion in an alkaline medium.
For an acidic medium, this is expressed as follows:
O2 + 2H+ + 2e− ⇌ H2O2 E0 = 0.68 V
H2O2 + 2H+ + 2e− ⇌ H2O E0 = 1.77 V
The equilibrium potentials for 0.1 M HClO4 and 0.05 M H2SO4 are 0.62 V vs. SHE (0.67 V vs. RHE) for reaction (9) and 1.71 V vs. SHE (1.77 V vs. RHE) for (10).
The same reactions for an alkaline medium are as follows:
O2 + H2O + 2e− ⇌ HO2− + OH− E0 = −0.076 V
HO2− + H2O + 2e− ⇌ 3OH− E0 = 0.878 V
The equilibrium potentials for 0.1 M NaOH, pH 13, are −0.016 V vs. SHE (0.75 vs. RHE) for reaction (11), and 0.94 V vs. SHE (1.77 V vs. RHE) for (12).
The standard potentials for oxygen reduction to hydrogen peroxide in both acid reaction (9) and alkaline reaction (11) solutions are lower than the standard hydrogen peroxide redox potentials reaction (10) for acid, and reaction (12) for alkaline solutions. Therefore, further reduction of H2O2 as an intermediate during ORR usually proceeds spontaneously. On the other hand, the slow kinetics of hydrogen peroxide reduction often cause its inhibition. Therefore, a separate examination of the Rh(poly) activity toward H2O2 reduction is necessary.
2.2.1. ORR on Rh(poly) in Acidic Media
Figure 2 displays the ORR polarization curves recorded in 0.1 M HClO4 in both cathodic and anodic directions within the potential range of 0.07 to 0.92 V with five rotation rates and corresponding Tafel and Koutecký–Levich plots.
Figure 2a illustrates that the onset potential for the oxygen reduction reaction in the cathodic direction is 0.85 V. When the ORR depends solely on the activation energy for O2 adsorption, the polarization curves are unaffected by the rotation speed. This is known as the activation control region, which extends from the onset potential down to 0.72 V. As the potential decreases, the polarization curves differentiate depending on the rotation speed, and the reaction occurs under mixed control. This means that it depends on both the activation energy for O2 adsorption and the diffusion of molecular oxygen from the solution to the electrode interface. The mixed control extends down to 0.35 V, after which the diffusion control sets in, meaning that the reaction depends only on oxygen diffusion. A comparison of ORR polarization curves with the CVs of Rh(poly) from Figure 1a shows that oxygen reduction begins in the potential range of RhOH reduction. The ORR onset potential is slightly lower than the one corresponding to the RhOH monolayer, indicating that Rh surface sites free of hydroxide are available for the adsorption of molecular oxygen. With further decrease in potential, gradual RhOH reduction leaves more and more free Rh surface sites for oxygen adsorption and subsequent reduction. At potentials lower than 0.35 V, the surface is free of RhOH, and the diffusion control begins. The presence of weakly adsorbed perchlorate anions in the double layer region and the region of hydrogen adsorption at lower potentials do not significantly interfere with the adsorption and reduction of oxygen. The difference in the Rh(poly) activity for ORR in two scanning directions in the activation and mixed control arises from the irreversibility of RhOH formation/reduction. There is no difference in the diffusion control region due to the absence of RhOH.
Figure 2b shows the Tafel plots obtained from ORR polarization curves in both cathodic and anodic directions. Tafel slopes for both directions are 60 and 120 mV dec−1 at low and high overpotentials, respectively. Based on the CV from Figure 1a, the change in the Tafel slope at about 0.75 V in the cathodic and 0.78 V in the anodic direction corresponds to the same coverage of RhOH. This indicates that the slope of 60 mV dec−1 at higher potential (lower overpotential) corresponds to the higher degree of oxidation, while the slope of −120 mV dec−1 at lower potentials (higher overpotentials) corresponds to the lower RhOH coverage. The obtained values of the Tafel slope for ORR on the Rh(poly) electrode align with those previously reported based on steady-state measurements of ORR on Rh(poly) [20]. A change in the Tafel slope usually means a change in the rate-determining step. However, it was assumed that on Pt(poly) [41], as well as on platinum low-index single crystal surfaces [42], the ORR proceeds with the exchange of the first electron as the rate-determining step in both activation and mixed control potential regions. Therefore, these changes in the Tafel slope were attributed to a shift from Temkin (60 mV dec−1) to Langmuir (120 mV dec−1) conditions of adsorption of reaction intermediates with decreasing coverage.
The Koutecký–Levich equation is used to analyze the ORR polarization curves, which relate the measured current density (j) to the kinetic current density (jk) and the diffusion current density (jl). The equation is expressed as follows:
The value of jl is dependent on the rotation rate (jl = Bω1/2), and the constant B is
where n is the total number of electrons exchanged, F is Faraday’s constant (96,485 C mol−1), is the oxygen solubility, is the oxygen diffusivity, and ν is the kinematic viscosity of the solution. The K–L plot is obtained by plotting the inverse value of the current density (1/j) against the inverse value of the square root of the rotation rate (ω−1/2). The experimental value of the constant B is calculated from the slope of the K–L plots and used to determine the number of electrons exchanged for selected potentials.
Figure 2c,d show the K–L plots derived from ORR polarization curves in both cathodic and anodic directions. The number of electrons exchanged is calculated using Equation (14), and from the data for 0.1 M HClO4 from ref. [43], where is 1.26 × 10⁻³ mol L−1, is 1.93 × 10⁻⁵ cm2 s−1, and ν is 0.01 cm2 s−1.
For the cathodic direction (Figure 2c), the K–L plots are parallel for lower potentials, giving a total of four electrons exchanged for each potential. However, the slope decreases slightly for higher potentials, resulting in a higher number of electrons exchanged, suggesting an overlap with the reduction of RhOH. On the other hand, the K–L plots obtained from polarization curves in the anodic direction (Figure 2d) are parallel, giving again four electrons for each potential. The overlap with the partial Rh surface oxidation is not significant enough to contribute to the total number of electrons exchanged. In conclusion, the oxygen reduction reaction on Rh(poly) in a 0.1 M HClO4 solution follows a 4e-reaction pathway. The linearity of the K–L plots suggests first-order kinetics regarding molecular oxygen.
As suggested above, the step that determines the rate for the overall reaction is the transfer of the first electron:
followed either by the exchange of the second electron:
or by the disproportionation reaction:
O2 + H+ + e− = HO2−
HO2 + H+ + e− = H2O2
2HO2 = O2 + H2O2
Figure 3 shows ORR polarization curves recorded in oxygen-saturated 0.05 M H2SO4 solution in both cathodic and anodic directions with five rotation rates and corresponding Tafel and K–L plots.
Figure 3a displays that the onset potential for ORR on the Rh(poly) electrode in the cathodic direction is 0.74 V. The ORR onset potentials coincide with the RhOH coverage slightly below a monolayer, as observed from CVs in Figure 1b for the same upper potential limits. ORR occurs in the activation control over a wider potential region, starting from the onset potential down to 0.5 V, when the mixed control sets in. The mixed control extends from 0.3 down to 0.15 V, depending on the rotation rate. After this, the diffusion control is established and extends over a narrow potential region to the negative potential limit. Both activation and mixed control potential regions are much larger than those for perchloric acid, due to the influence of strongly adsorbed sulfate anions. After RhOH reduction, free Rh surface sites are blocked for the adsorption of molecular oxygen due to the competitive adsorption of sulfate anions according to reactions (4) and (5). In the anodic direction, the onset potential is 0.82 V, and ORR polarization curves are significantly irreversible compared to the ones in the cathodic direction. The difference in the ORR onset potentials and irreversibility of ORR polarization curves in the two directions arises from the irreversibility of the RhOH formation/reduction.
Figure 3b shows corresponding Tafel plots for ORR in both scanning directions. For ORR in the cathodic direction, the Tafel slope changes from 80 at low to 200 mV dec−1 at high overpotentials. For ORR in the anodic direction, the Tafel slope changes from 70 at low to 180 mV dec−1 at high overpotentials. The change in the Tafel slopes in the activation control region for both directions is caused by the difference in the adsorption conditions for oxygen and reaction intermediates, as already discussed above for ORR on Rh(poly) in perchloric acid. A higher Tafel slope for ORR on Rh(poly) in sulfuric, compared to perchloric acid, indicates a lower reaction rate. The lower ORR activity in sulfuric acid arises from the effect of sulfate anion adsorption.
Figure 3c,d depict K–L plots for ORR in cathodic and anodic directions. To calculate the number of electrons exchanged, Equation (13) is used, and from the data for 0.05 M H2SO4, from ref. [36], where is 1.38 × 10⁻³ mol L−1, is 1.90 × 10⁻⁵ cm2 s−1, and ν is 9.97 × 10⁻³ cm2 s−1. Like in the previous case, the linear K–L plots indicate the first-order kinetics concerning molecular oxygen.
The K–L plots obtained from ORR curves in the cathodic direction (Figure 3c) reveal that the slope slightly decreases as the potential increases. This implies that the total number of electrons exchanged varies with the potential. At higher potentials, RhOH reduction is superimposed on the ORR curve, resulting in more than four electrons being exchanged. However, at lower potentials, the number of electrons exchanged is four which is consistent with the ORR occurring at a surface free of oxide. For ORR curves recorded in the anodic direction (Figure 3d), K–L plots are parallel, and the total number of electrons exchanged is 3.8. This suggests that the ORR occurs mostly through a 4e-series pathway, and only partly through a 2e-series pathway, which is most likely a consequence of the partial inactivity of Rh (poly) for the reduction of hydrogen peroxide as an intermediate caused by the presence of specifically adsorbed sulfate anions.
2.2.2. ORR on Rh(poly) in Alkaline Media
Figure 4 shows polarization curves for ORR recorded in oxygen-saturated 0.1 M NaOH solution in both cathodic and anodic directions with five different rotation rates and corresponding Tafel and K–L plots.
Figure 4a reveals that the initial potential for ORR is 0.90 V in the cathodic direction and 0.92 V in the anodic direction. Upon comparing it with the CV from Figure 1c, it can be observed that the difference in the oxidation state of Rh in both directions is negligible within the potential range of the activation and mixed control. The lower ORR activity in the negative as compared to the positive scan direction and the difference in initial potentials can be attributed to the irreversibility of RhOH formation/reduction. This phenomenon is not new and has been observed for polycrystalline palladium [43] and platinum [44] as well, where better ORR activity is noticed in the anodic than in the cathodic direction.
The Tafel plots in Figure 4b show two slopes for ORR in both directions. The slopes are 60 and 120 mV dec−1 for low and high overpotentials, respectively, which aligns well with previous results [20]. It was assumed that ORR proceeds through the same reaction pathway with the exchange of the first electron as the rate-determining step and that Tafel slope changes can be attributed to the shift from Temkin to Langmuir adsorption conditions at low and high current densities, respectively [20].
Figure 4c,d display K–L plots for ORR on Rh(poly) in 0.1 M NaOH, recorded in cathodic and anodic directions. The total number of electrons exchanged is calculated using Equation (14), and from the data for 0.1 M NaOH from ref. [41], where is 1.22 × 10⁻³ mol L−1, is 1.90 × 10⁻⁵ cm2 s−1, and ν is 0.01 cm2 s−1.
A non-parallelism of K–L curves at higher potentials for both directions indicates that the number of electrons changes with the potential due to the contribution of RhOH formation/reduction. For lower potentials, K–L plots are parallel for ORR in both directions, and the total number of electrons exchanged is four. The linearity of the K–L plots indicates first-order kinetics concerning molecular oxygen. Obtained results suggest that the ORR proceeds through the 4e-reaction pathway.
2.2.3. Hydrogen Peroxide Oxidation/Reduction on Rh(poly) in Acid and Alkaline Media
When hydrogen peroxide is the final product of oxygen reduction, the electrode is inactive for further H2O2 reduction, and the overall reaction occurs through the 2e-series reaction pathway. A notable example among noble metals is ORR on Au in an acid solution, where on all Au single crystals, the reaction occurs through the 2e-series pathway [45]. In contrast, if the electrode is active for further reduction of H2O2 to H2O, according to reaction (10), ORR occurs through the 4e-series pathway, like on polycrystalline Pt [36] and Pd [43]. To understand the activity of the electrode towards hydrogen peroxide, as an intermediate, separate measurements of Rh(poly) activity toward HPRR/HPOR are carried out in an oxygen-free solution containing hydrogen peroxide.
Polarization curves for HPRR/HPOR in both the cathodic and anodic directions are recorded for three investigated basic solutions and compared with corresponding ORR curves for the same rotation rate of 1600 rpm, as illustrated in Figure 5.
Figure 5a displays polarization curves for HPRR/HPOR in 0.1 M HClO4 + 5 mM H2O2 solution, showing that the redox potentials for HPRR/HPOR are about 0.82 V in the cathodic direction and 0.84 V in the anodic direction. A comparison of the polarization curves shows that the activity of Rh(poly) for HPRR/HPOR and ORR on a Rh(poly) (Figure 5b) mainly coincide, indicating that ORR proceeds through a 4e-series reaction pathway. Like for ORR curves, the difference in the LSV curves for HPRR in the activation and mixed potential regions in two directions is attributed to the irreversibility of RhOH formation/reduction.
Figure 5c displays polarization curves for HPRR/HPOR on Rh(poly) in 0.05 M H2SO4 + 5 mM H2O2 and shows that the redox potentials in the cathodic and anodic directions are 0.83 V and 0.84 V, respectively. The hysteresis for cathodic and anodic polarization curves is more pronounced than that for a 0.1 M HClO4 solution. HPRR is considerably hindered in the cathodic direction, showing a wide potential region of the activation and mixed control regions. This is because the strongly adsorbed sulfate anions prevent the specific adsorption of OH- anions and subsequent RhOH formation. As a result, the lower activity of Rh(poly) in sulfuric acid for HPRR and subsequently for ORR is due to its low activity for hydrogen peroxide reduction, as a reaction intermediate. Figure 5e shows the polarization curves for HPRR/HPOR on the Rh(poly) electrode, in an oxygen-free 0.1 M NaOH + 5 mM H2O2 solution, which shows the H2O2 oxidation/reduction potentials of 0.89 V and 0.90 V in the cathodic and anodic directions, respectively. The hysteresis between cathodic and anodic polarization curves is less pronounced than that observed for the acid solution. Figure 5f shows that the H2O2 redox potential is a bit higher than the onset potential for ORR. The activation and mixed control regions for ORR and HPRR overlap and the diffusion control for HPRR sets in at a bit higher potential than for ORR. All of this implies that the Rh(poly) surface is equally active for hydrogen peroxide produced as an intermediate during ORR giving rise to the 4e-series reaction mechanism for ORR.
2.2.4. Stability of Rh(poly) during ORR in Acidic and Alkaline Media
Figure 6 illustrates the stability testing of the Rh(poly) during ORR in 0.1 M HClO4, 0.05 M H2SO4, and 0.1 M NaOH solutions.
The testing involved recording chronoamperometry (CA) curves, for three hours, at a constant applied potential, in the three solutions. Furthermore, ORR polarization curves were recorded before and after the CA measurements to assess changes in activity.
The CA curve in Figure 6a, recorded in oxygen-saturated 0.1 M HClO4 at 0.78 V, shows a decrease in the current density in the first half an hour. After that, a constant current density is achieved, indicating that the Rh(poly) remains stable. The inset shows that the ORR polarization curve after the CA only differs from the initial one at high current densities starting at a potential approaching the diffusion control region. These differences are due to the changes in the transport of molecular oxygen to the electrode surface over time. The overlap of the two polarization curves in the activation and mixed control regions indicates that the electrode surface remains stable after CA testing.
A similar CA curve for Rh(poly) in 0.05 M H2SO4 solution (Figure 6b), recorded at a constant potential of 0.68 V, shows that the electrode remains stable during testing. This is further proved by the good overlap of the ORR polarization curves obtained before and after testing.
The CA curve for Rh(poly) in 0.1 M NaOH, recorded at 0.88 V (Figure 6c), shows that the current density slowly decreases over three hours. The two ORR polarization curves recorded before and after CA testing are different, showing the same ORR onset potential, but the shift of the half-wave potential for 0.04 mV towards more negative values. This means that the ORR activity of Rh(poly) in an alkaline solution, although the highest of all, decreases over time, due to the changes in the Rh(poly) electrode surface. It is very likely that, similar to the ORR on Pd(poly) in alkaline solution [43], these changes can be ascribed to the onset of RhOH formation at lower potentials.
2.3. Comparison of the Catalytic Activity of Rh(poly) in Acidic and Alkaline Media
The catalytic activity of Rh(poly) in different media can be elucidated from the differences in the overpotentials for ORR in acid and alkaline solutions, which are calculated as the difference between the equilibrium and corresponding onset potential. The onset potentials for ORR are 0.85, 0.74, and 0.90 V in 0.1 M HClO4, 0.05 M H2SO4, and 0.1 M NaOH solutions, respectively. The ORR overpotential decreases in the order of 0.05 M H2SO4 > 0.1 M HClO4 > 0.1 M NaOH, meaning that the ORR activity decreases in the order of 0.1 M NaOH > 0.1 M HClO4 > 0.05 M H2SO4. Lower ORR activity in sulfuric acid compared to a perchloric acid solution is due to the specific adsorption of sulfuric anions, as already mentioned. The better catalytic activity in the alkaline solution is due to the specific adsorption of OH− anions and earlier onset of RhOH formation, which favors faster reaction kinetics. In all cases, the Rh(poly) electrode is active for hydrogen peroxide reduction, enabling the 4e-series ORR pathway, like on Pt(poly [36] and Pd(poly) [43].
Table 1 and Table 2 give the onset and half-wave potentials and Tafel slopes for ORR on Rh(poly) electrodes in different solutions at 1600 rpm.
To confirm the accuracy of the data in Table 1, the electrochemically active surface area (ECSA) of the used Rh(poly) electrode in three different solutions is reconsidered. ECSA can be calculated from the hydrogen adsorption or desorption peak as the charge passed during hydrogen adsorption assuming that one hydrogen atom can be adsorbed on a single Rh atom. This method assumes that the total charge passed between the adsorbing hydrogen and the Rh surface for polycrystalline Rh is 221 μC cm−2 [32]. The ECSA values are calculated from the ratio between the charge calculated for Rh(poly) in three solutions and the accepted value for Rh, considering that the electrode’s geometric area is 0.196 cm2. The charges calculated from the hydrogen desorption peaks for Rh(poly) in 0.1 M HClO4, 0.05 M H2SO4, and 0.1 M NaOH are 211, 220, and 234 µC/cm2, giving the ECSA values of 0.187, 0.196 and 0.207 cm2, respectively.
It should be pointed out that when current densities are given vs. ECSA, a negligible difference is obtained for ORR polarization curves, given that the values for the onset and half-wave potentials differ for 0.01 V compared to those presented in Table 1.
Figure 7 shows the voltammetric behavior of the Rh(poly) electrode and ORR polarization curves in different solutions and within the same potential limits. The differences in CV features (Figure 7a) and ORR polarization curves (Figure 7b) arise from the specific adsorption of different solution anions, including weakly adsorbed perchlorate, strongly adsorbed sulfate, and OH− anions. The specific adsorption/desorption of solution anions affect the beginning of RhOH formation, which coincides with the activation and mixed control regions for ORR in anodic and cathodic directions, respectively. At lower potentials where Rh is oxide-free, the reaction is diffusion-controlled.
Although the oxide formation/reduction peaks are quite similar in the two acid solutions, the ORR proceeds differently. Strongly adsorbed sulfate anions significantly hinder the ORR, while weakly adsorbed perchlorate anions do not affect the reaction. In an alkaline medium, an excessive amount of specifically adsorbed OH− species and subsequent RhOH formation over a wider potential range contribute to the increased ORR activity concerning both the low ORR overpotential and the 4e-series reaction pathway.
The impact of specifically adsorbed solution ions on the ORR activity of Pt single crystals [42,44,46,47] and polycrystalline platinum [36] in acidic media is well documented. For example, ClO4- anions adsorb weakly on Pt single crystal surfaces and have no significant influence on their intrinsic ORR activity. In contrast, strongly adsorbed sulfate anions block the active sites on the surface and lead to hindered ORR kinetics on Pt(poly). In contrast to Rh(poly), Pt is more active for ORR in an acidic medium than in an alkaline medium. The strongly adsorbed OH− anions on the Pt electrode surface [44], as well as on Pt/GC [48], have an inhibiting effect on the ORR kinetics in alkaline solution [44], blocking sites for electron transfer to O2. In contrast to platinum, the higher ORR activity of Rh in an alkaline solution than in an acid solution can be attributed to the weaker adsorption of OHads and Oads on Rh than on Pt [49]. This is also the case with the Au(100) surface, where OHads contribute to the improved ORR activity in alkaline solution and participate as an intermediate in the following steps [50]:
HO2− + H2O + e− = 2OH− + *OHads
*OHads + e− = OH−
In addition, the electrochemical behavior of Rh(poly) in an acid solution containing chloride anions that adsorb even stronger than sulfate anions is preliminary observed in 0.1 M HCl solution. As expected, the ORR is hindered even more than in sulfuric acid, without hysteresis between cathodic and anodic directions. However, an in-depth analysis requires a separate comprehensive investigation.
2.4. Comparison of the ORR Activity of Rh(poly) with Rh-Based Catalysts
In recent years, Rh-based nanoscale functional materials with different nanostructures and optimized compositions have attracted attention as efficient ORR catalysts. Table 3 provides an overview of the ORR activity of various Rh-based catalysts concerning the onset and half-wave potentials, and the Tafel slopes.
A catalyst consisting of Rh atomically dispersed on nitrogen-doped graphene (Rh@NG) obtained by a facile pyrolysis method shows good ORR activity and better ORR stability than commercial Pt/C in both acid and alkaline solutions [22]. Three types of Rh nanoparticles were synthesized: nanoshells, nanoframes, and porous nanoplates, and the relationship between their morphology and the ORR activity in an acid solution was examined [23]. Nanoshell-structured Rh NPs demonstrated the highest ORR activity, exceeding that of a commercial Rh/C (5 wt%) electrocatalyst.
The electrocatalyst, obtained by synthesis of ultra-fine Rh selenide nanoparticles deposited on carbon black (Rh3Se4/C), has shown high activity towards ORR in an alkaline medium, even better than a commercial Pt/C [51]. A hybrid consisting of Rh nanoparticles and a reduced graphene oxide (Rh@rGO) prepared by in situ electrodeposition on a glassy carbon (GC) substrate has shown outstanding ORR activity in alkaline solutions [52]. Rh−Sn nanoparticles (Rh3Sn1/C), obtained by a simple surfactant-free microwave-assisted synthesis, have shown good performance as an active and stable catalyst for oxygen reduction [53].
The synthesis of various Rh-based catalysts for ORR aims to save the amount of Rh used and surpass the activity of bare Rh. A closer look at the ORR activity of Rh-based catalysts concerning the onset potentials and the Tafel slope suggests the realization of this goal in some cases. However, there is still room for improvement.
The findings presented in this work show that the oxidation state and anion-specific adsorption play an essential role in determining the activity of Rh toward ORR. Understanding these effects can help to develop more effective and efficient Rh-based catalysts.
3. Materials and Methods
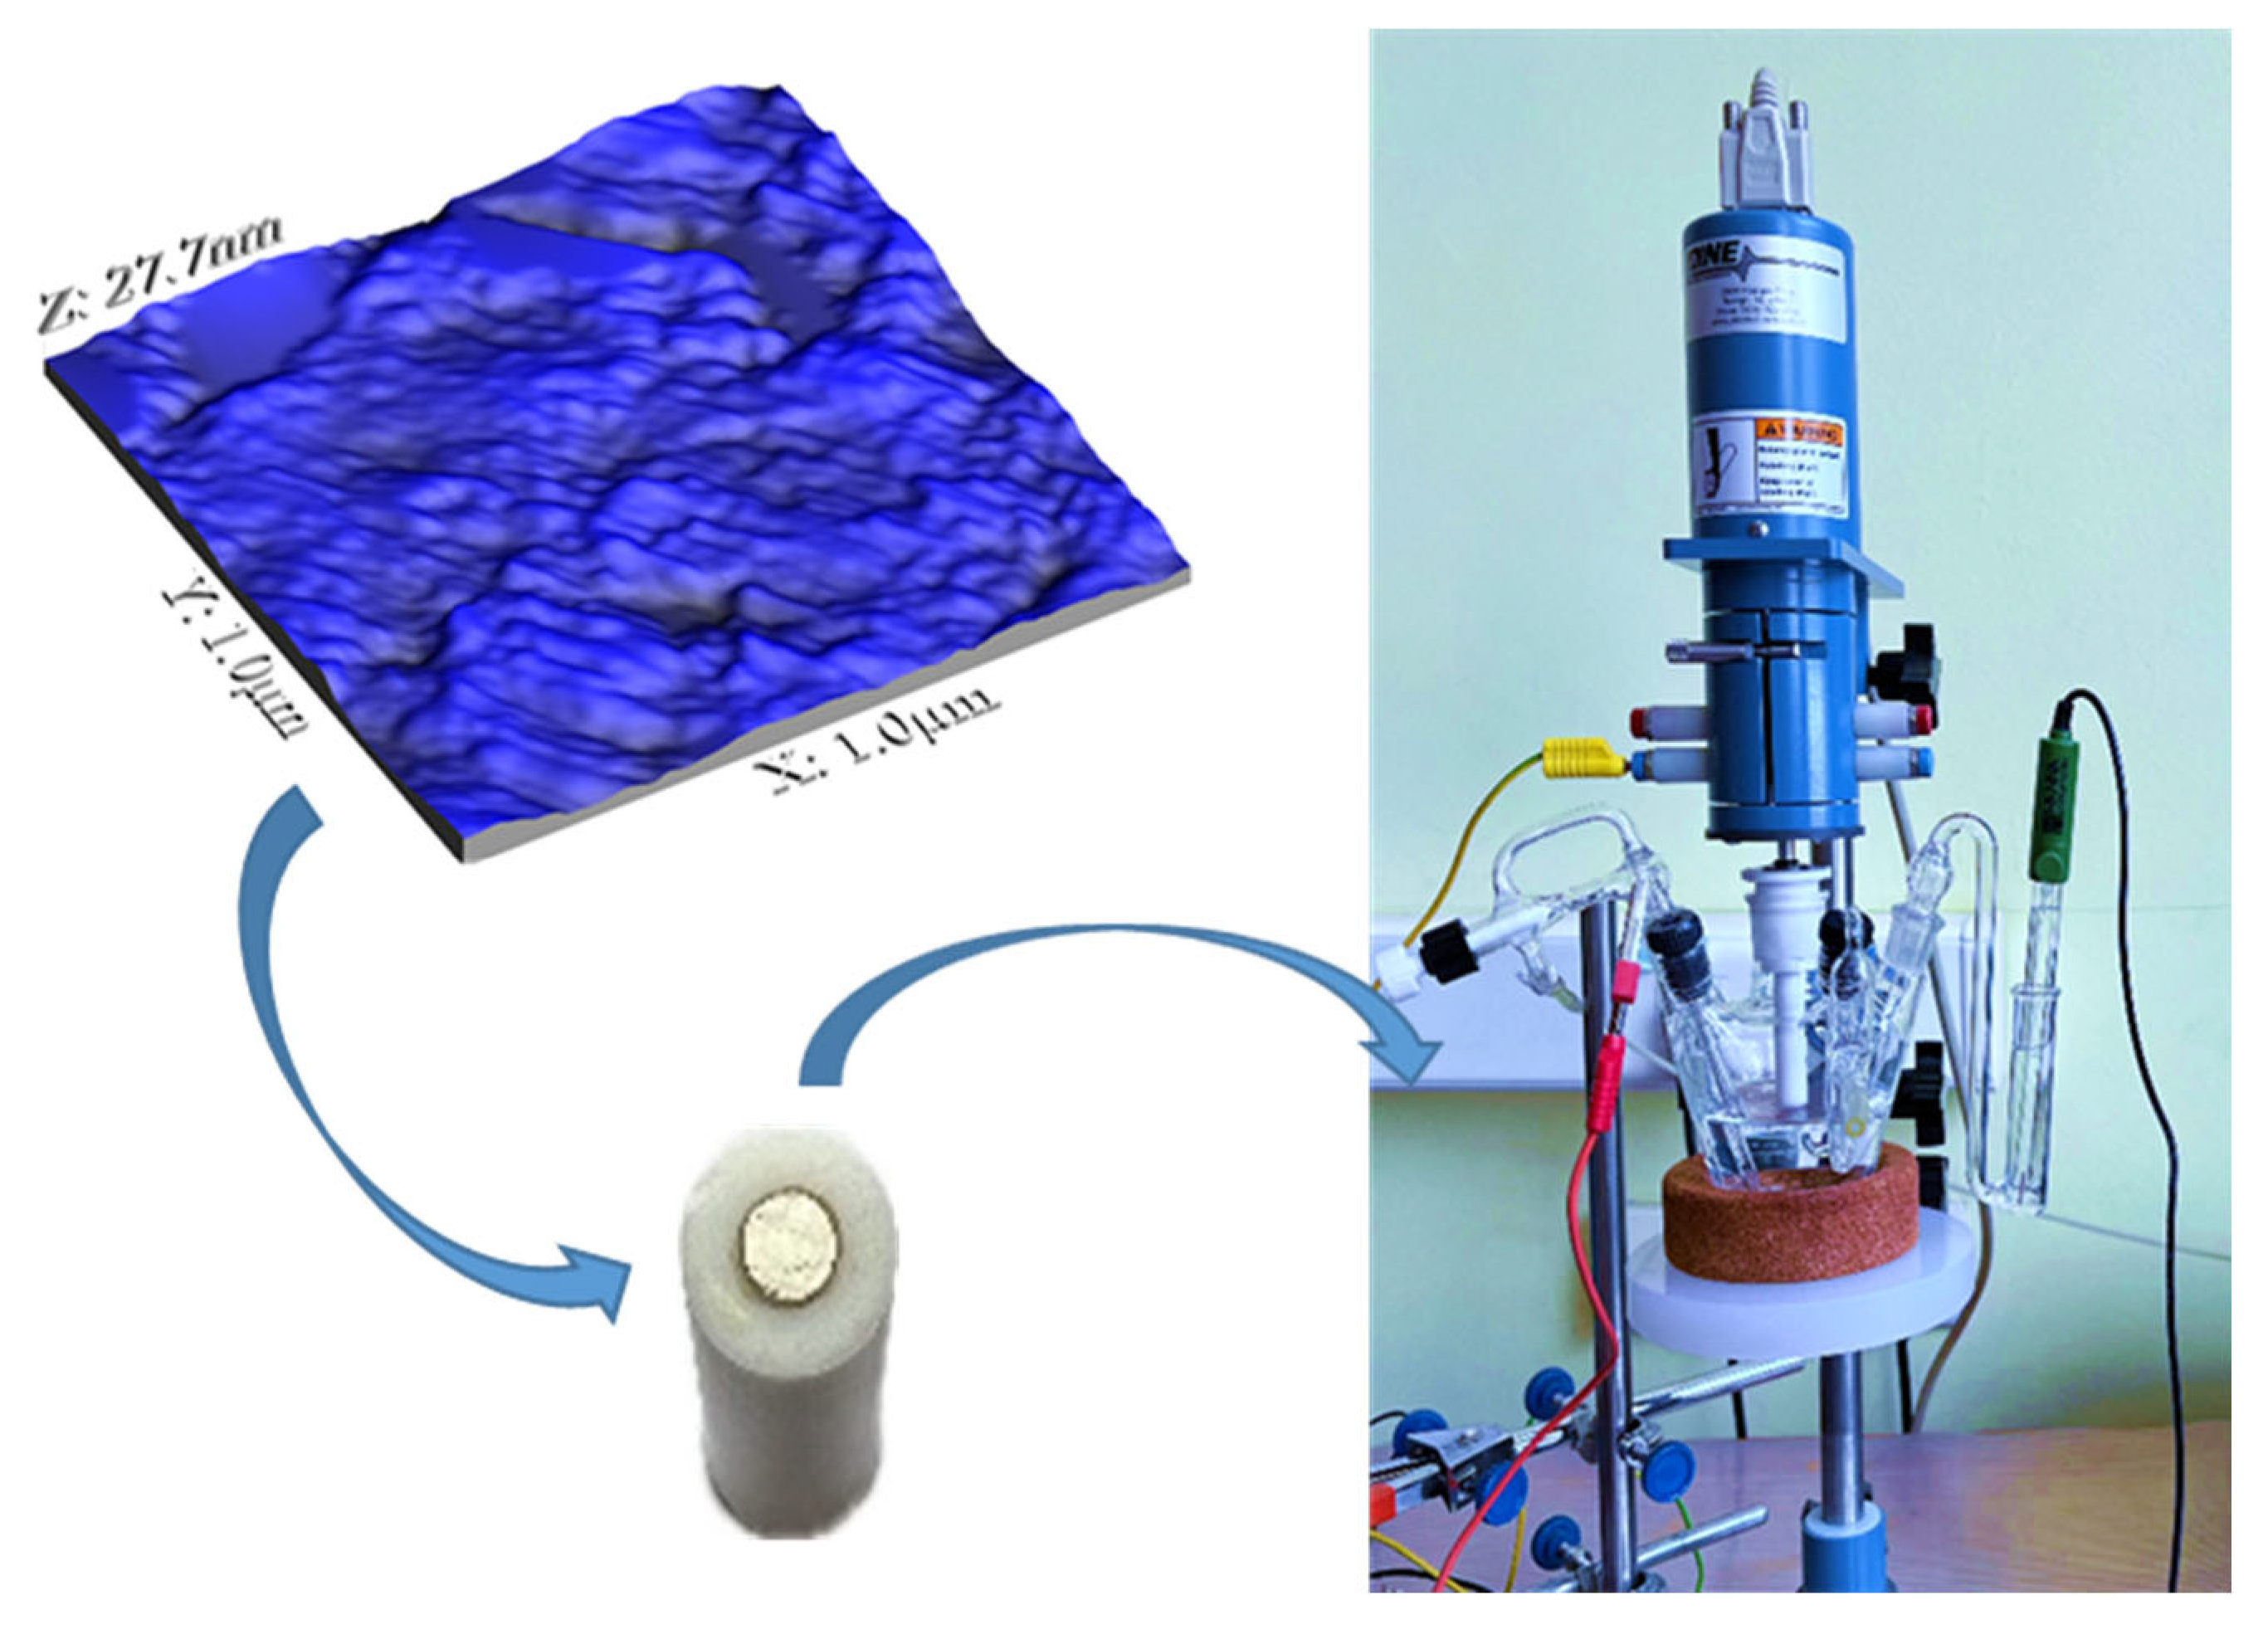
A commercial polycrystalline rhodium electrode, 5 mm in diameter, 0.196 cm2 geometric area (MaTech, Jülich, Germany), was used as a working electrode. Before each measurement, the electrode was mechanically polished using alumina powder with 1 μm, 0.3 μm, and 0.05 μm particle size, rinsed with Milli-Q water, and cleaned in an ultrasonic Milli-Q water bath. The polished Rh(poly) electrode was characterized using atomic force microscopy (AFM). The imaging was performed using Multimode SPM (Veeco Instruments, Inc., Munich, Germany). The electrode was mounted into a homemade Teflon holder fitting the shaft and an MSR Rotator (PINE Research Instrumentation, Inc., Durham, NC, USA) for electrochemical measurements. Scheme 1 presents the 3D AFM image of the Rh(poly) surface and the RDE experimental setup. AFM image reveals a rhodium surface consisting of many crystallites resulting in an average surface roughness of 2.9 nm.
Measurements were conducted using a PINE potentiostat in a three-electrode cell, with Rh(poly) as the working electrode, Pt wire as the counter, and Ag/AgCl, 3 M KCl as a reference electrode. The electrode potentials were converted vs. the reversible hydrogen electrode (RHE) using the Nernst equation:
ERHE = EAg/AgCl, 3M KCl + E0Ag/AgCl, 3M KCl + RT/zF ∙ pH
Here, EAg/AgCl, 3M KCl is the measured potential, E0Ag/AgCl, 3M KCl is the standard potential of the Ag/AgCl, 3M KCl electrode, and RT/zF is 0.0592 V. The recalculated potentials for different pH values are E = EAg/AgCl, 3M KCl + 0.274 V, E = EAg/AgCl, 3M KCl + 0.268 V, and E = EAg/AgCl, 3M KCl + 0.979 V, for 0.1 M HClO4 (pH 1.1), 0.05 M H2SO4 (pH 1), and 0.1 M NaOH (pH 13), respectively.
The electrochemical characterization of Rh(poly) involved cyclic voltammetry in oxygen-free 0.1 M HClO4, 0.05 M H2SO4, and 0.1 M NaOH solutions. ORR performance studies involved LSV measurements in the oxygen-saturated solutions. HPRR/HPOR activity measurements involved LSV in oxygen-free basic solutions with 5 mM H2O2. Chronoamperometry was used for Rh(poly) stability measurements during ORR. The measurements were performed in oxygen-saturated solutions at a constant applied potential chosen in the range of low ORR current densities for 3 h, and at a permanent electrode rotation at 1600 rpm.
Supra pure H2SO4, HClO4, 30% H2O2, and NaOH pellets, purchased from Merck, Darmstadt, Germany, and Milli-Q water were used for solution preparation. The solutions were deaerated by N2 (99.9995%) or saturated by O2 (99.9995%), purchased from Messer, Frankfurt, Germany.
4. Conclusions
Oxygen reduction reaction on Rh(poly) proceeds via a four-electron pathway in acid and alkaline solutions. The degree of surface oxidation plays a crucial role in the activation and mixed control region, while in the diffusion control region, it occurs on the Rh oxide-free surface.
The lowest ORR activity of Rh(poly) in sulfate solution stems from the effect of strongly adsorbed sulfate ions, while weakly adsorbed perchlorate ions do not significantly affect the kinetics. The highest ORR activity in an alkaline solution arises from the strong impact of the specifically adsorbed OH− anions.
Author Contributions
Conceptualization, S.Š. and J.G.; investigation, J.G. and M.V.; writing—original draft preparation, J.G. and S.Š.; writing—review and editing, S.Š.; supervision, S.Š. All authors have read and agreed to the published version of the manuscript.
Funding
This research was funded by the Ministry of Science, Technological Development, and Innovation of the Republic of Serbia (Contract No: 451-03-66/2024-03/200026).
Data Availability Statement
Data are contained within the article.
Conflicts of Interest
The authors declare no conflicts of interest.
References
- Shao, M.; Chang, Q.; Dodelet, J.P.; Chenitz, R. Recent advances in electrocatalysts for the oxygen reduction reaction. Chem. Rev. 2016, 116, 3594–3657. [Google Scholar] [CrossRef]
- Xu, X.; Pan, Y.; Zhong, Y.; Ran, R.; Shao, Z. Ruddlesden-Popper perovskites in electrocatalysis. Mater. Horiz. 2020, 7, 2519–2565. [Google Scholar] [CrossRef]
- Zhang, X.; Xu, X.; Yao, S.; Hao, C.; Pan, C.; Xiang, X.; Tian, Z.Q.; Shen, P.K.; Shao, Z.; Jiang, S.P. Boosting electrocatalytic activity of single atom catalysts supported on nitrogen-doped carbon through N coordination environment engineering. Small 2022, 18, 2105329. [Google Scholar] [CrossRef] [PubMed]
- Nørskov, J.K.; Rossmeisl, J.; Logadottir, A.; Lindqvist, L.; Kitchin, J.R.; Bligaard, T.; Jónsson, H. Origin of the Overpotential for Oxygen Reduction at a Fuel-Cell Cathode. J. Phys. Chem. B 2004, 108, 17886–17892. [Google Scholar] [CrossRef]
- Li, L.; Shang, Y.; Zhu, Q.; Han, M.; Tu, X. Promises of engineering Rh-based nanostructures for advanced electrocatalysis. Int. J. Hydrogen Energy 2024, 51, 1313–1336. [Google Scholar] [CrossRef]
- Bai, J.; Han, S.-H.; Peng, R.-L.; Zeng, J.-H.; Jiang, J.X.; Chen, Y. Ultrathin rhodium oxide nanosheet nanoassemblies: Synthesis, morphological stability, and electrocatalytic application. ACS Appl. Mater. Interfaces 2017, 9, 17195–17200. [Google Scholar] [CrossRef] [PubMed]
- Kang, Y.-Q.; Xue, Q.; Zhao, Y.; Li, X.-F.; Jin, P.-J.; Chen, Y. Selective etching induced synthesis of hollow Rh nanospheres electrocatalyst for alcohol oxidation reactions. Small 2018, 14, 1801239. [Google Scholar] [CrossRef] [PubMed]
- Bai, J.; Xing, S.-H.; Zhu, Y.-Y.; Jiang, J.-X.; Zeng, J.-H.; Chen, Y. Polyallylamine-Rh nanosheet nanoassemblies−carbon nanotubes organic-inorganic nanohybrids: A electrocatalyst superior to Pt for the hydrogen evolution reaction. J. Power Sources 2018, 385, 32–38. [Google Scholar] [CrossRef]
- Akbayrak, M.; Önal, A.M. High durability and electrocatalytic activity toward hydrogen evolution reaction with ultralow rhodium loading on titania. J. Electrochem. Soc. 2020, 167, 156501. [Google Scholar] [CrossRef]
- Bhowmick, G.D.; Das, S.; Adhikary, K.; Ghangrekar, M.M.; Mitra, A. Using rhodium as a cathode catalyst for enhancing performance of microbial fuel cell. Int. J. Hydrogen Energy 2019, 44, 22218–22222. [Google Scholar] [CrossRef]
- Park, S.; Park, N.; Nallal, M.; Yusuf, M.; Park, S.; Lee, J.-M.; Park, K.H. Facile synthesis of nitrogen-doped carbon-supported rhodium–cobalt alloy electrocatalyst for oxygen reduction reaction. Processes 2022, 10, 2357. [Google Scholar] [CrossRef]
- Zelenay, P.; Horányi, G.; Rhee, C.K.; Wieckowski, A. Voltammetric and radioactive labeling studies of single crystal and polycrystalline rhodium electrodes in sulfate-containing electrolytes. J. Electroanal. Chem. 1991, 300, 499–519. [Google Scholar] [CrossRef]
- Rhee, C.K.; Wasberg, M.; Zelenay, P.; Wieckowski, A. Reduction of perchlorate on rhodium and its specificity to surface crystallographic orientation. Catal. Lett. 1991, 10, 149–164. [Google Scholar] [CrossRef]
- Xu, Q.; Linke, U.; Bujak, R.; Wandlowski, T. Preparation and electrochemical characterization of low-index rhodium single crystal electrodes in sulfuric acid. Electrochim. Acta 2009, 54, 5509–5521. [Google Scholar] [CrossRef]
- Štrbac, S.; Smiljanić, M.; Rakočević, Z. Spontaneously deposited Rh on Au(111) observed by AFM and XPS: Electrocatalysis of hydrogen evolution. J. Electrochem. Soc. 2016, 163, D3027–D3033. [Google Scholar] [CrossRef]
- Potgieter, M.; Parrondo, J.; Ramani, V.K.; Kriek, R.J. Evaluation of polycrystalline platinum and rhodium surfaces for the electro-oxidation of aqueous sulfur dioxide. Electrocatalysis 2016, 7, 50–59. [Google Scholar] [CrossRef]
- Łosiewicz, B.; Jurczakowski, R.; Lasia, A. Kinetics of hydrogen underpotential deposition at polycrystalline rhodium in acidic solutions. Electrochim. Acta 2011, 56, 5746–5753. [Google Scholar] [CrossRef]
- Jakšić, M.M.; Johansen, B.; Tunold, R. Electrochemical behavior of rhodium in alkaline and acidic solutions of heavy and regular water. Int. J. Hydrogen Energy 1994, 19, 35–51. [Google Scholar] [CrossRef]
- Karschin, A.; Katsounaros, I.; Klemm, S.O.; Meier, J.C.; Mayrhofer, K.J.J. Degradation of polycrystalline rhodium and rhodium nanoparticles. Electrochim. Acta 2012, 70, 355–359. [Google Scholar] [CrossRef]
- Martinović, J.; Šepa, D.; Vojnović, M.V.; Damjanović, A. Kinetics of electrochemical reduction of oxygen at rhodium. Electrochim. Acta 1988, 33, 1267–1272. [Google Scholar] [CrossRef]
- Šepa, D.; Vojnović, M.V.; Damjanović, A. Reaction intermediates as a controlling factor in the kinetics and mechanism of oxygen reduction at platinum electrodes. Electrochim. Acta 1981, 26, 781–793. [Google Scholar] [CrossRef]
- Guan, J.; Wen, X.; Zhang, Q.; Duan, Z. Atomic rhodium catalysts for hydrogen evolution and oxygen reduction reactions. Carbon 2020, 164, 121–128. [Google Scholar] [CrossRef]
- Hwang, G.S.; Shin, W.; Yim, G.; Choi, J.H.; Kim, Y.-K.; Jang, H.; Kim, Y.-R. Morphology- and composition-controlled silver-containing rhodium nanoparticles for the oxygen reduction reaction. Bull. Korean Chem. Soc. 2022, 43, 1240–1246. [Google Scholar] [CrossRef]
- Ziegelbauer, J.M.; Gatewood, D.; Gullá, A.F.; Guinel, M.J.-F.; Ernst, F.; Ramaker, D.E.; Mukherjee, S. Fundamental investigation of oxygen reduction reaction on rhodium sulfide-based chalcogenides. J. Phys. Chem. C 2009, 113, 6955–6968. [Google Scholar] [CrossRef]
- Łukaszewski, M.; Siwek, H.; Czerwinski, A. Electrochemical behavior of thin polycrystalline rhodium layers studied by cyclic voltammetry and quartz crystal microbalance. Electrochim. Acta 2007, 52, 4560–4565. [Google Scholar] [CrossRef]
- Woods, R. Hydrogen adsorption on platinum, iridium, and rhodium electrodes at reduced temperatures and the determination of real surface area. J. Electroanal. Chem. Interf. Electrochem. 1974, 49, 217–226. [Google Scholar] [CrossRef]
- Rand, D.A.J.; Woods, R. The nature of adsorbed oxygen on rhodium, palladium and gold electrodes. J. Electroanal. Chem. Interf. Electrochem. 1971, 31, 29–38. [Google Scholar] [CrossRef]
- Stonehart, P.; Kozlowska, H.A.; Conway, B.E. Potentiodynamic examination of electrode kinetics for electroactive adsorbed species: Applications to the reduction of noble metal surface oxides. Proc. Boy. Soc. A 1969, 310, 541–563. [Google Scholar]
- Oliveira, R.T.S.; Santos, M.C.; Bulhões, L.O.S.; Pereira, E.C. Rh electrodeposition on Pt in acidic medium: A study using cyclic voltammetry and an electrochemical quartz crystal microbalance. J. Electroanal. Chem. 2004, 569, 233–240. [Google Scholar] [CrossRef]
- Peuckert, M. A comparison of thermally and electrochemically prepared oxidation adlayers on rhodium: Chemical nature and thermal stability. Surf. Sci. 1984, 141, 500–514. [Google Scholar] [CrossRef]
- Villard, F.; Jerkiewicz, G. Comprehensive studies of formation and reduction of surface oxides at rhodium electrodes at 298 K. Can. J. Chem. 1997, 75, 1656–1665. [Google Scholar] [CrossRef]
- Pallotta, C.; de Tacconi, N.R.; Arvia, A.J. Potentiodynamic behavior of the rhodium/H2SO4(aq) interface in the potential range of the hydrogen and oxygen electrosorption. Electrochim. Acta 1981, 26, 261–273. [Google Scholar]
- Florit, M.I.; Bolzán, A.E.; Arvia, A.J. Reactions involving H, OH and O species on rhodium in H2SO4·12H2O and HClO4·5.5H2O in the range 198–298 K. J. Electroanal. Chem. 1995, 394, 253–262. [Google Scholar] [CrossRef]
- Wasberg, M.; Horányi, G. The reversibility and overlapping of hydrogen and oxygen adsorption in the “double-layer” region of rhodized electrodes in H2SO4 solutions (the decomposition of water molecules on rhodium surfaces). J. Electroanal. Chem. 1995, 386, 213–219. [Google Scholar] [CrossRef]
- Vuković, M. Electrochemical investigation of an electrodeposited rhodium electrode in acid solutions. J. Electroanal. Chem. 1988, 242, 97–105. [Google Scholar] [CrossRef]
- Štrbac, S. The effect of pH on oxygen and hydrogen peroxide reduction on polycrystalline Pt electrode. Electrochim. Acta 2011, 56, 1597–1604. [Google Scholar] [CrossRef]
- Parajon Costa, B.; Giordano, M.C.; Pallotta, C.D.; Arvia, A.J. Voltammetry of polycrystalline rhodium in 1 M H2SO4 at different temperatures in the 0–65°C range. J. Electroanal. Chem. 1986, 199, 381–394. [Google Scholar] [CrossRef]
- Rakotondrainibe, A.; Beden, B.; Lamy, C. Investigation of the early stages of Hads and OHads adsorption on rhodium in alkaline medium Part I: Approaches from graphical treatments of cyclic voltammograms based on a langmuirian isotherm. J. Electroanal. Chem. 1994, 379, 455–465. [Google Scholar] [CrossRef]
- Cataldi, Z.; Lezna, R.O.; Giordano, M.C.; Arvia, A.J. Voltammetric study of polycrystalline rhodium in alkaline solutions at different temperatures. J. Electroanal. Chem. Interf. Electrochem. 1989, 261, 61–75. [Google Scholar] [CrossRef]
- Hoare, J.P. Oxygen. In Standard Potentials in Aqueous Solutions; Bard, A.J., Parsons, R., Jordan, J., Eds.; Marcel Dekker: New York, NY, USA, 1985; pp. 49–66. [Google Scholar]
- Wakabayashi, N.; Takeuchi, M.; Itagaki, M.; Uchida, H.; Watanabe, M. Temperature-dependence of oxygen reduction activity at a platinum electrode in an acidic electrolyte solution investigated with a channel flow double electrode. J. Electroanal. Chem. 2005, 574, 339–346. [Google Scholar] [CrossRef]
- Markovic, N.M.; Adzic, R.R.; Cahan, B.D.; Yeager, E.B. Structural effects in electrocatalysis: Oxygen reduction on platinum low index single-crystal surfaces in perchloric acid solutions. J. Electroanal. Chem. 1994, 377, 249–259. [Google Scholar] [CrossRef]
- Srejić, I.; Rakočević, Z.; Nenadović, M.; Štrbac, S. Oxygen reduction on polycrystalline palladium in acid and alkaline solutions: Topographical and chemical Pd surface changes. Electrochim. Acta 2015, 169, 22–31. [Google Scholar] [CrossRef]
- Gómez-Marín, A.M.; Feliu, J.M.; Ticianelli, E. Oxygen reduction on platinum surfaces in acid media: Experimental evidence of a CECE/DISP initial reaction path. ACS Catal. 2019, 9, 2238–2251. [Google Scholar] [CrossRef]
- Štrbac, S.; Adžić, R. Oxygen reduction on single crystal gold electrodes in acid solutions. J. Serb. Chem. Soc. 1992, 57, 835–848. [Google Scholar]
- Markovic, N.; Gasteiger, H.; Ross, P.N. Kinetics of oxygen reduction on Pt(hkl) electrodes: Implications for the crystallite size effect with supported Pt electrocatalysts. J. Electrochem. Soc. 1997, 144, 1591. [Google Scholar] [CrossRef]
- Li, M.F.; Liao, L.W.; Yuan, D.F.; Mei, D.; Chen, Y.-X. pH effect on oxygen reduction reaction at Pt(111) electrode. Electrochim. Acta 2013, 110, 780–789. [Google Scholar] [CrossRef]
- Golubović, J.; Rakočević, L.; Vasiljević Radović, D.; Štrbac, S. Improved oxygen reduction on GC-supported large-sized Pt nanoparticles by the addition of Pd. Catalysts 2022, 12, 968. [Google Scholar] [CrossRef]
- Kulkarni, A.; Siahrostami, S.; Patel, A.; Norskov, J.K. Understanding catalytic activity trends in the oxygen reduction reaction. Chem. Rev. 2018, 118, 2302–2312. [Google Scholar] [CrossRef] [PubMed]
- Štrbac, S.; Adžić, R.R. The influence of OH- chemisorption on the catalytic properties of gold single crystal surfaces for oxygen reduction in alkaline solutions. J. Electroanal. Chem. 1996, 403, 169–181. [Google Scholar] [CrossRef]
- Pan, S.; Yu, X.; Long, X.; Chang, C.; Yang, Z. Ultrafine rhodium selenides enable efficient oxygen reduction reaction catalysis. Sustain. Energy Fuels. 2021, 5, 6197–6201. [Google Scholar] [CrossRef]
- Sookhakian, M.; Tong, G.B.; Alias, Y. In-situ electrodeposition of rhodium nanoparticles anchored on reduced graphene oxide nanosheets as an efficient oxygen reduction electrocatalyst. Appl. Organometal. Chem. 2020, 34, e5370. [Google Scholar] [CrossRef]
- Ahn, M.; Cha, I.Y.; Cho, J.; Ham, H.C.; Sung, Y.-E.; Yoo, S.J. Rhodium-tin binary nanoparticle—A strategy to develop an alternative electrocatalyst for oxygen reduction. ACS Catal. 2017, 7, 5796–5801. [Google Scholar] [CrossRef]
Figure 1.
Cyclic voltammograms of Rh(poly) with the opening of the positive potential limit recorded in deaerated (a) 0.1 M HClO4, (b) 0.05 M H2SO4, and (c) 0.1 M NaOH solutions. The scan rate was 50 mV/s.
Figure 1.
Cyclic voltammograms of Rh(poly) with the opening of the positive potential limit recorded in deaerated (a) 0.1 M HClO4, (b) 0.05 M H2SO4, and (c) 0.1 M NaOH solutions. The scan rate was 50 mV/s.

Figure 2.
Oxygen reduction reaction in oxygen-saturated 0.1 M HClO4: (a) ORR polarization curves recorded with a scan rate of 50 mV s−1; (b) Tafel plot; (c) K–L plot in the cathodic direction; and (d) K–L plot in the anodic direction.
Figure 2.
Oxygen reduction reaction in oxygen-saturated 0.1 M HClO4: (a) ORR polarization curves recorded with a scan rate of 50 mV s−1; (b) Tafel plot; (c) K–L plot in the cathodic direction; and (d) K–L plot in the anodic direction.

Figure 3.
Oxygen reduction reaction in 0.05 M H2SO4: (a) ORR polarization curves recorded with a scan rate of 50 mV s−1; (b) Tafel plot; (c) K–L plot in the cathodic direction; and (d) K–L plot in the anodic direction.
Figure 3.
Oxygen reduction reaction in 0.05 M H2SO4: (a) ORR polarization curves recorded with a scan rate of 50 mV s−1; (b) Tafel plot; (c) K–L plot in the cathodic direction; and (d) K–L plot in the anodic direction.

Figure 4.
Oxygen reduction reaction in 0.1 M NaOH: (a) ORR polarization curves recorded with a scan rate of 50 mV s−1; (b) Tafel plot; (c) K–L plot in the cathodic direction; and (d) K–L plot in the anodic direction.
Figure 4.
Oxygen reduction reaction in 0.1 M NaOH: (a) ORR polarization curves recorded with a scan rate of 50 mV s−1; (b) Tafel plot; (c) K–L plot in the cathodic direction; and (d) K–L plot in the anodic direction.

Figure 5.
Hydrogen peroxide reduction/oxidation on Rh(poly) in oxygen-free (a) 0.1 M HClO4 + 5 mM H2O2 and (b) comparison of HPRR and ORR; (c) 0.05 M H2SO4 + 5 mM H2O2 and (d) comparison of HPRR and ORR; (e) 0.1 M NaOH + 5 mM H2O2 and (f) comparison of HPRR and ORR. The scan rate was 50 mV s−1.
Figure 5.
Hydrogen peroxide reduction/oxidation on Rh(poly) in oxygen-free (a) 0.1 M HClO4 + 5 mM H2O2 and (b) comparison of HPRR and ORR; (c) 0.05 M H2SO4 + 5 mM H2O2 and (d) comparison of HPRR and ORR; (e) 0.1 M NaOH + 5 mM H2O2 and (f) comparison of HPRR and ORR. The scan rate was 50 mV s−1.
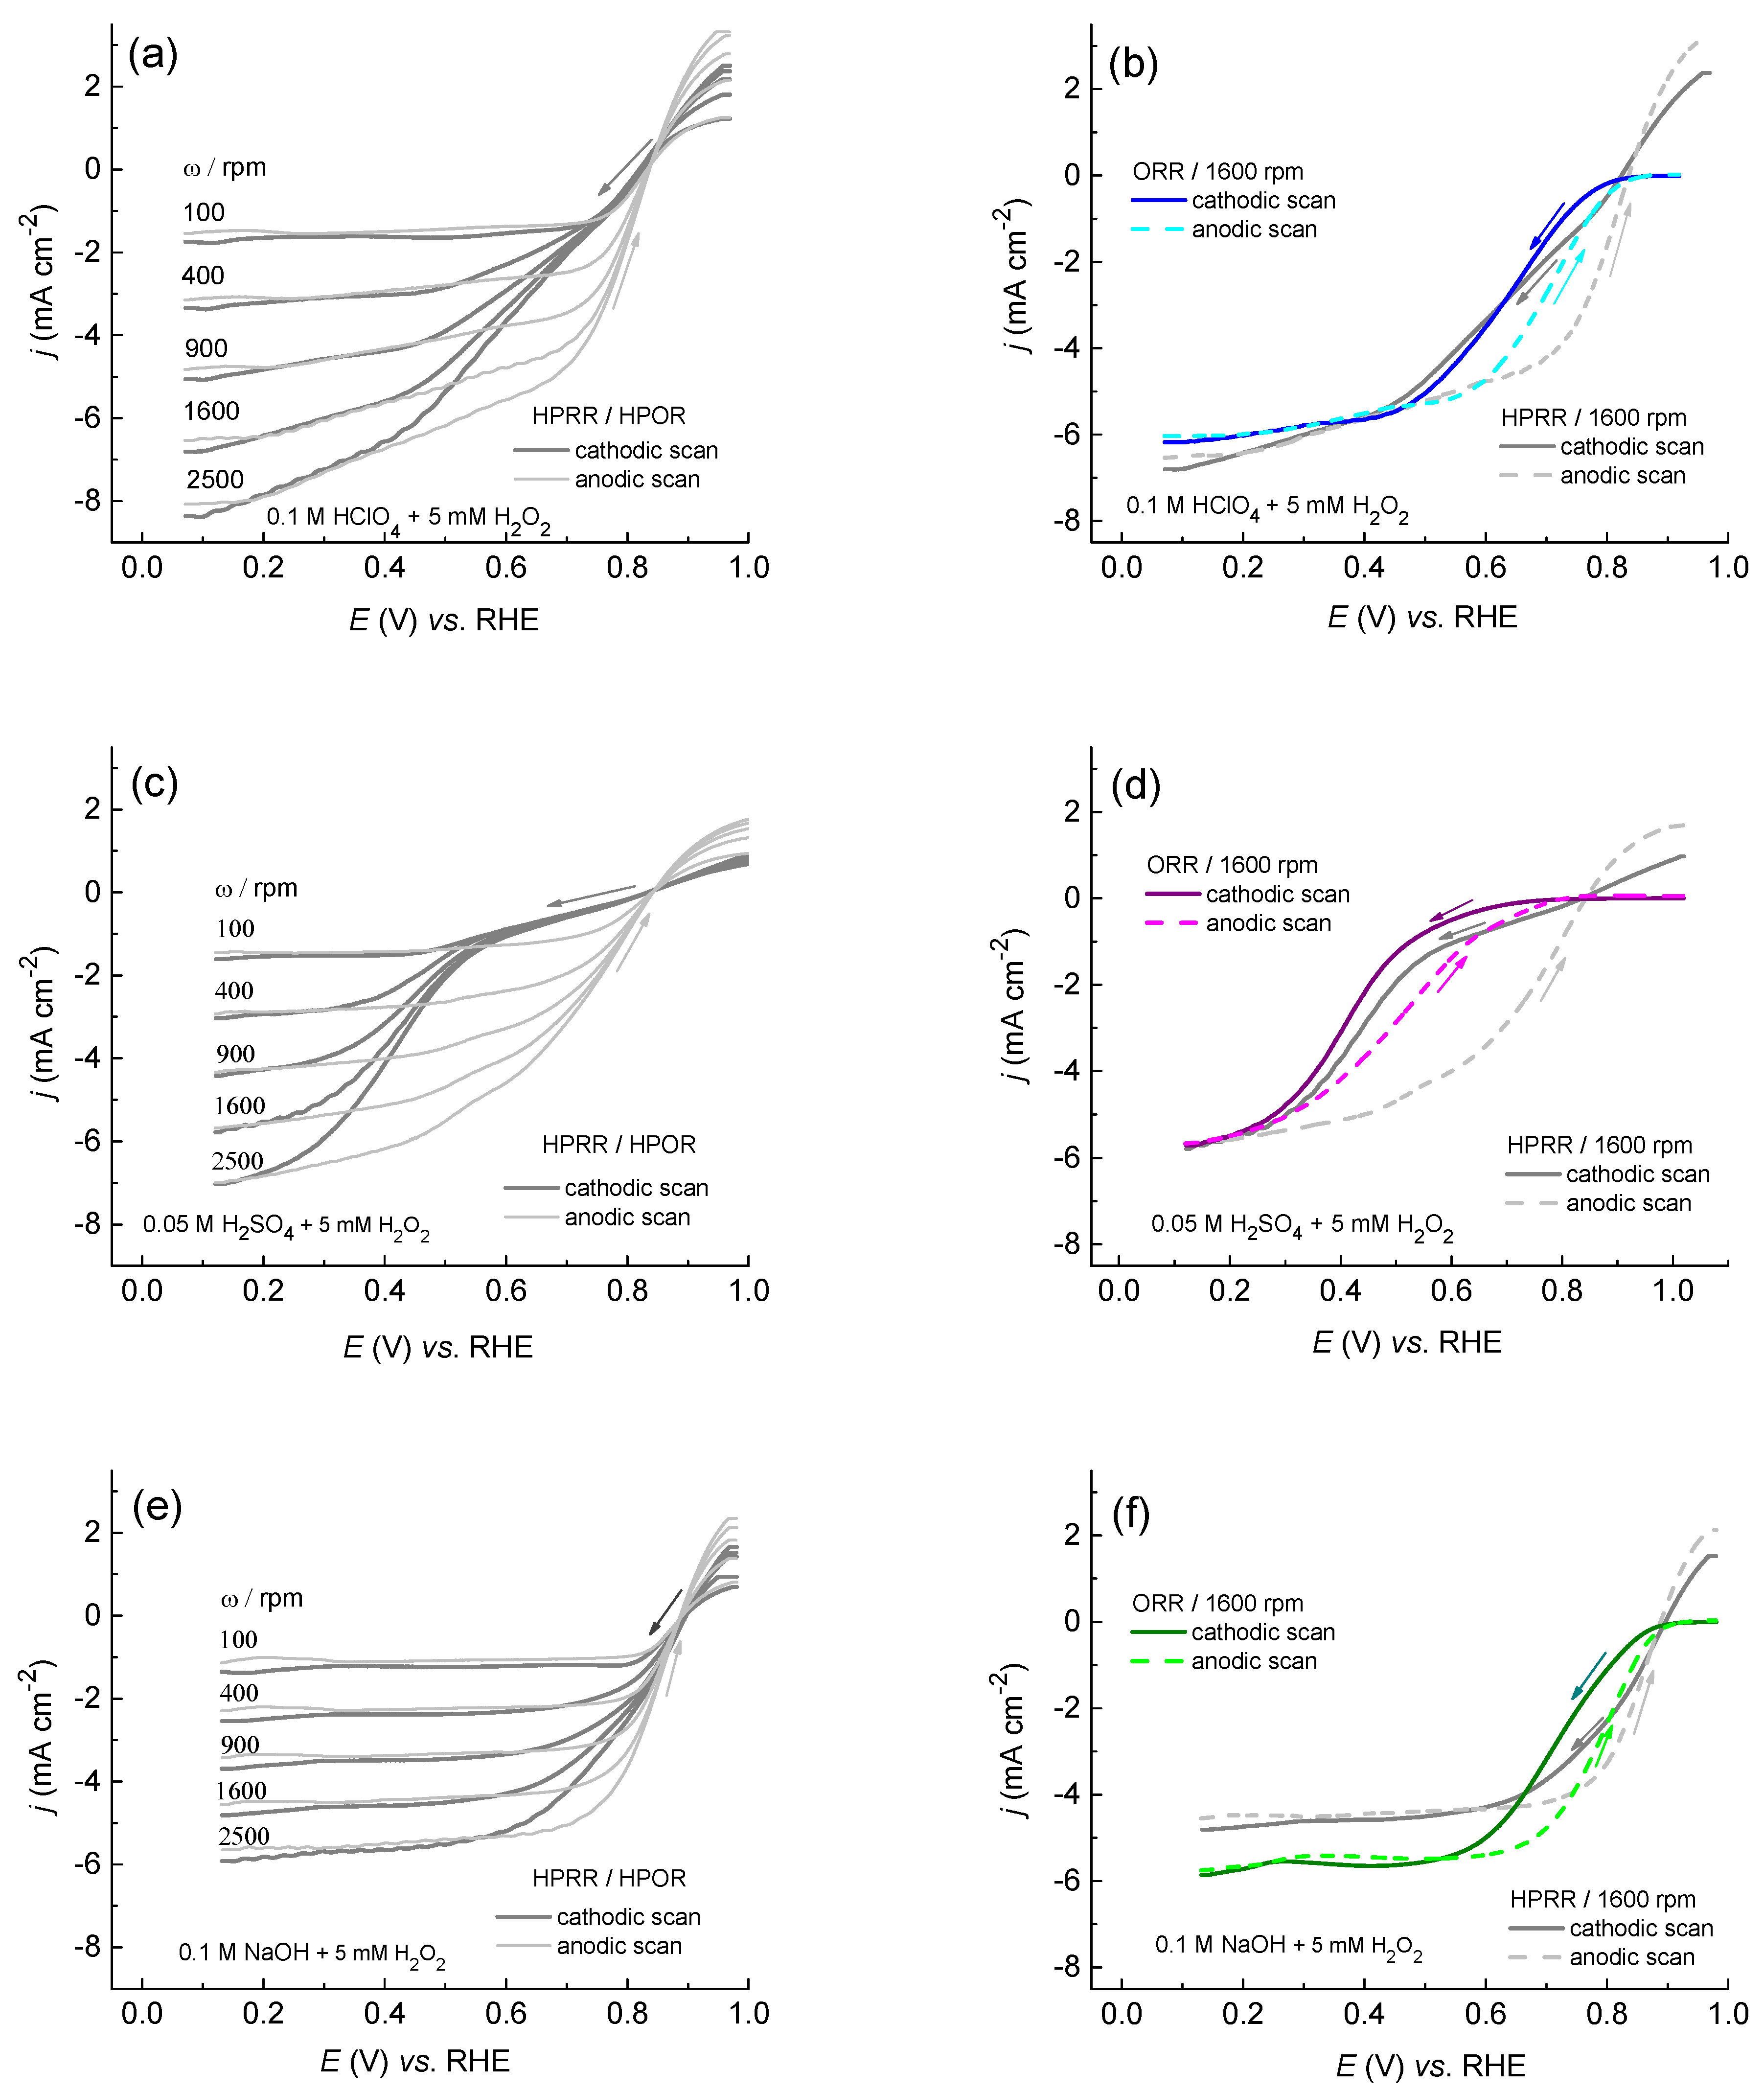
Figure 6.
CA curves for Rh(poly) during ORR in (a) 0.1 M HClO4, (b) 0.05 M H2SO4, and (c) 0.1 M NaOH. Insets show ORR polarization curves before and after CA measurements at 1600 rpm and a scan rate of 50 mVs−1. The applied potentials are indicated by a short line in the insets.
Figure 6.
CA curves for Rh(poly) during ORR in (a) 0.1 M HClO4, (b) 0.05 M H2SO4, and (c) 0.1 M NaOH. Insets show ORR polarization curves before and after CA measurements at 1600 rpm and a scan rate of 50 mVs−1. The applied potentials are indicated by a short line in the insets.


Figure 7.
Comparison of the electrochemical behavior of Rh(poly) electrode in different solutions: (a) cyclic voltammograms; and (b) polarization curves for ORR. The scan rate was 50 mV s−1.
Figure 7.
Comparison of the electrochemical behavior of Rh(poly) electrode in different solutions: (a) cyclic voltammograms; and (b) polarization curves for ORR. The scan rate was 50 mV s−1.


Scheme 1.
3D AFM image of the Rh(poly) surface, and the RDE experimental setup involving the photo of the Rh(poly) electrode mounted in a Teflon holder, a rotating disc assembly, and the electrochemical cell.
Scheme 1.
3D AFM image of the Rh(poly) surface, and the RDE experimental setup involving the photo of the Rh(poly) electrode mounted in a Teflon holder, a rotating disc assembly, and the electrochemical cell.

Table 1.
Onset and half-wave potentials, and Tafel slopes at low and high overpotentials for ORR on Rh(poly) in the cathodic direction.
Table 1.
Onset and half-wave potentials, and Tafel slopes at low and high overpotentials for ORR on Rh(poly) in the cathodic direction.
| Solution | Eonset (V) | E1/2 (V) | Tafel Slope (mV dec−1) at Low η | Tafel Slope (mV dec−1) at High η |
|---|---|---|---|---|
| 0.1 M HClO4 | 0.85 | 0.64 | 60 | 120 |
| 0.05 M H2SO4 | 0.74 | 0.42 | 80 | 200 |
| 0.1 M NaOH | 0.90 | 0.72 | 60 | 120 |
Table 2.
Onset and half-wave potentials, and Tafel slopes at low and high overpotentials for ORR on Rh(poly) in the anodic direction.
Table 2.
Onset and half-wave potentials, and Tafel slopes at low and high overpotentials for ORR on Rh(poly) in the anodic direction.
| Solution | Eonset (V) | E1/2 (V) | Tafel Slope (mV dec−1) at Low η | Tafel Slope (mV dec−1) at High η |
|---|---|---|---|---|
| 0.1 M HClO4 | 0.87 | 0.70 | 60 | 120 |
| 0.05 M H2SO4 | 0.82 | 0.51 | 70 | 180 |
| 0.1 M NaOH | 0.92 | 0.78 | 60 | 120 |
Table 3.
A comparison of the onset potential, half-wave potential, and Tafel slope for ORR on various Rh-based catalysts.
Table 3.
A comparison of the onset potential, half-wave potential, and Tafel slope for ORR on various Rh-based catalysts.
| Catalyst | Solution | Eonse (V) | E1/2 (V) | Tafel Slope (mV dec−1) | Reference |
|---|---|---|---|---|---|
| Rh@NG | 0.1 M HClO4 | 0.85 | 0.740 | - | [22] |
| Rh(poly) | 0.1 M HClO4 | 0.85 | 0.64 | 60 | This work |
| Rh/C (5 wt%) | 0.5 M H2SO4 | 0.75 | - | 119 | [23] |
| sRhNPs | 0.5 M H2SO4 | 0.79 | - | 68.3 | [23] |
| fRhNPs | 0.5 M H2SO4 | 0.70 | - | 89.5 | [23] |
| pRhNPs | 0.5 M H2SO4 | 0.70 | - | 82.2 | [23] |
| Rh(poly) | 0.05 M H2SO4 | 0.74 | 0.42 | 80 | This work |
| Rh@G | 0.1 M KOH | - | 0.737 | - | [22] |
| Rh@NG | 0.1 M KOH | - | 0.848 | - | [22] |
| Rh/C | 1 M KOH | 1.02 | 0.833 | 70 | [51] |
| Rh3Se4/C | 1 M KOH | 1.10 | 0.840 | 71 | [51] |
| Rh@rGO/GCE | 0.1 M KOH | 0.87 | - | - | [52] |
| Rh/C | 0.1 M KOH | 0.85 | 0.72 | 60 | [53] |
| Rh3Sn1/C | 0.1 M KOH | 0.90 | 0.84 | 43 | [53] |
| Rh(poly) | 0.1 M NaOH | 0.90 | 0.72 | 60 | This work |
Disclaimer/Publisher’s Note: The statements, opinions and data contained in all publications are solely those of the individual author(s) and contributor(s) and not of MDPI and/or the editor(s). MDPI and/or the editor(s) disclaim responsibility for any injury to people or property resulting from any ideas, methods, instructions or products referred to in the content. |
© 2024 by the authors. Licensee MDPI, Basel, Switzerland. This article is an open access article distributed under the terms and conditions of the Creative Commons Attribution (CC BY) license (https://creativecommons.org/licenses/by/4.0/).
Share and Cite
MDPI and ACS Style
Golubović, J.; Varničić, M.; Štrbac, S. Study of Oxygen Reduction Reaction on Polycrystalline Rhodium in Acidic and Alkaline Media. Catalysts 2024, 14, 327. https://doi.org/10.3390/catal14050327
AMA Style
Golubović J, Varničić M, Štrbac S. Study of Oxygen Reduction Reaction on Polycrystalline Rhodium in Acidic and Alkaline Media. Catalysts. 2024; 14(5):327. https://doi.org/10.3390/catal14050327
Chicago/Turabian StyleGolubović, Jelena, Miroslava Varničić, and Svetlana Štrbac. 2024. "Study of Oxygen Reduction Reaction on Polycrystalline Rhodium in Acidic and Alkaline Media" Catalysts 14, no. 5: 327. https://doi.org/10.3390/catal14050327
Note that from the first issue of 2016, this journal uses article numbers instead of page numbers. See further details here.