


Mechanism of Vegetation Greenness Change and Its Correlation with Terrestrial Water Storage in the Tarim River Basin
1
College of Grassland Science, Xinjiang Agricultural University, Urumqi 830052, China
2
College of Resources and Environment, Xinjiang Agricultural University, Urumqi 830052, China
3
State Key Laboratory of Desert and Oasis Ecology, Xinjiang Institute of Ecology and Geography, CAS, Urumqi 830011, China
*
Author to whom correspondence should be addressed.
Land 2024, 13(5), 712; https://doi.org/10.3390/land13050712
Submission received: 5 April 2024
/
Revised: 7 May 2024
/
Accepted: 15 May 2024
/
Published: 18 May 2024
(This article belongs to the Topic Advances in Multi-Scale Geographic Environmental Monitoring: Theory, Methodology and Applications)
Abstract
:The response of dryland vegetation to climate change is particularly sensitive in the context of global climate change. This paper analyzes the characteristics of spatial and temporal dynamics of vegetation cover in the Tarim River Basin, China, and its driving factors in order to investigate the response of vegetation growth to water storage changes in the basin. The Enhanced Vegetation Index (EVI), the GRACE gravity satellite, and meteorological data from 2002 to 2022 are used to decipher the characteristics of the response of water storage changes to vegetation changes, which is of great significance to the realization of regional ecological development and sustainable development. The results of the study show the following: (1) The vegetation in the Tarim River Basin has an overall increasing trend, which is mainly distributed in the Aksu Basin and the Weigangkuche River Basin and is spatially distributed in the form of a ring. (2) Vegetation distribution greatly improved during the 20-year study period, dominated by high-cover vegetation, with a change rate of 200.36%. Additionally, vegetation changes are centered on the watersheds and expand to the surrounding area, with a clear increase in vegetation in the Kumukuri Basin. Areas with a vegetation Hurst index of <0.5 account for 63.27% of the study area, and the areas with a continuous decrease were mainly located in the outer contour area of the Tarim River and Kumu Kuri Basins. (3) There are obvious spatial differences in the correlation between EVI and temperature and precipitation elements. The proportion of areas with positive correlation with temperature within the study area is 64.67%. EVI tends to be consistent with the direction of migration of the center of gravity of the population and GDP, and the areas with positive correlation between vegetation and terrestrial water reserves are mainly distributed in the northern slopes of the Kunlun Mountains, with an area proportion of about 50.513%. The Kumukuli Basin also shows significantly positive correlation.
1. Introduction
Vegetation is an important component of terrestrial ecosystems as well as a key hub linking soil, atmosphere, and water, especially in arid and semi-arid zones. Vegetation also plays a key role in wind and sand stabilization, soil and water conservation, and ecological stability maintenance [1], which is of great significance to the sustainable development of regional socioeconomics and ecology [2,3]. The Enhanced Vegetation Index (EVI) is an optimized vegetation measure that improves vegetation monitoring by decoupling the background signal of the vegetation canopy and reducing the atmospheric effect [4]. This index has been widely used in recent years in the monitoring of vegetation growth and cover changes. Compared with the Normalized Difference Vegetation Index (NDVI), the EVI is better able to weaken the influence of aerosol and sub-surface bedding to a certain extent, distinguish sparse vegetation, and reflect the growth change of luxuriant vegetation. As well, the EVI can improve the sensitivity of vegetation in high biotic areas and reduce the influence of soil background and atmosphere. Given its higher sensitivity and superiority in monitoring vegetation change, the EVI is currently being broadly applied in the study of grassland degradation and in the quantitative analysis of grassland resources [4,5,6].
Scholars in China and elsewhere have recently carried out extensive research on EVI data, including spatial changes in vegetation [7,8] and trends in vegetation evolution [9] as well as the driving factors behind these changes [10]. Depending on the topic, the research scale of these studies was global [11], area-limited [12,13], regional [9,14], or watershed-related [15,16]. Vegetation growth under the influence of climate change is often affected by multiple factors, with the main ones being water and heat conditions. Some studies have shown that when temperature increases at low latitudes, vegetation growth is inhibited, whereas when temperature increases at high latitudes, vegetation growth is promoted [17]. Furthermore, the feedback of vegetation to the combined effects of temperature and precipitation is more obvious than the effects of either temperature or precipitation alone.
Human activities are also a major factor affecting vegetation growth. Their intensification leads to changes in the structure and function of regional land use, thus affecting the environment for vegetation growth [18,19,20]. Under the driving force of climate and human activities, the response of vegetation changes to the two drivers demonstrates stark regional differences [21,22]. At present, most studies investigate the comprehensive influencing factors of the vegetation index [23] or conduct linear correlation analyses of the influencing factors [24,25]. Only a few studies have focused on the spatial expression of the influencing factors of the vegetation index, especially in arid areas with complex topography and geomorphology. In such areas, spatial expression is particularly important.
The Tarim River Basin (TRB) is the core area of the “Silk Road Economic Belt” in northwest China. The basin is located in the interior of the Central Asian continent and has a unique geomorphological pattern of “mountain–oasis–desert”, with vegetation changes that are highly sensitive to climate change. Due to the region’s ecological sensitivity, the present study has chosen the TRB as its target area, exploring the spatial and temporal evolution of vegetation changes over the past 20 years based on multi-source remote sensing data for temperature, precipitation, and terrestrial water storage. The study analyzes the response characteristics of vegetation EVI to climatic factors by using correlation analysis and significance testing. Additionally, we use the Hurst index to estimate the future evolution trend of vegetation indices and to gauge the sustainability of vegetation change in the context of climate change, with a view to providing theoretical references for ecological environment changes and sustainable development.
2. Materials and Methods
2.1. Overview of the Study Area
The Tarim River Basin is located in the southern part of Xinjiang (73°10′–94°05′ E, 34°55′–43°08′ N), in the hinterland of the Asia-Europe continent (Figure 1). Renowned as China’s largest inland river basin and as the central hub of the Silk Road Economic Belt initiative, the TRB has extremely complex geomorphological patterns, with mountains, plains, and deserts forming a typical mountain–oasis–desert system. The basin is bordered by the Tianshan Mountains to the north, the Kunlun Mountains to the south, and the Pamir Plateau to the west. It covers an area of about 102 × 104 square kilometers and accounts for approximately 61.82% of the total area of Xinjiang.
The high mountains bordering the TRB on three sides are interspersed with sub-basins, making the terrain generally higher in the south and west and lower in the north and east. Despite its relatively abundant natural resources, the basin has an extremely fragile ecological environment, with a climate that is classified as continental arid due to scarce precipitation and strong evaporation. There is a significant difference between daytime and nighttime temperatures in the study region, but the number of daily sunshine hours is high, making the area rich in light and heat resources. The average annual temperature in the TRB is 10.6 ℃, and the average annual precipitation is about 89.1 mm.
2.2. Data Sources
The land-use data for this study were adopted from the land-use dataset of the Sentinel-2 Land Cover Explorer introduced by Esri, with a data accuracy of 10 m. The data classifications include watershed, woodland, grassland, flooded vegetation, crops, shrubs, built-up area, bare ground, glaciers, and permanent snow and ice. The EVI data were obtained from NASA EOS/MODIS MOD13A1 (http://ladsweb.modaps.eosdis.nasa.gov/, accessed on 15 January 2024), with a spatial resolution of 1 km and a time span of 2002–2022. Temperature and precipitation data were obtained from the high-precision meteorological indicator raster data released by the National Tibetan Plateau Science Data Center, with a spatial resolution of 1 km. Terrestrial water storage data were obtained from GRACE RL06 data released by NASA based on the seasons of CSR, GFZ, and JPL, with a spatial resolution of 0.25° and a time span of 2002–2022. To maintain the integrity of spatial accuracy within the datasets and accommodate the scope of the study area, the data were processed utilizing cropping and resampling tools. This processing resulted in a consistent format of raster files, each precision-aligned to a 0.25° × 0.25° grid (Figure 2).
2.3. Research Methods and Modeling
2.3.1. Enhanced Vegetation Index
EVI is an optimized vegetation index with increased sensitivity to areas of high biomass and improved vegetation monitoring capabilities through decoupling of the vegetation canopy background signal and reduction of atmospheric effects. In this study, the EVI values of healthy vegetation varied between 0.2 and 0.8, as expressed in the following formula:
EVI = 2.5 × ((NIR − Red)/(NIR + 6R − 7.5Blue + 1))
2.3.2. Sen+ Mann-Kendall Trend Analysis
The Theil-Sen Median method is also known as the Sen slope estimation. Trend analysis is a method of predicting the trend of a variable over time by performing a linear regression analysis on it. The formula for slope can be written as
where β represents the slope of the meta-regression equation, xi, xj denotes the length of the time series of this dataset. When β > 0, the data analyzed for the respective image show an increasing trend; when β = 0, the data are essentially unchanged; and when β < 0, the data show a decreasing trend.
2.3.3. Mann–Kendall Significance Test
The M-K trend test is a non-parametric test proposed by Mann [26] to test for the presence of a trend in a dataset. It can detect monotonic trends in datasets, including linear and nonlinear trends, and does not require assumptions about the data distribution. The M-K test is widely used in research on trend testing for climate and hydrology [27,28,29,30].
The present paper analyzes the inter-annual trend of vegetation indices using the M-K trend test based on Python language. The principle of calculation is as follows: Assuming that the statistic S constructed by the M-K test is denoted when trend detection is performed on a dataset with time series X1,X2,…,Xn,
Sign( ) for
where n denotes the length of the time series of this dataset, xi is the observed value of the data at time i, and xj is the observed value of the data at time j.
When the distribution of S is approximately normal, the mean and variance are expressed as
where is the standard deviation.
The statistic Z of a normalized data set can be expressed as follows:
Also, the p-value of the statistic S can be calculated using the normal cumulative distribution function:
where denotes the cumulative distribution function of a standard normal variable. When the data significance level is p ≤ 0.05, the change in trend of the group in this time series is significant.
2.3.4. Correlation Analysis and Significance Test
The Pearson’s correlation coefficient is a statistical measure of the strength and direction of the linear relationship between two continuous variables. It takes values between −1 and 1 and can indicate whether the relationship between two variables is negative, uncorrelated, or positive. The Pearson’s formula is written as
where rxy is the correlation coefficient between the variables x and y; xij, yij are the variable values in year i and month j; and and are the mean values of the variables at each time scale, respectively.
2.3.5. Hurst Index
The Hurst index (H) is an effective method for quantitatively describing the self-similarity and long-range dependence of a time series [31,32], i.e., the extent to which past information affects the future; it can be used to determine future trends in the data.
H takes values from 0 to 1. When H = 0.5, the time series are random sequences that are independent of each other with finite variance; when 0.5 < H < 1, the time series changes are persistent, and future changes will be consistent with past trends; when 0 < H < 0.5, the time series is anti-persistent, i.e., past changes are unsustainable.
2.3.6. Gaussian Filter Smoothing
The smoothing algorithm of Gaussian filtering can effectively reduce the error generated by GRACE in the observation process. Applied to the spherical harmonic function, it can also reduce the interference generated by other geophysical signals. Selecting the appropriate smoothing radius of Gaussian filtering can reduce the error and noise pollution at the same time, without losing the effective information on the change of water storage or the more effective inversion of spatial and temporal changes of terrestrial water storage. The expanded expression for the spherical harmonic coefficient is
where N(θ, λ) represents the shape of the geoid, θ denotes the geocentric residual latitude, λ is the longitude, α indicates the mean radius of the Earth, Clm and Slm denote the fully specified spherical harmonic coefficients, l and m are the order and magnitude of the spherical harmonic coefficients, respectively, and lm(cos θ) is the normalized summed Legendre function.
The change in the geoid is expressed as ΔN(θ, λ), which can be expanded into a change in the spherical harmonic coefficient, as follows:
Based on the above equation, we can see that the change in the gravity field is due to the redistribution of the mass of the Earth system. This change can be expressed by the following equation:
where ρανe denotes the average density of the Earth, and Δρ(r, θ, λ) represents the change in the bulk density of matter.
The Earth’s mass change can be obtained from the gravity level. By calculating the change in mass, it can be directly converted to a change in equivalent water height:
3. Results
3.1. Characteristics of Vegetation Dynamics and Their Influencing Factors
3.1.1. Spatial Distribution of EVI
From 2002 to 2022, the vegetation cover of the TRB displayed spatial distribution characteristics of “high in the surrounding area, low in the middle, high in the northwest, and low in the southeast”. The spatial difference of the vegetation cover in the basin is significant because the cover was constrained by numerous driving factors, among which climate and human activities predominated. As shown in the spatial distribution of vegetation in 2022 (Figure 3), the medium and high vegetation cover in the basin region is distributed in the mountainous areas in the north and the plains in the center, while the low vegetation cover is mainly distributed at the edge of the mountainous areas and in the transition zones of the desert oases. The overall percentage of the area covered by each vegetation cover type is in the order of low vegetation cover > medium vegetation cover > high vegetation cover.
According to the changes in vegetation cover area in the TRB during the study period (Table 1), the vegetation index fluctuates and increases mainly in the low and medium vegetation cover, but the high vegetation cover shows a slight decreasing trend. Furthermore, the rate of change of the medium vegetation cover is 86.937%, and the increase in area (25,437 km2) only occurs from 2017 to 2022, on the heels of a slight decreasing trend. The low and medium vegetation cover showed a decreasing trend in 2002–2007, with decreasing areas of 9394 km2 and 139 km2 and change rates of 11.067% and 32.028%, respectively. The high vegetation cover had a higher change rate, but the overall fluctuation was not large.
The period of greatest change was 2007–2012, during which the low, medium, and high vegetation cover all showed an increasing trend. For the high vegetation cover, the rate of change was as high as 197.289%. For the medium and low vegetation cover, the change rate was smaller, but the amount of change was larger (13,203 km2 and 15,249 km2, respectively). For the period 2012–2017, the area of increase of medium vegetation cover was 6967 km2, which is an increase of 14.328% over 2012. For the period 2017–2022, the area of increase of vegetation cover mainly decreased. The reduction was especially obvious in the high vegetation cover, with a rate of change as high as 57.58%, while the area of medium and low vegetation cover decreased only slightly, showing reductions of 5280 km2 and 894 km2 and rates of change of 5.597% and 1.608%, respectively.
Figure 3 presents interannual trends for the TRB based on the vegetation index dataset. As can be seen in the figure, the overall variation range of the vegetation index is between 0.311 and 0.368. The multi-year average value of vegetation cover in the TRB from 2002 to 2022 is 0.346, with the smallest value (0.346) occurring in 2008. The average value of the vegetation cover reached its maximum value (0.368) in 2016. Moreover, the fluctuating and decreasing growth of EVI in the watershed during the study period, with an annual growth rate of 0.013/10a, indicates a slightly degrading trend of vegetation growth. The mean value of the vegetation index fluctuated from 2002 to 2015, except for the years 2002, 2005, 2007, and 2011, when the mean FVC values were at or above the multi-year mean line; the mean EVI values for the remaining years were below the multi-year mean line. After 2018, the vegetation cover showed an increasing trend compared with the previous 11 years. In general, the data indicate that the vegetation activity in the TRB over the past two decades has developed in the direction of enhancement, with ample room for improvement.
3.1.2. Characterization of the Spatial and Temporal Evolution of EVI
This study investigated the natural vegetation changes in the Tarim River Basin by comparing and analyzing the characteristics of natural vegetation EVI from 2002 to 2022. The spatial distribution of natural vegetation EVI in the study area is characterized as being “high in the surrounding area, low in the middle, high in the northwest, and low in the southeast”. The spatial distribution characteristics of natural vegetation EVI are divided into the following five classes: 0 < EVI ≤ 0.1, 0 < EVI ≤ 0.2, 0.2 < EVI ≤ 0.4, 0.4 < EVI ≤ 0.6, 0.6 < EVI ≤ 0.8, and 0.8 < EVI ≤ 1.
Natural vegetation is mainly concentrated in the northern edge of the TRB, including in the Yarkant River Basin (Figure 4a–e). Because desert comprises the central part of the study region and is the main geomorphological type, vegetation is relatively scarce. However, the vegetation in the middle and high value zones of the Tarim’s mainstream and tributaries have luxuriant growth. Moreover, there is a marked change in the growth status of the natural vegetation after 2012, showing a significant increase. The transformation type is mainly from low value zones to middle and high value zones, and the transformation area is concentrated around the Tarim’s mainstream.
Figure 4f illustrates that the growth area of natural vegetation is significantly higher than the decrease area, and that the overall natural vegetation growth condition is improving, indicating that the status quo of ecological environment degradation has been alleviated. As shown, the 0 < EVI ≤ 0.2 area is the most widely distributed level of natural vegetation in the study region. It displays a fluctuating decreasing trend (i.e., initial decrease followed by an increase). The decreasing area of 2.13 × 10⁴ km is mainly transformed to a high value area, at a rate of change of 1.79% (Table 2). The 0.2 < EVI ≤ 0.4 area also has a wide distribution of vegetation, with EVI > 0.2 indicating healthy natural vegetation. It also shows a fluctuating growth trend. The total area in 2022 of this part of the study region was 8.91×10⁴ km, and the rate of change was 4.91%.
The 0.4 < EVI ≤ 0.6 area is mainly distributed in the upper reaches of the Kaidu River, the lower reaches of the Weigan River, Bosten Lake, and the lower reaches of the Aksu River. This vast stretch of the TRB showed a clustered vegetation distribution that increased significantly, with a change rate of 78.19% during the 20-year study period. The largest increase in area (5.01 × 10⁴ km) occurred in 2017, with a rate of increase of 0.108 × 10⁴ km/a. Most significantly, the 0.6 < EVI ≤ 0.8 area has the highest rate of change during the study period (200.36%). However, the overall distribution within this zone is relatively small and sporadically distributed in the upper reaches of the Kaidu River, the lower reaches of the Peacock River, the lower reaches of the Aksu River, and the upper reaches of the Yarkant River. Still, the area of this region increased markedly, indicating that the vegetation is shifting to a high vegetative covering. Finally, the 0.8 < EVI ≤ 1 area is sporadically distributed only in the northern edge of the TRB, with the area showing a slightly decreasing trend.
3.1.3. EVI Trends and Shift Analyses
From 2002 to 2022, there were frequent transformations and significant differences in the characteristics of the natural vegetation classes across the study region (Figure 5). The total transfer area (80,414 km2) was dominated by transformations between classes b, c, and d. Specifically, classes a and b were dominated by transfers out, classes b, c, and d were dominated by transfers in, class e did not have significant changes during the study period, and transformations occurred only between classes d and e.
Class a is the most widely distributed area in the TRB. It is also the location with the most transferred area, mainly converting to classes b (28,507 km2) and c (8320 km2). These sections of the study region are dominated by very sparse vegetation, and the distribution of the current status of land use is mostly underutilized land, with a transfer rate of 48.15%. It is worth noting that the transferred area of class a in 2022 is much lower than that in 2002. This change of situation also indicates improvements in the growing conditions of some natural vegetation in the study region.
Class b is mostly in the intertwined desert-oasis zone. The vegetation growth conditions in this type of area are generally poor, but due to the influence of irrigation and the abandonment of farmland to grass in some areas, the natural vegetation in these locations shows a growing trend. Class b is the second largest class in terms of area transferred during the study period, with a total area of 31,554 km2. The shifts from class b mainly occurred to classes a (9104 km2) and c (21,136 km2), at a conversion rate of 39.24%. Class b is primarily distributed in the Kaidu River Basin and the west, with sporadic distribution in the southeast, mainly in the upper reaches of the Kaidu, Aksu, and Yarkand rivers and the lower reaches of the Hotan River. The basin, at its center, shows diffuse growth in all directions, which also partially increases the Kumukuli Basin of the East Kunlun River.
Class c refers to locations with medium vegetation cover. In these places, vegetation growth is relatively stable and mostly transforms with class b, but the transformed area is much smaller than class b. Spatial distribution of class c along the middle reaches of the Yulongkash River and the upper reaches of the Yarkant River is sporadic, while in the upper reaches of the Kaidu River, class c sections are increasing.
Class d denotes a high-coverage area, with less area converted in the study region. In class d locations, the natural vegetation grows luxuriantly and is generally unaffected by climatic conditions. Its diversion is mainly to the medium-coverage area, at a diversion rate of 1.39%. The class e transfer-out area accounts for a relatively small percentage (0.13%) of the study region. It has sporadic distribution along the northern edge of the TRB.
Grade a denotes sections with very low vegetation cover. It is mainly located in the central portion of the study area and the Gobi desert and is characterized by scant precipitation. Grade a locations are affected by multiple factors, such as human activities and desertification, and show a decreasing trend in vegetation cover, with the area transferred out exceeding the area transferred in. Increases in grade a area mainly occur at the southern edge of the TRB and at the upper reaches of the Kaidu River.
Somewhat anomalous to the general trend of vegetation coverage in the TRB is the northern edge of the study region, which has rich vegetation. Thanks to good thermal and hydrological conditions, vegetation growth in this location is abundant, and transformations between vegetation classes are plentiful, trending to an overall favorable development.
In order to deeply understand the spatial trend of natural vegetation across all locations in the study region, the image-by-image trend of the vegetation index in the TRB was calculated using the Sen trend and combined with the M-K test to obtain a trend map of EVI. The spatial variation of vegetation EVI is shown in Figure 6. From the spatial trend, it can be seen that the improved area exceeds that of the degraded area, and that the improved area accounts for 84.13% of the TRB. Of this total, 45.70% exhibits a significant or highly significant increase, while 38.43% shows either an insignificant or a non-significant increase. Furthermore, the proportion of stable and unchanged area is 7.23%, the proportion of non-significantly decreasing area is 7.32%, and the proportion of significantly decreasing and very significantly decreasing area is 1.71%. Overall, the trend is one of increase in improved area across the entire basin.
Significantly and very significantly reduced area was mainly concentrated in the lower Tarim River, with sporadic distribution near the Yarkant River. Non-significantly reduced area was distributed throughout the TRB but was mainly located at its southern edge as well as along the lower reaches of the Tarim River and in the Weigangkuche River Basin. The area of very significant increase involved spreading distribution that was centered on the various sub-basins of the TRB, with less distribution in the outer contour area and the hinterland of the Taklamakan Desert and a wider distribution area in the Kumkuli Basin. Locations showing significant increase were adjacent to those showing very significant increase, with the area of expansion more evenly distributed and less distributed around the outer contour. Locations exhibiting non-significant increase were distributed throughout the study region.
In analyzing vegetation change trends for the northern slope of the Kunlun Mountains and the Kumukuli Basin, it can be seen that they are mainly on the rise. Specifically, the trends manifest as highly significant and significant increases in degradation that are sporadically distributed throughout the Kumukuli Basin.
3.2. Analysis of Vegetation Cover Drivers and Characterization of Future Changes in the TRB
3.2.1. Impact of Climate Change on EVI
Temperature is one of the main factors affecting the spatial distribution of terrestrial water storage. The correlation coefficients between EVI and temperature over the past 20 years were calculated based on the image metric scale, using year as the time unit. Significance tests were then performed to derive the spatial distribution of the correlation between EVI and air temperature in the TRB (Figure 7a). The results show that the response of EVI to temperature varies spatially and is correlated with temperature, with positive and negative correlations co-existing. Under controlled precipitation conditions, the correlation coefficients between EVI and air temperature ranged from −0.849 to 0.899, with an average correlation coefficient of 0.080. The locations where EVI was positively correlated with air temperature accounted for 64.67% of the total area of the TRB and were widely distributed throughout the region.
For the significance test, the apportioned area where the relevant distribution was significant comprised 4.97% of the study region. The significant positive correlation was mainly distributed in the Yarkant River Basin, where the significant positive correlation accounted for 6.54% of the positive correlation distribution area (p < 0.05) or 4.23% of the total area. Persistent extremely calorimetric conditions inhibited the expansion of vegetation cover and also indicated that heat is the main limiting factor for the growth of sparse vegetation. The location exhibiting negative correlation of air temperature accounted for 35.33% of the total area of the region. In addition, the natural vegetation in the hinterland of the Taklamakan Desert mainly showed a non-significant negative correlation with air temperature in the significance test. The distribution of locations with significant negative correlation was even less, accounting for only 2.11% of negatively correlated area (p < 0.05). With the rise in air temperature, there was an increase in potential evaporation, placing the growth and expansion of the sparse vegetation under duress.
Unlike temperature, precipitation had a significant influence on spatial differences in the positive and negative correlation distribution of the EVI response. These differences were also very geographically diverse (Figure 7b). The correlation coefficients between EVI and precipitation ranged from −0.869 to 0.893 under controlled temperature conditions. Locations with positive correlations between EVI and precipitation accounted for 48.50% of the total area of the study region and were mainly situated in the western part of the TRB, with sporadic distribution in the Bayinguoleng Mongol Autonomous Prefecture. Locations with negative correlations between EVI and precipitation accounted for 51.50% of the total area and were primarily situated in the eastern portion of the study region, indicating that the vegetation growth in this location is more affected by climate change and less by precipitation.
Under the significance test, the significant portions accounted for a relatively small amount (7.34%) of the total area, with significant positive correlations and significant negative correlations showing obvious spatial distribution. The significant positive correlations were mainly distributed in the Kumukuli Basin in a strip-like pattern and accounted for 4.02% (p < 0.05). This percentage indicates that the southwest portion of the study region has restricted vegetation growth due to the decrease in precipitation, whereas greater amounts of precipitation would promote increases in sparse vegetation. The significant negative correlation (3.32%) (p < 0.05) may be due to the increase in surface evaporation caused by increases in temperature and the high consumption of water, both of which the precipitation amounts were insufficient to offset.
3.2.2. Impact of Human Activities on EVI
Based on the standard deviation ellipse center of gravity formula, we calculated the coordinates of the center of gravity of the vegetation index, population, and GDP of the TRB for 2002, 2007, 2012, 2017, and 2022, identifying both the location of the center of gravity and the direction of the transfer. The results are shown in Figure 8. Figure 8a depicts the migratory trend of the change of the center of gravity of the EVI, revealing that the whole of the EVI during the study period migrated from the northeast to the northwest. Further, we found that the center of gravity change ranges from 79.117° E–80.292° E to 39.053° N–39.562° N and that the center of gravity migration distance is 209.245 km. The migration trend occurs roughly over two phases: the first phase is 2002–2012, where the overall migration is to the southeast and the migration distance is shorter; the second phase is 2012–2022, with the majority of the migration occurring from east to west at a migration distance of 131.887 km. With the passage of time, the vegetation changes in the western part of the study region improved more than those in the eastern part.
More specifically, the center of gravity shifted from Moyu to Bachu County, passing through Awati County along the way, thus spanning three prefectures. The rotation angle of the standard deviation ellipse showed irregular changes from 2002 to 2022, with the rotation angle ranging from 79.057° to 85.258°. The smallest and largest rotation angles occurred in 2007 and 2017, respectively, and the direction of the rotation angle shifted in the opposite direction of the center of gravity migration trend. This shift suggests that the EVI is changing in the spatial and horizontal directions, indicating that the trend is enhanced in horizontal spatial directionality.
The trend of population center of gravity change is relatively uniform, mainly showing northeast to southwest migration. The center of gravity mainly occurs within Bachu County and ranges from 79.509° E–79.807° E to 39.305° N–39.5484° N, for a total migration distance of 41.117 km. The degree of offset in the direction of longitude is greater than that in latitude, indicating that the center of gravity of the study region population is more imbalanced in the former than in the latter. The rotation angle of the standard deviation ellipse shows regular changes, with the rotation angle gradually shifting from east to west. The migration of the center of gravity of GDP exhibits the characteristic of migrating from the southwest to the northeast, mainly towards Aksu (Figure 8d). In the direction of longitude, GDP migrates westward by 1.019°, while in the direction of latitude, it migrates southward by 0.411°.
The GDP migration trajectory changes twice during the study period, showing an overall migratory trajectory toward cities with high economic development. The majority of the economic development is primarily centered around Korla and Aksu, with a migration distance of 170.068 km and a migration rate of 8.5 km/a. The rotation angle of the GDP standard deviation ellipse exhibits regular changes throughout the study period, with the rotation angle ranging from 82.443° to 85.863°. The minimum and maximum rotation angles occur in 2002 and 2012, respectively. The year 2012 is the turning point for the standard deviation ellipse change.
The above results indicate that the EVI of the TRB is consistent with the migration direction of population and GDP. As the population increases and the economy grows at a rapid pace, the corresponding human-generated activities increase the demand for land, and the area of arable land increases, which in turn affects changes in vegetation structure. Furthermore, the migration of the center of gravity of the population is inseparable from the living environment and the economic development of the region, as the increase in population boosts the demand for arable land and various resources. Population rises also lead to changes in the local economic structure and the rapid development of urbanization, since the increase in the number of people in a region is also one of the reasons for the rapid development of the region’s economy. On the other hand, the migration of population and economic centers of gravity will change land use, which will have an impact on vegetation type, growth, and expansion.
3.2.3. Future Trends in Vegetation Cover Change in the TRB
The Hurst index can predict future development trends for certain time or spatio-temporal sequences. In this paper, the RS algorithm was used to calculate the Hurst index EVI for the TRB from 2002 to 2022 and to generate a spatial distribution map. Figure 9 visualizes whether the changes in the EVI for each vegetation type are persistent over the years. A Hurst index result greater than 0.5 indicates a positive continuation of future EVI change conditions, while a result less than 0.5 indicates reverse persistence. In terms of the proportion of spatial image elements of the Hurst index, 63.27% of the study region had results less than 0.5, and 36.73% had results greater than 0.5. These findings indicate that most of the locations of future vegetation changes showed reverse persistence. In other words, the future change trends for the EVI across the entire TRB were opposite to the trends that occurred over the past two decades, suggesting that improved area would be greater than degraded area.
In order to further study the future change trends for vegetation in the study region, the calculated Hurst index results were spatially superimposed on the Sen trend results to obtain the future trend map of the EVI (Figure 10). The outcomes were divided into five main categories: random change, inverse sustained decline, sustained decline, inverse sustained rise, and sustained rise. Among these, the anti-continuous decline was mainly distributed in the area north of the Tarim River mainstream and in the high mountainous area of the Yarkant River Basin, with sporadic distribution at the edge of the TRB accounting for a smaller proportion of 5.4%. Continuous decline was mostly distributed in the area north of the Tarim River mainstream, with a small amount distributed in Mongolia’s Bayin’guolengmeng Autonomous Prefecture, accounting for a proportion of 3.95%. The anti-continuous rise accounts for the largest proportion of the basin as a whole (57.87%) and is mainly concentrated in the hinterland of the Taklamakan Desert, the Yarkant River Basin, and the Bayin’guolengmeng Autonomous Prefecture. The persistent uplift portion is situated throughout the TRB, particularly around the Weigang Kucha River, forming a ring-like distribution in the center. This persistent uplift is second only to the persistent uplift in the future trend.
3.3. Relationships between Water Storage Changes and Vegetation in the TRB
3.3.1. Characterization of Spatial and Temporal Variations in Terrestrial Water Storage
The CSR and MANCON gravity field data were used to analyze the spatial distribution characteristics of the terrestrial water storage data in the TRB from 2002 to 2022 and to explore the spatial distribution of the regional water storage data and the process of change (Figure 10). The results highlight obvious differences in the spatial distribution of land water reserves on the northern slopes of the Kunlun Mountains, giving an overall deficit rate between −2.99 and 1.88 mm/a. Moreover, the surplus and deficit status of land water reserves in 2002 showed obvious distribution patterns. The surplus was mainly distributed in the northern portion of the Tarim River mainstream, while the deficit primarily appeared in the south. However, both of these land water reserves were evenly distributed in area, with 47.93% apportioned to the north and 52.07% to the south.
In 2007, the surplus and deficit of terrestrial water reserves were mainly distributed in the west and east of the study region, with some surplus in the southwest and a deficit in the Kumukuli Basin. At that time, the surplus status of terrestrial water reserves was increased from the original 47.93% to 55.73%. After 2007, a slight decreasing trend emerged, but the surplus status then showed an increasing trend until 2022, with the surplus rising from 0.77 to 29.03. For locations that were in the deficit status, there is an increase in the degree of deficit. The distribution of water reserves after 2007 gradually results in a stable state, with the surplus status mostly distributed in Bayin’guoleng Autonomous Prefecture. The southeast is the primary distribution area, where the northern slope of the Kunlun Mountains and the water reserves in the Kumukuli Basin all exhibit surpluses.
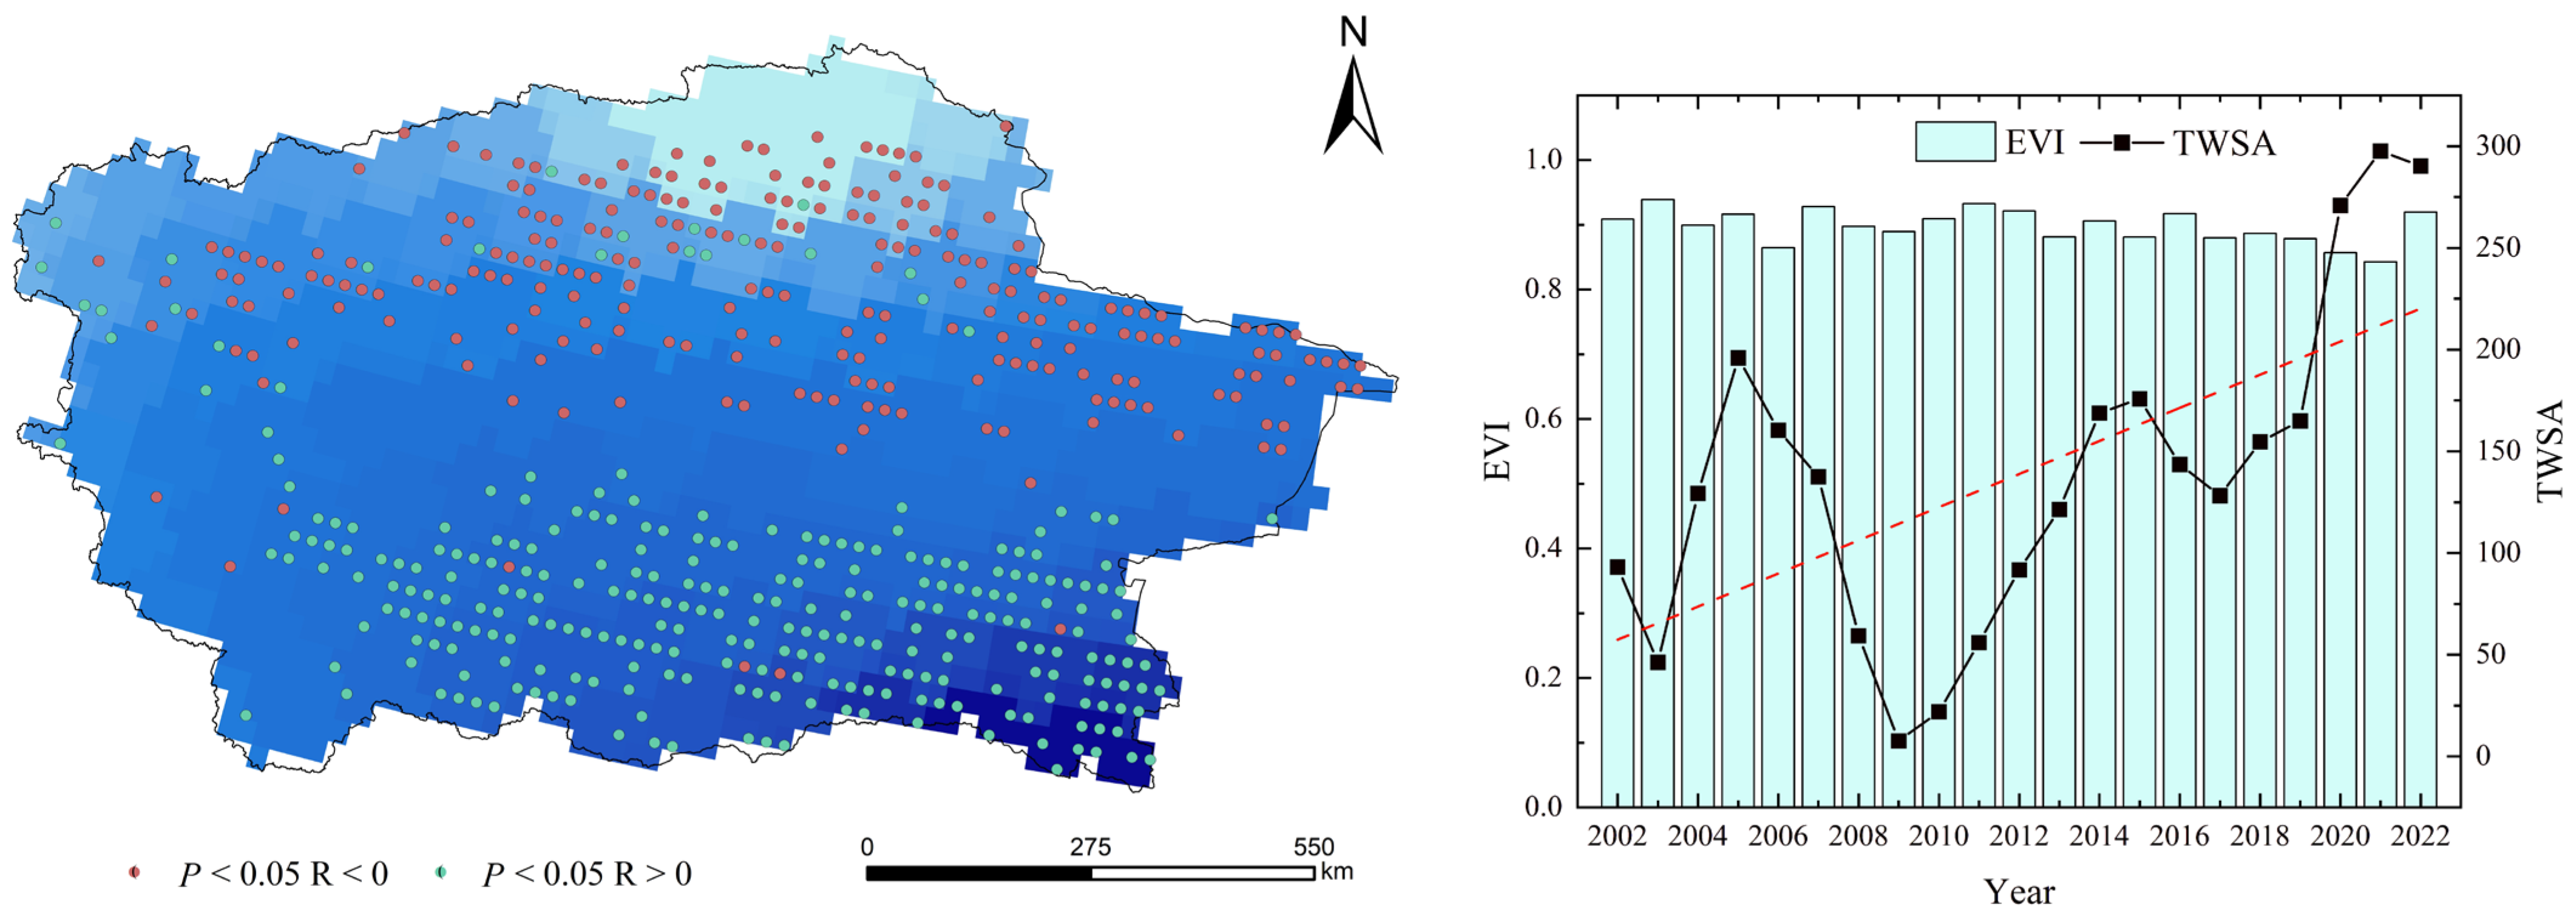
According to the line graph depicting water storage changes (Figure 11), terrestrial water storage shows a fluctuating upward trend from 2002 to 2022 at a range of −60.565~307.208 mm. Storage changes significantly after 2015, with the maximum value appearing in the summer of 2019. From the second half of 2019 to 2022, the overall water reserves show a surplus state, and the increasing trend is more obvious after 2011; the increasing trend tends to stabilize in 2020–2022. The overall change in land water reserves in the Kumkuli Basin is thus dominated by growth, with more years in surplus than in deficit. Under the influence of global changes, the Kumkuli Basin experienced a significant increase in the number and area of lakes during the study period due to a rise in temperature, accelerated glacier melting, and increased precipitation. All of these changes resulted in the recharging of terrestrial water reserves and a marked uptick in the change trend.
3.3.2. Response of Water Storage Changes to EVI
Hydrothermal conditions are important resources for the growth of vegetation, as changes in water resources also controls growth. The study analyzed the correlation and significance test between terrestrial water reserves and the EVI. However, because the spatial resolution of the terrestrial water reserves data is 0.25°, the correlation analysis was carried out after re-sampling the EVI data in order to ensure data accuracy.
Overall, the TWSA change process is not unlike the EVI change process, in that the change trends are similar and the interannual change characteristics are more consistent. As can be seen from Figure 12, the response of the TWSA to the EVI shows obvious spatial differences, with correlation coefficients ranging from −0.606 to 0.535. The locations with positive correlations between TWSA and EVI accounted for 50.513% of the total area and were mainly distributed in the southern and southwestern parts of the study region. The locations with negative correlations accounted for 49.487% of the total area.
The correlation coefficients were also tested for significance. We found that 30.57% of the correlation coefficients of the TWSA passed the test at the level of p < 0.05. Significantly the positive correlation area was mainly located in the southern part of the study region, namely in the Kriya and Hotan river basins as well as in the Kumkuri Basin, which suggests that the favorable conditions for water storage in these areas can promote vegetation growth. The TWSA is critical to the growth of vegetation in this location because of its complex topographic features, sparse rainfall, and dependence on groundwater and soil moisture.
Meanwhile, additional test results indicate that, in the context of global climate change, temperatures are beginning to rise. At the same time, soil moisture and groundwater will increase as the southern part of the TRB continues a melting trend of seasonal permafrost. The area of significant negative correlation is mainly concentrated in the northern portion of the study region, in the transition zone of desert oases and plains. The rapid urbanization process in the northern part of the TRB along with the strong disturbances caused by human activities have led to various degrees of shrinkage of the groundwater resources in the region. The result has been a decline in groundwater levels, the reclamation of arable land, and the increase in land use for construction purposes. Agriculture and construction consume a large amount of water resources, which is one of the reasons for the significant negative correlation between the TWSA and the EVI in this part of the study region.
4. Discussion
To analyze the spatial distribution characteristics of the vegetation index in the Tarim River Basin, the response of vegetation to climate and terrestrial water storage is further explored by integrating climatic factors, changes in terrestrial water storage, and human activities. The results of trend analysis and the significance test of the EVI showed an overall upward trend of gradual “greening”. Vegetation in the Kumukuli Basin increased significantly, which was basically consistent with Zhang Qifei’s [33] results. Furthermore, the vegetation in the watershed exhibited a spatial distribution characterized by “low in the middle and high in the surroundings”. There were some differences in the vegetation growth area and pattern in each location across the TRB, and the transformation of the vegetation index varied for each class. Overall, the complexity and diversity of vegetation and climate types in the study region led to differences in the numerical and spatial distributions of the effects of temperature and precipitation on the EVI of the vegetation.
With the frequent transformation between land-use types in the TRB [34], the intensity of water resources development increased, resulting in uneven distribution of water resources and problems such as water poverty in some parts of the region [35,36]. There was a significant increase in terrestrial water reserves in the Kumukuli Basin, but a significant decrease in the Weigangkuche River Basin. Considering the special geographic location and geomorphological topography of the study area, the accelerated urbanization in the northern part of the basin led to water scarcity as well as an imbalance in water use between the inhabitants and the ecology [37]. The implementation of projects such as the ecological water conveyance in the lower Tarim River has generally improved the vegetation cover and compensated for the adverse impacts of urban sprawl. The changes in terrestrial water storage have accordingly shifted from deficit to surplus.
Climate change and human activities are the main factors affecting changes in vegetation cover. The TRB has been vigorously promoting the construction of ecological civilization in recent years. The Tarim River Basin Comprehensive Management Plan prevents the expansion of desertification by rationally allocating water resources and guaranteeing water supply to vegetation in the lower reaches of the river; it also constructs ecological water transfer projects in the basin to improve the natural environment and gradually restore natural vegetation. Relevant studies show that cultivated land, grassland, and forest land in the lower reaches of the Tarim River all show an increasing trend after ecological water transfer, and unutilized land shows a decreasing trend. Meanwhile, the value of ecosystem services in the study area showed an increasing trend [38]. Due to the improved vegetation growth conditions after the water transfer, the area of woodland and grassland has increased significantly, with a 33.3% increase in the area of vegetation compared to the area before the water transfer [39].
Human activities will, to a certain extent, reduce the degree of vegetation response to climate change, but it has also been shown that among the main factors that affect vegetation, climate change is the main driver [40]. Warmer temperatures and increased precipitation generally positively contribute to vegetation. However, discussing the interrelationships between vegetation and climate change only considering a time series does not reflect their spatial differences well enough to directly express their relevance. Soil type and topography dominate the spatial distribution of vegetation cover in the study area, but soils and topography are more stable on their own and have a weaker influence on vegetation change. Therefore, this study relied on the correlation analysis model and significance test to explore the correlations between vegetation, climate, and terrestrial water storage. The results of the study have a certain degree of reliability.
Precipitation and temperature conditions are the most critical factors influencing the vegetation growth process. The study region is located in the inner part of the Asian-European continent, which has a temperate, arid continental climate and major spatial differences in temperature, precipitation, and vegetation cover. The increased temperature in the hinterland of the TRB shows notable inhibition of vegetation, while the oases and desert–oasis transition zones are gradually turning into better ecological environments with increased precipitation. In the Kunlun Mountains portion of the study region, precipitation is mainly in the form of snowfall, and its special geographical location and altitude are more conducive to the development of glaciers. With global climate change, temperatures are on the rise, and precipitation is increasing in winter and summer, causing water vapor to fall to the Kunlun Mountains in the form of solid precipitation. This, along with glacial meltwater, is the main reason for the increase in the amount of terrestrial water storage in the Kunlun Mountains and for the increase in vegetation cover in the Kumkuli Basin.
Our study employed the enhanced vegetation index, which can effectively reduce the interference of dryness in the accuracy of data. The EVI was then combined with terrestrial water storage to analyze the influencing factors, aiming to make up for the results of earlier studies conducted only from the aspects of climate or topography. In addition to this novel approach, the study limited the factor selection to climate, economy, population, and terrestrial water reserves only in order to explore the influence of nature on the EVI. Nonetheless, studies exploring the driving mechanisms, such as land-use change, topography, slope, slope orientation, etc., are still lacking in the literature, and a more comprehensive investigation of the driving mechanisms of the EVI in the TRB could be helpful in the future.
5. Conclusions
- (1)
- The spatial distribution of the EVI of vegetation in the Tarim River Basin from 2002 to 2022 was characterized as “high all around, low in the center, high in the northwest, and low in the southeast”. There were frequent transformations between classes of the vegetation index and significant vegetation growth over the 20-year study period. Among these conversions, the area of highest change rate was 0.6 < EVI ≤ 0.8, at a rate of change of 200.36%. Additionally, vegetation in the TRB increased more than it decreased, and the locations boasting improved vegetation accounted for 84.13% of the total area. The places showing highly significant increases and significant increases accounted for 45.70% of the study region, so the overall ecological environment improved. Vegetation in the Kumukuli Basin also showed an increasing trend. For future vegetation changes, the area of degradation is slightly larger than the area of improvement, the overall trend is toward degradation, and the proportion of anti-sustained upward movement area is 57.87%.
- (2)
- Temperature and precipitation were demonstrated to be the most critical factors affecting the vegetation growth process. The areas with positive correlations between vegetation EVI and temperature accounted for 64.67% of the study region, with 6.54% showing significant positive correlations. The locations exhibiting positive correlations between precipitation and vegetation accounted for 7.3% of the total area, which is a relatively small percentage, and vegetation showed a lower sensitivity to precipitation compared to temperature. The EVI remained consistent with the direction of population and GDP migration, and the impact of human activities on the EVI was mainly generated through the increase in the area of cultivated land.
- (3)
- The spatial distribution of terrestrial water storage in the basin was geographically significant during the study period. The spatial changes showed a gradual shift from deficit to surplus from the northeast to the southwest, with an overall fluctuating upward trend. Changes in terrestrial water storage in the Kumkuli Basin were most obvious after 2011 and resulted in a 0.993 mm/month change rate. Terrestrial water storage changes had only indirect effects on vegetation, with a positive correlation of 50.513% for the total area. The locations exhibiting significant positive correlations were mainly distributed along the northern slopes of the Kunlun Mountains, and the Kumukuli Basin gave the highest performance.
Author Contributions
Y.W. and Z.L. conceived the study design; T.X. implemented the field research and collected and analyzed the field data; X.X., H.W. and Z.Z. applied mathematics or other forms of technology to analyze or research data; T.X. wrote the paper. All authors have read and agreed to the published version of the manuscript.
Funding
This research was support by the Third Xinjiang Scientific Expedition Program, grant number 2021xjkk010202.
Data Availability Statement
The data presented in this study are available on request from the corresponding author due to privacy restrictions.
Conflicts of Interest
The authors declare no conflicts of interest.
References
- Shi, S.H.; Wang, X.L.; Hu, Z.R.; Zhao, X.; Zhang, S.R.; Hou, M.; Zhang, N. Geographic detector-based quantitative assessment enhances attribution analysis of climate and topography factors to vegetation variation for spatial heterogeneity and coupling. Glob. Ecol. Conserv. 2023, 42, e02398. [Google Scholar] [CrossRef]
- Zhang, H.; Yu, J.D.; Jiang, T.L.; Yu, S.C.; Zhou, C.L.; Li, F.Q.; Chen, X.T. Natural Vegetation Area Design in an Arid Region Based on Water Resource Carrying Capacity-Taking Minqin County as an Example. Water 2023, 15, 3238. [Google Scholar] [CrossRef]
- Sur, K.; Chauhan, P. Dynamic trend of land degradation/restoration along Indira Gandhi Canal command area in Jaisalmer District, Rajasthan, India: A case study. Environ. Earth Sci. 2019, 78, 472. [Google Scholar] [CrossRef]
- Zhang, G.L.; Biradar, M.C.; Xiao, X.M.; Dong, J.W.; Zhou, Y.T.; Qin, Y.W.; Zhang, Y.; Liu, F.; Ding, M.J.; Thomas, R.J.; et al. Exacerbated grassland degradation and desertification in Central Asia during 2000-2014. Ecol. Appl. A Publ. Ecol. Soc. Am. 2018, 28, 442–456. [Google Scholar] [CrossRef] [PubMed]
- Zhang, Q.; Wang, G.; Yuan, R.Y.; Singh, V.P.; Wu, W.H.; Wang, D.Z. Dynamic responses of ecological vulnerability to land cover shifts over the Yellow river Basin, China. Ecol. Indic. 2022, 144, 109554. [Google Scholar] [CrossRef]
- Zhang, D.; Geng, X.L.; Chen, W.X.; Fang, L.; Yao, R.; Wang, X.R.; Zhou, X. Inconsistency of Global Vegetation Dynamics Driven by Climate Change: Evidences from Spatial Regression. Remote Sens. 2021, 13, 3442. [Google Scholar] [CrossRef]
- Sun, X.; Li, G.Y.; Wu, Q.Q.; Li, D.Q.; Lu, D.S. Examining the Effects of Soil and Water Conservation Measures on Patterns and Magnitudes of Vegetation Cover Change in a Subtropical Region Using Time Series Landsat Imagery. Remote Sens. 2024, 16, 714. [Google Scholar] [CrossRef]
- Xiao, X.; Guan, Q.Y.; Zhang, Z.P.; Liu, H.Q.; Du, Q.Q.; Yuan, T.W. Investigating the underlying drivers of vegetation dynamics in cold-arid mountainous. Catena 2024, 237, 7107831. [Google Scholar] [CrossRef]
- He, B.; Wu, X.; Liu, K.; Yao, Y.Z.; Chen, W.J.; Zhao, W. Trends in Forest Greening and Its Spatial Correlation with Bioclimatic and Environmental Factors in the Greater Mekong Subregion from 2001 to 2020. Remote Sens. 2022, 14, 59825982. [Google Scholar] [CrossRef]
- Gu, Z.V.; Zhang, Z.; Yang, J.H.; Wang, L.L. Quantifying the Influences of Driving Factors on Vegetation EVI Changes Using Structural Equation Model: A Case Study in Anhui Province, China. Remote Sens. 2022, 14, 42034203. [Google Scholar] [CrossRef]
- Li, C.H.; Song, Y.F.; Qin, T.L.; Yan, D.H.; Zhang, X.; Zhu, L.; Dorjsuren, B.; Khalid, H. Spatiotemporal Variations of Global Terrestrial Typical Vegetation EVI and Their Responses to Climate Change from 2000 to 2021. Remote Sens. 2023, 15, 4245. [Google Scholar] [CrossRef]
- Zhang, T.; Zhou, J.Z.; Yu, P.; Li, J.Z.; Kang, Y.F.; Zhang, B. Response of ecosystem gross primary productivity to drought in northern China based on multi-source remote sensing data. J. Hydrol. 2023, 616, 128808. [Google Scholar] [CrossRef]
- Fan, X.Y.; Zhu, D.P.; Sun, X.F.; Wang, J.B.; Wang, M.; Wang, S.Q.; Watson, A.E. Impacts of Extreme Temperature and Precipitation on Crops during the Growing Season in South Asia. Remote Sens. 2022, 14, 6093. [Google Scholar] [CrossRef]
- Amantai, N.; Meng, Y.; Wang, J.; Ge, X.Y.; Tang, Z.Y. Climate overtakes vegetation greening in regulating spatiotemporal patterns of soil moisture in arid Central Asia in recent 35 years. GIScience Remote Sens. 2024, 61, 2286744. [Google Scholar] [CrossRef]
- Qin, J.S.; Ma, M.L.; Shi, J.B.; Ma, S.R.; Wu, B.G.; Su, X.H. The Time-Lag Effect of Climate Factors on the Forest Enhanced Vegetation Index for Subtropical Humid Areas in China. Int. J. Environ. Res. Public Health 2023, 20, 799. [Google Scholar] [CrossRef]
- Ge, X.Y.; Ding, J.L.; Amantai, N.; Xiong, J.; Wang, J.Z. Responses of vegetation cover to hydro-climatic variations in Bosten Lake Watershed, NW China. Front. Plant Sci. 2024, 15, 1323445. [Google Scholar] [CrossRef] [PubMed]
- Yuan, H.; Wu, C.; Gu, C.; Wang, X.Y. Evidence for satellite observed changes in the relative influence of climate indicators on autumn phenology over the Northern Hemisphere. Glob. Planet. Chang. 2020, 187, 103131. [Google Scholar] [CrossRef]
- Sun, R.; Chen, S.H.; Su, H.B. Trend Analysis and Driving Factors of Vegetation Dynamics in Northern China from 1982 to 2015. Remote Sens. 2022, 14, 6163. [Google Scholar] [CrossRef]
- Mei, L.; Tong, S.Q.; Yin, S.; Bao, Y.H.; Huang, X.J.; Tuya, A. Variation Characteristics of Ecosystem Water Use Efficiency and Its Response to Human Activity and Climate Change in Inner Mongolia. Remote Sens. 2022, 14, 54225422. [Google Scholar] [CrossRef]
- Yu, M.Z.; Song, S.; He, G.Z.; Shi, Y.J. Vegetation Landscape Changes and Driving Factors of Typical Karst Region in the Anthropocene. Remote Sens. 2022, 14, 5391. [Google Scholar] [CrossRef]
- Matta, E.; Bresciani, M.; Tellina, G.; Schenk, K.; Bauer, P.; Von, T.F.; Ruther, N.; Bartosova, A. Data Integration for Investigating Drivers of Water Quality Variability in the Banja Reservoir Watershed. Water 2023, 15, 607. [Google Scholar] [CrossRef]
- Yang, X.Y.; Yang, Q.K.; Yang, M.M. Spatio-Temporal Patterns and Driving Factors of Vegetation Change in the Pan-Third Pole Region. Remote Sens. 2022, 14, 4402. [Google Scholar] [CrossRef]
- Chen, L.F.; Michishita, R.; Xu, B. Abrupt spatiotemporal land and water changes and their potential drivers in Poyang Lake, 2000–2012. ISPRS J. Photogramm. Remote Sens. 2014, 98, 9885–9893. [Google Scholar] [CrossRef]
- Liu, H.; Yu, Y.; Xia, D.S.; Ma, X.; Dong, L. Analysis of the relationship between dust aerosol and precipitation in spring over East Asia using EOF and SVD methods. Sci. Total Environ. 2023, 908, 168437. [Google Scholar] [CrossRef] [PubMed]
- Sur, K.; Dave, R.; Chauhan, P. Spatio—Temporal changes in NDVI and rainfall over Western Rajasthan and Gujarat region of India. J. Agrometeorol. 2018, 20, 189–195. [Google Scholar]
- Mann, H.B. Nonparametric tests against trend. Econom. J. Econom. Soc. 1945, 13, 245–259. [Google Scholar] [CrossRef]
- Jumai, M.; Kasimu, A.; Liang, H.; Tang, L.N.; Aizizi, Y.; Zhang, X.L. A Study on the Spatial and Temporal Variation of Summer Surface Temperature in the Bosten Lake Basin and Its Influencing Factors. Land 2023, 12, 1185. [Google Scholar] [CrossRef]
- Fang, L.J.; Gao, R.Z.; Wang, X.X.; Zhang, X.; Wang, Y.L.; Liu, T.X. Effects of coal mining and climate-environment factors on the evolution of a typical Eurasian grassland. Environ. Res. 2024, 2024, 244117957. [Google Scholar] [CrossRef]
- Yang, Y.; Tang, S.N.; Yu, L.L.; Chen, F.; Ding, Y.Y.; Zhang, P.Z. Trend analysis on temperature and precipitation over North China Plain for past five decades. IOP Conf. Ser. Earth Environ. Sci. 2021, 675, 012014. [Google Scholar] [CrossRef]
- Li, J.; Peng, X.; Tang, R.; Tang, R.; Geng, J.; Zhang, J.P.; Xu, D.; Bai, T. Spatial and Temporal Variation Characteristics of Ecological Environment Quality in China from 2002 to 2019 and Influencing Factors. Land 2024, 13, 0110. [Google Scholar] [CrossRef]
- Zhang, X.C.; Chen, L.X.; Zhou, C. Deformation Monitoring and Trend Analysis of Reservoir Bank Landslides by Combining Time-Series InSAR and Hurst Index. Remote Sens. 2023, 15, 619. [Google Scholar] [CrossRef]
- Hu, J.Y.; Chritakos, G.; Wu, J.P.; Li, M.; Leng, J.X. Spatiotemporal BME characterization and mapping of sea surface chlorophyll in Chesapeake Bay (USA) using auxiliary sea surface temperature data. Sci. Total Environ. 2021, 794, 148670. [Google Scholar]
- Zhang, Q.F.; Chen, Y.N.; Sun, C.J.; Xiang, Y.Y.; Hao, H.C. Changes in terrestrial water storage and evaluation of oasis ecological security in the Tarim River Basin. Arid Land Geogr. 2024, 47, 1–14. [Google Scholar]
- Wang, S.; Zuo, Q.; Zhou, K.; Wang, J.L.; Wang, E. Predictions of Land Use/Land Cover Change and Landscape Pattern Analysis in the Lower Reaches of the Tarim River, China. Land 2023, 12, 1093. [Google Scholar] [CrossRef]
- Lu, Q.; Liu, F.J.; Li, Y.J.; Wang, D.Z. Study on the Relationship between Water Resources Utilization and Economic Growth in Tarim River basin from the Perspective of Water Footprint. Water 2022, 14, 16551655. [Google Scholar] [CrossRef]
- Wang, J.; Din, J.; Li, G.; Liang, J.; Yu, D.L.; Aishan, T.J.; Zhang, F.; Yang, J.M.; Abulimiti, A.; Liu, J.; et al. Dynamic detection of water surface area of Ebinur Lake using multi-source satellite data (Landsat and Sentinel-1A) and its responses to changing environment. Catena 2019, 177, 189–201. [Google Scholar] [CrossRef]
- Lu, S.B.; Shang, Y.Z.; Li, W. Assessment of the Tarim River basin water resources sustainable utilization based on entropy weight set pair theory. Water Supply 2019, 19, 908–917. [Google Scholar] [CrossRef]
- Zhang, S.; Wang, Y.; Wang, Y.; Li, Z.; Hou, Y.F. Spatiotemporal Evolution and Influencing Mechanisms of Ecosystem Service Value in the Tarim River Basin, Northwest China. Remote Sens. 2023, 15, 591. [Google Scholar] [CrossRef]
- Sun, Q.; Tasipurat, T.; Zhang, F. Dynamics of land use/cover changes in the Weigan and Kuqa rivers delta oasis based on Remote Sensing. Acta Ecol. Sin. 2012, 32, 3252–3265. [Google Scholar]
- Yue, S.J.; Huang, J.C.; Zhang, Y.L.; Chen, W.Q.; Guo, Y.L.; Cheng, M.Y.; Ji, G.X. Quantitative Evaluation of the Impact of Vegetation Restoration and Climate Variation on Runoff Attenuation in the Luan River Basin Based on the Extended Budyko Model. Land 2023, 12, 1626. [Google Scholar] [CrossRef]
Figure 1.
Overview map of the study area (note: review drawing No. GS (2020) 4619).

Figure 2.
Flow chart of data processing.

Figure 3.
Spatial distribution of vegetation in the TRB.

Figure 4.
Characteristics of spatial and temporal evolution of vegetation in the TRB. ((a–e) show the characteristics of the spatial distribution for each five-year period, and figure (f) shows the characteristics of the changes in the period 2002–2022).
Figure 4.
Characteristics of spatial and temporal evolution of vegetation in the TRB. ((a–e) show the characteristics of the spatial distribution for each five-year period, and figure (f) shows the characteristics of the changes in the period 2002–2022).

Figure 5.
Spatial distribution of vegetation conversion in the TRB. (a) 0 < EVI < 0.2; (b) 0.2 ≤ EVI < 0.4; (c) 0.4 ≤ EVI < 0.6; (d) 0.6 ≤ EVI < 0.8; (e) 0.8 ≤ EVI < 0.1.
Figure 5.
Spatial distribution of vegetation conversion in the TRB. (a) 0 < EVI < 0.2; (b) 0.2 ≤ EVI < 0.4; (c) 0.4 ≤ EVI < 0.6; (d) 0.6 ≤ EVI < 0.8; (e) 0.8 ≤ EVI < 0.1.

Figure 6.
Trends in vegetation change in the TRB and the northern slopes of the Kunlun Mountains.
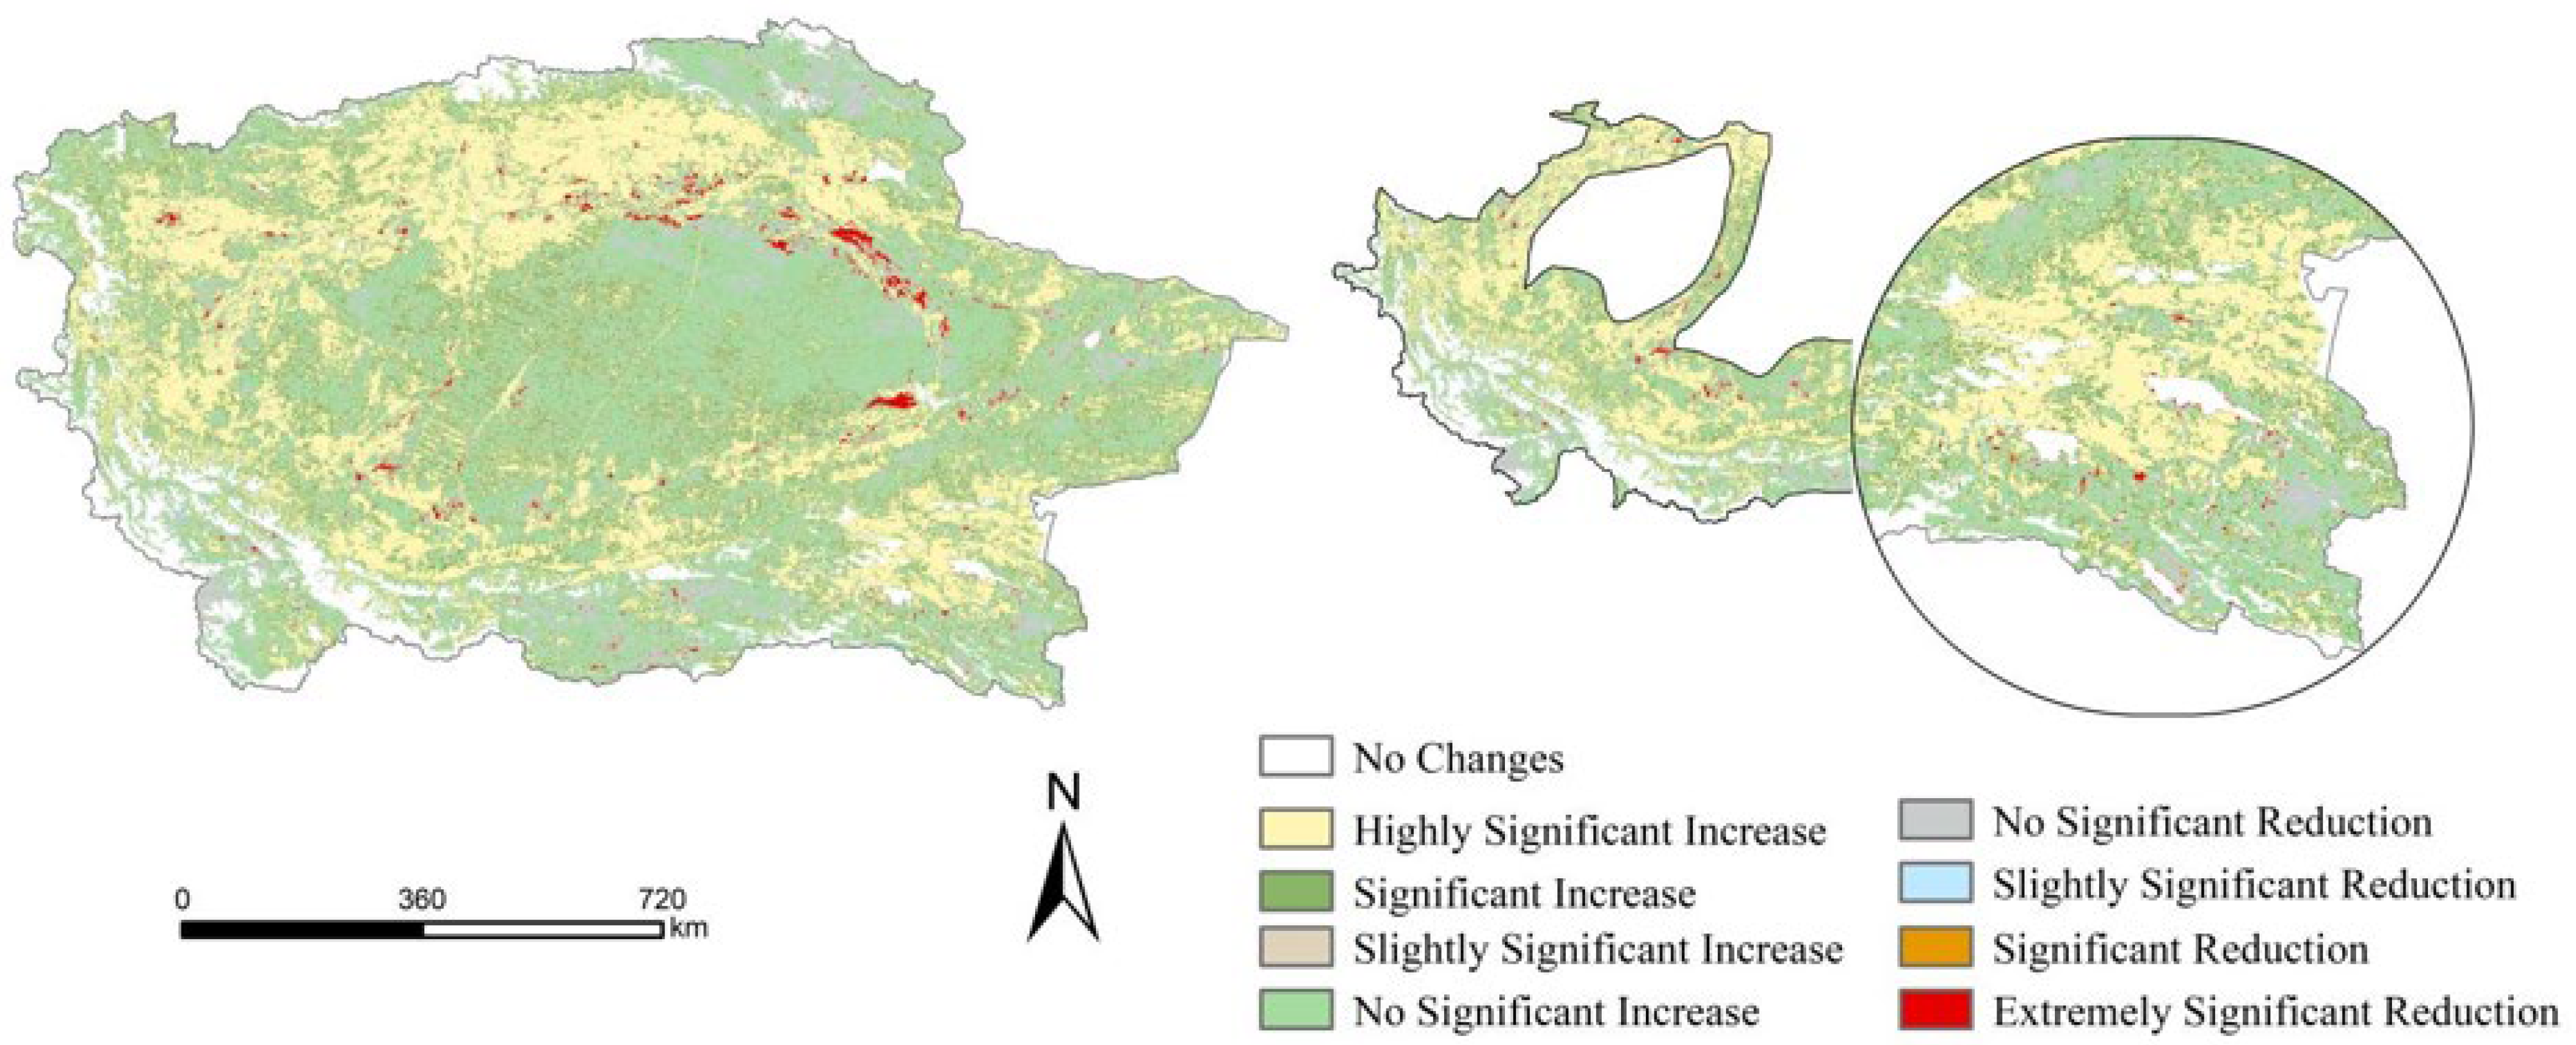
Figure 7.
Spatial distribution of correlation coefficients between vegetation, air temperature, and precipitation in the TRB: (a) temperature–vegetation phase coefficient; (b) precipitation–vegetation phase coefficient.
Figure 7.
Spatial distribution of correlation coefficients between vegetation, air temperature, and precipitation in the TRB: (a) temperature–vegetation phase coefficient; (b) precipitation–vegetation phase coefficient.

Figure 8.
EVI, population, and GDP center of gravity migration trajectory in the TRB. ((a): Multifactor center of gravity migration trajectories in the TRB, (b): EVI center of gravity migration trajectory, (c): population center of gravity migration trajectory, (d): GDP center of gravity migration trajectory, (e): primary industry center of gravity migration trajectory).

Figure 9.
Hurst index for vegetation in the TRB.

Figure 10.
Spatial distribution of terrestrial water storage on the northern slopes of the Kunlun Mountains in 2002–2022.
Figure 10.
Spatial distribution of terrestrial water storage on the northern slopes of the Kunlun Mountains in 2002–2022.

Figure 11.
Change map of terrestrial water storage in the Kumkuri Basin.

Figure 12.
Spatial distribution of correlation coefficients between vegetation and terrestrial water storage in the TRB.
Figure 12.
Spatial distribution of correlation coefficients between vegetation and terrestrial water storage in the TRB.

Table 1.
Area change of vegetation index in the TRB.
| 2002–2007 | 2007–2012 | 2012–2017 | 2017–2022 | 2002–2022 | ||||||
|---|---|---|---|---|---|---|---|---|---|---|
| Magnitude of Change | Rate of Change | Magnitude of Change | Rate of Change | Magnitude of Change | Rate of Change | Magnitude of Change | Rate of Change | Magnitude of Change | Rate of Change | |
| low vegetation cover | −9394 | −11.067% | 13,203 | 17.490% | 5639 | 6.358% | −5280 | −5.597% | 4168 | 4.910% |
| medium vegetation cover | 4115 | 14.064% | 15,249 | 45.691% | 6967 | 14.329% | −894 | −1.608% | 25,437 | 86.937% |
| high vegetation cover | −139 | −32.028% | 582 | 197.289% | 45 | 5.131% | −527 | −57.158% | −39 | −8.986% |
Table 2.
Changes in the area of different classes of vegetation index in the vegetated TRB from 2002 to 2022 (km2).
Table 2.
Changes in the area of different classes of vegetation index in the vegetated TRB from 2002 to 2022 (km2).
| ×104 km2 | 2002 | 2007 | 2012 | 2017 | 2022 | Change% | Magnitude of Change |
|---|---|---|---|---|---|---|---|
| 0–0.2 | 118.87 | 119.67 | 116.41 | 115.53 | 116.74 | −1.79 | −2.13 |
| 0.2–0.4 | 8.49 | 7.55 | 8.87 | 9.43 | 8.91 | 4.91 | 0.42 |
| 0.4–0.6 | 2.76 | 3.21 | 4.42 | 5.01 | 4.92 | 78.19 | 2.16 |
| 0.6–0.8 | 0.19 | 0.15 | 0.53 | 0.64 | 0.58 | 200.36 | 0.39 |
| 0.8–1 | 0.012 | 0.005 | 0.0045 | 0.0037 | 0.0017 | −85.59 | −0.018 |
Disclaimer/Publisher’s Note: The statements, opinions and data contained in all publications are solely those of the individual author(s) and contributor(s) and not of MDPI and/or the editor(s). MDPI and/or the editor(s) disclaim responsibility for any injury to people or property resulting from any ideas, methods, instructions or products referred to in the content. |
© 2024 by the authors. Licensee MDPI, Basel, Switzerland. This article is an open access article distributed under the terms and conditions of the Creative Commons Attribution (CC BY) license (https://creativecommons.org/licenses/by/4.0/).
Share and Cite
MDPI and ACS Style
Xia, T.; Xue, X.; Wang, H.; Zhu, Z.; Li, Z.; Wang, Y. Mechanism of Vegetation Greenness Change and Its Correlation with Terrestrial Water Storage in the Tarim River Basin. Land 2024, 13, 712. https://doi.org/10.3390/land13050712
AMA Style
Xia T, Xue X, Wang H, Zhu Z, Li Z, Wang Y. Mechanism of Vegetation Greenness Change and Its Correlation with Terrestrial Water Storage in the Tarim River Basin. Land. 2024; 13(5):712. https://doi.org/10.3390/land13050712
Chicago/Turabian StyleXia, Tingting, Xuan Xue, Haowei Wang, Zhen Zhu, Zhi Li, and Yang Wang. 2024. "Mechanism of Vegetation Greenness Change and Its Correlation with Terrestrial Water Storage in the Tarim River Basin" Land 13, no. 5: 712. https://doi.org/10.3390/land13050712
Note that from the first issue of 2016, this journal uses article numbers instead of page numbers. See further details here.