
The Role of T2 Mapping in Cardiac Amyloidosis
 , , , , , and
Abstract
:1. Introduction
2. Materials and Methods
2.1. Study Population
2.2. CMR Protocol
2.3. Image Analysis
2.4. Statistical Analysis
3. Results
3.1. Population Characteristics
3.2. CMR Image Analysis
3.2.1. Qualitative Analysis and Quantitative Analysis
3.2.2. Mapping Analysis
3.2.3. Relationship between Myocardial Native T2 Values and Other Parameters
4. Discussion
5. Conclusions
Author Contributions
Funding
Institutional Review Board Statement
Informed Consent Statement
Data Availability Statement
Conflicts of Interest
References
- Garcia-Pavia, P.; Rapezzi, C.; Adler, Y.; Arad, M.; Basso, C.; Brucato, A.; Burazor, I.; Caforio, A.L.P.; Damy, T.; Eriksson, U.; et al. Diagnosis and treatment of cardiac amyloidosis. A position statement of the European Society of Cardiology W orking G roup on M yocardial and P ericardial D iseases. Eur. J. Heart Fail. 2021, 23, 512–526. [Google Scholar] [CrossRef] [PubMed]
- Brenner, D.A.; Jain, M.; Pimentel, D.R.; Wang, B.; Connors, L.H.; Skinner, M.; Apstein, C.S.; Liao, R. Human amyloidogenic light chains directly impair cardiomyocyte function through an increase in cellular oxidant stress. Circ. Res. 2004, 94, 1008–1010. [Google Scholar] [CrossRef] [PubMed]
- Guan, J.; Mishra, S.; Qiu, Y.; Shi, J.; Trudeau, K.; Las, G.; Liesa, M.; Shirihai, O.S.; Connors, L.H.; Seldin, D.C.; et al. Lysosomal dysfunction and impaired autophagy underlie the pathogenesis of amyloidogenic light chain-mediated cardiotoxicity. EMBO Mol. Med. 2015, 7, 688. [Google Scholar] [CrossRef]
- Stevens, F.J.; Kisilevsky, R. Immunoglobulin light chains, glycosaminoglycans, and amyloid. Cell. Mol. Life Sci. 2000, 57, 441–449. [Google Scholar] [CrossRef] [PubMed]
- Ridouani, F.; Damy, T.; Tacher, V.; Derbel, H.; Legou, F.; Sifaoui, I.; Audureau, E.; Bodez, D.; Rahmouni, A.; Deux, J. Myocardial native T2 measurement to differentiate light-chain and transthyretin cardiac amyloidosis and assess prognosis. J. Cardiovasc. Magn. Reson. 2018, 20, 58. [Google Scholar] [CrossRef] [PubMed]
- Saad, J.M.; Ahmed, A.I.; Han, Y.; Malahfji, M.; Aljizeeri, A.; Al-Mallah, M.H. Cardiovascular magnetic resonance for suspected cardiac amyloidosis: Where are we now? Heart Fail. Rev. 2022, 27, 1543–1548. [Google Scholar] [CrossRef] [PubMed]
- Pradella, S.; Mazzoni, L.N.; Letteriello, M.; Tortoli, P.; Bettarini, S.; De Amicis, C.; Grazzini, G.; Busoni, S.; Palumbo, P.; Belli, G.; et al. FLORA software: Semi-automatic LGE-CMR analysis tool for cardiac lesions identification and characterization. Radiol. Med. 2022, 127, 589–601. [Google Scholar] [CrossRef] [PubMed]
- Pradella, S.; Grazzini, G.; De Amicis, C.; Letteriello, M.; Acquafresca, M.; Miele, V. Cardiac magnetic resonance in hypertrophic and dilated cardiomyopathies. Radiol. Med. 2020, 125, 1056–1071. [Google Scholar] [CrossRef] [PubMed]
- Martinez-Naharro, A.; Treibel, T.A.; Abdel-Gadir, A.; Bulluck, H.; Zumbo, G.; Knight, D.S.; Kotecha, T.; Francis, R.; Hutt, D.F.; Rezk, T.; et al. Magnetic Resonance in Transthyretin Cardiac Amyloidosis. J. Am. Coll. Cardiol. 2017, 70, 466–477. [Google Scholar] [CrossRef]
- Warnica, W.; Al-Arnawoot, A.; Stanimirovic, A.; Thavendiranathan, P.; Wald, R.M.; Pakkal, M.; Karur, G.R.; Wintersperger, B.J.; Rac, V.; Hanneman, K. Clinical Impact of Cardiac MRI T1 and T2 Parametric Mapping in Patients with Suspected Cardiomyopathy. Radiology 2022, 305, 319–326. [Google Scholar] [CrossRef]
- Pradella, S.; Grazzini, G.; Brandani, M.; Calistri, L.; Nardi, C.; Mori, F.; Miele, V.; Colagrande, S. Cardiac magnetic resonance in patients with mitral valve prolapse: Focus on late gadolinium enhancement and T1 mapping. Eur. Radiol. 2019, 29, 1546–1554. [Google Scholar] [CrossRef] [PubMed]
- Moon, J.C.; Messroghli, D.R.; Kellman, P.; Piechnik, S.K.; Robson, M.D.; Ugander, M.; Gatehouse, P.D.; Arai, A.E.; Friedrich, M.G.; Neubauer, S.; et al. Myocardial T1 mapping and extracellular volume quantification: A Society for Cardiovascular Magnetic Resonance (SCMR) and CMR Working Group of the European Society of Cardiology consensus statement. J. Cardiovasc. Magn. Reson. 2013, 15, 92. [Google Scholar] [CrossRef]
- Fontana, M.; Banypersad, S.M.; Treibel, T.A.; Maestrini, V.; Sado, D.M.; White, S.K.; Pica, S.; Castelletti, S.; Piechnik, S.K.; Robson, M.D.; et al. Native T1 Mapping in Transthyretin Amyloidosis. JACC Cardiovasc. Imaging 2014, 7, 157–165. [Google Scholar] [CrossRef] [PubMed]
- Banypersad, S.M.; Fontana, M.; Maestrini, V.; Sado, D.M.; Captur, G.; Petrie, A.; Piechnik, S.K.; Whelan, C.J.; Herrey, A.S.; Gillmore, J.D.; et al. T1 mapping and survival in systemic light-chain amyloidosis. Eur. Heart J. 2015, 36, 244–251. [Google Scholar] [CrossRef] [PubMed]
- Banypersad, S.M.; Sado, D.M.; Flett, A.S.; Gibbs, S.D.J.; Pinney, J.H.; Maestrini, V.; Cox, A.T.; Fontana, M.; Whelan, C.J.; Wechalekar, A.D.; et al. Quantification of Myocardial Extracellular Volume Fraction in Systemic AL Amyloidosis: An Equilibrium Contrast Cardiovascular Magnetic Resonance Study. Circ. Cardiovasc. Imaging 2013, 6, 34–39. [Google Scholar] [CrossRef]
- Martinez-Naharro, A.; Abdel-Gadir, A.; Treibel, T.A.; Zumbo, G.; Knight, D.S.; Rosmini, S.; Lane, T.; Mahmood, S.; Sachchithanantham, S.; Whelan, C.J.; et al. CMR-Verified Regression of Cardiac AL Amyloid after Chemotherapy. JACC Cardiovasc. Imaging 2018, 11, 152–154. [Google Scholar] [CrossRef]
- Fontana, M.; Banypersad, S.M.; Treibel, T.A.; Abdel-Gadir, A.; Maestrini, V.; Lane, T.; Gilbertson, J.A.; Hutt, D.F.; Lachmann, H.J.; Whelan, C.J.; et al. Differential Myocyte Responses in Patients with Cardiac Transthyretin Amyloidosis and Light-Chain Amyloidosis: A Cardiac MR Imaging Study. Radiology 2015, 277, 388–397. [Google Scholar] [CrossRef] [PubMed]
- Kotecha, T.; Martinez-Naharro, A.; Treibel, T.A.; Francis, R.; Nordin, S.; Abdel-Gadir, A.; Knight, D.S.; Zumbo, G.; Rosmini, S.; Maestrini, V.; et al. Myocardial Edema and Prognosis in Amyloidosis. J. Am. Coll. Cardiol. 2018, 71, 2919–2931. [Google Scholar] [CrossRef] [PubMed]
- Garcia-Dorado, D.; Andres-Villarreal, M.; Ruiz-Meana, M.; Inserte, J.; Barba, I. Myocardial edema: A translational view. J. Mol. Cell. Cardiol. 2012, 52, 931–939. [Google Scholar] [CrossRef]
- Bulluck, H.; White, S.K.; Rosmini, S.; Bhuva, A.; Treibel, T.A.; Fontana, M.; Abdel-Gadir, A.; Herrey, A.; Manisty, C.; Wan, S.M.Y.; et al. T1 mapping and T2 mapping at 3T for quantifying the area-at-risk in reperfused STEMI patients. J. Cardiovasc. Magn. Reson. 2015, 17, 73. [Google Scholar] [CrossRef]
- Lurz, P.; Luecke, C.; Eitel, I.; Föhrenbach, F.; Frank, C.; Grothoff, M.; De Waha, S.; Rommel, K.-P.; Lurz, J.A.; Klingel, K.; et al. Comprehensive Cardiac Magnetic Resonance Imaging in Patients with Suspected Myocarditis. J. Am. Coll. Cardiol. 2016, 67, 1800–1811. [Google Scholar] [CrossRef] [PubMed]
- Muellerleile, K.; Lund, G.K. Cardiovascular Magnetic Resonance in Cardiac Amyloidosis. J. Am. Coll. Cardiol. 2018, 71, 2932–2934. [Google Scholar] [CrossRef] [PubMed]
- Hamlin, S.A.; Henry, T.S.; Little, B.P.; Lerakis, S.; Stillman, A.E. Mapping the Future of Cardiac MR Imaging: Case-based Review of T1 and T2 Mapping Techniques. RadioGraphics 2014, 34, 1594–1611. [Google Scholar] [CrossRef] [PubMed]
- Maestrini, V.; Treibel, T.A.; White, S.K.; Fontana, M.; Moon, J.C. T1 Mapping for Characterization of Intracellular and Extracellular Myocardial Diseases in Heart Failure. Curr. Cardiovasc. Imaging Rep. 2014, 7, 9287. [Google Scholar] [CrossRef] [PubMed]
- Pradella, S.; Grazzini, G.; Miele, V. Mitral valve prolapse imaging: The role of tissue characterization. Quant. Imaging Med. Surg. 2020, 10, 2396–2400. [Google Scholar] [CrossRef] [PubMed]
- Arbelo, E.; Protonotarios, A.; Gimeno, J.R.; Arbustini, E.; Barriales-Villa, R.; Basso, C.; Bezzina, C.R.; Biagini, E.; Blom, N.A.; De Boer, R.A.; et al. 2023 ESC Guidelines for the management of cardiomyopathies. Eur. Heart J. 2023, 44, 3503–3626. [Google Scholar] [CrossRef] [PubMed]
- Falk, R.H.; Comenzo, R.L.; Skinner, M. The Systemic Amyloidoses. N. Engl. J. Med. 1997, 337, 898–909. [Google Scholar] [CrossRef] [PubMed]
- Kyle, R.A.; Gertz, M.A. Primary systemic amyloidosis: Clinical and laboratory features in 474 cases. Semin. Hematol. 1995, 32, 45–59. [Google Scholar] [PubMed]
- Dungu, J.N.; Valencia, O.; Pinney, J.H.; Gibbs, S.D.J.; Rowczenio, D.; Gilbertson, J.A.; Lachmann, H.J.; Wechalekar, A.; Gillmore, J.D.; Whelan, C.J.; et al. CMR-Based Differentiation of AL and ATTR Cardiac Amyloidosis. JACC Cardiovasc. Imaging 2014, 7, 133–142. [Google Scholar] [CrossRef]
- Rapezzi, C.; Merlini, G.; Quarta, C.C.; Riva, L.; Longhi, S.; Leone, O.; Salvi, F.; Ciliberti, P.; Pastorelli, F.; Biagini, E.; et al. Systemic Cardiac Amyloidoses: Disease Profiles and Clinical Courses of the 3 Main Types. Circulation 2009, 120, 1203–1212. [Google Scholar] [CrossRef]
- Sparrow, P.; Amirabadi, A.; Sussman, M.S.; Paul, N.; Merchant, N. Quantitative assessment of myocardial T2 relaxation times in cardiac amyloidosis. J. Magn. Reson. Imaging 2009, 30, 942–946. [Google Scholar] [CrossRef] [PubMed]
- Legou, F.; Tacher, V.; Damy, T.; Planté-Bordeneuve, V.; Rappeneau, S.; Benhaiem, N.; Rosso, J.; Itti, E.; Luciani, A.; Kobeiter, H.; et al. Usefulness of T2 ratio in the diagnosis and prognosis of cardiac amyloidosis using cardiac MR imaging. Diagn. Interv. Imaging 2017, 98, 125–132. [Google Scholar] [CrossRef] [PubMed]
- Wassmuth, R.; Abdel-Aty, H.; Bohl, S.; Schulz-Menger, J. Prognostic impact of T2-weighted CMR imaging for cardiac amyloidosis. Eur. Radiol. 2011, 21, 1643–1650. [Google Scholar] [CrossRef] [PubMed]


| Scanner Reference Range | Magnetom Sola | Magnetom Aera | Philips Ingenia |
|---|---|---|---|
| Native T1 | 950–1050 (1000 ± 50) | 969–985 (977 ± 8) | 974–1014 (994 ± 20) |
| Native T2 | 45–48 (46.5 ± 1.5) | 49–52 (50.5 ± 1.5) | 54–55 (54.5 ± 0.5) |
| ECV | 25.3–26.3 (25.8 ± 0.5) | 25.3–26.3 (25.8 ± 0.5) | 24.7–26.6 (25.6 ± 0.9) |
| SA-Cine | SA-Native T1 Mapping | SA-LGE | SA-T2 TSE | SA-Native T2 Mapping | ||
|---|---|---|---|---|---|---|
| FOV | 1 | 300 | 300 | 300 | 300 | 300 |
| 2 | 300 | 300 | 300 | 300 | 300 | |
| 3 | 300 | 300 | 300 | 300 | 300 | |
| TR (ms) | 1 | 30.8 | 305.8 | 789 | 1666.2 | 218.2 |
| 2 | 3.2 | 2.2 | 4.5 | 1739.1 | 869.6 | |
| 3 | 30.8 | 278.5 | 676 | 1459.3 | 218.2 | |
| TE (ms) | 1 | 1.3 | 1.1 | 1.1 | 60 | 1.0 |
| 2 | 1.6 | 0.99 | 2.1 | 70 | 8.4 | |
| 3 | 1.3 | 1.0 | 1.1 | 60 | 1.0 | |
| FA (°) | 1 | 60° | 35° | 40° | 180° | 70° |
| 2 | 60° | 35° | 20° | 90° | 90° | |
| 3 | 60° | 35° | 40° | 180 | 70° | |
| ST (mm) | 1 | 8 | 8 | 8 | 8 | 8 |
| 2 | 8 | 10 | 8 | 8 | 10 | |
| 3 | 8 | 8 | 8 | 8 | 8 | |
| IT (ms) | 1 | 109 | 285 | |||
| 2 | 350 | 300–380 | ||||
| 3 | 100 | 285 | ||||
| Characteristics | ATTR-CA (n = 51, 73%) | AL-CA (n = 19, 27%) | p-Value |
|---|---|---|---|
| Clinical | |||
| Age | 77 ± 8 | 71 ± 7 | p= 0.01 |
| Male | 43 (84%) | 9 (47%) | p= 0.02 |
| BSA | 1.89 ± 0.2 | 1.72 ± 0.2 | p= 0.03 |
| NYHA (I, II, III, IV) | I/II 92% | I/II 84% | p= 0.50 |
| NT-pro BNP (pg/mL) | 2450 ± 2711 | 2386 ± 1870 | p = 0.93 |
| eGFR (mL/min) | 62 ± 27 | 70 ± 16 | p= 0.15 |
| Echocardiography | |||
| Transmitral E/A | 1.36 ± 0.9 | 1.28 ± 0.7 | p= 0.72 |
| E/E’ | 15.7 ± 6.3 | 13.7 ± 5.2 | p= 0.92 |
| MRI Parameters | ATTR-CA (n = 51, 73%) | AL-CA (n = 19, 27%) | p-Value |
|---|---|---|---|
| LV-EF (%) | 50 ± 12 | 62 ± 14 | p = 0.003 |
| LV-SV (ml) | 76 ± 20 | 66 ± 13 | p = 0.018 |
| LV-EDV (ml) | 157 ± 41 | 111 ± 31 | p < 0.001 |
| LV-ESV (ml) | 81 ± 34 | 45 ± 27 | p < 0.001 |
| LV-mass (indexed) g/m2 | 109.5 ± 37.8 | 78.9 ± 26.2 | p < 0.001 |
| IVS (mm) | 18 ± 4 | 15 ± 3 | p = 0.003 |
| LGE | 48 (96%) | 19 (100%) | p = 0.376 |
| QALE score | 10.8 ± 4.0 | 8.5 ± 5.3 | p = 0.049 |
| Atrial LGE | 37 (74%) | 10 (53%) | p = 0.089 |
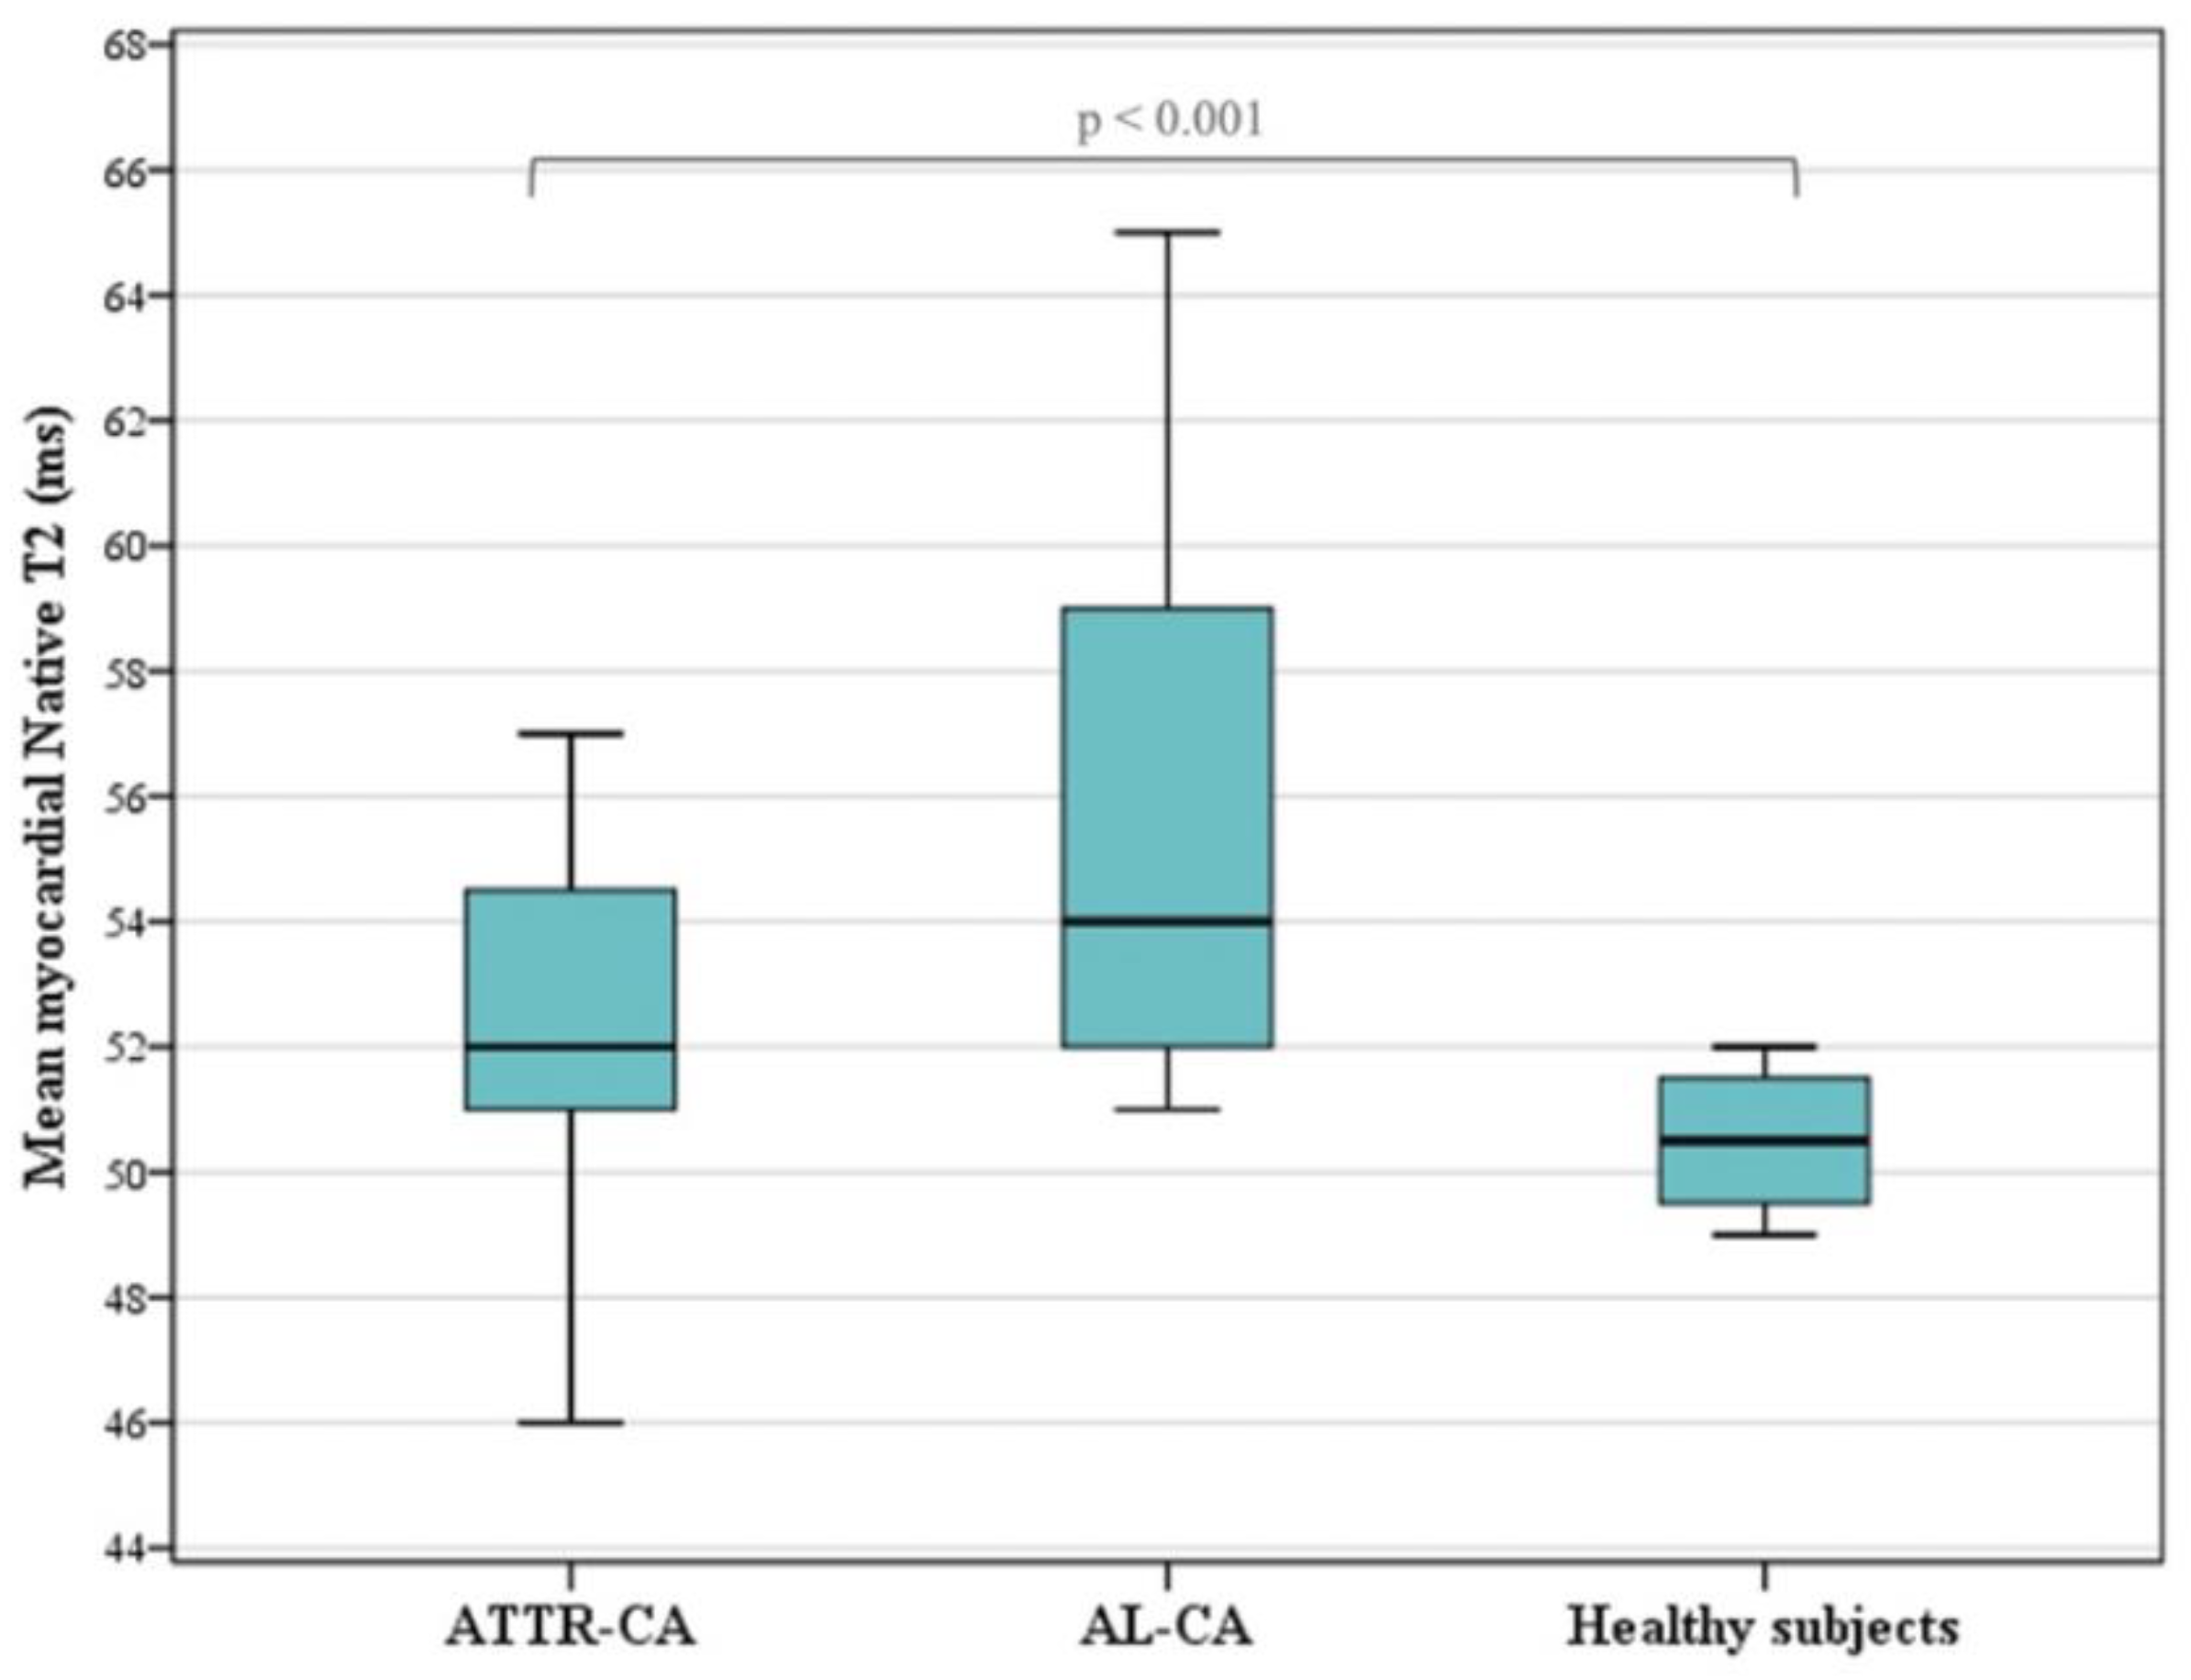
| Native T2 (ms) | 53.2 ± 4.5 | 56.0 ± 5.5 | p = 0.260 |
| Native T1 (ms) | 1066 ± 59 | 1062 ± 42 | p = 0.774 |
| ECV | 49 ± 10 | 44 ± 12 | p = 0.202 |
Disclaimer/Publisher’s Note: The statements, opinions and data contained in all publications are solely those of the individual author(s) and contributor(s) and not of MDPI and/or the editor(s). MDPI and/or the editor(s) disclaim responsibility for any injury to people or property resulting from any ideas, methods, instructions or products referred to in the content. |
© 2024 by the authors. Licensee MDPI, Basel, Switzerland. This article is an open access article distributed under the terms and conditions of the Creative Commons Attribution (CC BY) license (https://creativecommons.org/licenses/by/4.0/).
Share and Cite
Grazzini, G.; Pradella, S.; Bani, R.; Fornaciari, C.; Cappelli, F.; Perfetto, F.; Cozzi, D.; Giovannelli, S.; Sica, G.; Miele, V. The Role of T2 Mapping in Cardiac Amyloidosis. Diagnostics 2024, 14, 1048. https://doi.org/10.3390/diagnostics14101048
Grazzini G, Pradella S, Bani R, Fornaciari C, Cappelli F, Perfetto F, Cozzi D, Giovannelli S, Sica G, Miele V. The Role of T2 Mapping in Cardiac Amyloidosis. Diagnostics. 2024; 14(10):1048. https://doi.org/10.3390/diagnostics14101048
Chicago/Turabian StyleGrazzini, Giulia, Silvia Pradella, Rossella Bani, Chiara Fornaciari, Francesco Cappelli, Federico Perfetto, Diletta Cozzi, Simona Giovannelli, Giacomo Sica, and Vittorio Miele. 2024. "The Role of T2 Mapping in Cardiac Amyloidosis" Diagnostics 14, no. 10: 1048. https://doi.org/10.3390/diagnostics14101048