

Research on Deformation Safety Risk Warning of Super-Large and Ultra-Deep Foundation Pits Based on Long Short-Term Memory

1
Faculty of Public Safety and Emergency Management, Kunming University of Science and Technology, Kunming 650093, China
2
Yunnan Construction Investment No.6 Construction Co., Ltd., Yuxi 653199, China
*
Author to whom correspondence should be addressed.
Buildings 2024, 14(5), 1464; https://doi.org/10.3390/buildings14051464
Submission received: 19 March 2024
/
Revised: 9 May 2024
/
Accepted: 10 May 2024
/
Published: 17 May 2024
(This article belongs to the Special Issue Monitoring and Prevention of Dynamic Disasters in Deep Underground Engineering)
Abstract
:This paper proposes transforming actual monitoring data into risk quantities and establishing a Long Short-Term Memory (LSTM) safety risk warning model for predicting the deformation of super-large and ultra-deep foundation pits in river–round gravel strata based on safety evaluation methods. Using this model, short-term deformation predictions at various monitoring points of the foundation pits are made and compared with monitoring data. The results from the LSTM safety risk warning model indicate an absolute error range between the predicted deformation values and on-site monitoring values of −0.24 to 0.16 mm, demonstrating the model’s accuracy in predicting pit deformation. Additionally, calculations reveal that both the overall risk level based on on-site monitoring data and the overall safety risk level based on predicted data are classified as level four. The acceptance criteria for the overall risk level of the foundation pit are defined as “unacceptable and requiring decision-making”, with the risk warning control scheme being “requiring decision-making, formulation of control, and warning measures”. These research findings offer valuable insights for predicting and warning about safety risks in similar foundation pit engineering projects.
1. Introduction
With the development of the country and society, urban construction pit projects are displaying new characteristics, with the areas and depths of pit excavations progressively expanding, and the surrounding environments of pits growing increasingly intricate. These characteristics contribute to an annual rise in the likelihood of accidents during pit construction, leading to substantial economic losses for society and endangering workers’ safety. The most effective approach to preventing safety accidents during pit construction is to forecast and remain pre-emptively alert to the safety risks linked with pit deformation. Quantitative analysis methods are employed to investigate the deformation, safety status, and risk warnings associated with pits. Based on the research findings, appropriate prediction models are chosen to forecast pit deformation accurately, reflecting the deformation trend and safety status of pits. This methodology currently represents the primary research avenue for predicting pit deformations.
In recent years, numerous scholars have conducted extensive research on predicting and warning about excavation deformation in foundation pits, yielding significant findings. Based on empirical methods, Zhao [1] proposed a dynamic trend curve of non-linear deformation rates, quantitatively representing the deformation of each excavation stage of the pit with a power function. Lee et al. [2] introduced expert investigation methods for predicting pit deformations and provided training for construction personnel and excavation supervision based on the prediction results before construction to improve prediction accuracy. Guo et al. [3], conducted multidimensional and multi perspective research through various methods, and understood the complex deformation evolution characteristics and spatiotemporal effects of ultra large and ultra deep foundation pits. Hu et al. [4], based on grey theory, established a GM(1,1) model for predicting pit deformation, and its application to practical engineering examples demonstrated a close alignment between predicted and actual deformation patterns. Due to the rapid development of computer computing capabilities, many scholars have proposed utilizing neural network models for predicting excavation deformation in foundation pits. In their study on predicting deep pit stability, GHABOUSSI et al. [5] were the first to apply Artificial Neural Network theory to the field of pit engineering. He et al. [6] established a BP neural network model to predict the horizontal displacement of a certain pit support structure and ground settlement outside the pit. Li et al. [7] established a BP neural network model for predicting the horizontal displacement of underground continuous wall support structures in pits. Wang et al. [8], to improve the prediction effect of support vector machine models on the non-linear characteristics of pit monitoring data, optimized and improved their penalty functions and kernel functions using the particle swarm algorithm. Cui et al. [9] combined the GM(1,1) model with the BP network model and optimized it using the PSO algorithm to obtain a PSO-GM-BP model with high prediction accuracy and wide application. Kong al. [10] discussed the influence of different water contents on the shear strength characteristics of round gravel soil, and used the shear strength parameters of round gravel soil with different water contents to numerically simulate the excavation and support of super deep foundation pits.
The aforementioned algorithms are all static modeling methods, with room for improvement in their applicability to highly non-linear and time series data [11]. Long Short-Term Memory (LSTM) neural networks have unique capabilities in handling non-linearity and time series data. Yuan et al. [12] and Xu [13] utilized the advantages of LSTM in predicting time series data to predict pit deformations. However, due to the limited amount of prediction and validation data and the lack of specific explanation on model construction, the accuracy and reliability of the model cannot be fully demonstrated. Liang [14] used LSTM and RNN models to predict landslide displacement. Based on establishing the relationship between periodic terms, feature factors, and prediction models, they analyzed the errors between the predicted values and measured values and concluded that LSTM had better predictive performance for long time series data. Zhang et al. [15] studied the deformation of underground continuous walls in a subway deep pit and established LSTM, BP neural network, and grey theory models based on Python language to predict the deformation of underground continuous walls. The results showed that the LSTM model had the best prediction performance, with predicted values close to the measured values. Xia et al. [16], based on monitoring data, studied the overall safety status of pits, proposed safety risk warning standards based on actual monitoring values, and constructed an LSTM safety warning risk prediction model. Through comparative analysis of prediction results and measured data, they demonstrated that the LSTM model had good predictive performance and made judgments on the future safety of pits.
In summary, both domestic and international scholars have conducted extensive research on predicting excavation deformation in foundation pits and have achieved remarkable results. Due to the characteristics of the excavation of super-large and ultra-deep foundation pits in round gravel strata, the advantages of using LSTM models for predicting deformation in such pits are particularly prominent, effectively addressing the shortcomings of traditional methods. Currently, there are many studies on ordinary foundation pits, but there are also few reports on the prediction of deformation in super large and ultra deep foundation pits in round gravel strata; hence, this study takes a large-scale water purification plant’s riverside cobble strata foundation pit in Kunming City as its research background. It establishes an LSTM-based deep foundation pit deformation safety risk prediction and warning model, predicts the deformation of important monitoring items in the pit, and dynamically evaluates the overall safety risk status of the pit based on the method of transforming measured data into risk metrics. This enables determining overall safety risk warning levels. The research results can provide references for safety risk prediction and warning, as well as disaster prevention and control, for similar types of foundation pits.
2. Research Area Engineering Overview
This paper is based on the foundation pit project of a large-scale water purification plant in Kunming City. The construction project involves a fully buried underground sewage treatment plant. The northern side of the pit borders the Panlong River, while approximately 13 m southward from the central–west section of the pit lies the office building of the Panlong District People’s Government. Fengyuan Road borders the western side, while Baoyun Road borders the eastern side. The project site is located at the northern end of the Dianchi Fault Basin in Kunming. The basin has an irregular shape, but overall it is longer from north to south and narrower from east to west. The ground elevation ranges from 1901.89 to 1907.57 m, with a maximum height difference of about 5.68 m. The site is located at the northern end of the Kunming Basin, belonging to the Jinsha River system and the Dianchi Lake Basin, with well-developed surface water bodies; the groundwater level is mainly affected by atmospheric precipitation, with an increase in the rainy season and a decrease in the dry season, with a seasonal variation range of about 1.0–1.5 m. The observed static water level burial depth ranges from 1.6 to 5.2 m, and the water level elevation ranges from 1899.03 to 1903.48 m. The water level of the entire site is high in the east and low in the west, flowing and discharging towards the Panlong River. There is a certain slope in the groundwater surface. The exposed aquifers within the excavation range of the foundation pit are all highly permeable strata, rich in water layers. The underground water supply range of the foundation pit is wide, and the water volume is extremely abundant. The water level is buried shallow, which has a significant impact on foundation pit engineering.
According to geological survey, the foundation soil layer of the site is mainly composed of a quaternary artificial accumulation (Q4ml) layer: artificial filling; a quaternary alluvial (Q4al+pl) layer: clay, round gravel, and silt; and a quaternary swamp sedimentary layer (Q4h): peaty soil, organic soil. The main soil parameters are shown in Table 1.
The area of the pit covers approximately 70,000 square meters, with the long side measuring 465 m and the short side 198 m. The total perimeter measures approximately 1340 m. The support structure system of the pit utilizes a combination of supporting piles and prestressed anchors, supplemented by underground continuous walls and internal support. The depth varies from 7.8 to 17.9 m, reaching a maximum depth of 29.4 m in certain areas.
3. Introduction and Construction of Excavation-Induced Deformation Prediction Model
This paper employs Long Short-Term Memory (LSTM) neural networks for predicting pit deformations. The LSTM model is an evolution of Recurrent Neural Networks (RNN).
3.1. Recurrent Neural Networks (RNNs)
Traditional Artificial Neural Networks (ANN) undergo specialized processing to transform into Recurrent Neural Networks (RNN). This specialization involves connecting nodes within the hidden layer to each other and increasing self-feedback connections within the hidden layer, enabling the hidden layer nodes to memorize incoming information. This specialization endows RNNs not only with the ability to memorize historical data but also with the capability to apply the memorized historical information to the current neural network’s output calculation. As depicted in Figure 1, while new data are continuously input, the memorized information is also continually updated. Because of their capability to memorize historical information, RNNs possess unique functionality in predicting time series data [17].
According to Figure 1, the functionalities represented by xt and st are different. The former corresponds to the input sequence at time t, while the latter represents the memory unit of the RNN, indicating the hidden state at time t. The specific expression is , where the function f in the equation is typically a non-linear function, such as tanh or ReLU. The determination of st is jointly decided by the previous hidden state and the current input at time t, and the initial state st−1 is usually initialized to 0. Ot represents the output sequence at time t, and Softmax is the regression function, with its expression being Ot = softmax (Vst). In the structure of the RNN unit, U represents the connection weight between the input and hidden states; W represents the connection weight between the previous and current hidden states; and V represents the connection weight between the hidden state and output. The connection weights of the RNN model remain unchanged over time, significantly reducing the number of parameters in the model, distinguishing it from traditional neural networks.
3.2. Long Short-Term Memory Neural Networks (LSTM)
On the surface, RNNs can handle time series data well regardless of the length of the time series data [16]. However, in practical applications, RNNs’ learning ability gradually weakens when learning from long time series data. When learning from distant historical information, the shortcomings of “vanishing or exploding gradients” will continue to emerge. The concept of Long Short-Term Memory Network (LSTM) was originally proposed by Hochreiter and Schmidhuber in 1997, and later enhanced and applied by GRAVES et al. [18]. The introduction of LSTM resolves the issue of “vanishing or exploding gradient” in RNNs. Numerous studies have demonstrated that LSTM can effectively overcome the “defects” present in RNN models [19]. It was decided to use a Long Short-Term Memory Neural Network (LSTM) to predict the deformation of foundation pits as they can more accurately describe the long-term dependency relationship of time series.
LSTM neural networks consist of one input layer, one to multiple hidden layers, and one output layer, similar to traditional neural networks. The hidden layers of an LSTM contain numerous neurons known as memory cells, the structure of which is depicted in Figure 2.
According to Figure 2, the parameters ht and Ct determine the memory potential of LSTM networks. The former indicates that the ht at time t represents a hidden state, reflecting short-term memory. The latter, Ct, represents the state of the cell at time t. As time progresses, information is transmitted through these two parameters. “σ” represents the sigmoid function, and “tanh” represents the hyperbolic tangent function, respectively. Each of these storage units has three “gates”, each serving a distinct function:
- (1)
- Input Gate: The input gate determines the ratio of new memories merged with old memories.
- (2)
- Forget Gate: The forget gate selects which historical information to discard, preserving useful historical information and controlling the amount of historical information passed down.
- (3)
- Output Gate: The output gate governs the LSTM unit’s response to external stimuli and regulates the size of the output memory unit’s output.
The combined action of the unique functions of the three gates enables the LSTM model to exhibit Long Short-Term Memory capability.
3.3. Construction of LSTM Prediction Model
The structure of the LSTM model resembles that of other conventional neural network models, comprising an input layer, hidden layer, and output layer, with the hidden layer serving as the core component. The input layer primarily preprocesses input data to mitigate the impact of data irregularities on prediction outcomes and passes the processed data to the subsequent layer. Serving as the core component of the model, the hidden layer is endowed with the capability of Long Short-Term Memory, and it primarily conducts the prediction process. The output layer is primarily tasked with generating the predictions made by the preceding layer.
The simulation environment utilized in this paper was constructed using Python 3.9; it employed the open-source Keras and TensorFlow 2.0 as the backend of the deep learning framework to train and model the data in the training sample set. TensorFlow 2.0, developed by Google, served as the backend for deep learning. It is highly integrated and modular, functioning as an open-source library for Python programming.
3.3.1. Training and Prediction with LSTM Model
Utilizing LSTM model prediction is crucial for safety risk warning based on pit deformation prediction. The training process involves several steps: ① Preprocessing the monitoring data by removing abnormal data and smoothing the dataset. ② Normalizing the target data. ③ Dividing the target data into training and testing sets, and transforming the data for both sets. ④ Setting parameters such as epochs, train size, and batch size for the model. ⑤ Inputting the data into the model for training, selecting the Adam optimizer to update weights, until the training data meets the requirements. ⑥ Restoring the data, i.e., reverse normalization, and obtaining the predicted result after reverse normalization.
The model parameters required adjustment. Hence, during training, a trial-and-error approach was employed to fine-tune the model. Incorporating historical data methods, the model utilizes the first X data points as input and predicts the data at X + Y to mitigate the influence of other adverse factors on deformation prediction (X is the input state, Y is the hidden layer state). The optimized model obtained via trial and error was employed to predict pit deformation, thereby serving as the foundation for subsequent pit risk assessment and warning.
3.3.2. Processing of Monitoring Data
- (1)
- Data Preprocessing
During pit deformation monitoring, the presence of multiple influencing factors often leads to outliers in the monitored data. Therefore, prior to prediction, preprocessing the data involves removing outliers and conducting interpolation. Moreover, if the monitoring data comprises non-equidistant time series, interpolation is essential to convert it into equidistant time series data.
- (2)
- Data Normalization
To prevent data interference and expedite the search for the optimal solution, it is essential to normalize the training set data by scaling all values to the range of [−1,1] when the LSTM model processes the training data. The formula for normalization is shown in Equation (1).
In the formula, xmin represents the minimum value of the monitored data, and xmax represents the maximum value of the monitored data.
4. Safety Risk Early Warning in Foundation Pit Engineering
4.1. Establishment of Safety Risk Early Warning Index System
When selecting evaluation indicators, it is imperative to consider factors such as clear relevance, dependable monitoring technology, and the availability of reliable and sufficient data. Given the numerous influencing factors affecting the pit, the changes in monitoring data tend to be discontinuous. Therefore, meeting these conditions is essential for accurately reflecting the current safety status of the pit through data.
Drawing on existing research and integrating relevant construction standard specifications along with the analysis outcomes from each monitoring project, a secondary pit engineering safety risk warning indicator system is developed, illustrated in Table 2.
4.2. Risk Quantification Based on Monitoring Data
Assessing the overall safety status and risk classification of a pit involves converting the monitoring data and warning values into risk quantities, with the monitoring data serving as a prerequisite. Utilizing the research conducted by Peng Ming [20], each monitoring project within the pit is considered an evaluation risk indicator. Through dynamic evaluation, which involves converting actual measured values into risk quantities, the safety status of the pit is assessed. The specific implementation method is outlined as follows.
The risk quantity α of this monitoring project is:
In the formula, represents the actual monitoring value of the pit; is the rate of change of , where the magnitude of can reflect the risk information of the pit, and can be obtained through Formula (3):
In the formula, represents the current cumulative displacement value of a certain monitoring project for the ith time; xw represents the warning value of the monitoring project, reflecting the risk information reflected by the stability of the rate of change of , and can be obtained through Formula (4):
In the formula, represents the mean square deviation of the cumulative value change rate, obtained through Formula (5):
In the formula, Δxi represents the cumulative value change rate; represents the average value of the cumulative value change rate.
Building upon the aforementioned process, the risk level of the pit is determined by converting the measured values from various monitoring projects into risk quantities and utilizing these quantities as the foundation. Subsequently, pertinent risk management strategies are devised according to the determined risk level.
4.3. Risk Assessment and Determination of Risk Levels
During pit evaluation, the risk levels of different monitoring projects vary. The pit’s risk level directly impacts the assessment of its overall safety status. Hence, during evaluation, varying weights should be allocated to the risk levels of individual safety risk indicators. The greater the risk level, the higher the weight assigned. The formula for weight calculation is as follows:
In the formula, e represents the Euler’s number; r stands for the risk level corresponding to the indicator; and denotes the weight coefficient of the ith monitoring project under the risk level r.
The risk levels r and weight coefficients are classified based on the risk quantity α, as shown in Table 3.
In summary, the safety risk level of individual monitoring projects can be determined using methods such as risk quantity transformation and risk level determination. However, relying solely on a single project makes it difficult to reflect the overall safety risk status of a foundation pit. Only by analyzing the safety risk level of each project, and then based on the safety risk level of each monitoring project, can the overall safety risk level of the foundation pit be obtained through Formula (7) in order to truly reflect the safety status of the foundation pit.
In the formula, represents the overall safety status of the pit project; denotes the risk quantity of the ith monitoring project of the pit; indicates the weight when the risk level of the ith monitoring project of the pit is r; and m represents the number of risk indicators.
Thus, the objective of dynamically evaluating the pit is to facilitate decision-making for pit safety control. By conducting dynamic safety evaluations considering factors such as whether the LSTM prediction result surpasses the warning threshold, the risk quantity of individual monitoring projects, the overall safety status of the pit, and the risk level, the comprehensive risk level of the pit is derived from the evaluation outcomes. This risk level serves as the foundation for comparing with the risk acceptance criteria, enabling the determination of the extent of compliance with the criteria and the formulation of control measures for the entire pit. The risk acceptance criteria are detailed in Table 4.
5. Application of LSTM Model in Deep Excavations
5.1. Establishment of Risk Warning Index System
Based on the on-site monitoring investigation of this pit and the analysis of monitoring project risk sources, a three-tier safety risk warning index system was established, as shown in Figure 3. There are many factors affecting the safety status of the pit, but the main factors are the stability of the main structure itself and the changes in the surrounding environment. Therefore, the risk sources of the pit mainly consist of changes in the main structure and the surrounding environment.
As depicted in Figure 3, the objective of the pit deformation safety risk warning is the primary focus of this index system, with the main structure and surrounding environment serving as the primary indicators at the first level. Three second-level risk indicators exist for the main structure, comprising the vertical displacement and horizontal displacement of the top of the supporting pile, along with changes in anchor stress. Four second-level risk indicators pertain to the surrounding environment, including vertical displacement of the ground, roads, flood walls, and surrounding buildings around the pit.
By analyzing seven secondary risk indicators in detail, collecting their actual monitoring data, and demonstrating the feasibility of LSTM model prediction, the actual monitoring data are predicted. Based on the prediction results, the overall safety status and risk level of the foundation pit are dynamically evaluated, and the degree of risk acceptance criteria and control plans for the entire foundation pit are obtained.
5.2. Preparation of Predictive Data Samples
The safety risk warning index system necessitates extensive monitoring efforts to collect data from diverse indicator measurement points, alongside an understanding of the pit’s stability. Data collection was due by 20 August 2021, with selected indicator measurement points providing representative data samples, including D1-1 (vertical displacement of surrounding ground), FX6 (vertical displacement of flood wall), F1-1 (vertical displacement of surrounding roads), WY13 (horizontal displacement of top of supporting pile), W13 (vertical displacement), M3-237# (anchor force), and QZF2 (vertical displacement of surrounding buildings), totaling seven measurement points. The schematic diagram of the soil support structure and some measuring points is shown in Figure 4.
In predicting pit deformation, training the LSTM model is essential. During the training process, it is crucial to ensure the accuracy of model predictions by validating some of the data against the predicted results. Consequently, the entire currently collected dataset was divided into training and testing sets. The training set was divided into 2 days and 3–10 days as a sample. To ensure the consistency of the training set, the data from 24 June 2019 to 16 April 2021 were selected as the training set, and the data from 18 April 2021 to 20 August 2021 were used as the training set for comparing the prediction results of the next 47 periods.
5.3. Training and Prediction of the Model
The LSTM model was trained based on actual monitoring data, resulting in an ideal model comprising 4 input units and 35 output units in the input layer, 54 input units and 108 output units in the hidden layer, and 112 input units and 1 output unit in the output layer. The length of the window represents the four input units of the input layer, representing the step size of time. One output unit of the output layer represents “predicting the next day”, which uses the accumulated deformation data of the past four days to predict the accumulated deformation data of the next day, while the 54 and 108 units represent the cell units of the LSTM model within the hidden layer.
The weight tuning for the model employed the Adam optimizer with a learning rate of 0.0001, while the error function was MSE (mean squared error), and the maximum number of iterations (epochs) was set to 492. To attain the optimal prediction model, a trial-and-error method was employed to refine the structure of the LSTM neural network. Throughout the trial-and-error process, the dimensions of X and Y and the node counts in each layer were iteratively fine-tuned. Following extensive trials, the “4 + 1” combination mode was identified as yielding the most effective training outcomes, where X equals 4 and Y equals 1. Predictions were conducted for the dataset spanning from 18 April 2021 to 20 August 2021, and the corresponding results for each data point are depicted in Figure 5.
5.4. Analysis of Prediction Results
5.4.1. Comparison of Prediction Results
Based on the LSTM prediction results, a thorough analysis was conducted on the forecast outcomes pertaining to the W13 monitoring point. Subsequently, the training sample data for the W13 monitoring point were utilized as per the aforementioned steps, and Figure 6 illustrates the loss function graph for the training of the W13 model.
The loss function evaluates the data error by mapping the fitting outcomes to non-negative real numbers, thus quantifying the disparity between the observed data and the model’s predictions. The magnitude of the loss function mirrors the training effectiveness of the predictive model. A smaller loss function signifies a superior fit of the model. Successful training is indicated when the model’s loss function is lower than the expected error. Model training entails iterative data fitting, as depicted by the fitting curve in Figure 7.
The LSTM ideal model, obtained through trial and error, forecasts the cumulative displacement of point W13 for the next 47 periods. Figure 8 illustrates the comparison between the predicted results and the actual measurements.
5.4.2. Analysis of Predictive Results
- (1)
- Absolute Error Analysis
Figure 9 depicts a comparison between the absolute errors of the predicted results for point W13 and the actual monitoring values, accompanied by an error analysis.
Figure 9 reveals that the absolute errors between the LSTM-predicted values and the actual measurements span from −0.24 to 0.16 mm. Furthermore, the trend of the absolute error value is to increase first and then decrease. This suggests that the predicted results progressively converge towards the actual values and oscillate around the zero line, showcasing the commendable predictive capability of the LSTM model.
- (2)
- Analysis of Relative Error
Figure 10 illustrates the analysis of the relative errors obtained from comparing the predicted values of W13 with the actual measurements.
Figure 10 reveals that the maximum and minimum relative errors between the predicted and actual values of W13 are 1.13% and 0.0041%, respectively. The average relative error fluctuates around 0, with a value of 0.38%. The minor fluctuations in the relative error magnitude demonstrate the model’s excellent predictive performance.
5.4.3. Transformation of Predicted Results into Risk Quantities
- (1)
- Transformation of W13 Predicted Results into Risk Quantities
Employing the method of transforming measured data into risk quantities, the risk quantity of each risk indicator was computed and subsequently fitted. Utilizing the calculation results, the extent of the risk status for each monitoring project was determined, the risk level of each monitoring project was assessed, and ultimately, the overall safety status of the foundation pit was determined.
Utilizing LSTM modeling of the measured data, predictions for the next 47 periods of each monitoring project’s measurement points were derived. The predicted data from monitoring points were employed for conversion into risk quantities, subsequently followed by fitting the risk quantities for each indicator. Ultimately, the risk values for each monitoring project were established, and the corresponding risk levels were evaluated. Finally, the overall safety status of the foundation pit was determined based on the risk levels and corresponding calculations.
Due to space limitations, this paper utilizes measurement point W13 as a case study. Firstly, the risk quantity for W13 was computed. Subsequently, the results of the risk quantity were compared with those presented in Table 3 to determine the corresponding risk level. Finally, by comparing and analyzing the measured risk quantity with the predicted risk quantity, and the measured risk level with the predicted risk level, the comparison results are illustrated in Figure 11.
From Figure 11, it can be seen that the risk levels of the measured values and the predicted values are consistent, both at level five. Therefore, for monitoring point W13, whether it is the risk level of the measured values or the risk level of the predicted values, they are both “reject acceptance” and “immediately stop, rectify, avoid, or initiate contingency plans”.
Likewise, the predicted risk levels of every monitoring project within the foundation pit were computed to ascertain the foundation pit’s overall safety risk level.
- (2)
- Overall Risk Quantity of the Foundation Pit
We transformed the predicted and measured values of the selected monitoring points into risk levels, conducted statistical analysis on the resulting risk levels, and juxtaposed the predicted overall safety status of the foundation pit against the actual status, as delineated in Table 5.
Based on Table 5, the cumulative change in quantity is transformed into risk levels for each monitoring point. By referring to Table 3, the corresponding weight coefficients for each risk level can be acquired. Notably, the risk levels of the QZF2 and W13 points are categorized as level five, whereas those of the FX6 and WY13 points are rated at level four, denoting elevated risks. The risk level of the other three points is classified as low, indicating that their risk is not significant.
The overall safety status of the foundation pit can be computed using Formulas (6) and (7). Upon computation, the predicted overall safety risk level of the LSTM model is 1.17, aligning with level four; meanwhile, the actual monitored overall safety risk level of the foundation pit is 1.13, likewise corresponding to level four. Despite some variance between the risk levels predicted by LSTM and those observed in reality, the discrepancy is minor. Both indicate a level four risk, implying that the acceptance criteria and risk control measures should be deemed as “unacceptable and necessitating decision-making, formulation of control, and warning measures”. Therefore, it can be fully demonstrated that the LSTM prediction model has excellent stability prediction, can stably and reliably predict the deformation of any monitoring item and any measuring point in the super deep foundation pit of the round gravel stratum, and has a good prediction effect.
5.5. Risk Control Measures
As per the analysis in the preceding section, the overall risk level of the foundation pit stands at level four, indicating an unacceptable state. Accordingly, decisions must be made concerning the foundation pit, and pertinent control measures need to be devised to oversee the evolution of the foundation pit’s risk level and ensure its stable operation. Based on the risk quantities of each monitoring project presented in Table 5, the primary risk factors influencing the stability of the foundation pit include the vertical displacement of surrounding buildings and the vertical displacement of the top of the support piles, whereas the secondary risk factors encompass the vertical displacement of the flood protection wall top and the horizontal displacement of the top of the support piles. Thus, considering the actual conditions of the foundation pit and taking into account the primary and secondary risk factors, the pertinent decisions and risk control measures are delineated as follows:
- (1)
- Throughout the construction of the foundation pit, adherence to the construction principles of “layered, step-by-step, symmetrical, balanced, and time-limited” is imperative, particularly during the excavation of earthwork for the foundation pit. This entails ensuring vertical layering, horizontal segmentation, and employing the construction excavation method of supporting before digging.
- (2)
- While excavating earthwork for the foundation pit, strict adherence to the foundation pit’s design requirements for slope protection is paramount to prevent horizontal instability. Additionally, timely execution of construction on the prestressed anchor cables of the support system is crucial for minimizing the exposure time of the unsupported foundation pit. Moreover, controlling the horizontal deformation of the support piles is imperative, particularly in high-risk areas.
- (3)
- Increase monitoring frequency and strengthen inspection. Select experienced personnel and monitoring personnel to form a group, increase the frequency of monitoring high-risk projects, strengthen patrols, and when the monitoring displacement continues to increase, relevant experts should be hired to evaluate and investigate the reasons, and the foundation pit should be reinforced in a timely manner to control the deformation of the foundation pit and prevent the overall risk level of the foundation pit from increasing.
- (4)
- During excavation of a foundation pit to its base, it is imperative to promptly address the pit bottom and pour the cushion layer of the foundation pit to mitigate excessive uplift of the bottom unloading, which could significantly affect the vertical displacement of the supporting piles.
- (5)
- Minimize the surface load within the influence range of the foundation pit. Store materials necessary for foundation pit construction in areas with favorable soil layers or lower risk within the foundation pit. In situations where conditions are constrained and materials must be stored in higher-risk areas, ensure temporary storage and reinforce the foundation pit’s support system.
6. Conclusions
- (1)
- This study focuses on developing a prediction and warning model for deep foundation pit deformation, proposing a method to convert monitoring data into risk quantities, assessing the overall safety status of foundation pits, and establishing a safety risk warning model for deep foundation pit deformation based on LSTM. Comparative analysis was conducted on the relative and absolute errors between the predicted results and the measured data. The absolute error value was controlled within 0.24~0.16 mm, and the average relative error value was 0.38%. Both fluctuated around the zero line, proving the effectiveness and accuracy of the LSTM training model.
- (2)
- By calculating the safety risk level of the on-site monitoring data and predicted data for each monitoring project, the overall safety risk predicted by the LSTM model is 1.17, with a risk level of four; the actual monitoring of the overall safety risk of the foundation pit is 1.13, and the risk level is also level four. The acceptance criteria and risk control plan are “unacceptable and require decision-making, develop control and early warning measures”. Therefore, corresponding early warning and control measures are proposed for monitoring projects with high risk levels in foundation pits to ensure that the foundation pit can maintain safety and stability during operation.
- (3)
- In terms of predicting the deformation of foundation pits, the LSTM model has good accuracy and effectiveness, and can be used to predict the deformation of various monitoring items in super-large and ultra-deep foundation pits in round gravel strata. By utilizing a quantitative analysis method to convert predictive data into risk indicators, the model can accurately determine the risk levels of individual monitoring projects within the foundation pit and the overall safety risk level. A comparison with scientifically sound judgment criteria enables the assessment of foundation pit engineering safety, ensuring reliable risk management and control.
Supplementary Materials
The following supporting information can be downloaded at: https://www.mdpi.com/article/10.3390/buildings14051464/s1. Vertical displacement of surrounding roads.
Author Contributions
Conceptualization, Y.G.; methodology, Y.G.; software, C.L. and Y.G.; validation, Y.G., C.L., M.Y., R.M. and W.B.; formal analysis, Y.G., C.L., M.Y., R.M. and W.B.; investigation, Y.G., C.L., M.Y., R.M. and W.B.; resources, Y.G., C.L., M.Y., R.M. and W.B.; data curation, Y.G., C.L. and W.B.; writing—original draft preparation, Y.G. and C.L.; writing—review and editing, Y.G., C.L., M.Y., R.M. and W.B.; funding acquisition, Y.G. All authors have read and agreed to the published version of the manuscript.
Funding
This study was supported by the general projects of General projects of Yunnan Fundamental Research Projects (no. 202301AT070454); Special Project for Young Talents of Yunnan Province’s Xingdian Talent Support Program (no. XDYC-QNRC-2022-0182); The talent training fund of Kunming University of Science and Technology (no. KKZ3202367014); National Innovation and Entrepreneurship Training Project for College Student of China (nos. 2021106740085 and 2021106740086); B-level Science and Technology Plan Project of Yunnan Construction Investment Holding Group Co., Ltd. (no. 2024DJR005); Youth Innovation and Entrepreneurship Training Program for College Students of Yunnan Province (no. S202310674163); Key technology research and pilot test of underground coal gasification, a major scientific and technological research project of CNPC (no. 2019E-25).
Data Availability Statement
All relevant data are within the paper and Supplementary Materials.
Conflicts of Interest
Author Wei Bi was employed by the company Yunnan Construction Investment No.6 Construction Co., Ltd. The remaining authors declare that the research was conducted in the absence of any commercial or financial relationships that could be construed as a potential conflict of interest.
References
- Zhao, H.Y. Foundation pit deformation prediction based on power function form. J. Tongji Univ. (Nat. Sci. Ed.) 2003, 31, 899–901. [Google Scholar]
- Lee, S.; Halpin, D.W. Predictive tool for estimating accident risk. J. Constr. Eng. Manag. 2003, 129, 431–436. [Google Scholar] [CrossRef]
- Guo, Y.H.; Liu, S.Q. Characteristics of Deformation and Stability of Ultra-Deep Pit in Plateau Alluvial–Lacustrine Gravel Strata. Processes 2024, 12, 941. [Google Scholar] [CrossRef]
- Hu, D.; Zhang, X.P. Research on foundation pit deformation prediction based on grey system theory. J. Undergr. Space Eng. 2009, 5, 74–78, 168. [Google Scholar]
- Ghaboussi, J.; Sidarta, D.E. New method of material modeling using neural networks. In Numerical Models in Geomechanics, NUMOG VI, Proceedings of the Sixth International Symposium on Numerical Models in Geomechanics, Montreal, QC, Canada, 2–4 July 1997; Brookfield Town Garage: Brookfield, VT, USA, 1997; pp. 393–400. [Google Scholar]
- He, Z.Y.; Zheng, W. Deformation prediction of deep foundation pit based on BP neural network. J. South China Univ. Technol. (Nat. Sci. Ed.) 2008, 36, 92–96. [Google Scholar]
- Li, Y.J.; Xue, Y.D.; Yue, L. Deformation prediction of deep foundation pit based on genetic algorithm-BP neural network. J. Undergr. Space Eng. 2015, 11, 741–749. [Google Scholar]
- Wang, J.F.; Yao, Z.H. Deformation Prediction of Deep Foundation Pit Based on Particle Swarm Optimization to Support Vector Machine. Beijing Surv. Mapp. 2018, 32, 1322–1325. [Google Scholar]
- Cui, D.G.; Zhu, C.Q.; Li, Q.F.; Huang, Q.; Luo, Q. Research on deformation prediction of foundation pit based on PSO-GM-BP model. Adv. Civ. Eng. 2021, 2021, 1–17. [Google Scholar] [CrossRef]
- Kong, Z.J.; Guo, Y.H.; Mao, S.L.; Zhang, W. Experimental Study on Shear Strength Parameters of Round Gravel Soils in Plateau Alluvial-Lacustrine Deposits and Its Application. Sustainability 2023, 15, 3954. [Google Scholar] [CrossRef]
- Xu, S.L.; Niu, R.Q. Displacement prediction of Baijiabao landslide based on empirical mode decomposition and long short-term memory neural network in Three Gorges area, China. Comput. Geosci. 2018, 111, 87–96. [Google Scholar] [CrossRef]
- Yuan, Z.M.; Li, P.H.; Zhong, L. Settlement deformation prediction of deep foundation pit based on LSTM-GM neural network model. Jiangxi Univ. Sci. Technol. J. 2020, 41, 8–14. [Google Scholar]
- Xu, N. Research and Application of Deformation Prediction Model of Deep Foundation Pit Based on LSTM. Master’s Thesis, Jiangxi University of Science and Technology, Nanchang, China, 2019. [Google Scholar]
- Liang, Y.; Xiao, T.; Hu, C. Landslide displacement prediction based on long-term monitoring data and LSTM network. Signal Process. 2022, 38, 19–27. [Google Scholar]
- Zhang, S.J.; Tan, Y. Deformation prediction of foundation pit based on LSTM algorithm. Tunn. Constr. 2022, 42, 113–120. [Google Scholar]
- Xia, T.; Cheng, C.; Pang, Q.Z. Deformation safety risk warning of deep foundation pit based on long and short time memory network. Earth Sci. 2023, 1–8. [Google Scholar]
- Wang, X. Research on Key Techniques of Sentiment Analysis Based on Presentation Learning. Ph.D. Thesis, Harbin Institute of Technology, Harbin, China, 2017. [Google Scholar]
- Graves, A.; Schmidhuber, J. Framewise phoneme classification with bidirectional LSTM and other neural network architectures. Neural Netw. 2005, 18, 602–610. [Google Scholar] [CrossRef]
- Kiran, T. Computer vision accuracy analysis with deep learning model using tensor Flow. Int. J. Innov. Res. Comput. Sci. Technol. (IJIRCST) 2020, 8, 347–5552. [Google Scholar]
- Peng, M.; Huang, H.W.; Hu, Q.F. Development of dynamic risk database based on shield tunnel construction monitoring. J. Undergr. Space Eng. 2007, 3, 1255–1260. [Google Scholar]
Figure 1.
Overall structure of RNN units.

Figure 2.
LSTM storage structure diagram.

Figure 3.
Index system for safety risk early warning in foundation pit.

Figure 4.
Schematic diagram of supporting structure and some measuring points.

Figure 5.
Predicted results of LSTM model: (a) The predicted cumulative change quantities for QZF2, WY13, and M2−237; (b) the predicted cumulative change quantities for D1−1, F1−1, and FX6.
Figure 5.
Predicted results of LSTM model: (a) The predicted cumulative change quantities for QZF2, WY13, and M2−237; (b) the predicted cumulative change quantities for D1−1, F1−1, and FX6.
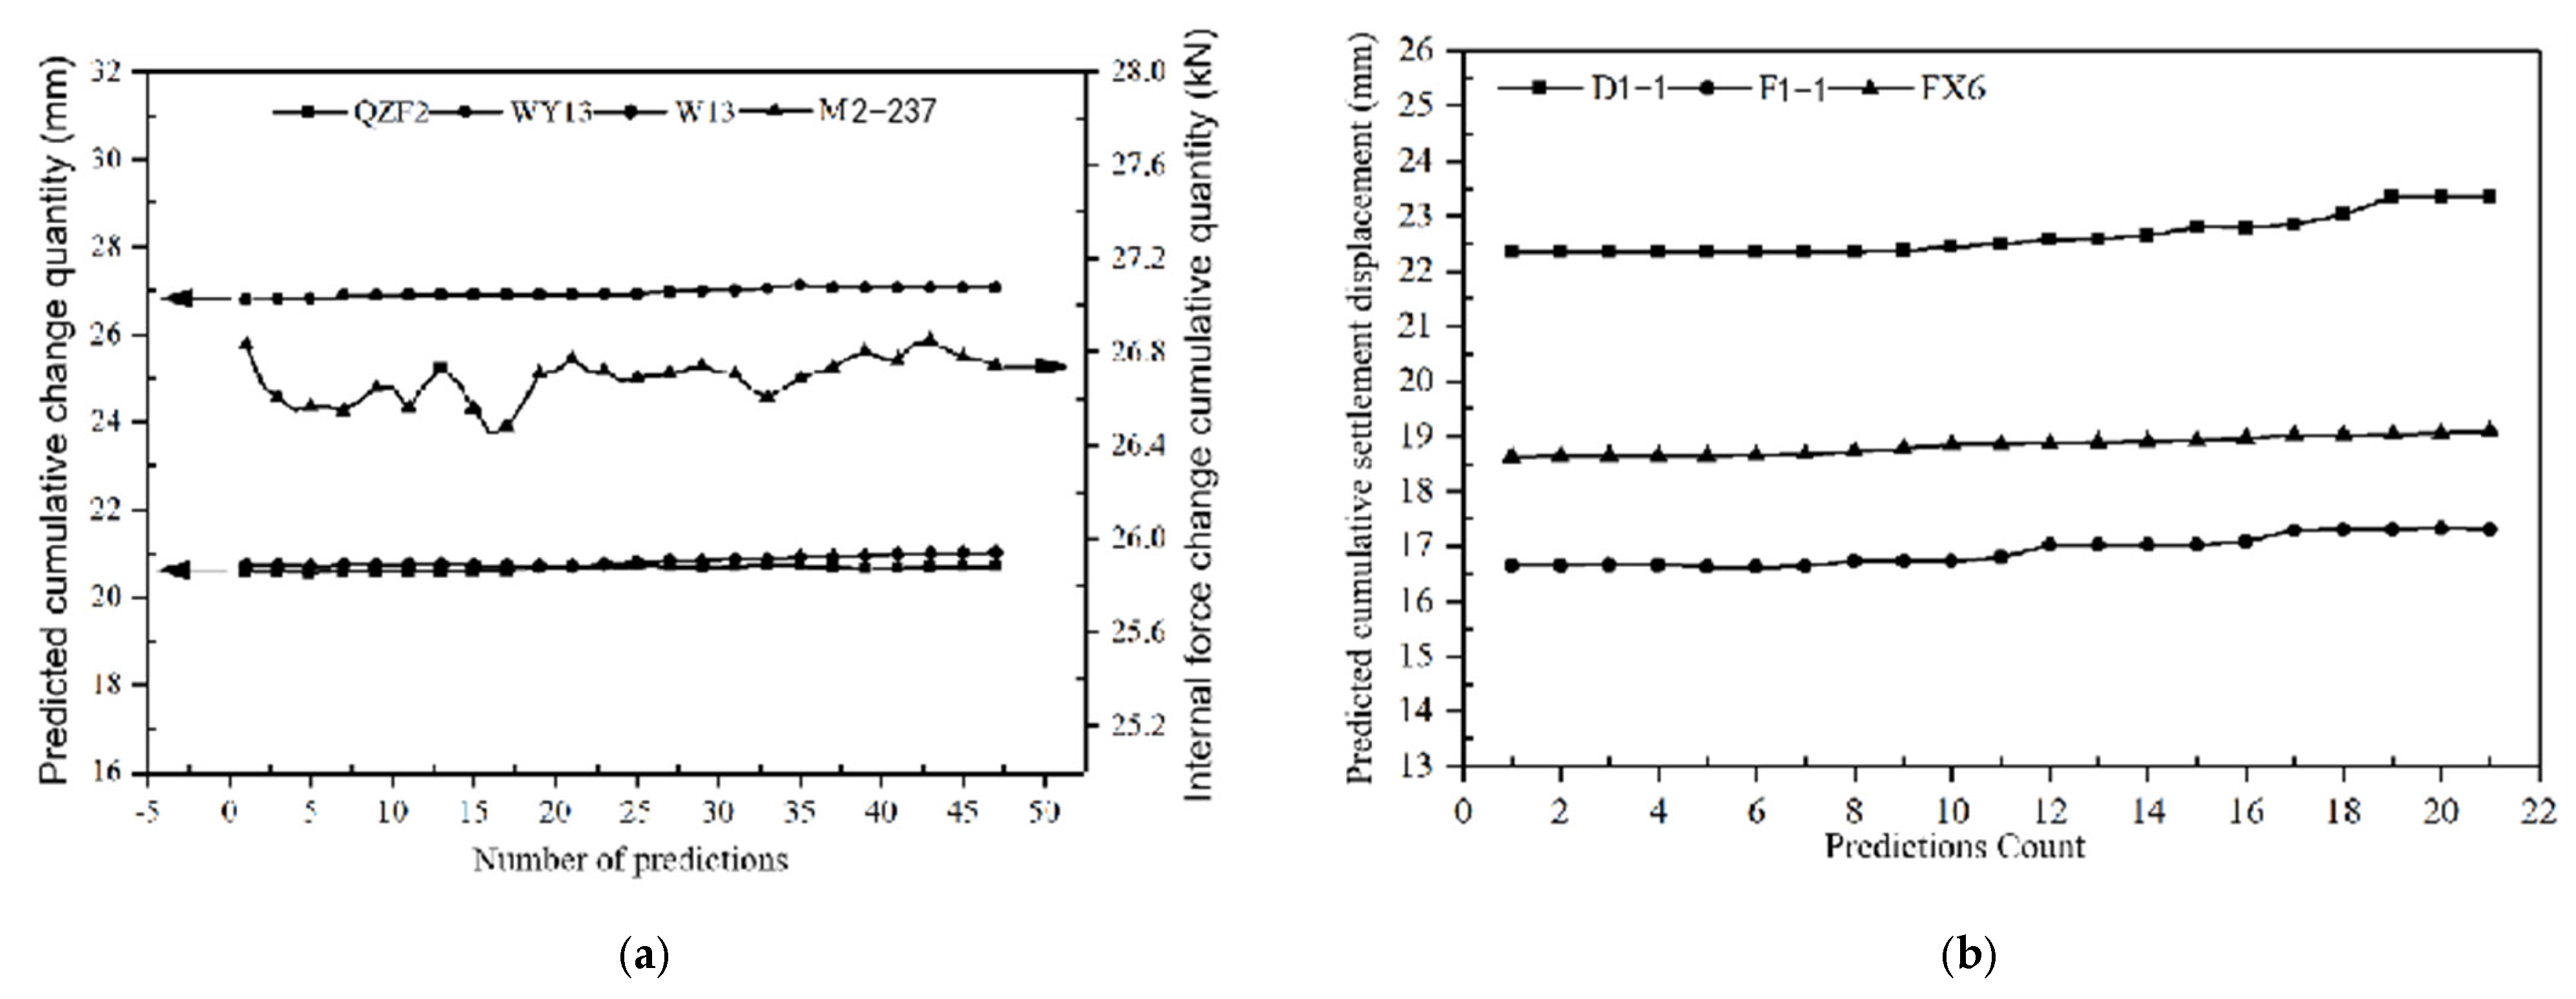
Figure 6.
Loss function plot of LSTM model for W13.
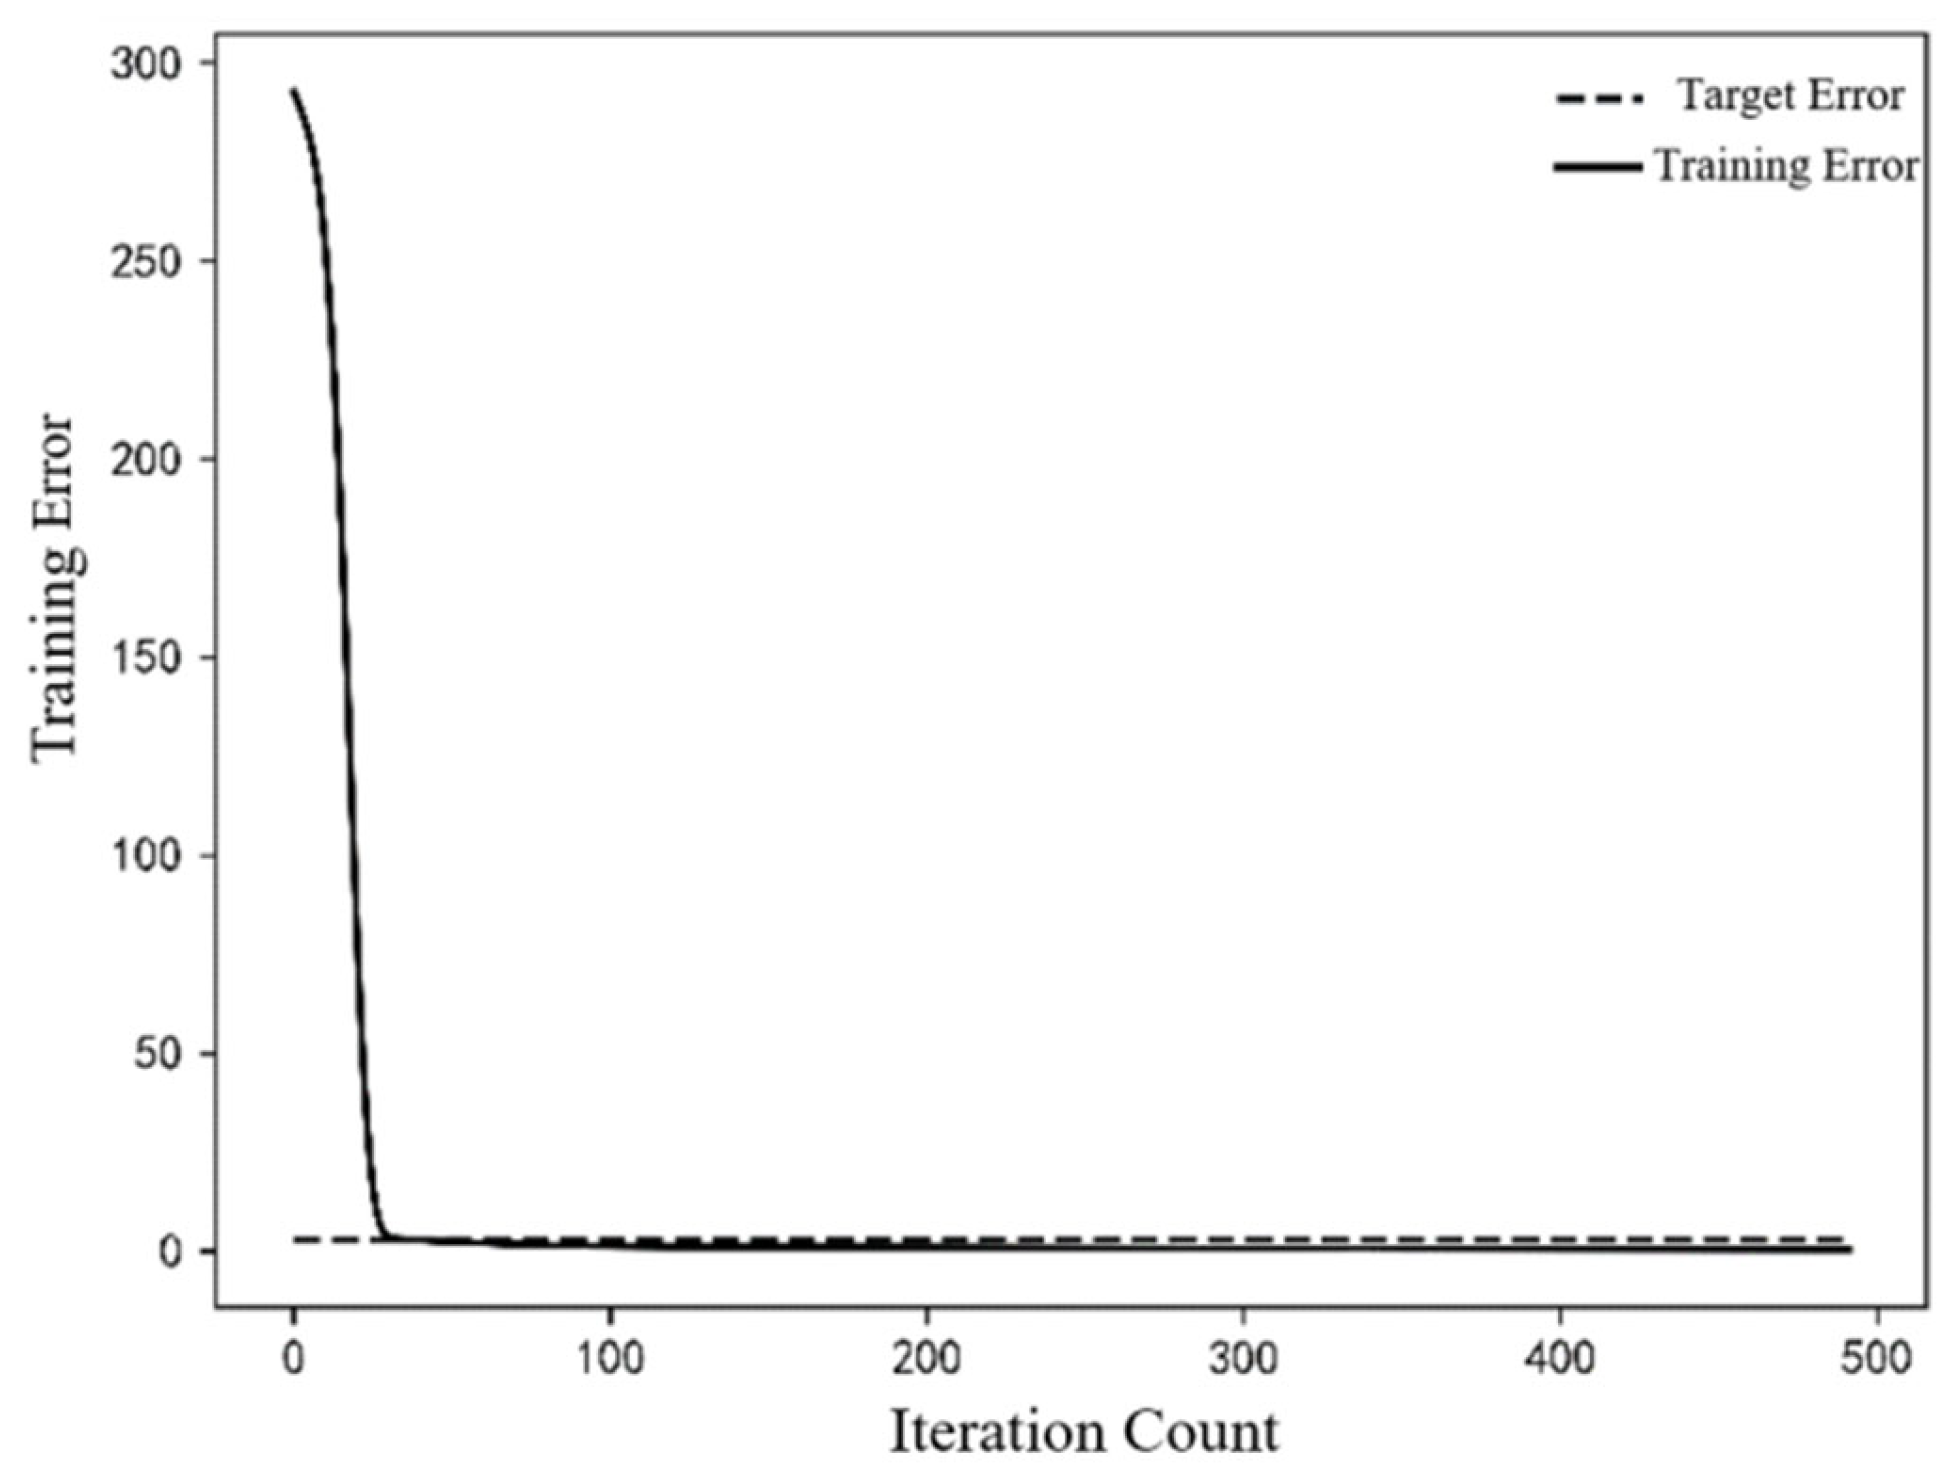
Figure 7.
Fitting curve plot of W13.

Figure 8.
Curve plot of comparison between actual and predicted values for W13 measurement points.

Figure 9.
Absolute errors between predicted and actual values for W13 measurement points.

Figure 10.
Relative errors between predicted and actual values for W13 measurement points.

Figure 11.
Transformation of predicted and actual values for W13 measurement points into risk quantities.
Figure 11.
Transformation of predicted and actual values for W13 measurement points into risk quantities.


Table 1.
Main soil parameters.
| Stratum | Elastic Modulus (MPa) | Poisson’s Ratio | Bulk Density (kN/m3) | Cohesive Force (kPa) | Internal Friction Angle (°) | Three Axis Test Secant Stiffness (kN/m2) |
|---|---|---|---|---|---|---|
| Artificial fill | 7.0 | 0.28 | 18.7 | 19.5 | 8.5 | 3850 |
| Peaty soil | 12.1 | 0.40 | 13.2 | 20.0 | 6.0 | 6655 |
| Silty clay | 16.0 | 0.30 | 19.0 | 40.0 | 12.0 | 8800 |
| Round gravel soil | 196.7 | 0.46 | 19.4 | 9.4 | 41.0 | 108,185 |
Table 2.
Index system for safety risk early warning in deep excavations.
| Objective | Primary Indicator | Secondary Indicator |
|---|---|---|
| Safety Risk Early Warning for Deep Excavation Deformation | Main Structure | Horizontal Displacement of Pile Head |
| Vertical Displacement of Pile Head | ||
| Anchor Stress | ||
| Surrounding Environment | Vertical Displacement of Surrounding Ground Surface | |
| Deformation of Surrounding Buildings or Structures | ||
| Vertical Displacement of Surrounding Roads | ||
| Vertical Displacement of Flood Protection Wall Top |
Table 3.
Risk level classification criteria and weight coefficients.
| <0.3 | 0.3~0.7 | 0.7~0.9 | 0.9~1.2 | >1.2 | |
|---|---|---|---|---|---|
| Risk level (r) | Level one | Level two | Level three | Level four | Level five |
| Weight coefficients () | 0.018 | 0.050 | 0.135 | 0.368 | 1.000 |
Table 4.
Overall risk acceptance criteria for foundation pit.
| Risk Level | Acceptance Criteria | Risk Warning and Control Plan |
|---|---|---|
| Level one | Negligible | Daily management and review |
| Level two | Tolerable | Need to strengthen attention, daily review, and management |
| Level three | Acceptable | Need to pay attention to and prevent risk, take monitoring measures |
| Level four | Unacceptable | Need to make decisions and formulate control and warning measures |
| Level five | Reject acceptance | Immediately stop, rectify, avoid, or initiate contingency plans |
Table 5.
Statistics of predicted and actual final risk quantities.
| Predicted Risk Quantity | Actual Risk Quantity | ||||
|---|---|---|---|---|---|
| Measurement Point | Risk Quantity | Weight | Measurement Point | Risk Quantity | Weight |
| D1-1 | 0.49 | 0.050 | D1-1 | 0.70 | 0.050 |
| FX6 | 1.04 | 0.368 | FX6 | 1.07 | 0.368 |
| M2-237 | 0.20 | 0.018 | M2-237 | 0.20 | 0.018 |
| QZF2 | 1.24 | 1.000 | QZF2 | 1.21 | 1.00 |
| WY13 | 1.08 | 0.368 | WY13 | 1.02 | 0.368 |
| W13 | 1.26 | 0.368 | W13 | 1.26 | 0.368 |
| F1-1 | 0.40 | 0.050 | F1-1 | 0.56 | 0.050 |
| αt | 1.17 | αt | 1.13 | ||
Disclaimer/Publisher’s Note: The statements, opinions and data contained in all publications are solely those of the individual author(s) and contributor(s) and not of MDPI and/or the editor(s). MDPI and/or the editor(s) disclaim responsibility for any injury to people or property resulting from any ideas, methods, instructions or products referred to in the content. |
© 2024 by the authors. Licensee MDPI, Basel, Switzerland. This article is an open access article distributed under the terms and conditions of the Creative Commons Attribution (CC BY) license (https://creativecommons.org/licenses/by/4.0/).
Share and Cite
MDPI and ACS Style
Guo, Y.; Li, C.; Yan, M.; Ma, R.; Bi, W. Research on Deformation Safety Risk Warning of Super-Large and Ultra-Deep Foundation Pits Based on Long Short-Term Memory. Buildings 2024, 14, 1464. https://doi.org/10.3390/buildings14051464
AMA Style
Guo Y, Li C, Yan M, Ma R, Bi W. Research on Deformation Safety Risk Warning of Super-Large and Ultra-Deep Foundation Pits Based on Long Short-Term Memory. Buildings. 2024; 14(5):1464. https://doi.org/10.3390/buildings14051464
Chicago/Turabian StyleGuo, Yanhui, Chengjin Li, Ming Yan, Rui Ma, and Wei Bi. 2024. "Research on Deformation Safety Risk Warning of Super-Large and Ultra-Deep Foundation Pits Based on Long Short-Term Memory" Buildings 14, no. 5: 1464. https://doi.org/10.3390/buildings14051464
Note that from the first issue of 2016, this journal uses article numbers instead of page numbers. See further details here.