
Optimizing Microwave-Assisted Extraction from Levisticum officinale WDJ Koch Roots Using Pareto Optimal Solutions


1
Future Production AS, Svanedamsveien 10, 4621 Kristiansand, Norway
2
Department of Machinery Exploitation and Management of Production Processes, University of Life Sciences in Lublin, Akademicka 13, 20-950 Lublin, Poland
3
Department of Landscape Management, Faculty of Agriculture and Technology, University of South Bohemia in České Budějovice, 370 05 České Budějovice, Czech Republic
4
Department of Plant Production, Faculty of Agriculture and Technology, University of South Bohemia in České Budějovice, 370 05 České Budějovice, Czech Republic
*
Author to whom correspondence should be addressed.
Processes 2024, 12(5), 1026; https://doi.org/10.3390/pr12051026
Submission received: 18 April 2024
/
Revised: 10 May 2024
/
Accepted: 15 May 2024
/
Published: 18 May 2024
(This article belongs to the Special Issue Synthesis and Extraction Processes of Biotechnological Drugs of Plant Origin)
Abstract
:The current research trend is not only focused on advanced techniques to intensify the extraction of bioactive compounds from plants, but also on the optimization process. The objective of this work was the implementation of the multiple criteria analysis using navigation on Pareto sets to determine the optimal parameters for the microwave-assisted extraction of Levisticum officinale WDJ Koch roots in order to obtain the maximum efficiency of the antioxidant potential of the extracts. The optimized parameters were extraction time, microwave power, and plant biomass/solvent ratio, while the evaluation criteria were based on the total phenols, flavonoids, reducing sugars, and antioxidant capacity. It was shown that the process parameters analyzed, i.e., biomass/solvent ratio, process time, and microwave power, determined the extraction efficiency of total phenolic content (TPC). A different observation was made for the analysis of total flavonoid content (TFC) and total antioxidant potential (TAA). Compared to the assessment of TFC and TAA, a completely different trend was observed for the analysis of total reducing sugars (RSC). Sets of Pareto optimal, compromise, and preferred solutions were identified that will maximize the efficiency of the extraction of bioactive compounds from biomass. Due to the determined number of Pareto optimal solutions, an approach related to the introduction of preferences in the optimization procedure was applied. It was shown that for a satisfactory level of bioactive compounds, extraction should be carried out at a maximum microwave power of 750 W. Preferred solutions were obtained for root biomass to water ratios ranging from 0.0536 g/mL to 0.0679 g/mL. The preferred optimal time for microwave-assisted water extraction ranged from 64.2857 to 85.7143 s.

1. Introduction
The plant Levisticum officinale WDJ Koch, or lovage, is a member of the Apiaceae family. It is a rich source of many classes of secondary metabolites, with a broad spectrum of pharmacological and therapeutic activities [1,2,3,4,5]. Many active compounds, such as phenolic compounds or flavonoids from plants, have a range of beneficial health properties. However, its potential is not only limited to pharmacological applications [6,7,8]. Indeed, studies show that the active compounds contained in plant extracts may also have the potential to biostimulate crop plants [8,9]. The extraction of phytochemicals from lovage roots has been studied, but research in this area has mainly focused on conventional solvent extraction and oil extraction efficiency. Currently, advanced extraction techniques for enhancing the extraction of phenolic compounds from herbal materials are being researched, which include pressurized extraction (PLE) [10], microwave-assisted extraction (MAE) [11] and ultrasound [12], or supercritical fluid extraction [13]. However, it is important to underline the fact that an extraction technique can be described as “green” and environmentally friendly, as well as cheap, when the used solvent is water. Currently, among extraction technologies, microwave-assisted extraction (MAE) deserves special attention [14,15]. Its main advantages over conventional methods, include, in particular, the increased speed of the process, as well as the improved efficiency of the extraction of bioactive compounds at a reduced cost [16,17]. A study by Vinatoru et al. [18] indicates that microwave-assisted extraction of the plant matrix is a beneficial technique because it is associated with the homogeneous internal heating of the entire volume of the material, resulting in increased pressure inside the plant cells, causing them to burst and efficiently release the desired bioactive compounds. However, for the extraction efficiency and stability of the extracted compounds, the process parameters should be selected individually for each plant matrix. It should also be emphasized that, despite the fact that each extraction technique is distinguished by certain advantages and limitations, each should be optimized individually with respect to the plant material and phytochemicals of interest (maximization of extraction) [19].
As mentioned earlier, the beneficial pharmacological properties of aromatic or herbal plants are generally related to the presence of a variety of plant secondary metabolites with different structures. From the point of view of crop physiology, polyphenolic compounds with strong antioxidant capacity can be used in crop biostimulation [20]. Indeed, phenolic compounds influence plant growth and development by stimulating seed germination, increased biomass accumulation, and improving plant metabolism [21,22,23]. Extracts with high polyphenol content have different compositions, depending on the source of extraction, extraction conditions and techniques, and extraction solvent. Consequently, these aspects need to be investigated for future agronomic applications [23]. The benefits of phytochemicals, as indicated in the subject literature, and the drive to replace synthetic fertilizers and crop protection products with natural substances have led to increased research efforts to discover and use bioactive compounds from natural sources such as aromatic plants for crop biostimulation [23,24,25]. Due to the fact that there is a growing awareness of the negative impact of agrochemicals and the ongoing transformation towards “green agriculture”, the use of natural biostimulants is becoming increasingly popular globally [26]. Research indicates that natural biostimulants have a positive effect on overall plant productivity and yield quality, as well as on reducing the impact of biotic and abiotic stress-inducing factors on plants [26,27].
The objective of this research was the implementation of the multiple criteria analysis using navigation on Pareto sets to determine the optimal parameters for the microwave-assisted extraction of Levisticum officinale roots in order to maximize the antioxidant potential of the extracts. The parameters for optimization were extraction time, microwave power, and plant biomass/solvent ratio, while the evaluation criteria were based on the total phenolic content, flavonoids, reducing sugars, and antioxidant capacity (as determined by DPPH) of the extracts. It is hoped that such systematic studies will greatly expand the knowledge regarding the application of microwave-assisted extraction for the advanced processing of lovage into high-value natural components for agronomic applications.
2. Materials and Methods
2.1. Plant Material
The dried roots of an organically grown Levisticum officinale L. (sourced from Runo Polska, PL-EKO 07 EU Organic Farming, Poland) were ground into powder (fraction size of 500 μm). The ground powder was stored at 4 °C in airtight bags until further use.
2.2. Microwave-Assisted Extraction (MAE)
The extraction of lovage root biomass was carried out using 100 mL of water (at pH 7.0) as the extraction solvent in a laboratory microwave oven (JT358, Whirlpool, Benton Harbor, MI, USA). The device is equipped with a digital control system for regulating irradiation time and microwave power. For MAE, the independent variables were: extraction time (30, 60, and 90 s); microwave power (550, 650, and 750 W), and the ratio of plant biomass/water (w/v) (2.5 g/100 mL (0.025 g/mL), 5 g/100 mL (0.050 g/mL), and 7.5 g/100 mL (0.075 g/mL)). Each process was carried out in triplicate. After MAE treatment, the extract was centrifuged (9500 rpm, 20 min) and filtered through a Büchner funnel lined with Whatman No. 1 filter paper, and the supernatant was collected in dark glass bottles and stored at 4 °C, pending further use and analysis.
2.3. Bioactive Characterization of Obtained Extracts
The total content of phenolic compounds (TPC) was determined in the obtained extracts from Levisticum officinale based on the Ribeiro method [28], using Folin–Ciocalteu reagent. The quantitative assessment of TPC levels in the extracts was expressed as mg gallic acid equivalent/g extract. The extracts were also assessed for total flavonoid content (TFC), according to the method of Iqbal et al. [29]. TFC levels were expressed as the catechin equivalent (μmol/L). The total antioxidant activity (TAA) was also determined using the DPPH (2,2-diphenyl-1-picrylhydrazyl) test, employing the method of Lee et al. [30]. The scavenging activity (inhibition of the DPPH radical by the sample) was expressed as the percentage of DPPH decrease. The reducing sugars content (RSC) was analyzed, based on the method using DNSA (3,5-dinitrosalicylic acid) proposed by Krivorotova and Sereikaite [31]. The total concentration of reducing sugars in the samples was expressed as g of D-glucose equivalent (GE) per L of extract.
2.4. Mathematical Model
The analysis of the possibility of increasing the efficiency of the microwave-assisted water extraction of bioactive compounds from the roots of Levisticum officinale was based on the created mathematical models and optimization tools based on computer computation and simulation packages (Matlab R2021a). The optimization procedure began with the creation of multivariate regression models (experimental data). The decision variables were sample/solvent ratio (g/mL) (x1), microwave power (W) (x2), and time of microwave assisted extraction (s) (x3). Multivariate polynomials were used to define the relationship between the criteria and decision variables:
The predictive accuracy of the models was analyzed based on the values of the R2 coefficient, adjusted R2, and MSE (mean squared prediction error). R2 is defined as the ratio of the sum of squares of regression (SSR) and the total sum of squares (SST). SSR is defined as [32]:
The adjusted R2 was also determined:
- —degrees of freedom
- —sum of squares due to error
- —the sum of squares about the mean
The mean squared prediction error (MSE) was determined as the mean square deviation between the experimental data and the values resulting from the adopted model:
2.5. Multi-Objective Optimization
In the presented optimization task, a four-dimensional space of decision criteria was adopted: K = [K1, K2, K3, K4] ∈ R4. The objective of the multi-criteria optimization task was to produce an extract from the roots of Levisticum officinale, characterized by the maximum value of all the decision criteria:
The optimization procedure is shown in Figure 1.
The decision criteria corresponded to the individual quality characteristics of extracts from Levisticum officinale: K1—TPC (total phenolic content) (mg GAE/g); K2—TFC (total flavonoids content) (μmol CAT/L); K3—TAA (total antioxidant activity) (DPPH-% inh); K4—RSC (reducing sugar content) (g GE/L). These criteria were calculated for a specific set of decision variables for the microwave-assisted extraction process. The following parameters of the extraction process were adopted as decision variables: x1—sample/solvent ratio (g/mL), x2—microwave power (W), and x3—time (s).
The domain of decision variables was defined by the following formula:
Constraints imposed on decision variables x1–x3 were assumed as follows:
The values of the four individual criteria for a fixed domain of the set of variables D were determined based on a multivariate approximation of the experimental results.
The multi-objective optimization task consisted of determining a set of solutions in set D for decision criteria that meet the conditions for achieving the maximum values.
The decision criteria were scaled to dimensionless values and normalized as follows:
where Kimin and Kimax are the smallest and largest values of the criteria for the analyzed domain of the decision variables, respectively. The standardization procedure used allows for comparison of the values of the criteria describing different quantities and expressed in different units. The maximum value of the actual criterion corresponds to the value 0 in the space of standardized criteria.
The set of all possible Pareto optimal solutions was determined, and then the explicit form of the set of dominated and non-dominated solutions for extracts from Levisticum officianle in the criteria space was determined (set in a four-dimensional criteria space). In order to analyze and visualize these sets, subsets of the four-dimensional space (K1, K2, K3, K4) in three-dimensional and two-dimensional criterion spaces were considered [33].
2.6. Smart Pareto Filter—Pareto Frontier Exploration Using Weighting of Decision Criteria
The method for obtaining a smart representation was used. In the proposed method, the multi-objective optimization of the Pareto front topology is based on the weighted sum method. The weighted sum method is a useful approach for many practical multi-subject optimization problems [34,35]. The procedure diagram is shown in Figure 2. The following were adopted for the decision criteria:
After entering the importance of individual criteria, the following form was obtained:
The criteria were assigned weights based on the following equation:
Figure 2.
Methodology of smart Pareto set.

For criteria K1–K3, the value of w1, w2, and w3 was 0.3. However, for K4, the value of w4 was 0.1.
Using this approach, it was possible to determine the so-called “preferred” solutions from the Pareto front.
2.7. Reducing the Set of Pareto Optimal Solutions—The Compromise Solutions
In this optimization procedure, the definition of the Utopia point was adopted, i.e., the ideal point that maximizes the goals simultaneously (the so-called unattainable point) [36]. Therefore, the concept of achievable compromise solutions on the Pareto front, with the minimum distance from the Utopia point (dU), was introduced. To find this compromise solution on the Pareto front, first, the objective functions were normalized to the range [0, 1]. A graphical representation of the procedure is shown in Figure 3.
In the next step, the Euclidean distance of all solutions on the Pareto front was determined, measured from the ideal point. Therefore, in order to analyze the set of possible solutions, a Euclidean metric of the form was introduced in the space of the standardized decision criteria, as follows:
where K0 = (0, 0, 0, 0) is the origin of the coordinate system, or the so-called Utopian solution.
Pareto optimal solutions with the minimum distance from the Utopia point were indicated as the best solution from a given set (dU). The obtained solutions can be treated as the best solutions from the obtained Pareto set in terms of the equal satisfaction of the all criteria.
2.8. Statistical Analysis
An analysis was performed in Matlab 7.0 using the F-statistic to test the statistical significance of the model. The values of the F-statistic (F-statistic for testing the final model vs. no model, mean only) allowed for the assessment of the significance of the elements or components of the model. The SSE—the sum of squared errors (residuals)—was given, defined as a numerical value. The SSR—the sum of squares due to regression—or the explained sum of squares (ESS)—the sum of the differences between the predicted value and the mean of the dependent variable—were also calculated, as well as the pval, a vector of p-values for testing whether elements of b are 0.
3. Results
3.1. The Mathematical Models—Multivariate Regression
The first step for the multi-criteria optimization of microwave-assisted extraction (MAE) was to build adequate response models (criteria) of TPC, TFC, TAA, and RSC for the process input parameters (biomass/solvent ratio, microwave exposure time, and microwave power). The effects of the decision variables (extraction process parameters) on the extraction efficiency of phenolic compounds, flavonoids, carbohydrates, and antioxidant potential are shown in Figure 4, Figure 5, Figure 6 and Figure 7.
The regression model for total phenolic content is presented in Equation (1).
The R2 coefficient of 0.813 in good agreement with the Adj R2 coefficient of 0.716 (difference = 0.097), with a mean squared prediction error (MSE) value of 212.794 (Table 1), indicating that the model for total polyphenol content (TPC) can be used to navigate the design space.
The regression models for total flavonoid content (criterion K2) and total antioxidant potential (criterion K3) reflected the experimental data equally well (Equations (2) and (3)).
The determined values of the R2 coefficients were 0.821 and 0.820, respectively, while the adjusted R2 values (Adj R2) reached 0.7260 and 0.7225. It was therefore concluded that the generated polynomial equations could be applied to the optimization procedure for the MAE extraction parameters for maximizing the K2 and K3 criteria.
The regression equation for RSC is presented in Equation (4).
The best fit of the models to the experimental results was obtained for RSC (reducing sugar content). For this criterion, the R2 was 0.8900, with a corrected value for this indicator of 0.8300 (difference of 0.0600). This indicates the predictive ability of the model for RSC.
It was shown that the process parameters analyzed, i.e., biomass/solvent ratio, process time, and microwave power, determined the extraction efficiency of the total phenolic content (TPC). Increased microwave power, to 650 and 750 W, led to increased levels of TPC in aqueous extracts. Similar effects were observed when the microwave exposure time was increased on the plant biomass in the solvent. The high total levels of phenolic compounds in the extracts resulted from the extraction procedure in which the ratio of the Levisticum officinale root biomass to water was the highest. The extracts, obtained with a plant sample to water ratio of 0.075, expressed a higher concentration of the total phenolic compound pool.
A different observation was made for the analysis of total flavonoid content (TFC). Admittedly, all process parameters shaped the value of this criterion, but to a completely different degree than for TPC. It was shown that exceeding the limit of the extraction process parameters led to a decrease in the level of flavonoids in the extracts (Figure 5). In general, prolonging the extraction procedure resulted in an increased TFC content in the samples analyzed. However, when the effect of the ratio of Levisticum officinale root biomass to solvent volume was assessed, it was found that flavonoid extraction reached increased levels for the average indicator analyzed (0.050 g/mL). In addition, it was found that at increased microwave power, of the order of 650 and 750 W, similar amounts of flavonoids were already observed in the extracts.
Similar relationships with the analysis of total flavonoid content were observed when assessing total antioxidant potential (TAA). An occurrence of a certain TAA extreme was noted, and after certain process parameter limits were exceeded, the analyzed quality characteristic of the extracts decreased. For an increase in antioxidant activity, the average analyzed process time was more favorable, as was the average biomass/water ratio (0.050 g/mL). In addition, it was noted that the highest microwave power analyzed led to extracts with higher antioxidant potential.
Compared to the assessment of TFC and TAA, a completely different trend was observed for the analysis of total reducing sugars in the extracts. The models generated indicate the parameters at which there was a sharp decrease. This was the case for a biomass-to-solvent ratio value of 0.050 g/mL. Increasing the exposure time of the samples to microwaves led to an increase in RSC levels. When analyzing the effect of microwave power, it was shown that for 550 and 650 W, similar concentrations of reducing sugars occurred. Increasing this parameter only, up to the maximum analyzed in the experiment, resulted in increased differences in RSC in the extracts (Figure 7).
3.2. Multi-Criteria Optimization of Microwave-Assisted Aqueous Extraction Process
The generated models in the form of multivariate regression equations, supported by the interpolation of multivariate polynomial equations, were then used in multi-criteria (multi-objective) optimization procedures. Thus, by combining all equations, it was possible to create a so-called global model for multi-objective optimization, which made it possible to predict multiple output signals (TPC, TFC, TAA, RSC) as a function of the input process parameters (x1, x2, x3). The predictive outputs (criteria) indicate the possibility of global insights into the entire extraction process efficiency domain under study, which was expressed in terms of maximizing the values of the individual criteria. Figure 8 and Figure 9 show Pareto fronts in the two-dimensional and three-dimensional decision criteria space (after normalization for the maximized criteria, 0 is the best case scenario). Due to the demonstrated complexity, the analysis of the research problem required visualization of the results of multi-objective optimization (Figure 10) with representation of the Pareto-optimal solution sets in the space of the decision variables x1 (sample/solvent ratio), x2 (microwave power), and x3 (time). The analysis of the Pareto fronts showed that the edge is a multiconsistent set. It should be emphasized that the process parameters of microwave-assisted aqueous extraction (x1, x2 and x3) simultaneously influenced the objective function of the identified domain. Thus, the mathematical model of the four-objective optimization problem, determining the extraction process, focused on finding parameters such that x = (x1opt, x2opt, x3opt) in the analyzed domain.
In the multi-object Pareto front shown in Figure 8, POS, obtained as a result of optimization in the space of decision variables (microwave-assisted extraction process parameters), shows the multiplicity of Pareto optimal solutions (possible scenarios for decision-making). This therefore indicates the need to consider the problem of maximizing the bioactive compounds in extracts by designing them in conjunction with a real-world situation (process analysis of optimization results using the decision maker). Therefore, the decision maker can choose the parameters for microwave-assisted aqueous extraction, based on knowledge and preference, as well as on practical technical and engineering requirements. In such a decision-making process, the set of Pareto optimal solutions (against dominated solutions) presented in a three-dimensional space of decision variables is of great help. It is proven that there is a relatively large area of non-dominated solutions. It was shown that for maximizing the four analyzed quality criteria of Levisticum officinale extracts, a number of options can be chosen. First of all, the boundary conditions of the process itself can be applied, i.e., increasing the extraction process time, as well as increasing the microwave power and the biomass/water ratio. The second option indicates that achieving the objective function (maximizing the criteria) with a low ratio of lovage roots to the extractant agent assumes increased microwave power or exposure time. Increasing the biomass/solvent ratio, on the other hand, allows for a decrease in microwave power and a shortening of the procedure to achieve satisfactory levels of bioactive compounds. Moving further into the three-dimensional space of Pareto optimal solutions, it can also be seen that the use of medium microwave power and medium biomass/solvent ratios can reduce the time of the entire extraction process (Table 2). And this is where the flexibility of the controllability of the microwave-assisted aqueous extraction process comes in.
Due to the determined number of Pareto optimal solutions, an approach related to the introduction of preferences in the optimization procedure was applied in the next step. The Pareto set reduction method was used, and set navigation was carried out using an a priori method, based on the preference of the decision-making process to direct the finding of optimal solutions to the preferred region, through different weighting of criteria and interest in alternative solution scenarios. The effects of this solution set reduction approach are shown in Figure 11.
Reducing the solutions from the Pareto fronts and the so-called smart Pareto approach yielded a subset of optimal solutions (preferred solutions). Assigning weights to the criteria allowed the first three quality criteria of the extracts to be given greater importance (Table 3). The optimal subsets showed that for satisfactory levels of biologically active compounds, aqueous extraction should be carried out at a maximum microwave power of 750 W. Preferred solutions were obtained for Levisticum officinale biomass/solvent ratios ranging from 0.0536 g/mL to 0.0679 g/mL. In contrast, the preferred optimum running time for microwave-assisted aqueous extraction was in the range of 64.2857 to 85.7143 s. Thus, for the maximization of phenolic compounds, flavonoids, and antioxidant potential, it is not indicated that extraction should be conducted at maximum process parameters.
The next proposed step in the search for optimal solutions was a post-Pareto analysis, involving the determination of the distance of points from the front end to the ideal “unattainable” Utopia point, based on the decision maker’s additional input in deciding which compromise solutions would be accepted. This approach allowed the Pareto optimal set to be narrowed down, while allowing the decision maker to have access to a set of solutions with a practical dimension. The sets of compromise solutions as a function of the two decision variables are shown in Figure 12, while for a more complete visualization, Figure 13 shows the sets of compromise solutions in the three-dimensional space of all analyzed variables/parameters of the extraction process.
Analysis of the trade-off solutions in the space of decision variables shows that they occur in two subsets (Figure 13).
The set of Pareto compromise solutions is shown in Table 4. By minimizing the distance of non-dominated solutions from the Utopia point, it was shown that for simultaneous maximization of the decision criteria, the extraction process can be controlled over certain ranges of decision variables.
To obtain extracts of satisfactory composition, a scenario in which a reduced biomass/water ratio (from 0.0357 to 0.0464 g/mL) can be used, but the highest microwave power must be employed. Increasing the biomass/water ratio to 0.0571 g/mL, on the other hand, allows the microwave power to be lowered significantly, while reducing the time of the process itself.
To evaluate the two procedures, Figure 14 compares the preferred solutions from the Pareto front against the compromise solutions. It should be emphasized that at this stage, it is up to the decision maker to decide which analysis is of greater practical relevance for the design and control of the microwave-assisted extraction process.
Theoretically, the compromise solutions, determined using an acceptable distance from the Utopia point, form concrete sets in which the decision maker can move. In the 3D visualization in the space of all decision variables, the elements of this set are equal compromise solutions. However, this can sometimes lead to a problem in decision making during the actual process. Often, there is a need to select and identify one specific and preferred solution from the set of compromise solutions. Thus, out of the set of compromise solutions, one was identified whose distance from the Utopia point was the smallest among all the solutions analyzed. Such an optimal compromise solution was identified as the point in the space of decision variables with coordinates x1 = 0.0643 g/mL, x2 = 550 W, and x3 = 30 s (thus, a so-called “super” compromise solution was identified).
4. Discussion
Microwave-assisted extraction (MAE) is a process that is currently receiving considerable attention in the literature. This is due to the fact that this method allows for a significant reduction in processing time and extractant agent consumption with respect to conventional extraction [12]. In addition, it allows the principles and objectives of green chemistry to be realized, due to the possibility of using water as an eco-friendly solvent. The interest in microwave-assisted extraction is largely due to the possibility of improving the efficiency of the extraction of bioactive compounds from plant biomass, including compounds with antioxidant activity. Therefore, the design and optimization of extraction processes is becoming increasingly important. This is because it is of particular importance not only in preventing the loss of bioactive compounds, which are sensitive to process parameters, but also in minimizing the cost intensity of the extraction procedure itself [37]. In our research, the process variables that determined the efficiency of bioactive compound extraction were extraction time, microwave power, and the ratio of plant biomass to the solvent. It was shown that for increased yields of phenolic compounds and reducing sugars, an increased biomass ratio of Levisticum officianle roots to water was more beneficial.
On the other hand, the ratio had a different effect on the flavonoid levels and antioxidant potential of the extracts. It was shown that there was a decrease in the content of these compounds in the extracts when the central analyzed value of this ratio was exceeded. Kim and Lim [38] also studied the effect of the ratio of Citrus unshiu pomace to solvent on the extraction efficiency of flavonoids. The amount of these bioactive compounds increased with an increase in this extraction parameter. However, the researchers did not observe statistically significant differences. Admittedly, according to Iglesias-Carres et al. [39], a high biomass/solvent ratio leads to the improved extraction efficiency of bioactive compounds, which the researchers explain by an increased concentration difference at the sample/extractant interface. However, as Assefa et al. [40] pointed out, conducting extraction with an increased biomass ratio is economically unjustifiable, as it involves, firstly, obtaining negligible differences in the levels of bioactive compounds and secondly, increased energy consumption in the subsequent concentration steps of the extracts produced [40]. A study by Hayat et al. [41] showed that the performance of an extraction process using banana peels was drastically reduced when the procedure was conducted at increased biomass/solvent ratios. According to the authors, an excessive increase in the sample/solvent ratio leads to a decrease in the concentration of phenolic compounds and antioxidant potential in DPPH and FRAP assays. Hayat et al. [41] hypothesized that the observed trends may be due to the swelling process of the plant material, which in turn leads to an increase in the contact zone between the biological matrix and the extractant agent [42]. Dahmoune et al. [17] emphasized that for the design of industrial-scale extraction, preliminary experimental studies are needed, conducted with a view to maximizing the extraction efficiency of bioactive compounds in terms of minimizing the solvents and plant matrices used [17]. Taking this into account, Kim and Lim [38] put forward the proposal that the procedure for optimizing microwave-assisted extraction should include the selection of an appropriate range of the sample to solvent ratio.
The research on the extraction of active compounds from the roots of Levisticum officinale also showed the effect of process time on the levels of phenolic compounds, flavonoids, sugars, and antioxidant potential. It was found that increasing the time resulted in an increase in the pool of these compounds, although increasing the time no longer resulted in such large increases. However, in the case of the antioxidant potential, assessed by the DPPH test, there was a decrease in this parameter when a certain time limit was exceeded. This is confirmed by the results obtained by Kim and Lim [38], who found that the extraction efficiency of flavonoids from Citrus unshiu pomace reached a maximum level at a certain time, after which there was no longer a significant change in this parameter. Similar observations were also reached by Mokrani and Madani [43], who evaluated the effect of time on the extraction efficiency of phenolic compounds and the antioxidant capacity of peach fruit. According to the researchers, the observed phenomenon is a direct result of Fick’s second law of diffusion, according to which, after a certain amount of time, there will be a final equilibrium between the plant biomass and the solvent of the concentrations in the reaction system, [43]. Vu et al. [42] emphasized that time is the extraction parameter of key importance, and in the case of microwave extraction, this impact is even greater. Therefore, an important optimization task is pointed out to determine the appropriate time range for conducting the extraction. Dahmoune et al. [17] indicate that extending the extraction time beyond the optimal range may lead to a decrease in the efficiency of extracting bioactive components from the plant matrix due to the fact that an uncontrolled increase in temperature and thermal degradation of antioxidant compounds may occur.
The last parameter of the microwave-assisted extraction process optimized in this research was the power of the magnetron. Increasing microwave power led to increased levels of bioactive compounds. However, for the content of phenolic compounds and flavonoids, increasing the microwave power from 650 to 750 W no longer resulted in significant differences. Research by Kheyar et al. [44], which focused on optimizing microwave-assisted extraction for maximizing the total pool of phenolic compounds from Moringa oleifera leaves, confirmed that microwave power determined the efficiency of the process. However, for the optimal power of 626.53 W, the extraction time was prolonged compared to that noted in studies on Levisticum officinale.
In contrast, a study by Sai-Ut et al. [45] found that the optimal microwave power for the extraction of polyphenols from Careya sphaerica Roxb. was 1000 W. On the other hand, this required an increased ratio of plant biomass to solvent. The positive effect of using microwaves in the extraction process is pointed out by Kheyar et al. [44] who stated that the content of polyphenols increased with increasing microwave power, reaching a maximum at 500 W. Increasing the microwave power to 1000 W resulted in a decrease in the polyphenol content of the extract. The reason for this situation may be that microwaves affect the plant material too intensively, causing structural changes that negatively affect the availability of polyphenols or the loss of their stability. High microwave power can also stimulate reactions that reduce the availability of bioactive compounds. Moreover, Mandal et al. [46] confirmed that microwave energy is a determinant of the extraction efficiency of phenolic compounds. However, the researchers emphasized that increasing the microwave power may lead to disruption of the dynamic structure of the sample and degradation of the bioactive compounds [46]. In addition, unjustified increases in microwave energy no longer lead to a significant increase in the extraction efficiency of active compounds and are associated with higher economic expenses [42].
Thus, as many researchers point out, there is a need not only to design the extraction process, but also to optimize its efficiency. This is particularly relevant for microwave-assisted extraction, as it can ultimately reduce the energy intensity of the process. Therefore, optimization problems in real processes are characterized by multiple, sometimes conflicting objectives. It should be emphasized that the multi-objective optimization procedures for microwave-assisted extraction proposed in this paper are not only a search for a set of solutions (process parameters), but also a decision-making process based on the knowledge, experience, and preferences of the decision maker. Only by integrating computer methods with the decision maker’s position will it be possible to identify a set or region of optimal solutions to control the extraction process. The results of the optimization procedures presented in this work will allow the decision maker to make a posteriori decisions. In such a case, sets of Pareto optimal, preferred, and compromise solutions generated without the decision maker’s preferences can be provided to him to make a decision based on the most preferred options among the alternatives [47]. Therefore, the method developed in this work allows for the creation of a sequential process in which the decision maker reaches decisions about the parameters of the extraction procedure, knowing that he is choosing from non-dominated solutions, and the optimization of each analyzed criterion corresponds to the maximum value of this criterion. However, if in the decision-making process there is a need to give greater importance to individual criteria, the proposed procedure also makes this possible by indicating preferred solutions [47,48].
5. Conclusions
The root biomass of Levisticum officinale is rich in bioactive compounds with high antioxidant potential. It has also been shown that microwave-assisted water extraction is a suitable method for ecologically obtaining phytochemicals from lovage biomass. For industrial applications and the improvement of such an extraction procedure, mathematical models with the correct predictive ability were created and used in optimization procedures and in the forecasting of process parameters. Sets of Pareto optimal, compromise, and preferred solutions were indicated, which will allow for maximizing the efficiency of the extraction of bioactive compounds from plant biomass. Optimized processing conditions will not only improve the extraction process, but are also necessary to increase the scale of ecological production of compounds with antioxidant potential intended for various industries, including applications in the fields of pharmacy, foods, and agronomy. The multi-objective optimization procedures proposed in this work will not only enable the search for a set of optimal solutions (process parameters), but will also facilitate the decision-making process, based on the knowledge, experience, and preferences of the decision maker. In the optimal subsets, it was shown that for a satisfactory level of bioactive compounds, extraction should be carried out at a maximum microwave power of 750 W. The preferred solutions were obtained for the ratio of Levisticum officinale root biomass to water in the range of 0.0536 g/mL to 0.0679 g/mL. The preferred optimal time for microwave-assisted water extraction ranged from 64.2857 to 85.7143 s. The conducted research and multi-criteria optimization methods indicate the need for further research in this area to identify a greater role for the decision maker and to increase the scale of microwave-assisted extraction for industrial applications.
Author Contributions
Conceptualization, M.P. and S.K.; methodology, M.P.; software, M.P.; validation, M.P., S.K. and A.B.; formal analysis, M.P.; investigation, M.P.; resources, M.P.; data curation, M.P.; writing—original draft preparation, M.P.; writing—review and editing, M.P., S.K. and A.B.; visualization, M.P. and S.K.; supervision, S.K.; project administration, S.K. and A.B. All authors have read and agreed to the published version of the manuscript.
Funding
This article was supported by the Polish National Agency for Academic Exchange under the Strategic Partnership project BPI/PST/2021/1/00034/U/00001, “Crucial, Long-Term Collaborations for the Development of an Innovative, Ecological Approach in Biostimulants Production”.
Data Availability Statement
The data presented in this study are available on request from the corresponding author.
Conflicts of Interest
Author Michał Plawgo was employed by the Future Production AS. The remaining authors declare that the research was conducted in the absence of any commercial or financial relationships that could be construed as a potential conflict of interest.
References
- Lin, G.; Chan, S.S.K.; Chung, H.S.; Li, S.L. Chemistry and biological activities of naturally occurring phthalides. Stud. Nat. Prod. Chem. 2005, 32, 611–669. [Google Scholar] [CrossRef]
- Beck, J.J.; Chou, S.C. The structural diversity of phthalides from the Apiaceae. J. Nat. Prod. 2007, 70, 891–900. [Google Scholar] [CrossRef] [PubMed]
- Yang, Y.C.; Li, J.; Zu, Y.G.; Fu, Y.J.; Luo, M.; Wu, N.; Liu, X.L. Optimisation of microwave-assisted enzymatic extraction of corilagin and geraniin from Geranium sibiricum Linne and evaluation of antioxidant activity. Food Chem. 2010, 122, 373–380. [Google Scholar] [CrossRef]
- Pannek, J.; Gach, J.; Boratyński, F.; Olejniczak, T. Antimicrobial activity of extracts and phthalides occurring in Apiaceae plants. Phytother. Res. 2018, 32, 1459–1487. [Google Scholar] [CrossRef] [PubMed]
- Nalini, P.; Poonam, Y. Synthesis and Biological activities of some new Phthalides. Orient. J. Chem. 2012, 2, 57–61. [Google Scholar]
- Song, J.; Li, D.; Liu, C.; Zhang, Y. Optimized microwave-assisted extraction of total phenolics (TP) from Ipomoea batatas leaves and its antioxidant activity. Innovat. Food Sci. Emerg. Technol. 2011, 12, 282–287. [Google Scholar] [CrossRef]
- Szparaga, A.; Kocira, S.; Kapusta, I.; Zaguła, G. Exploring the agro-potential of extract from Levisticum officinale WDJ Koch in soybean cultivation. Ind. Crop. Prod. 2023, 203, 117235. [Google Scholar] [CrossRef]
- Szparaga, A.; Kocira, S.; Kapusta, I.; Zaguła, G. Solid–liquid extraction of bioactive compounds as a green alternative for developing novel biostimulant from Linum usitatissimum L. Chem. Biol. Technol. Agric. 2023, 10, 108. [Google Scholar] [CrossRef]
- Szparaga, A. Biostimulating Extracts from Arctium lappa L. As Ecological Additives in Soybean Seed Coating Applications. Agric. Eng. 2023, 27, 1–10. [Google Scholar] [CrossRef]
- Luthria, D.L. Influence of experimental conditions on the extraction of phenolic compounds from parsley (Petroselinum crispum) flakes using a pressurized liquid extractor. Food Chem. 2008, 107, 745–752. [Google Scholar] [CrossRef]
- Spigno, G.; De Faveri, D.M. Microwave-assisted extraction of tea phenols: A phenomenological study. J. Food Eng. 2009, 93, 210–217. [Google Scholar] [CrossRef]
- Jerman, T.; Trebse, P.; Mozetic Vodopivec, B. Ultrasound-assisted solid liquid extraction (USLE) of olive fruit (Olea europaea) phenolic compounds. Food Chem. 2010, 123, 175–182. [Google Scholar] [CrossRef]
- Camel, V. Microwave-assisted solvent extraction of environmental samples. TrAC Trends Anal. Chem. 2000, 19, 229–248. [Google Scholar] [CrossRef]
- Pérez-Serradilla, J.A.; De Castro, M.L. Microwave-assisted extraction of phenolic compounds from wine lees and spray-drying of the extract. Food Chem. 2011, 124, 1652–1659. [Google Scholar] [CrossRef]
- Milutinović, M.; Miladinović, M.; Gašić, U.; Dimitrijević-Branković, S.; Rajilić-Stojanović, M. Recovery of bioactive molecules from Hypericum perforatum L. dust using microwave-assisted extraction. Biomass Conv. Bioref. 2024, 14, 7111–7123. [Google Scholar] [CrossRef]
- Gallo, M.; Ferracane, R.; Graziani, G.; Ritieni, A.; Fogliano, V. Microwave assisted extraction of phenolic compounds from four different spices. Molecules 2010, 15, 6365–6374. [Google Scholar] [CrossRef] [PubMed]
- Dahmoune, F.; Nayak, B.; Moussi, K.; Remini, H.; Madani, K. Optimization of microwave-assisted extraction of polyphenols from Myrtus communis L. leaves. Food Chem. 2015, 166, 585–595. [Google Scholar] [CrossRef]
- Vinatoru, M.; Mason, T.J.; Calinescu, I. Ultrasonically assisted extraction (UAE) and microwave assisted extraction (MAE) of functional compounds from plant materials. TrAC Trends Anal. Chem. 2017, 97, 159–178. [Google Scholar] [CrossRef]
- Šeremet, D.; Jokić, S.; Aladić, K.; Cebin, A.V.; Božac, N.; Mandura, A.; Komes, D. Optimization of heat-, microwave-assisted and subcritical water extraction of phenolic compounds from ground ivy (Glechoma hederacea L.) using response surface methodology. J. Appl. Res. Med. Aromat. Plants 2021, 25, 100346. [Google Scholar] [CrossRef]
- Shahidi, F.; Ambigaipalan, P. Phenolics and polyphenolics in foods, beverages and spices: Antioxidant activity and health effects—A review. J. Funct. Foods 2015, 18, 820–897. [Google Scholar] [CrossRef]
- Popa, V.I.; Beleca, C. On the role played by some natural products, with aromatic structure, in processes of plant growing. Cell. Chem. Technol. 1994, 28, 613–620. [Google Scholar]
- Balas, A.; Popa, V. Bioactive compounds extracted from Picea abies bark. In Proceedings of the 10th European workshop on Lignocellulosics and Pulp, Stockholm, Sweden, 25–28 August 2008; pp. 345–356. [Google Scholar]
- Tanase, C.; Bujor, O.C.; Popa, V.I. Phenolic natural compounds and their influence on physiological processes in plants. In Polyphenols in Plants, 2nd ed.; Academic Press: Cambridge, MA, USA, 2019; pp. 45–58. [Google Scholar] [CrossRef]
- González-Vallinas, M.; González-Castejón, M.; Rodríguez-Casado, A.; Ramírez de Molina, A. Dietary phytochemicals in cancer prevention and therapy: A complementary approach with promising perspectives. Nutr. Rev. 2013, 71, 585–599. [Google Scholar] [CrossRef] [PubMed]
- Zhang, Z.; Liao, L.; Moore, J.; Wu, T.; Wang, Z. Antioxidant phenolic compounds from walnut kernels (Juglans regia L.). Food Chem. 2009, 113, 160–165. [Google Scholar] [CrossRef]
- Sharma, H.S.S.; Fleming, C.; Selby, C.; Rao, J.R.; Martin, T. Plant biostimulants: A review on the processing of macroalgae and use of extracts for crop management to reduce abiotic and biotic stresses. J. Appl. Phycol. 2014, 26, 465–490. [Google Scholar] [CrossRef]
- Craigie, J.S. Seaweed extract stimuli in plant science and agriculture. J. Appl. Phycol. 2011, 23, 371–393. [Google Scholar] [CrossRef]
- Ribeiro, S.M.R.; Barbosa, L.C.A.; Queiroz, J.H.; Knödler, M.; Schieber, A. Phenolic compounds and antioxidant capacity of Brazilian mango (Mangifera indica L.) varieties. Food Chem. 2008, 110, 620–626. [Google Scholar] [CrossRef]
- Iqbal, S.; Younas, U.; Sirajuddi; Chan, K.W.; Sarfraz, R.A.; Uddin, K. Proximate composition and antioxidant potential of leaves from three varieties of Mulberry (Morus sp.): A comparative study. Int. J. Mol. Sci. 2012, 13, 6651–6664. [Google Scholar] [CrossRef]
- Lee, L.S.; Lee, N.; Kim, Y.H.; Lee, C.H.; Hong, S.P.; Jeon, Y.W.; Kim, Y.E. Optimization of ultrasonic extraction of phenolic antioxidants from green tea using response surface methodology. Molecules 2013, 18, 13530–13545. [Google Scholar] [CrossRef] [PubMed]
- Krivorotova, T.; Sereikaite, J. Determination of fructan exohydrolase activity in the crude extracts of plants. Electron. J. Biotechnol. 2014, 17, 329–333. [Google Scholar] [CrossRef]
- Curve Fitting Toolbox for Use with Matlab; The MathWorks Inc.: Natick, MA, USA; Available online: http://cda.psych.uiuc.edu/matlab_pdf/curvefit.pdf (accessed on 10 April 2024).
- Gómez-Salazar, J.A.; Patlán-González, J.; Sosa-Morales, M.E.; Segovia-Hernandez, J.G.; Sánchez-Ramírez, E.; Ramírez-Márquez, C. Multi-objective optimization of sustainable red prickly pear (Opuntia streptacantha) peel drying and biocompounds extraction using a hybrid stochastic algorithm. Food Bioprod. Process. 2022, 132, 155–166. [Google Scholar] [CrossRef]
- Chen, Y.; Zhou, S.; Li, Q. Multiobjective topology optimization for finite periodic structures. Comput. Struct. 2010, 88, 806–811. [Google Scholar] [CrossRef]
- Marler, R.T.; Arora, J.S. The weighted sum method for multiobjective optimization: New insights. Struct. Multidiscip. Optim. 2010, 41, 853–862. [Google Scholar] [CrossRef]
- Das, I. A preference ordering among various Pareto optimal alternatives. Struct. Multidiscip. Optim. 1999, 18, 30–35. [Google Scholar] [CrossRef]
- Azzouzi, H.; Elhajji, L.; Achchoub, M.; Benbati, M.; Salmaoui, S. Assessment of total phenolic content and antioxidant activity potential of clementine extract obtained by microwave assisted extraction method. Biosci. Biotech. Res. Asia 2021, 18, 779–785. [Google Scholar] [CrossRef]
- Kim, D.S.; Lim, S.B. Extraction of flavanones from immature Citrus unshiu pomace: Process optimization and antioxidant evaluation. Sci. Rep. 2020, 10, 19950. [Google Scholar] [CrossRef] [PubMed]
- Iglesias-Carres, L.; Mas-Capdevila, A.; Bravo, F.I.; Aragonès, G.; Muguerza, B.; Arola-Arnal, A. Optimization of a polyphenol extraction method for sweet orange pulp (Citrus sinensis L.) to identify phenolic compounds consumed from sweet oranges. PLoS ONE 2019, 14, e0211267. [Google Scholar] [CrossRef] [PubMed]
- Assefa, A.D.; Saini, R.K.; Keum, Y.S. Extraction of antioxidants and flavonoids from yuzu (Citrus junos Sieb ex Tanaka) peels: A response surface methodology study. J. Food Meas. Charact. 2017, 11, 364–379. [Google Scholar] [CrossRef]
- Hayat, K.; Hussain, S.; Abbas, S.; Farooq, U.; Ding, B.; Xia, S.; Xia, W. Optimized microwave-assisted extraction of phenolic acids from citrus mandarin peels and evaluation of antioxidant activity in vitro. Sep. Purif. Technol. 2009, 70, 63–70. [Google Scholar] [CrossRef]
- Vu, H.T.; Scarlett, C.J.; Vuong, Q.V. Maximising recovery of phenolic compounds and antioxidant properties from banana peel using microwave assisted extraction and water. J. Food Sci. Technol. 2019, 56, 1360–1370. [Google Scholar] [CrossRef]
- Mokrani, A.; Madani, K. Effect of solvent, time and temperature on the extraction of phenolic compounds and antioxidant capacity of peach (Prunus persica L.) fruit. Sep. Purif. Technol. 2016, 162, 68–76. [Google Scholar] [CrossRef]
- Kheyar, F.; Kheyar, N.; Amiali, M.; Boulekbache-Makhlouf, L.; Kadi, A.; Benchabane, A.; Bitam, A. Impacts of microwave-assisted extraction parameters on total phenolic compounds yield from Algerian Moringa oleifera leaves, using response surface methodology. Nat. Prod. Res. 2024, 1–9. [Google Scholar] [CrossRef] [PubMed]
- Sai-Ut, S.; Kingwascharapong, P.; Mazumder, M.A.R.; Rawdkuen, S. Optimization of microwave-assisted extraction of phenolic compounds and antioxidants from Careya sphaerica Roxb. flowers using response surface methodology. Appl. Food Res. 2024, 4, 100379. [Google Scholar] [CrossRef]
- Mandal, C.; Jaiswal, M.; Bosco, S.J.D. Process optimization for ultrasound and microwave-assisted phytonutrients extractions from Averrhoa carambola fruit. Biomass Conv. Bioref. 2023, 1–17. [Google Scholar] [CrossRef]
- Ferreira, J.C.; Fonseca, C.M.; Gaspar-Cunha, A. Methodology to select solutions from the pareto-optimal set: A comparative study. In Proceedings of the 9th Annual Conference on Genetic and Evolutionary Computation, London, UK, 7–11 July 2007. [Google Scholar] [CrossRef]
- Zio, E.; Bazzo, R. A clustering procedure for reducing the number of representative solutions in the Pareto Front of multiobjective optimization problems. Eur. J. Oper. Res. 2011, 210, 624–634. [Google Scholar] [CrossRef]
Figure 1.
The flow chart of multi-objective optimization of the MAE extraction process.
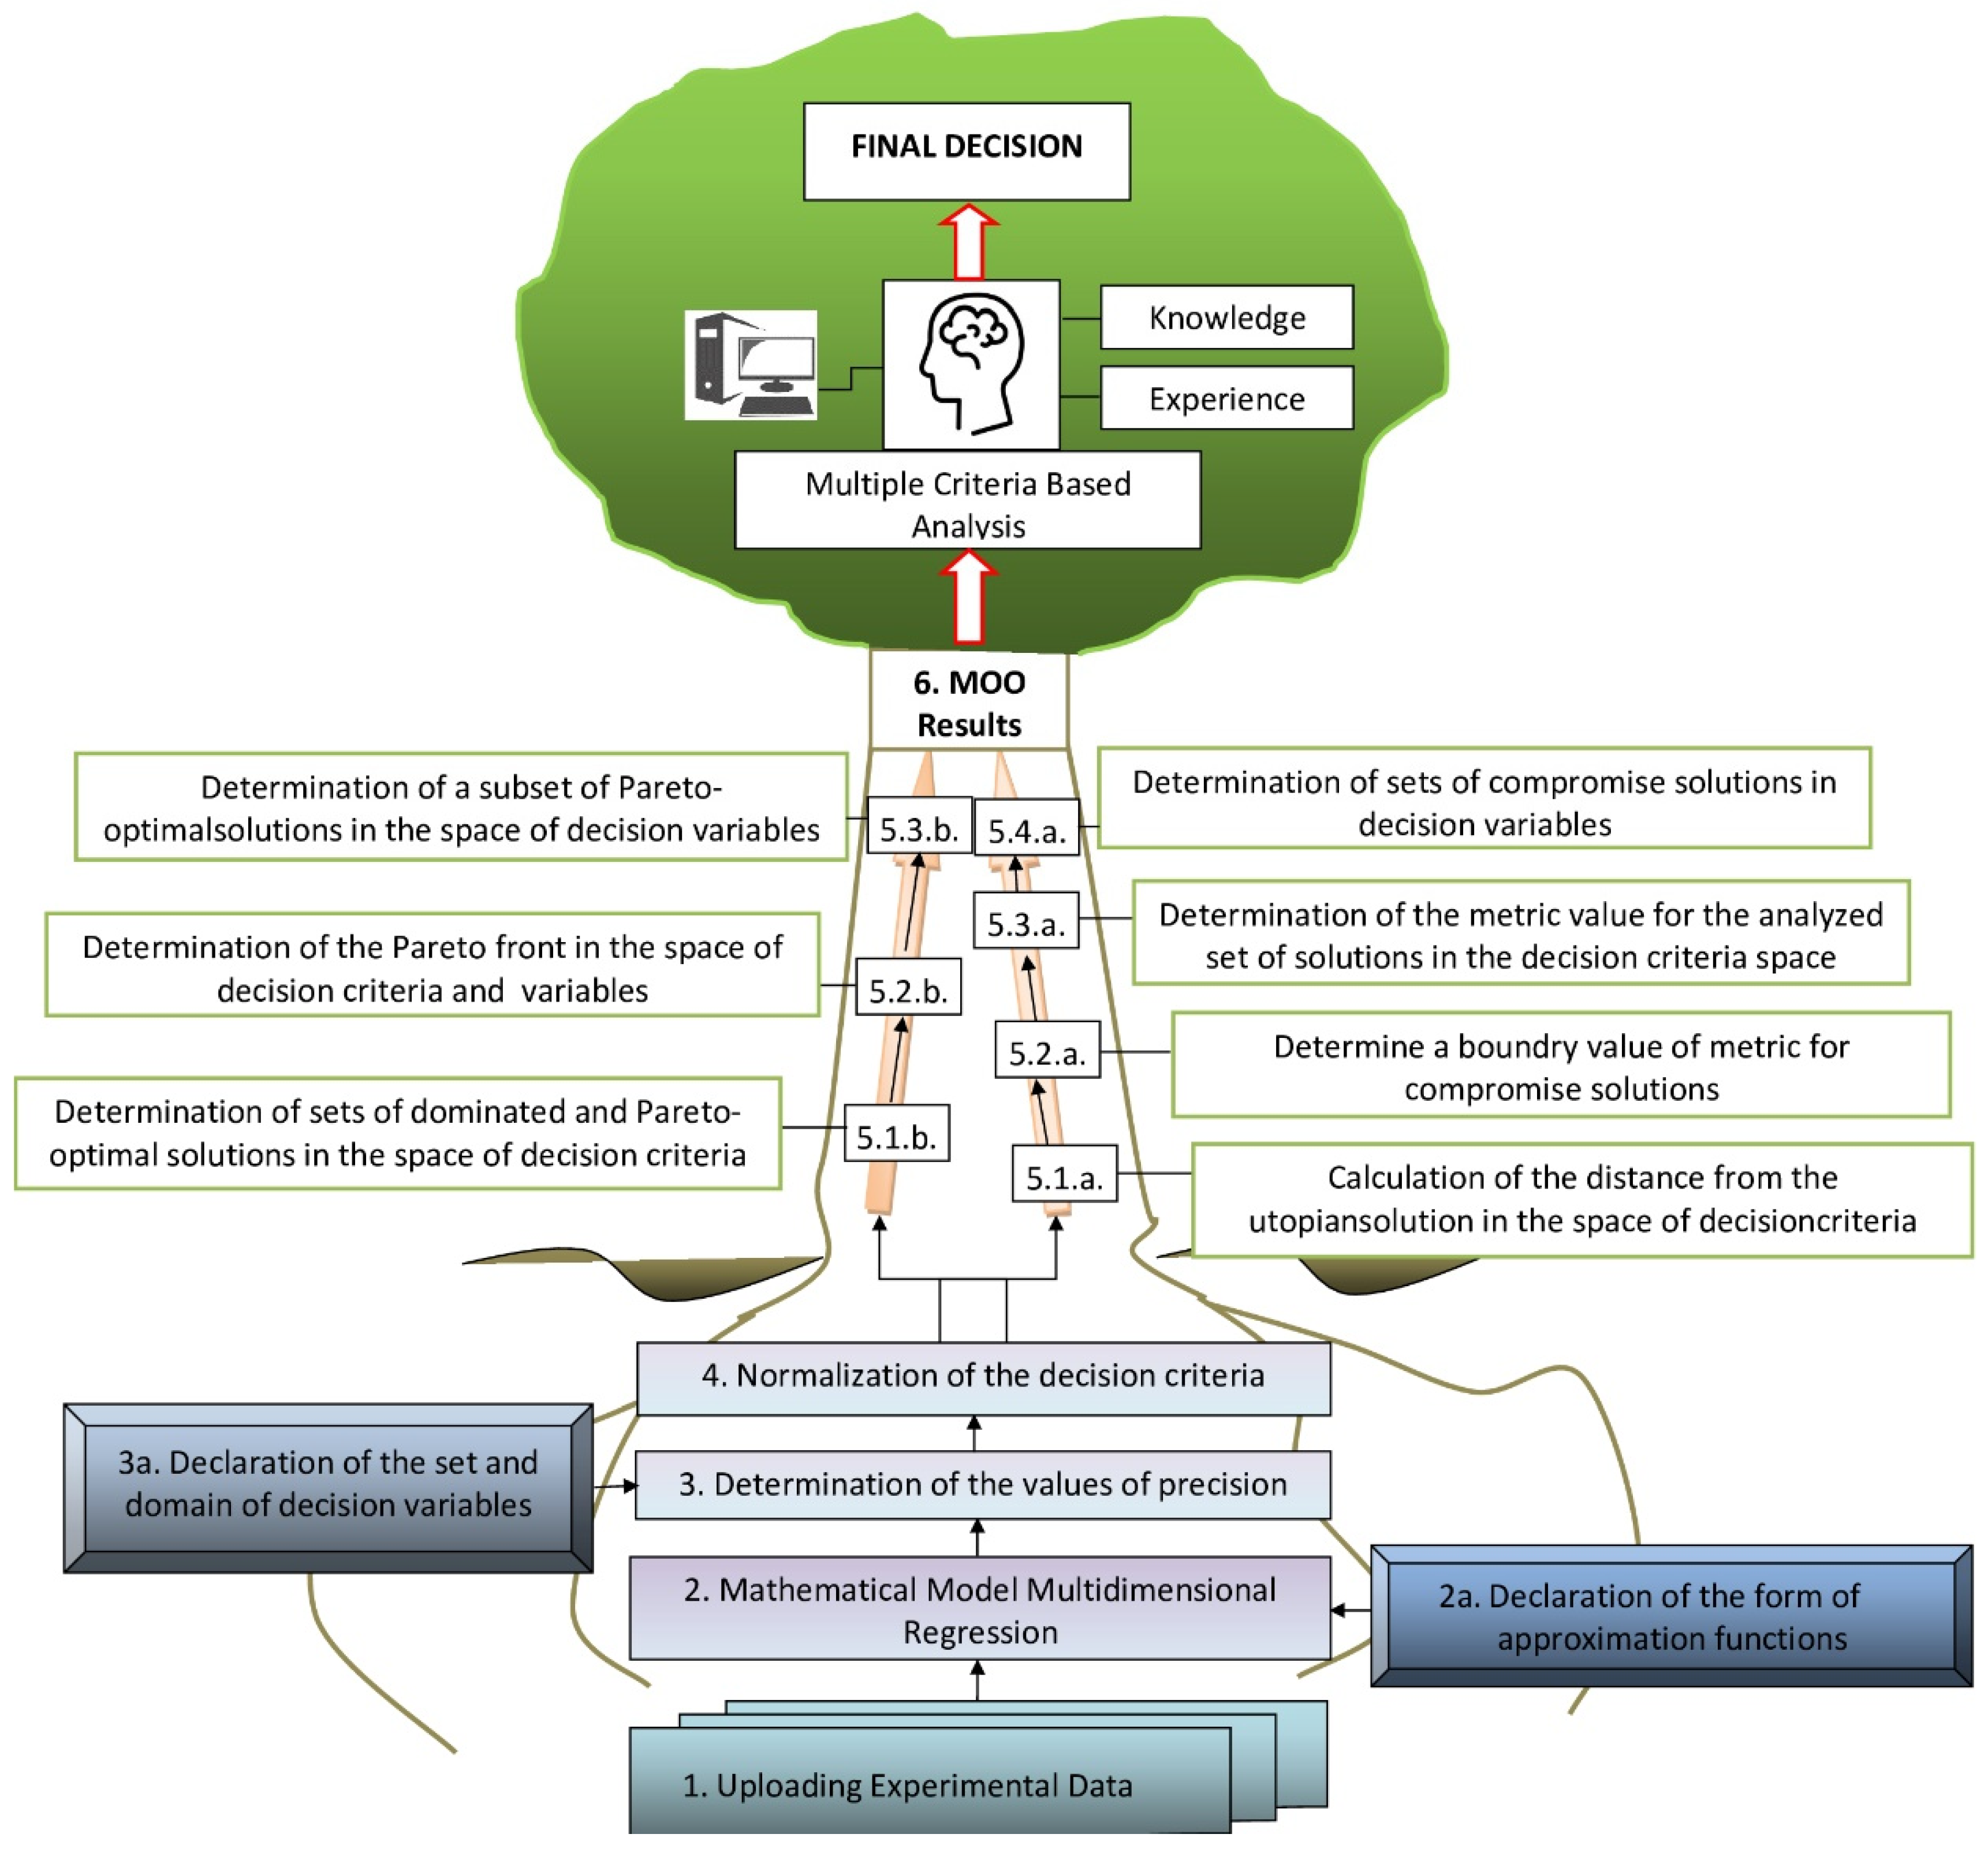
Figure 3.
Illustration of the Pareto front and the Utopia point.
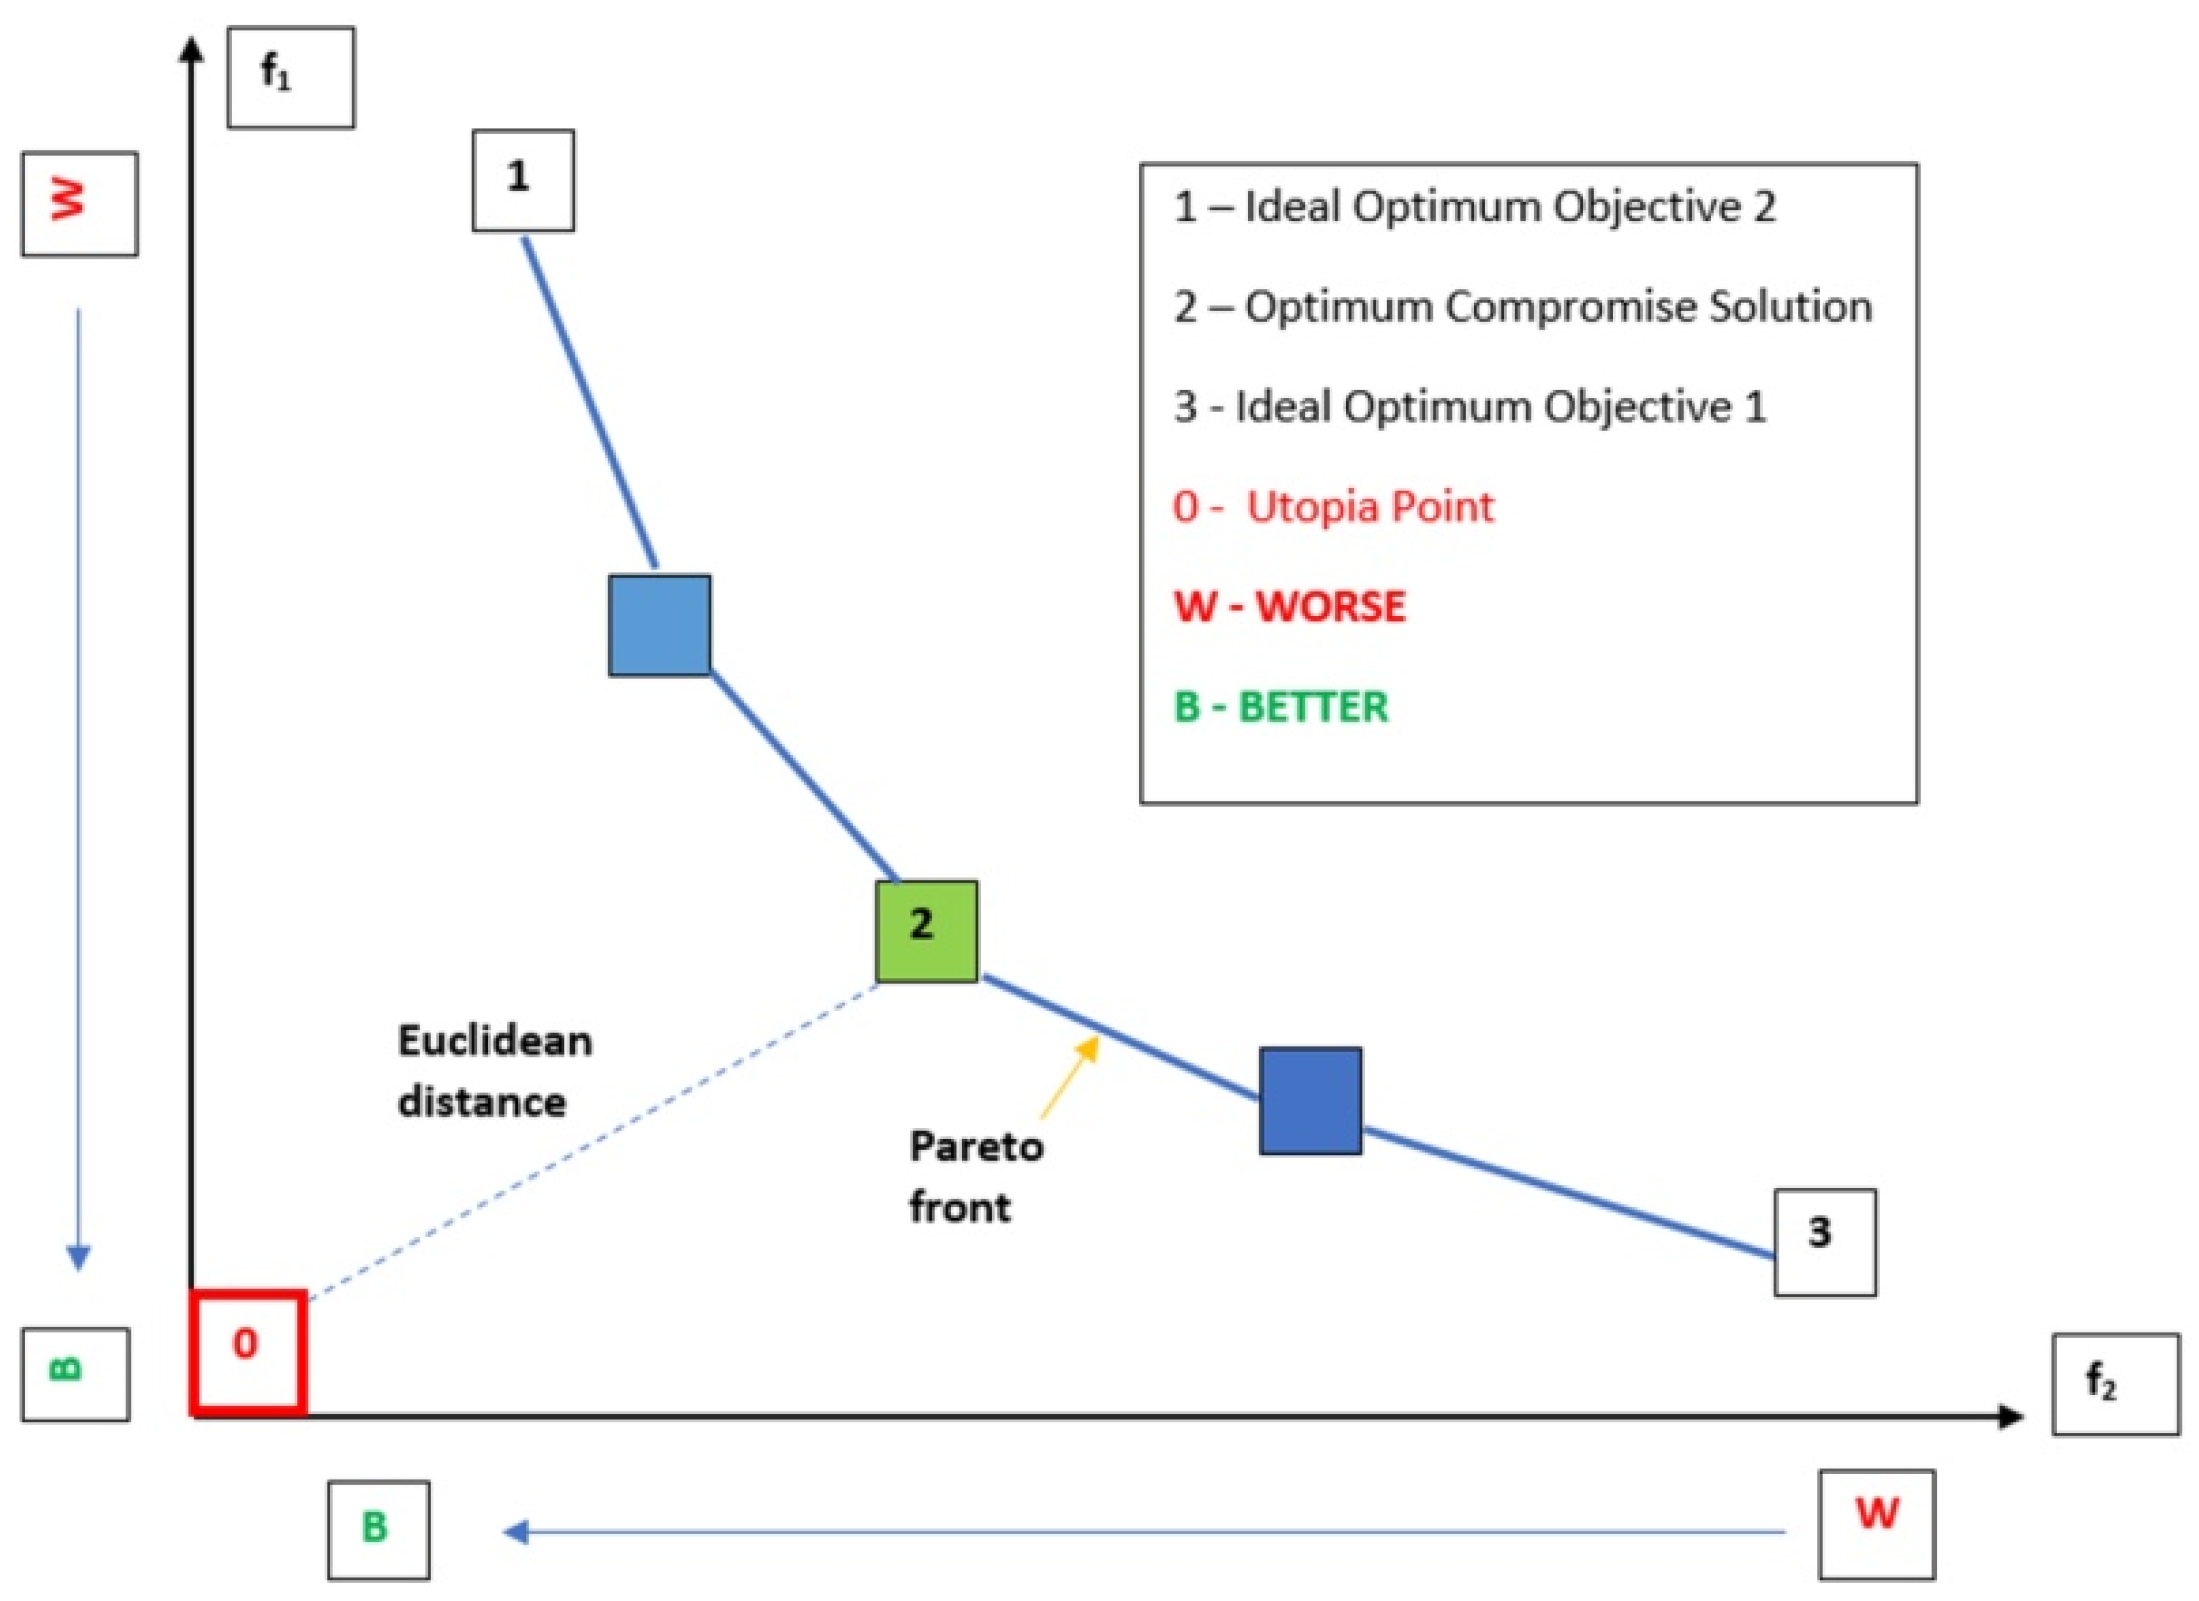
Figure 4.
Experimental and predicted values (regression function with interpolation) for TPC, as a function of decision variables x1 (sample/solvent ratio, g/mL) and x3 (time, s) for (A) microwave power x2 = 550 W; (B) microwave power x2 = 650 W; (C) microwave power x2 = 750 W.
Figure 4.
Experimental and predicted values (regression function with interpolation) for TPC, as a function of decision variables x1 (sample/solvent ratio, g/mL) and x3 (time, s) for (A) microwave power x2 = 550 W; (B) microwave power x2 = 650 W; (C) microwave power x2 = 750 W.

Figure 5.
Experimental and predicted values (regression function with interpolation) for TFC, as a function of decision variables x1 (sample/solvent ratio, g/mL) and x3 (time, s) for (A) microwave power x2 = 550 W; (B) microwave power x2 = 650 W; (C) microwave power x2 = 750 W.
Figure 5.
Experimental and predicted values (regression function with interpolation) for TFC, as a function of decision variables x1 (sample/solvent ratio, g/mL) and x3 (time, s) for (A) microwave power x2 = 550 W; (B) microwave power x2 = 650 W; (C) microwave power x2 = 750 W.

Figure 6.
Experimental and predicted values (regression function with interpolation) for TAA, as a function of decision variables x1 (sample/solvent ratio, g/mL) and x3 (time, s) for (A) microwave power x2 = 550 W; (B) microwave power x2 = 650 W; (C) microwave power x2 = 750 W.
Figure 6.
Experimental and predicted values (regression function with interpolation) for TAA, as a function of decision variables x1 (sample/solvent ratio, g/mL) and x3 (time, s) for (A) microwave power x2 = 550 W; (B) microwave power x2 = 650 W; (C) microwave power x2 = 750 W.

Figure 7.
Experimental and predicted values (regression function with interpolation) for RSC, as a function of decision variables x1 (sample/solvent ratio, g/mL) and x3 (time, s) for (A) microwave power x2 = 550 W; (B) microwave power x2 = 650 W; (C) microwave power x2 = 750 W.
Figure 7.
Experimental and predicted values (regression function with interpolation) for RSC, as a function of decision variables x1 (sample/solvent ratio, g/mL) and x3 (time, s) for (A) microwave power x2 = 550 W; (B) microwave power x2 = 650 W; (C) microwave power x2 = 750 W.

Figure 8.
Pareto solution sets for maximizing regression equations for criterion relationships K1 (TPC—total phenolic content, maximized), K2 (TFC—total flavonoids content), K3 (TAA—total antioxidant activity). Red color indicates Pareto optimal solutions (Pareto front); blue color indicates dominated solutions.

Figure 9.
Pareto solution sets for maximizing regression equations for criterion relationships K1 (TPC—total phenolic content, maximized), K2 (TFC—total flavonoids content, maximized), K4 (RSC—reducing sugar content). Red color indicates Pareto optimal solutions; blue color indicates dominated solutions. For maximized criteria, 0 is the best case scenario.

Figure 10.
Pareto solution sets for maximizing regression equations as a function of decision variables x1 (sample/solvent ratio), x2 (microwave power), and x3 (time). Red color indicates Pareto optimal solutions; blue color indicates dominated solutions.
Figure 10.
Pareto solution sets for maximizing regression equations as a function of decision variables x1 (sample/solvent ratio), x2 (microwave power), and x3 (time). Red color indicates Pareto optimal solutions; blue color indicates dominated solutions.

Figure 11.
Visualization of smart Pareto solutions against Pareto front optimal solutions in decision variable spaces x1 (sample/solvent ratio), x2 (microwave power), and x3 (time). Red color indicates Pareto optimal solutions; blue color indicates dominated solutions; black dots/circles indicate smart Pareto solutions.

Figure 12.
Sets of trade-off solutions based on distance from the Utopia point as a function of decision variables (A) x1 (sample/solvent ratio) and x3 (time); (B) x2 (microwave power) and x3 (time); (C) x1 (sample/solvent ratio) and x3 (time). Green color indicates compromise solutions; blue color indicates dominated solutions.
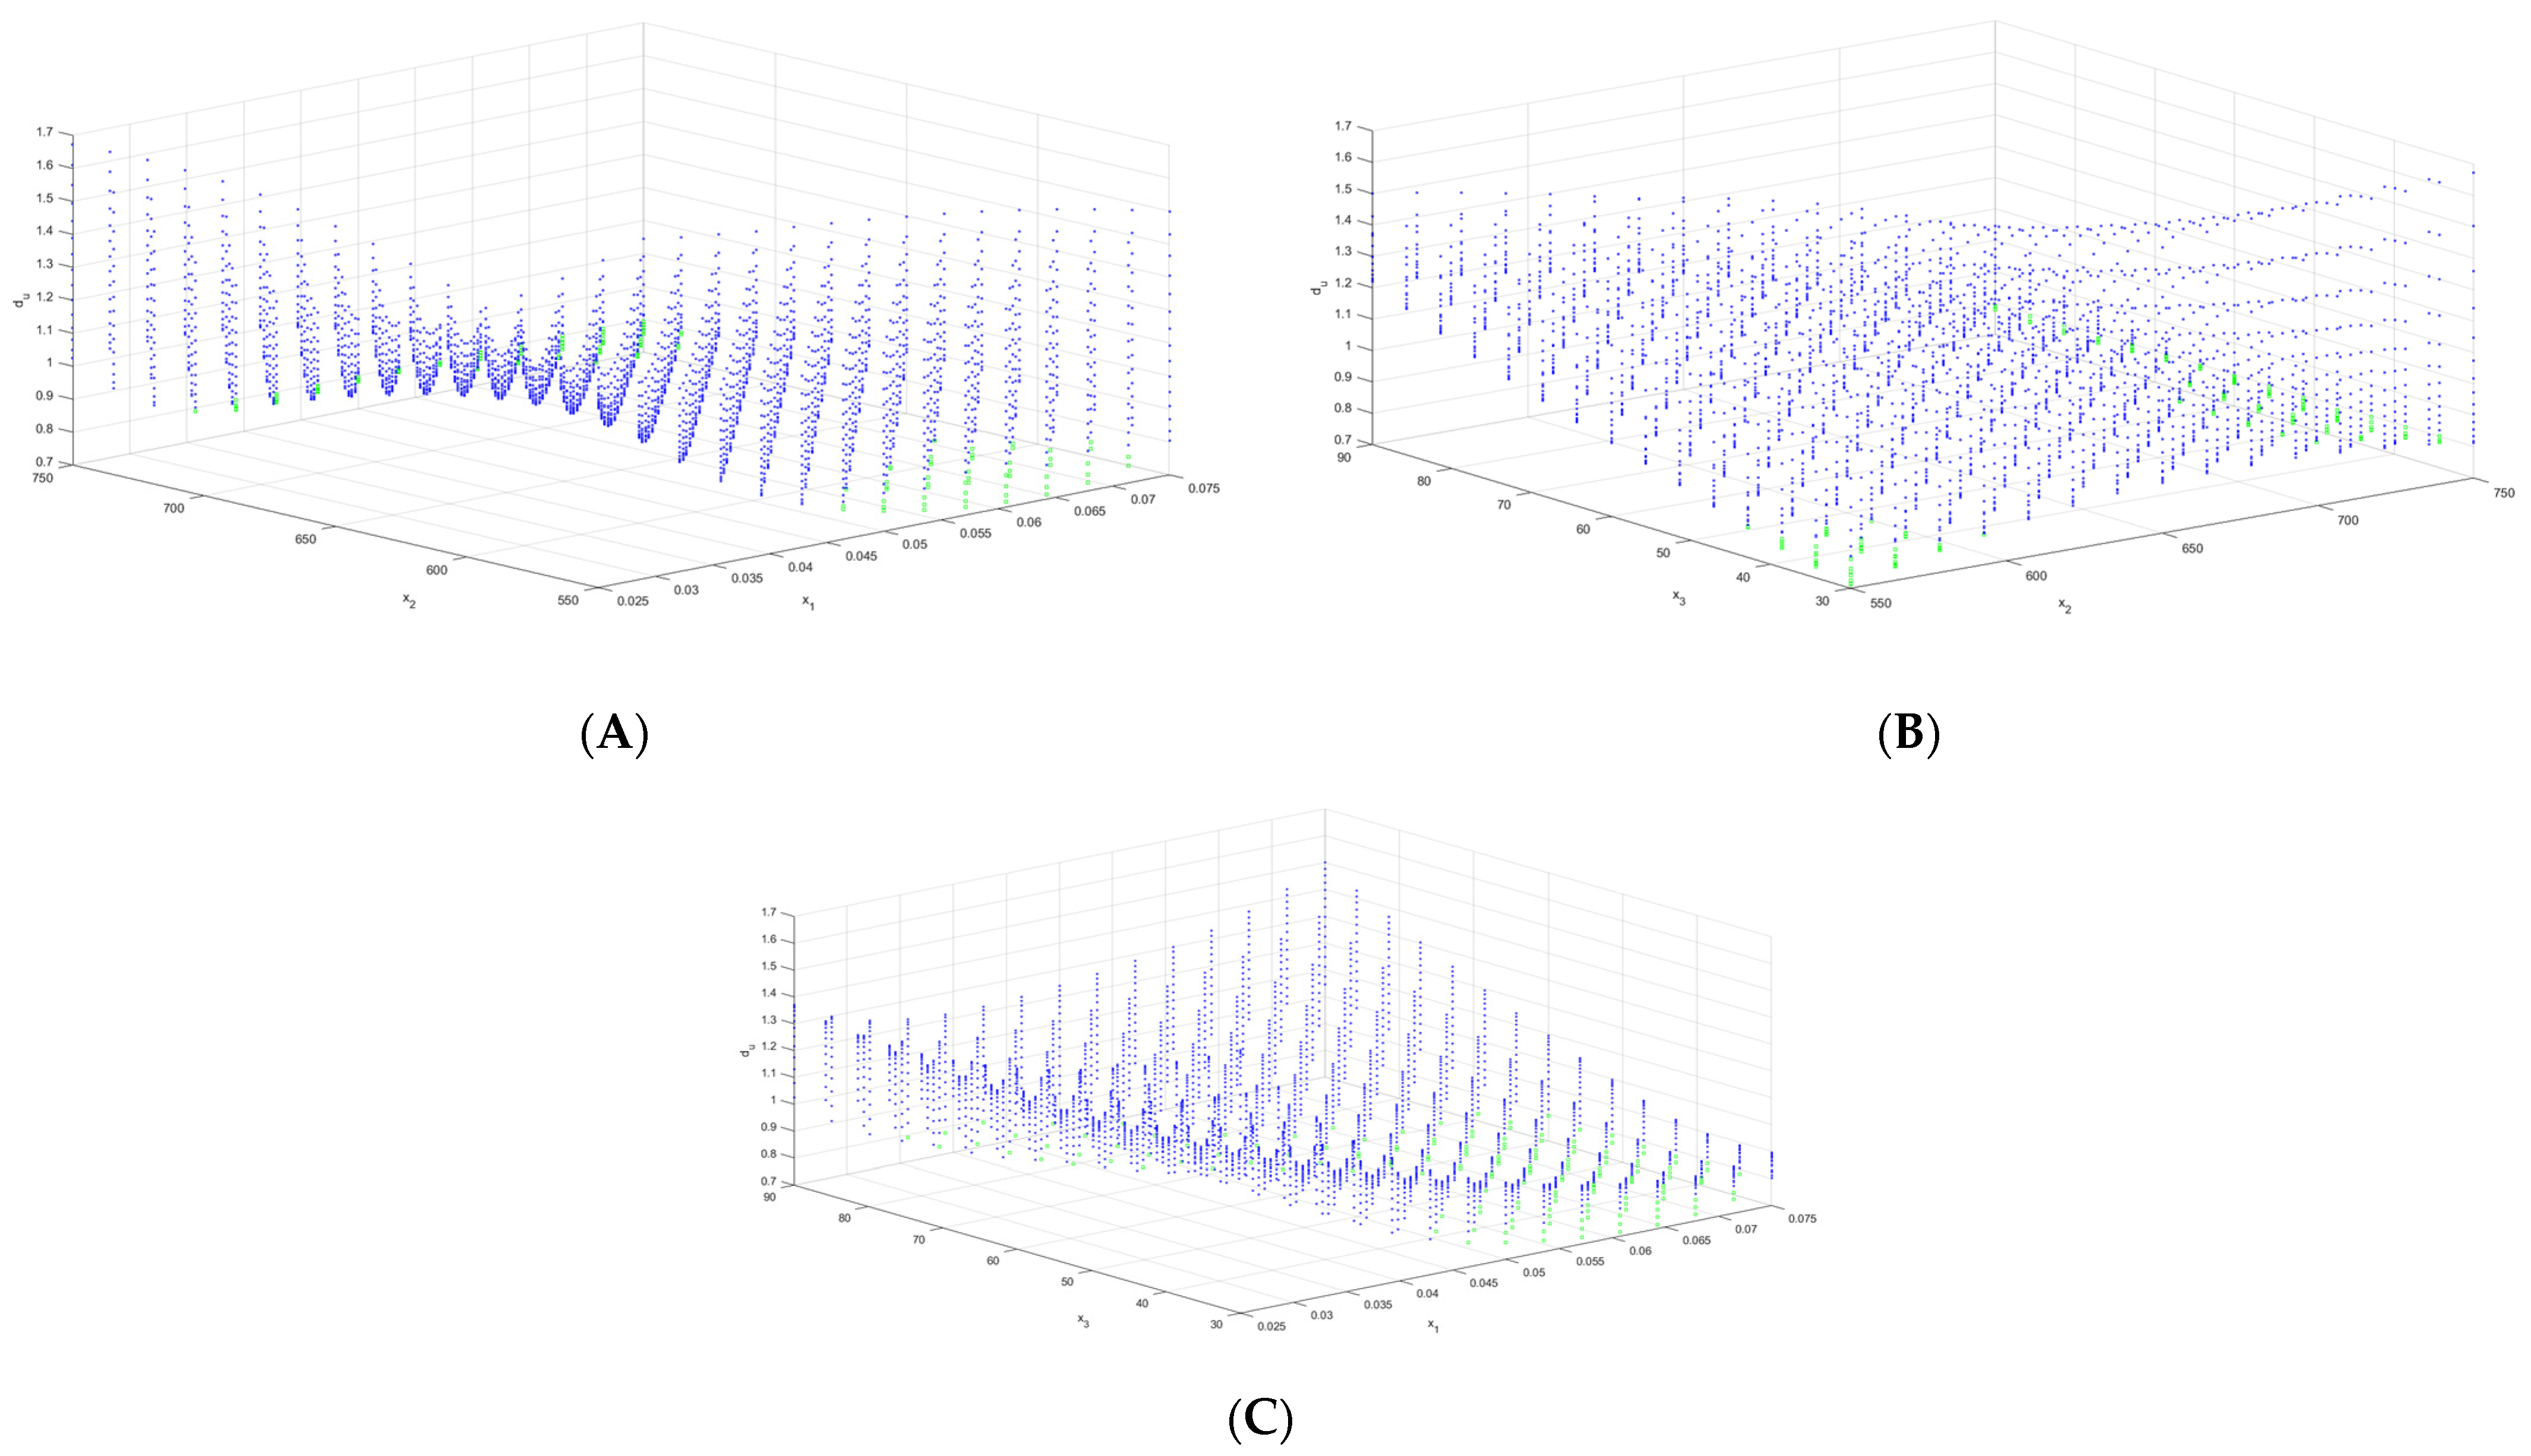
Figure 13.
Illustration of compromise solutions based on the distance from the Utopia point, as a function of decision variables x1 (sample/solvent ratio), x2 (microwave power), and x3 (time). Green color indicates compromise solutions; blue color indicates dominated solutions.
Figure 13.
Illustration of compromise solutions based on the distance from the Utopia point, as a function of decision variables x1 (sample/solvent ratio), x2 (microwave power), and x3 (time). Green color indicates compromise solutions; blue color indicates dominated solutions.

Figure 14.
Visualization of smart Pareto solutions against the trade-offs. Red color—smart Pareto solution; green color—compromise solutions; blue color—dominated solutions.
Figure 14.
Visualization of smart Pareto solutions against the trade-offs. Red color—smart Pareto solution; green color—compromise solutions; blue color—dominated solutions.


Table 1.
Indicators of model fit of the experimental results and F-statistics for the decision criteria.
Table 1.
Indicators of model fit of the experimental results and F-statistics for the decision criteria.
| Criteria | MSE | R2 | Adj R2 | SSE | SSR | F-Value | p-Value |
|---|---|---|---|---|---|---|---|
| K1 | 2127.941 | 0.813 | 0.716 | 3.620 × 10⁴ | 8.970 × 10⁴ | 4.6842 | 3.100 × 10⁻³ |
| K2 | 1606.676 | 0.821 | 0.726 | 2.730 × 10⁴ | 1.250 × 10⁵ | 8.6418 | 8.510 × 10⁻⁵ |
| K3 | 16.410 | 0.820 | 0.723 | 278.848 | 1.260 × 10³ | 8.5237 | 9.290 × 10⁻⁵ |
| K4 | 2.450 | 0.890 | 0.830 | 41.7226 | 3.180 × 10² | 14.3846 | 2.640 × 10⁻⁶ |
Legend: SSE—sum of squared errors (residuals), expressed as a numerical value; SSR—sum of squares due to regression, or explained sum of squares (ESS)—sum of the differences between the predicted value and the mean of the dependent variable; pval—vector of p-values for testing whether elements of b are 0.
Table 2.
Optimal solutions from the Pareto front for decision variables.
| x1 (Sample/Solvent Ratio) | x2 (Microwave Power) | x3 (Time) | x1 (Sample/Solvent Ratio) | x2 (Microwave Power) | x3 (Time) |
|---|---|---|---|---|---|
| 0.0250 | 550.0000 | 30.0000 | 0.0607 | 721.4286 | 34.2857 |
| 0.0250 | 550.0000 | 34.2857 | 0.0607 | 735.7143 | 30.0000 |
| 0.0250 | 550.0000 | 38.5714 | 0.0607 | 735.7143 | 34.2857 |
| 0.0250 | 550.0000 | 42.8571 | 0.0607 | 735.7143 | 38.5714 |
| 0.0250 | 550.0000 | 47.1429 | 0.0607 | 735.7143 | 42.8571 |
| 0.0250 | 550.0000 | 51.4286 | 0.0607 | 735.7143 | 60.0000 |
| 0.0250 | 564.2857 | 30.0000 | 0.0607 | 735.7143 | 64.2857 |
| 0.0250 | 564.2857 | 34.2857 | 0.0607 | 735.7143 | 68.5714 |
| 0.0250 | 564.2857 | 38.5714 | 0.0607 | 735.7143 | 72.8571 |
| 0.0250 | 564.2857 | 42.8571 | 0.0607 | 735.7143 | 81.4286 |
| 0.0250 | 578.5714 | 30.0000 | 0.0607 | 735.7143 | 85.7143 |
| 0.0250 | 578.5714 | 34.2857 | 0.0607 | 735.7143 | 90.0000 |
| 0.0250 | 578.5714 | 38.5714 | 0.0607 | 750.0000 | 30.0000 |
| 0.0250 | 592.8571 | 30.0000 | 0.0607 | 750.0000 | 34.2857 |
| 0.0250 | 735.7143 | 38.5714 | 0.0607 | 750.0000 | 38.5714 |
| 0.0250 | 735.7143 | 42.8571 | 0.0607 | 750.0000 | 42.8571 |
| 0.0250 | 735.7143 | 47.1429 | 0.0607 | 750.0000 | 47.1429 |
| 0.0250 | 735.7143 | 51.4286 | 0.0607 | 750.0000 | 51.4286 |
| 0.0250 | 735.7143 | 55.7143 | 0.0607 | 750.0000 | 55.7143 |
| 0.0250 | 735.7143 | 60.0000 | 0.0607 | 750.0000 | 60.0000 |
| 0.0250 | 750.0000 | 38.5714 | 0.0607 | 750.0000 | 64.2857 |
| 0.0250 | 750.0000 | 42.8571 | 0.0607 | 750.0000 | 68.5714 |
| 0.0250 | 750.0000 | 47.1429 | 0.0607 | 750.0000 | 72.8571 |
| 0.0250 | 750.0000 | 51.4286 | 0.0607 | 750.0000 | 77.1429 |
| 0.0250 | 750.0000 | 55.7143 | 0.0607 | 750.0000 | 81.4286 |
| 0.0250 | 750.0000 | 60.0000 | 0.0607 | 750.0000 | 85.7143 |
| 0.0250 | 750.0000 | 64.2857 | 0.0607 | 750.0000 | 90.0000 |
| 0.0250 | 750.0000 | 68.5714 | 0.0643 | 550.0000 | 30.0000 |
| 0.0250 | 750.0000 | 72.8571 | 0.0643 | 550.0000 | 34.2857 |
| 0.0250 | 750.0000 | 77.1429 | 0.0643 | 550.0000 | 38.5714 |
| 0.0250 | 750.0000 | 81.4286 | 0.0643 | 550.0000 | 42.8571 |
| 0.0250 | 750.0000 | 85.7143 | 0.0643 | 550.0000 | 47.1429 |
| 0.0250 | 750.0000 | 90.0000 | 0.0643 | 550.0000 | 51.4286 |
| 0.0286 | 550.0000 | 30.0000 | 0.0643 | 564.2857 | 30.0000 |
| 0.0286 | 550.0000 | 34.2857 | 0.0643 | 578.5714 | 30.0000 |
| 0.0286 | 550.0000 | 38.5714 | 0.0643 | 592.8571 | 30.0000 |
| 0.0286 | 550.0000 | 42.8571 | 0.0643 | 607.1429 | 30.0000 |
| 0.0286 | 564.2857 | 30.0000 | 0.0643 | 621.4286 | 30.0000 |
| 0.0286 | 564.2857 | 34.2857 | 0.0643 | 635.7143 | 30.0000 |
| 0.0286 | 564.2857 | 38.5714 | 0.0643 | 650.0000 | 30.0000 |
| 0.0286 | 564.2857 | 42.8571 | 0.0643 | 664.2857 | 30.0000 |
| 0.0286 | 578.5714 | 30.0000 | 0.0643 | 678.5714 | 30.0000 |
| 0.0286 | 578.5714 | 34.2857 | 0.0643 | 692.8571 | 30.0000 |
| 0.0286 | 578.5714 | 38.5714 | 0.0643 | 707.1429 | 30.0000 |
| 0.0286 | 750.0000 | 51.4286 | 0.0643 | 721.4286 | 30.0000 |
| 0.0286 | 750.0000 | 55.7143 | 0.0643 | 721.4286 | 34.2857 |
| 0.0286 | 750.0000 | 60.0000 | 0.0643 | 721.4286 | 38.5714 |
| 0.0286 | 750.0000 | 64.2857 | 0.0643 | 735.7143 | 34.2857 |
| 0.0286 | 750.0000 | 68.5714 | 0.0643 | 735.7143 | 42.8571 |
| 0.0286 | 750.0000 | 72.8571 | 0.0643 | 735.7143 | 47.1429 |
| 0.0286 | 750.0000 | 77.1429 | 0.0643 | 735.7143 | 51.4286 |
| 0.0286 | 750.0000 | 81.4286 | 0.0643 | 735.7143 | 55.7143 |
| 0.0286 | 750.0000 | 85.7143 | 0.0643 | 735.7143 | 60.0000 |
| 0.0286 | 750.0000 | 90.0000 | 0.0643 | 735.7143 | 64.2857 |
| 0.0321 | 564.2857 | 30.0000 | 0.0643 | 735.7143 | 68.5714 |
| 0.0321 | 578.5714 | 30.0000 | 0.0643 | 735.7143 | 72.8571 |
| 0.0321 | 750.0000 | 51.4286 | 0.0643 | 735.7143 | 85.7143 |
| 0.0321 | 750.0000 | 55.7143 | 0.0643 | 735.7143 | 90.0000 |
| 0.0321 | 750.0000 | 60.0000 | 0.0643 | 750.0000 | 30.0000 |
| 0.0321 | 750.0000 | 64.2857 | 0.0643 | 750.0000 | 34.2857 |
| 0.0321 | 750.0000 | 68.5714 | 0.0643 | 750.0000 | 38.5714 |
| 0.0321 | 750.0000 | 72.8571 | 0.0643 | 750.0000 | 42.8571 |
| 0.0321 | 750.0000 | 77.1429 | 0.0643 | 750.0000 | 47.1429 |
| 0.0321 | 750.0000 | 81.4286 | 0.0643 | 750.0000 | 51.4286 |
| 0.0321 | 750.0000 | 85.7143 | 0.0643 | 750.0000 | 55.7143 |
| 0.0321 | 750.0000 | 90.0000 | 0.0643 | 750.0000 | 60.0000 |
| 0.0357 | 750.0000 | 55.7143 | 0.0643 | 750.0000 | 64.2857 |
| 0.0357 | 750.0000 | 60.0000 | 0.0643 | 750.0000 | 68.5714 |
| 0.0357 | 750.0000 | 64.2857 | 0.0643 | 750.0000 | 72.8571 |
| 0.0357 | 750.0000 | 68.5714 | 0.0643 | 750.0000 | 77.1429 |
| 0.0357 | 750.0000 | 72.8571 | 0.0643 | 750.0000 | 81.4286 |
| 0.0357 | 750.0000 | 77.1429 | 0.0643 | 750.0000 | 85.7143 |
| 0.0357 | 750.0000 | 81.4286 | 0.0643 | 750.0000 | 90.0000 |
| 0.0357 | 750.0000 | 85.7143 | 0.0679 | 550.0000 | 30.0000 |
| 0.0357 | 750.0000 | 90.0000 | 0.0679 | 550.0000 | 34.2857 |
| 0.0393 | 750.0000 | 55.7143 | 0.0679 | 550.0000 | 38.5714 |
| 0.0393 | 750.0000 | 60.0000 | 0.0679 | 550.0000 | 42.8571 |
| 0.0393 | 750.0000 | 64.2857 | 0.0679 | 550.0000 | 47.1429 |
| 0.0393 | 750.0000 | 68.5714 | 0.0679 | 550.0000 | 51.4286 |
| 0.0393 | 750.0000 | 72.8571 | 0.0679 | 564.2857 | 30.0000 |
| 0.0393 | 750.0000 | 77.1429 | 0.0679 | 578.5714 | 30.0000 |
| 0.0393 | 750.0000 | 81.4286 | 0.0679 | 592.8571 | 30.0000 |
| 0.0393 | 750.0000 | 85.7143 | 0.0679 | 607.1429 | 30.0000 |
| 0.0393 | 750.0000 | 90.0000 | 0.0679 | 621.4286 | 30.0000 |
| 0.0429 | 735.7143 | 64.2857 | 0.0679 | 635.7143 | 30.0000 |
| 0.0429 | 750.0000 | 51.4286 | 0.0679 | 650.0000 | 30.0000 |
| 0.0429 | 750.0000 | 55.7143 | 0.0679 | 664.2857 | 30.0000 |
| 0.0429 | 750.0000 | 60.0000 | 0.0679 | 678.5714 | 30.0000 |
| 0.0429 | 750.0000 | 64.2857 | 0.0679 | 692.8571 | 30.0000 |
| 0.0429 | 750.0000 | 68.5714 | 0.0679 | 707.1429 | 30.0000 |
| 0.0429 | 750.0000 | 72.8571 | 0.0679 | 721.4286 | 30.0000 |
| 0.0429 | 750.0000 | 77.1429 | 0.0679 | 735.7143 | 30.0000 |
| 0.0429 | 750.0000 | 81.4286 | 0.0679 | 735.7143 | 34.2857 |
| 0.0429 | 750.0000 | 85.7143 | 0.0679 | 735.7143 | 38.5714 |
| 0.0429 | 750.0000 | 90.0000 | 0.0679 | 735.7143 | 42.8571 |
| 0.0464 | 735.7143 | 55.7143 | 0.0679 | 735.7143 | 47.1429 |
| 0.0464 | 750.0000 | 42.8571 | 0.0679 | 735.7143 | 51.4286 |
| 0.0464 | 750.0000 | 47.1429 | 0.0679 | 735.7143 | 55.7143 |
| 0.0464 | 750.0000 | 51.4286 | 0.0679 | 735.7143 | 60.0000 |
| 0.0464 | 750.0000 | 55.7143 | 0.0679 | 735.7143 | 64.2857 |
| 0.0464 | 750.0000 | 60.0000 | 0.0679 | 735.7143 | 68.5714 |
| 0.0464 | 750.0000 | 64.2857 | 0.0679 | 735.7143 | 72.8571 |
| 0.0464 | 750.0000 | 68.5714 | 0.0679 | 750.0000 | 30.0000 |
| 0.0464 | 750.0000 | 72.8571 | 0.0679 | 750.0000 | 34.2857 |
| 0.0464 | 750.0000 | 77.1429 | 0.0679 | 750.0000 | 38.5714 |
| 0.0464 | 750.0000 | 81.4286 | 0.0679 | 750.0000 | 42.8571 |
| 0.0464 | 750.0000 | 85.7143 | 0.0679 | 750.0000 | 47.1429 |
| 0.0464 | 750.0000 | 90.0000 | 0.0679 | 750.0000 | 51.4286 |
| 0.0500 | 550.0000 | 34.2857 | 0.0679 | 750.0000 | 55.7143 |
| 0.0500 | 550.0000 | 38.5714 | 0.0679 | 750.0000 | 60.0000 |
| 0.0500 | 564.2857 | 30.0000 | 0.0679 | 750.0000 | 64.2857 |
| 0.0500 | 735.7143 | 38.5714 | 0.0679 | 750.0000 | 68.5714 |
| 0.0500 | 735.7143 | 47.1429 | 0.0679 | 750.0000 | 72.8571 |
| 0.0500 | 735.7143 | 51.4286 | 0.0679 | 750.0000 | 77.1429 |
| 0.0500 | 735.7143 | 55.7143 | 0.0679 | 750.0000 | 81.4286 |
| 0.0500 | 735.7143 | 60.0000 | 0.0679 | 750.0000 | 85.7143 |
Table 3.
Pareto front solution reduction—subsets of optimal solutions (smart Pareto) for decision variables.
Table 3.
Pareto front solution reduction—subsets of optimal solutions (smart Pareto) for decision variables.
| x1 (Sample/Solvent Ratio) | x2 (Microwave Power) | x2 (Time) | x1 (Sample/Solvent Ratio) | x2 (Microwave Power) | x3 (Time) |
|---|---|---|---|---|---|
| 0.0536 | 750 | 77.1429 | 0.0607 | 750 | 85.7143 |
| 0.0536 | 750 | 81.4286 | 0.0643 | 750 | 64.2857 |
| 0.0536 | 750 | 85.7143 | 0.0643 | 750 | 68.5714 |
| 0.0571 | 750 | 72.8571 | 0.0643 | 750 | 72.8571 |
| 0.0571 | 750 | 77.1429 | 0.0643 | 750 | 77.1429 |
| 0.0571 | 750 | 81.4286 | 0.0643 | 750 | 81.4286 |
| 0.0571 | 750 | 85.7143 | 0.0643 | 750 | 85.7143 |
| 0.0607 | 750 | 68.5714 | 0.0679 | 750 | 64.2857 |
| 0.0607 | 750 | 72.8571 | 0.0679 | 750 | 68.5714 |
| 0.0607 | 750 | 77.1429 | 0.0679 | 750 | 72.8571 |
| 0.0607 | 750 | 81.4286 | 0.0679 | 750 | 77.1429 |
Table 4.
The set of Pareto compromise solutions for the MAE extraction.
| x1 (Sample/Solvent Ratio) | x2 (Microwave Power) | x3 (Time) | x1 (Sample/Solvent Ratio) | x2 (Microwave Power) | x3 (Time) |
|---|---|---|---|---|---|
| 0.0357 | 750.0000 | 85.7143 | 0.0643 | 564.2857 | 30.0000 |
| 0.0357 | 750.0000 | 90.0000 | 0.0643 | 564.2857 | 34.2857 |
| 0.0393 | 750.0000 | 72.8571 | 0.0643 | 564.2857 | 38.5714 |
| 0.0393 | 750.0000 | 77.1429 | 0.0643 | 578.5714 | 30.0000 |
| 0.0393 | 750.0000 | 81.4286 | 0.0643 | 578.5714 | 34.2857 |
| 0.0393 | 750.0000 | 85.7143 | 0.0643 | 578.5714 | 38.5714 |
| 0.0393 | 750.0000 | 90.0000 | 0.0643 | 592.8571 | 30.0000 |
| 0.0429 | 750.0000 | 68.5714 | 0.0643 | 721.4286 | 47.1429 |
| 0.0429 | 750.0000 | 72.8571 | 0.0643 | 721.4286 | 51.4286 |
| 0.0429 | 750.0000 | 77.1429 | 0.0643 | 721.4286 | 55.7143 |
| 0.0429 | 750.0000 | 81.4286 | 0.0643 | 735.7143 | 42.8571 |
| 0.0429 | 750.0000 | 85.7143 | 0.0643 | 735.7143 | 47.1429 |
| 0.0429 | 750.0000 | 90.0000 | 0.0643 | 735.7143 | 51.4286 |
| 0.0464 | 550.0000 | 30.0000 | 0.0643 | 735.7143 | 55.7143 |
| 0.0464 | 550.0000 | 34.2857 | 0.0643 | 735.7143 | 60.0000 |
| 0.0464 | 750.0000 | 64.2857 | 0.0643 | 750.0000 | 38.5714 |
| 0.0464 | 750.0000 | 68.5714 | 0.0643 | 750.0000 | 42.8571 |
| 0.0464 | 750.0000 | 72.8571 | 0.0643 | 750.0000 | 47.1429 |
| 0.0464 | 750.0000 | 77.1429 | 0.0643 | 750.0000 | 51.4286 |
| 0.0464 | 750.0000 | 81.4286 | 0.0643 | 750.0000 | 55.7143 |
| 0.0464 | 750.0000 | 85.7143 | 0.0643 | 750.0000 | 60.0000 |
| 0.0500 | 550.0000 | 30.0000 | 0.0643 | 750.0000 | 64.2857 |
| 0.0500 | 550.0000 | 34.2857 | 0.0679 | 550.0000 | 30.0000 |
| 0.0500 | 550.0000 | 38.5714 | 0.0679 | 550.0000 | 34.2857 |
| 0.0500 | 564.2857 | 30.0000 | 0.0679 | 550.0000 | 38.5714 |
| 0.0500 | 750.0000 | 60.0000 | 0.0679 | 564.2857 | 30.0000 |
| 0.0500 | 750.0000 | 64.2857 | 0.0679 | 564.2857 | 34.2857 |
| 0.0500 | 750.0000 | 68.5714 | 0.0679 | 564.2857 | 38.5714 |
| 0.0500 | 750.0000 | 72.8571 | 0.0679 | 578.5714 | 30.0000 |
| 0.0500 | 750.0000 | 77.1429 | 0.0679 | 578.5714 | 34.2857 |
| 0.0500 | 750.0000 | 81.4286 | 0.0679 | 721.4286 | 42.8571 |
| 0.0536 | 550.0000 | 30.0000 | 0.0679 | 721.4286 | 47.1429 |
| 0.0536 | 550.0000 | 34.2857 | 0.0679 | 721.4286 | 51.4286 |
| 0.0536 | 550.0000 | 38.5714 | 0.0679 | 721.4286 | 55.7143 |
| 0.0536 | 564.2857 | 30.0000 | 0.0679 | 735.7143 | 38.5714 |
| 0.0536 | 564.2857 | 34.2857 | 0.0679 | 735.7143 | 42.8571 |
| 0.0536 | 564.2857 | 38.5714 | 0.0679 | 735.7143 | 47.1429 |
| 0.0536 | 750.0000 | 55.7143 | 0.0679 | 735.7143 | 51.4286 |
| 0.0536 | 750.0000 | 60.0000 | 0.0679 | 735.7143 | 55.7143 |
| 0.0536 | 750.0000 | 64.2857 | 0.0679 | 735.7143 | 60.0000 |
| 0.0536 | 750.0000 | 68.5714 | 0.0679 | 750.0000 | 34.2857 |
| 0.0536 | 750.0000 | 72.8571 | 0.0679 | 750.0000 | 38.5714 |
| 0.0571 | 550.0000 | 30.0000 | 0.0679 | 750.0000 | 42.8571 |
| 0.0571 | 550.0000 | 34.2857 | 0.0679 | 750.0000 | 47.1429 |
| 0.0571 | 550.0000 | 38.5714 | 0.0679 | 750.0000 | 51.4286 |
| 0.0571 | 550.0000 | 42.8571 | 0.0679 | 750.0000 | 55.7143 |
| 0.0571 | 564.2857 | 30.0000 | 0.0679 | 750.0000 | 60.0000 |
| 0.0571 | 564.2857 | 34.2857 | 0.0679 | 750.0000 | 64.2857 |
| 0.0571 | 564.2857 | 38.5714 | 0.0714 | 550.0000 | 30.0000 |
| 0.0571 | 578.5714 | 30.0000 | 0.0714 | 550.0000 | 34.2857 |
| 0.0571 | 578.5714 | 34.2857 | 0.0714 | 564.2857 | 30.0000 |
| 0.0571 | 735.7143 | 55.7143 | 0.0714 | 564.2857 | 34.2857 |
| 0.0571 | 735.7143 | 60.0000 | 0.0714 | 721.4286 | 38.5714 |
| 0.0571 | 750.0000 | 51.4286 | 0.0714 | 721.4286 | 42.8571 |
| 0.0571 | 750.0000 | 55.7143 | 0.0714 | 721.4286 | 47.1429 |
| 0.0571 | 750.0000 | 60.0000 | 0.0714 | 721.4286 | 51.4286 |
| 0.0571 | 750.0000 | 64.2857 | 0.0714 | 735.7143 | 38.5714 |
| 0.0571 | 750.0000 | 68.5714 | 0.0714 | 735.7143 | 42.8571 |
| 0.0607 | 550.0000 | 30.0000 | 0.0714 | 735.7143 | 47.1429 |
| 0.0607 | 550.0000 | 34.2857 | 0.0714 | 735.7143 | 51.4286 |
| 0.0607 | 550.0000 | 38.5714 | 0.0714 | 735.7143 | 55.7143 |
| 0.0607 | 550.0000 | 42.8571 | 0.0714 | 735.7143 | 60.0000 |
| 0.0607 | 564.2857 | 30.0000 | 0.0714 | 750.0000 | 34.2857 |
| 0.0607 | 564.2857 | 34.2857 | 0.0714 | 750.0000 | 38.5714 |
| 0.0607 | 564.2857 | 38.5714 | 0.0714 | 750.0000 | 42.8571 |
| 0.0607 | 578.5714 | 30.0000 | 0.0714 | 750.0000 | 47.1429 |
| 0.0607 | 578.5714 | 34.2857 | 0.0714 | 750.0000 | 51.4286 |
| 0.0607 | 578.5714 | 38.5714 | 0.0714 | 750.0000 | 55.7143 |
| 0.0607 | 735.7143 | 47.1429 | 0.0714 | 750.0000 | 60.0000 |
| 0.0607 | 735.7143 | 51.4286 | 0.0714 | 750.0000 | 64.2857 |
| 0.0607 | 735.7143 | 55.7143 | 0.0750 | 735.7143 | 38.5714 |
| 0.0607 | 735.7143 | 60.0000 | 0.0750 | 735.7143 | 42.8571 |
| 0.0607 | 750.0000 | 42.8571 | 0.0750 | 735.7143 | 47.1429 |
| 0.0607 | 750.0000 | 47.1429 | 0.0750 | 735.7143 | 51.4286 |
| 0.0607 | 750.0000 | 51.4286 | 0.0750 | 750.0000 | 34.2857 |
| 0.0607 | 750.0000 | 55.7143 | 0.0750 | 750.0000 | 38.5714 |
| 0.0607 | 750.0000 | 60.0000 | 0.0750 | 750.0000 | 42.8571 |
| 0.0607 | 750.0000 | 64.2857 | 0.0750 | 750.0000 | 47.1429 |
| 0.0607 | 750.0000 | 68.5714 | 0.0750 | 750.0000 | 51.4286 |
| 0.0643 | 550.0000 | 30.0000 | 0.0750 | 750.0000 | 55.7143 |
| 0.0643 | 550.0000 | 34.2857 | 0.0750 | 750.0000 | 60.0000 |
| 0.0643 | 550.0000 | 38.5714 |
Disclaimer/Publisher’s Note: The statements, opinions and data contained in all publications are solely those of the individual author(s) and contributor(s) and not of MDPI and/or the editor(s). MDPI and/or the editor(s) disclaim responsibility for any injury to people or property resulting from any ideas, methods, instructions or products referred to in the content. |
© 2024 by the authors. Licensee MDPI, Basel, Switzerland. This article is an open access article distributed under the terms and conditions of the Creative Commons Attribution (CC BY) license (https://creativecommons.org/licenses/by/4.0/).
Share and Cite
MDPI and ACS Style
Plawgo, M.; Kocira, S.; Bohata, A. Optimizing Microwave-Assisted Extraction from Levisticum officinale WDJ Koch Roots Using Pareto Optimal Solutions. Processes 2024, 12, 1026. https://doi.org/10.3390/pr12051026
AMA Style
Plawgo M, Kocira S, Bohata A. Optimizing Microwave-Assisted Extraction from Levisticum officinale WDJ Koch Roots Using Pareto Optimal Solutions. Processes. 2024; 12(5):1026. https://doi.org/10.3390/pr12051026
Chicago/Turabian StylePlawgo, Michał, Sławomir Kocira, and Andrea Bohata. 2024. "Optimizing Microwave-Assisted Extraction from Levisticum officinale WDJ Koch Roots Using Pareto Optimal Solutions" Processes 12, no. 5: 1026. https://doi.org/10.3390/pr12051026
Note that from the first issue of 2016, this journal uses article numbers instead of page numbers. See further details here.