Article

Effect of Obstructive Sleep Apnea during Pregnancy on Fetal Development: Gene Expression Profile of Cord Blood

by
Laura Cànaves-Gómez
1,
Aarne Fleischer
1,2,
Josep Muncunill-Farreny
1,2,
María Paloma Gimenez
1,
Ainhoa Álvarez Ruiz De Larrinaga
3,4,
Andrés Sánchez Baron
5,
Mercedes Codina Marcet
6,
Mónica De-La-Peña
1,7,8,9,
Daniel Morell-Garcia
1,10,
José Peña Zarza
1,11,
Concepción Piñas Zebrian
1,7,
Susana García Fernández
1,7 and
Alberto Alonso
1,7,8,9,*
1
Instituto de Investigación Sanitaria Illes Balears (IdISBa), 07120 Palma de Mallorca, Spain
2
Genomic & Bioinformatics Platform, IdISBa, 07120 Palma de Mallorca, Spain
3
Hospital Universitario de Araba, 01009 Vitoria-Gasteiz, Spain
4
Departamento de Neurociencias, Instituto de Investigación Sanitaria Bioaraba, 01009 Vitoria-Gasteiz, Spain
5
Hospital Universitario Miguel Servet, 50009 Zaragoza, Spain
6
Servicio de Endocrinología, Hospital Universitari Son Espases, 07120 Palma de Mallorca, Spain
7
Servicio de Neumología, Hospital Universitari Son Espases, 07120 Palma de Mallorca, Spain
8
Facultad de Medicina, Universidad de las Islas Baleares, 07122 Palma de Mallorca, Spain
9
Centro de Investigación Biomédica en Red de Enfermedades Respiratorias, Instituto de Salud Carlos III (CIBERES), 28029 Madrid, Spain
10
Servicio de Análisis Clínicos, Hospital Universitari Son Espases, 07120 Palma de Mallorca, Spain
11
Servicio de Pediatría, Hospital Universitari Son Espases, 07120 Palma de Mallorca, Spain
*
Author to whom correspondence should be addressed.
Int. J. Mol. Sci. 2024, 25(10), 5537; https://doi.org/10.3390/ijms25105537
Submission received: 29 April 2024 / Revised: 15 May 2024 / Accepted: 16 May 2024 / Published: 19 May 2024
(This article belongs to the Special Issue Molecular Pathogenesis and Diagnostics of Lung Diseases)

Abstract

:
Obstructive sleep apnea (OSA) is quite prevalent during pregnancy and is associated with adverse perinatal outcomes, but its potential influence on fetal development remains unclear. This study investigated maternal OSA impact on the fetus by analyzing gene expression profiles in whole cord blood (WCB). Ten women in the third trimester of pregnancy were included, five OSA and five non-OSA cases. WCB RNA expression was analyzed by microarray technology to identify differentially expressed genes (DEGs) under OSA conditions. After data normalization, 3238 genes showed significant differential expression under OSA conditions, with 2690 upregulated genes and 548 downregulated genes. Functional enrichment was conducted using gene set enrichment analysis (GSEA) applied to Gene Ontology annotations. Key biological processes involved in OSA were identified, including response to oxidative stress and hypoxia, apoptosis, insulin response and secretion, and placental development. Moreover, DEGs were confirmed through qPCR analyses in additional WCB samples (7 with OSA and 13 without OSA). This highlighted differential expression of several genes in OSA (EGR1, PFN1 and PRKAR1A), with distinct gene expression profiles observed during rapid eye movement (REM)-OSA in pregnancy (PFN1, UBA52, EGR1, STX4, MYC, JUNB, and MAPKAP). These findings suggest that OSA, particularly during REM sleep, may negatively impact various biological processes during fetal development.

1. Introduction

Obstructive sleep apnea (OSA) is the most common sleep-related breathing disorder, and it is defined by recurrent episodes of complete (apneas) or partial (hypopneas) airflow obstruction in the upper airway while the patient sleeps [1]. Pregnancy increases the prevalence of OSA due to several physiological factors, such as weight gain, hormonal changes, or upper airway abnormalities [2,3].
OSA results in fluctuating oxygen levels, arousals, increased heart rate, blood pressure, and systemic inflammation [4], all of which can negatively impact pregnancy/fetal outcomes [5]. Accumulating evidence suggests that pregnancy-related OSA has been linked to some adverse events, including gestational diabetes mellitus (GDM), preeclampsia, preterm birth, and neonatal low weight [6,7]. However, high variability of reported rates [8,9,10,11,12] and inconsistent results have been described so far [13,14,15]. Moreover, rapid eye movement (REM) is associated with increased severity of OSA in the general population. REM-related OSA is common in young women, particularly in mild–moderate OSA, and it has been independently related with insulin resistance [16], neurocognitive symptoms [17], and cardiovascular consequences [18]. Furthermore, significant associations have been found between REM-apnea hypopnea index (AHI) with inflammatory biomarkers in pregnant women [4], higher nocturnal glucose levels [19], and increased GDM risk [20].
Although there is some information about perinatal consequences, the effects of intrauterine exposure to maternal OSA on childhood and adulthood long-term outcomes remain unknown. Fetal programming theory suggests that dysregulation in utero environment modifies the course of fetal development, resulting in long-lasting changes in the structure and function of biological systems. These may play a key role in determining lifelong health trajectories that can lead to developmental changes that may increase disease risk, like in cardiovascular and metabolic syndromes [21,22]. The specific underlying mechanisms remain elusive, but genetic and epigenetic changes may play a key role in these processes [8,23]. The hostile intrauterine environment secondary to maternal breathing pauses and nocturnal hypoxia could potentially impact the expression of certain genes, which may affect the metabolism and physiology in the most vulnerable period of life, such as the fetal period, leading to alterations in its growth patterns and to medium and long-term clinical outcomes. Maternal OSA could result in changes in birth weight (BW). Interestingly, a high BW has been found to determine the risk of obesity in school-age children [24]. In addition, an experimental study using a rat model found out that maternal hypoxia is associated with changes of periventricular white matter in adult offspring [25]. Other studies suggested that OSA during pregnancy affects the growth of head circumference and adiposity parameters [26] as well as the normal development on early childhood [27,28].
Several studies have analyzed gene expression in samples from adult patients with OSA, with the aim of identifying biomarkers for diagnosis, developing new therapeutic targets, and better understanding the pathophysiology mechanisms. These studies have found changes in the expression of genes in patients with OSA compared to controls [29,30,31]. The genes with altered expression were associated with various biological pathways and processes, including inflammation, oxidative stress, metabolism, cardiovascular function, and neurotransmission, among others [32]. Contrary to what occurs in adulthood, few studies have evaluated the influence of OSA during pregnancy or on gene expression patterns in both maternal and fetal tissues [33,34]. Some of the identified genes include those involved in inflammation (e.g., IL-6, TNF-alpha) [4]. Additionally, genes related to placental function and fetal development, such as leptin [33,35], may also play a role in mediating the effects of maternal OSA. Yet, contradictory data have also been reported [34]. Moreover, studies are still scarce and heterogeneous, and they show some limitations regarding, for example, sleep assessment procedures, sample size, and scientific designs. Therefore, many uncertainties still remain about medium- and long-term outcomes of maternal OSA on their offspring.
Some animal models have shown the health consequences of OSA and intermittent hypoxia during pregnancy on both mothers and offspring. Conducted in rats and mice, these experiments have revealed a variety of outcomes, including fetal growth restriction, hypertension in offspring, morphological and functional changes in the placenta, and long-term cardiovascular alterations in descendants. These findings underscore the importance of understanding the effects and mechanisms of poor outcomes of OSA during pregnancy on both mothers and their offspring, providing a solid foundation for future research on preventive and therapeutic interventions [36,37,38].
Gene expression studies on umbilical cord blood have provided valuable insights into the genetic underpinnings of various diseases. They encompass a wide range of conditions, such as genetic disorders, developmental abnormalities, immune system dysregulation, and metabolic diseases. These studies have unveiled intricate gene regulatory networks and identified potential biomarkers for disease prediction, diagnosis, and therapeutic interventions [8,39].
Several studies have investigated the impact of maternal OSA on maternal health and certain molecular pathways. However, to our knowledge, no previous data on gene expression in whole cord blood (WCB) from pregnant women with OSA have been published yet. For this reason, our study could provide valuable insights into understanding the comprehensive effects of OSA on both maternal and fetal health outcomes, thus opening the avenue to the development of targeted interventions to improve pregnancy outcomes in this population.
The main aim of this study was to assess the impact of maternal OSA on the fetus by studying the gene expression in WCB samples from women with and without OSA, which was confirmed during the third trimester of pregnancy through full polysomnography (PSG). As a secondary objective, we evaluated the impact of maternal OSA during REM sleep on fetal gene expression.

2. Results

2.1. Subjects of Study

A total of 10 and 20 women were included in the microarray and qPCR cohorts, respectively (Figure 1). The anthropometric characteristics of pregnant women are shown in Table 1. There were no differences in age and pregestational BMI. As expected, patients with OSA had worse apnea–hypopnea index (AHI) and desaturation index than the non-apneic women, although there were no differences in the Epworth Sleepiness Scale (ESS).

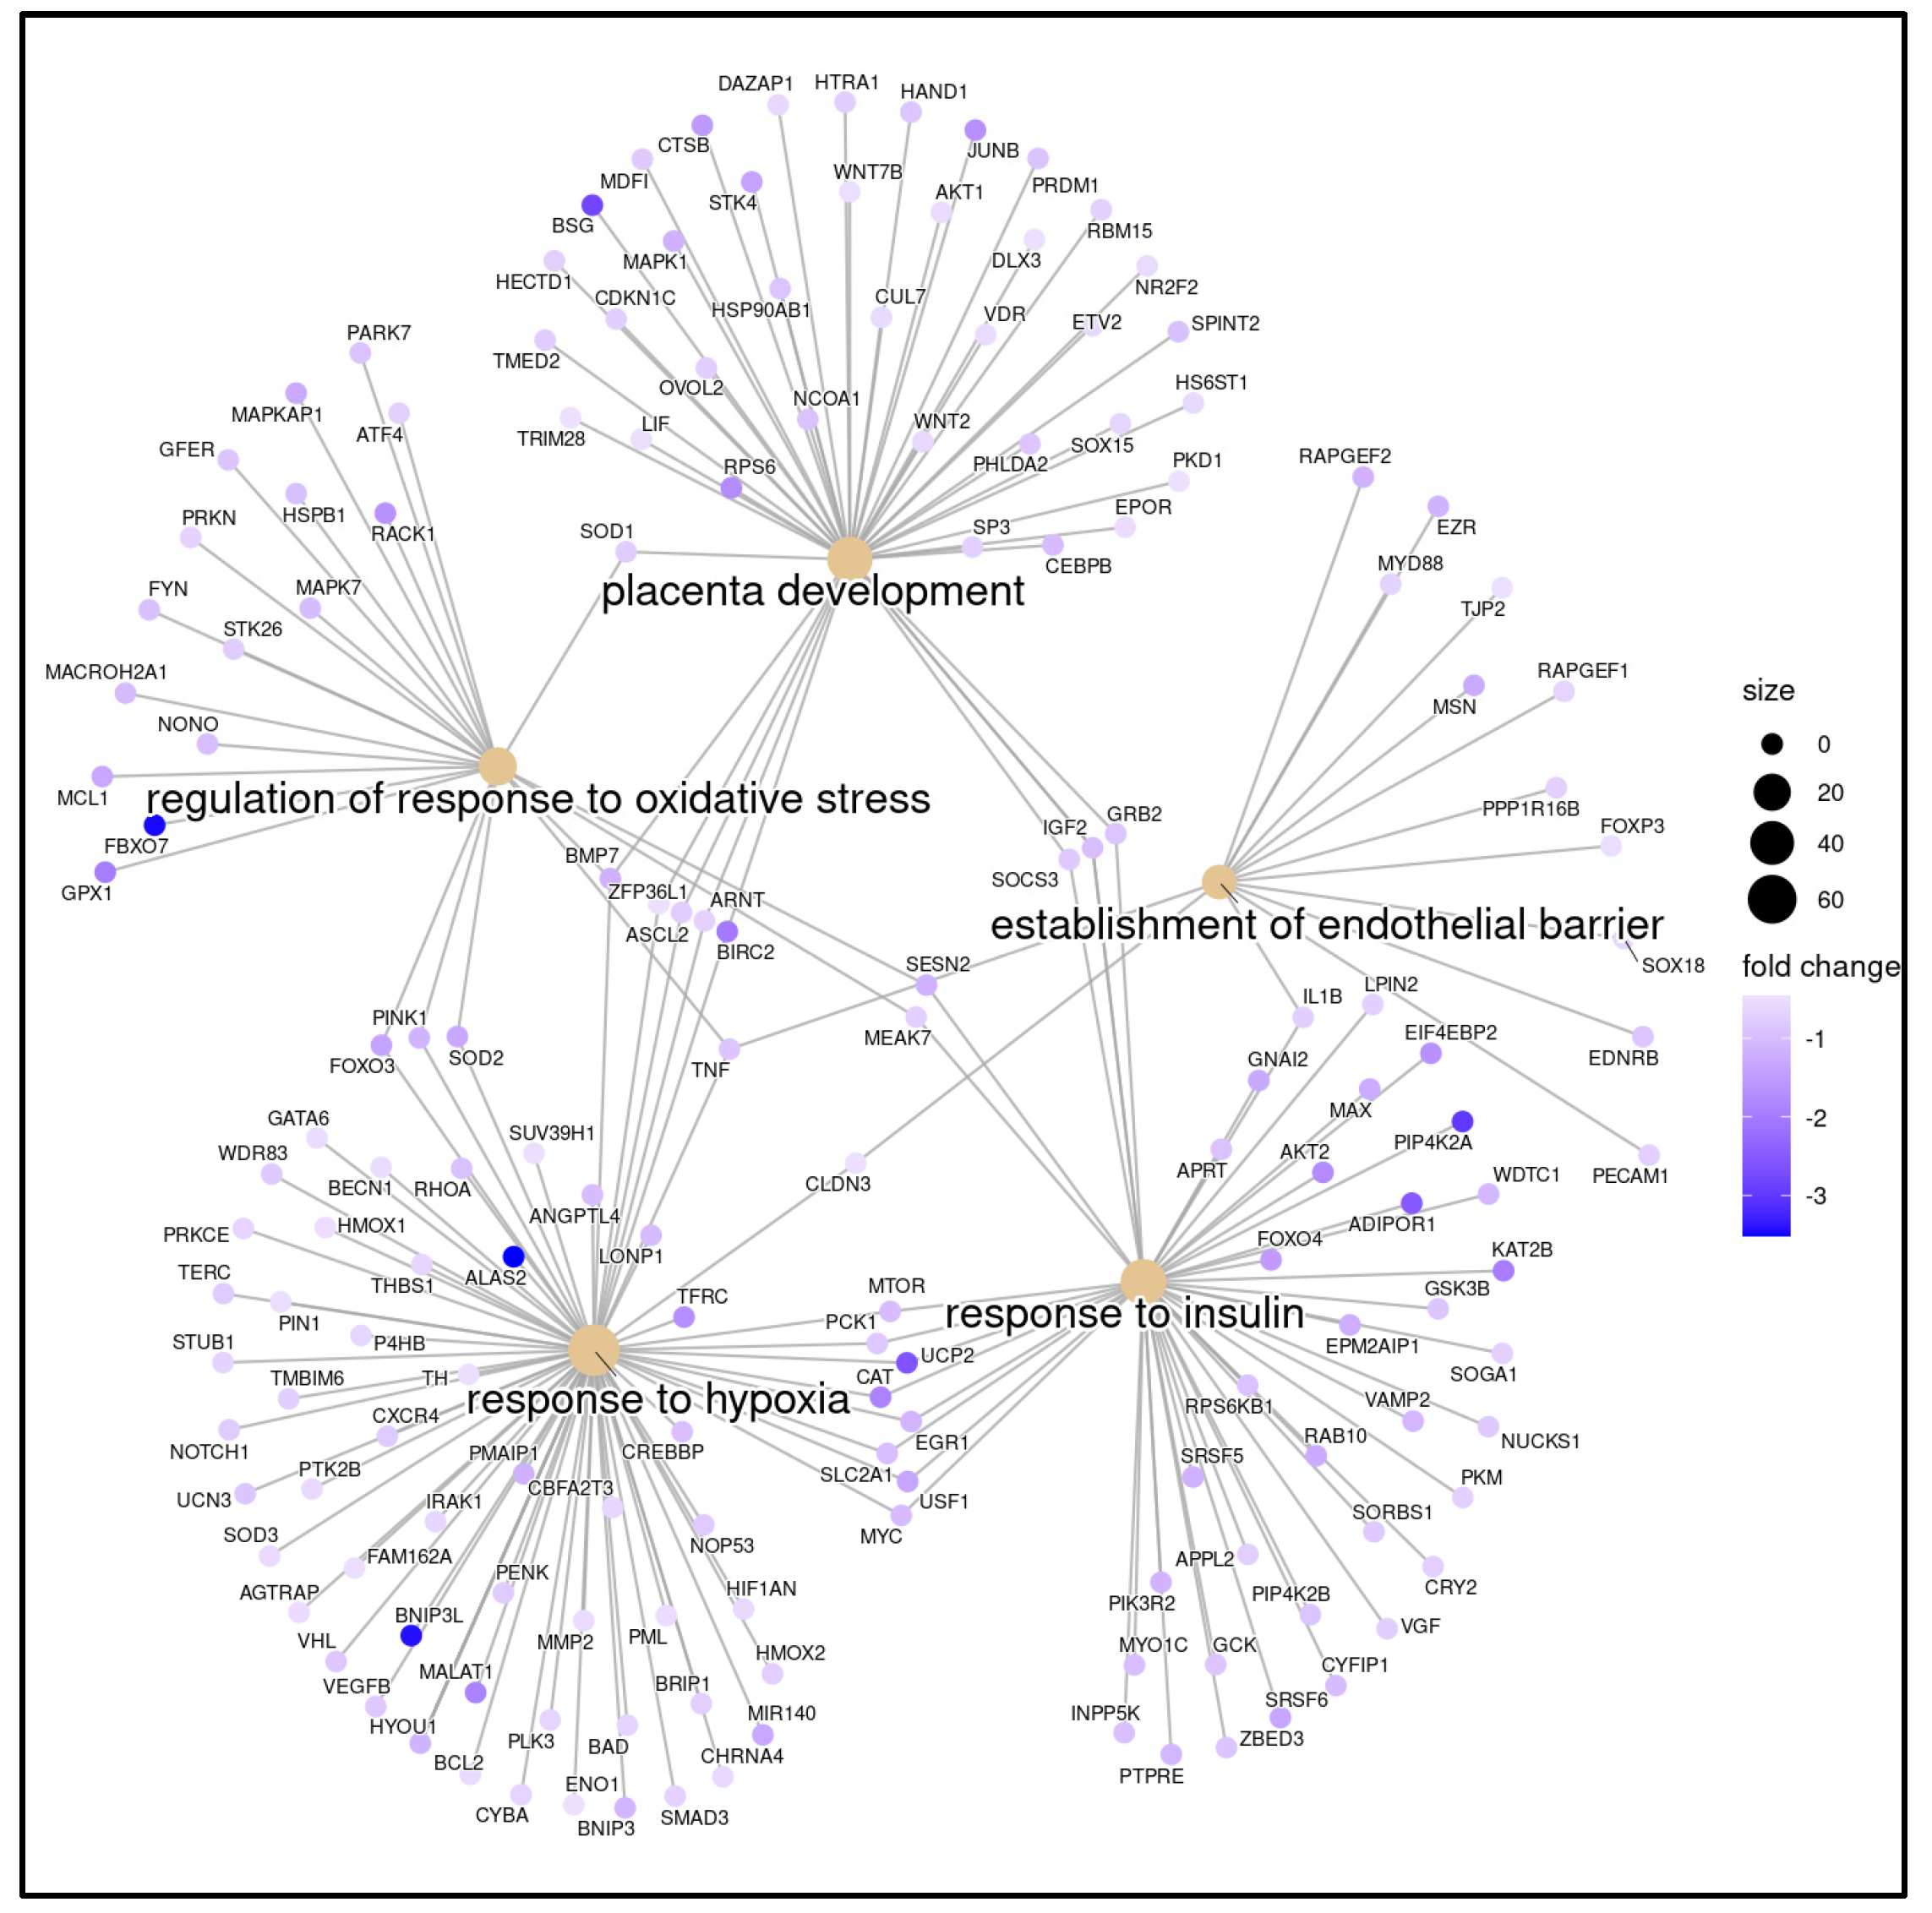
2.2. Gene Expression Profiling Analysis

The mRNA expression profiling data showed 3258 mRNAs differentially expressed in WCB samples from women with OSA compared to the non-OSA group. A total of 2690 mRNAs were significantly upregulated in the OSA group, and 568 mRNAs were significantly downregulated (fold change ≥ 2.0) (Figure 1). The volcano plot illustrates the whole set of differentially expressed mRNAs, with the key genes indicated in this study (FDR adjusted p-value < 0.05; Figure 2a). Furthermore, the heatmap provides insights into the expression and clustering of the top 50 up- and downregulated genes, with key genes indicated and further analyzed in this study (Figure 2b).
To better understand the potential pathways that might be involved in the biological processes affected in WCB with OSA, transcripts obtained from genes encoding or related to differentially expressed mRNAs were subjected to GSEA analysis to determine which pathways are enriched in genes at both ends of the list of differentially expressed mRNAs. Gene Ontology (GO) analysis was performed to determine gene and gene product features in biological processes, cellular components, and molecular activities. A total of 23 biological processes were found to be highly enriched among the associated mRNA transcripts (FDR < 0.05). The most relevant GOs after filtering by keywords were grouped into five main clusters: placenta development, response to insulin, response to oxidative stress, positive regulation of programmed cell death, and leukocyte adhesion to vascular endothelial cell (Figure 3a,b).
Through keyword KEGG analysis, we could identify 6 out of 260 significant biological processes that potentially play an important role in the fetus when exposed to maternal OSA. These were apoptosis, insulin signaling pathways, leukocyte endothelial migration, and type 1 diabetes mellitus (Figure 4), confirming the results obtained by GO analysis. The keywords were as follows: gestational diabetes mellitus, diabetes, metabolic syndrome, preeclampsia, prematurity, abnormal fetal growth, obesity, fetal, hypertension, neurodevelopmental, OSA, sleep disorder breathing, sleep apnea, sudden death, sleep, inflammation, cellular death, death, apoptosis, insulin, insulin resistance, oxidative stress, endothelial dysfunction, endothelial, sympathetic activation, placenta, placental, placental dysfunction, placental injury and dysfunction, angiogenic, angiogenesis, hypoxia, intermittent hypoxia, sleep fragmentation, and sleep arousals.

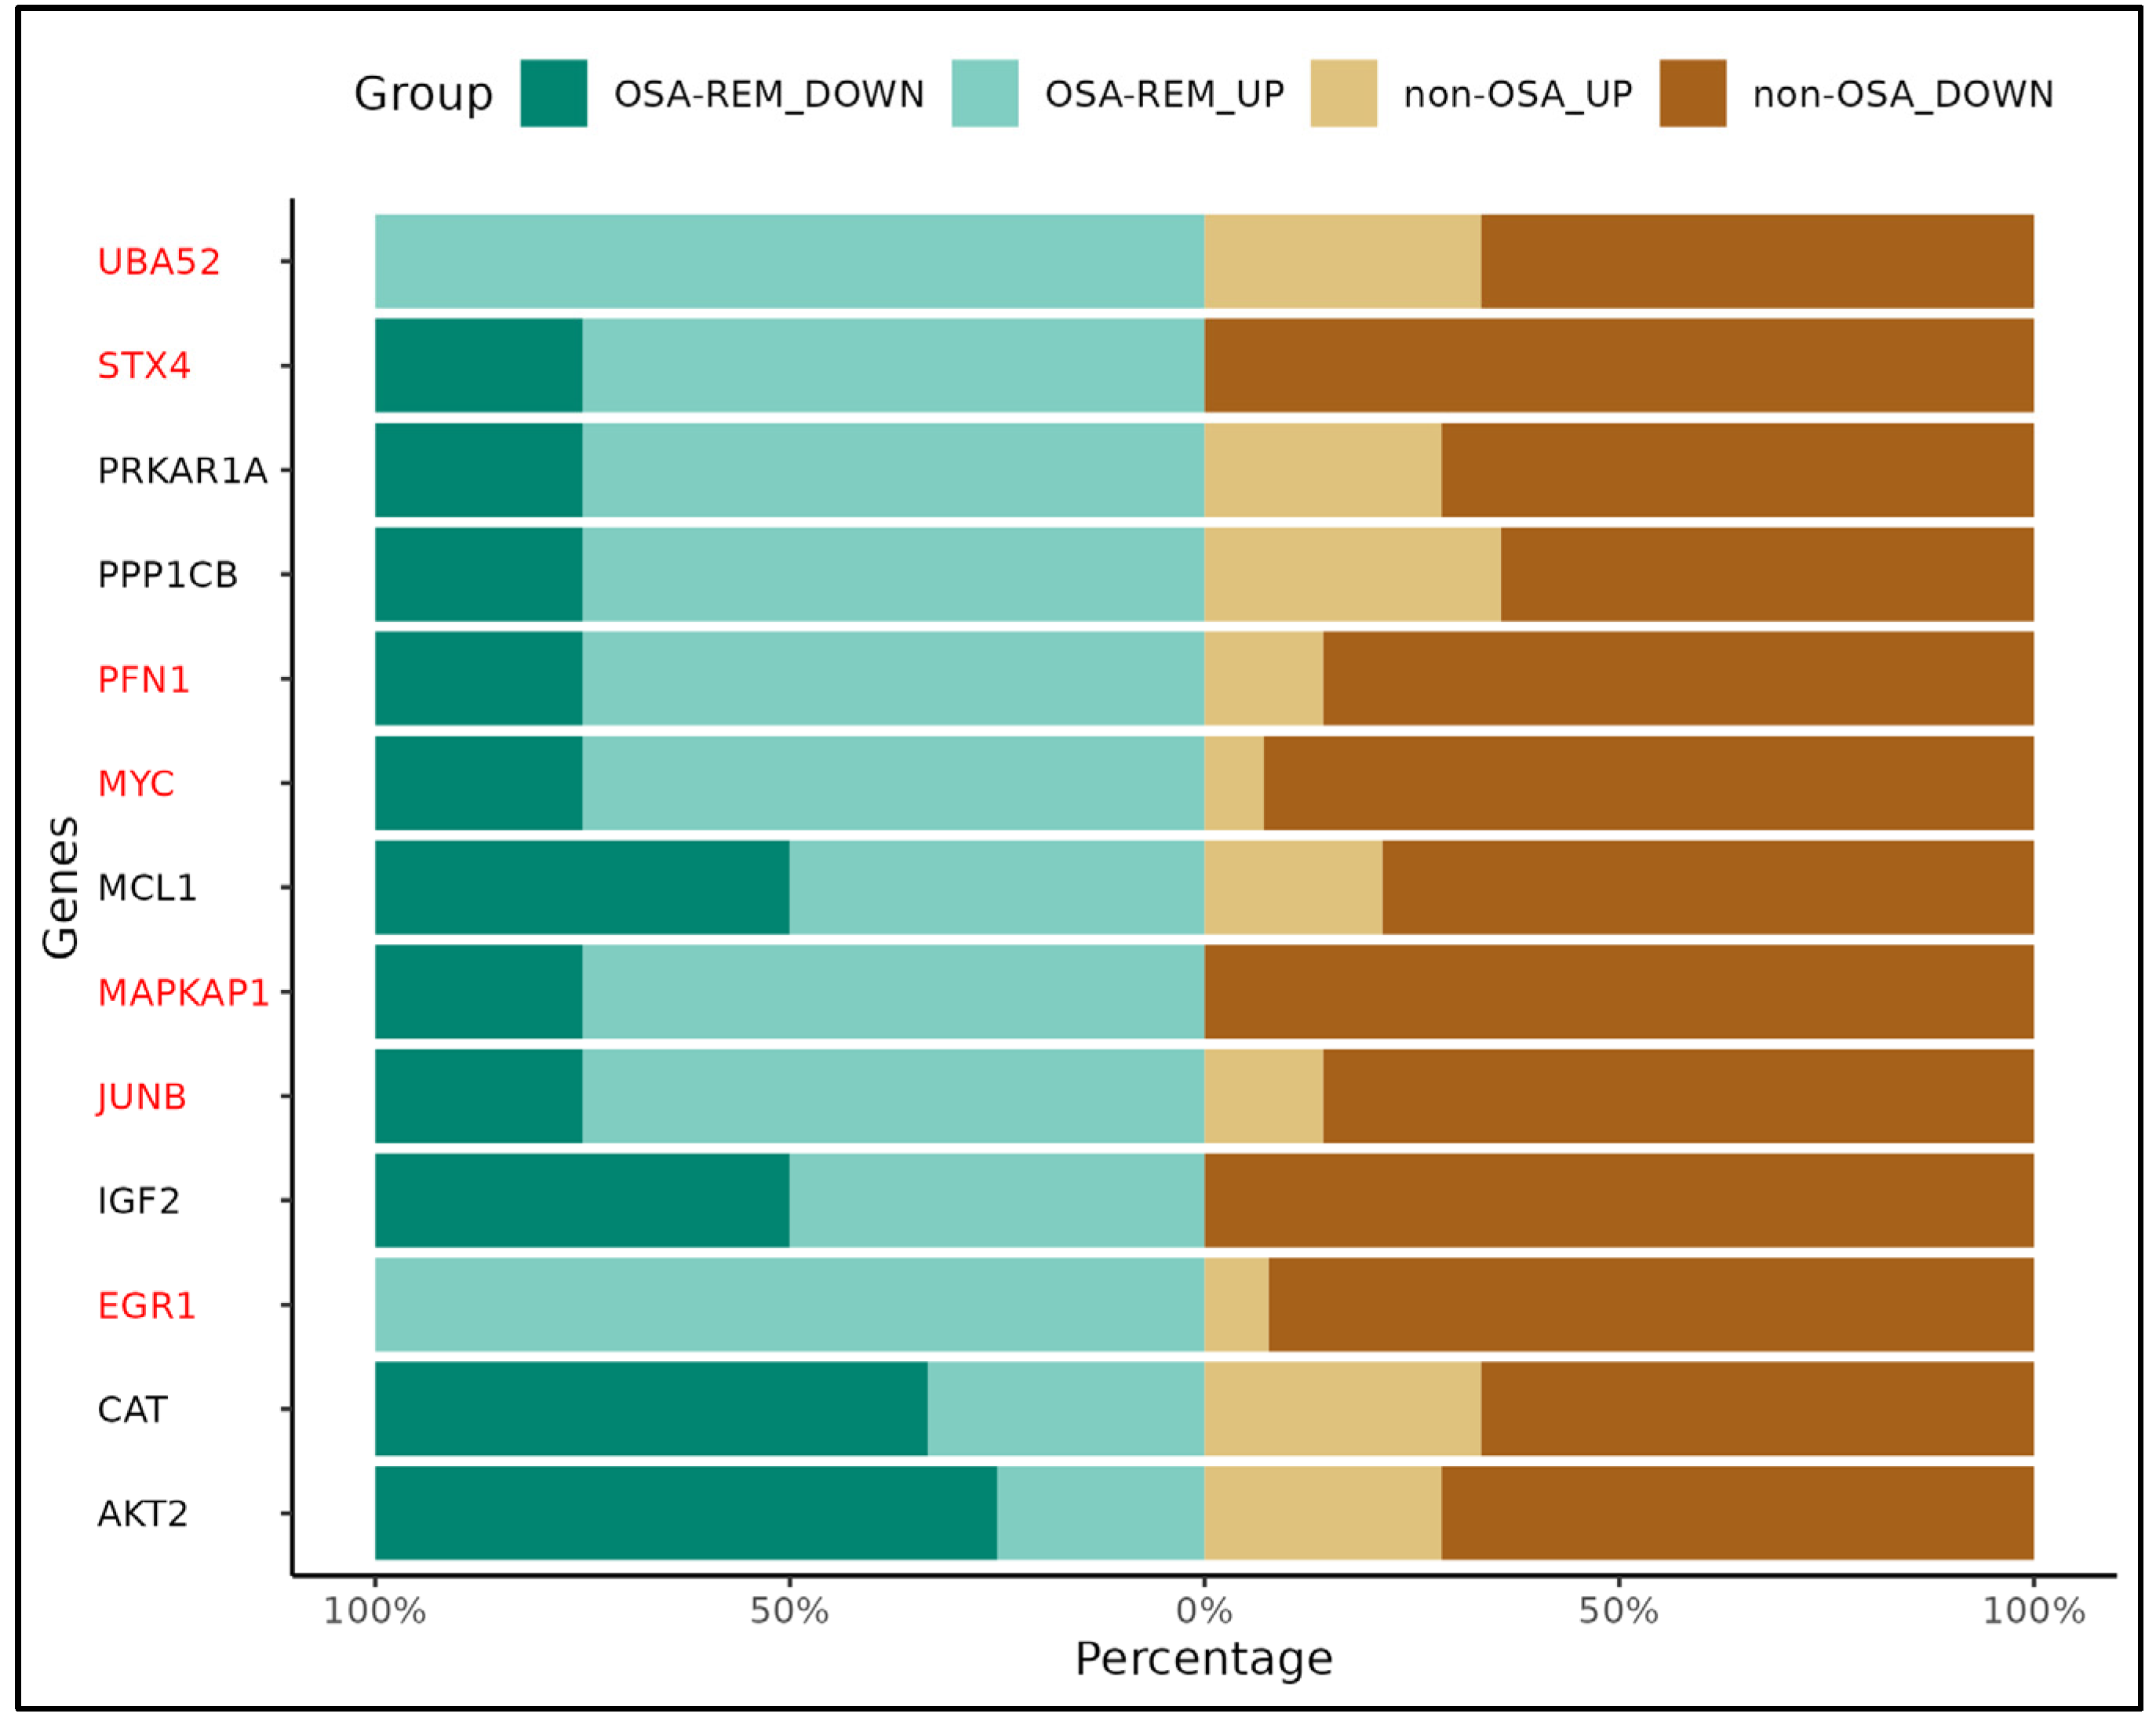
2.3. Gene Validation (qRT-PCR)

Based on bioinformatical analysis, 13 candidate genes that are potentially deregulated in WCB cells upon maternal OSA were selected from the gene list previously identified in the five biological processes, including 12 upregulated mRNAs (PFN1, UBA52, EGR1, STX4, MYC, JUNB, MAPKAP1, IGF2, CAT, MCL1, PPP1CB and AKT2) and 1 downregulated mRNA (PRKAR1A) (Figure 5).
We found that the qRTPCR results were consistent with the microarray data, as we found differential expression of EGR1 and PFN1 genes in OSA patients (Figure 6). Furthermore, the expression of UBA52, STX4, PFN1, MYC, MAPKAP1, JUNB, and EGR1 genes were significantly different depending on whether they came from mothers with or without OSA during REM sleep time (Figure 7). All these genes are implicated in the response to oxidative stress and hypoxia, apoptosis, placenta development, and in insulin response and secretion.

3. Discussion

Our study supports the notion that the adverse effects of maternal OSA extend beyond maternal health, impacting the developing fetus through altered gene expression profiles during this critical period of life.
Bioinformatics tools are becoming increasingly relevant in studying multifactorial and complex diseases. The discovery of gene expression alterations in disease is a crucial step toward a better understanding of the pathophysiology and, ultimately, a better diagnosis and treatment.
In adulthood, OSA is a complex and multifactorial condition defined by the interplay between apnea and intermittent hypoxia, along with associated genetic expression. Intermittent hypoxia, a hallmark of OSA, triggers a cascade of physiological responses, including oxidative stress and inflammation, which in turn can modulate gene expression. This dynamic process influences various cellular pathways, contributing to the pathogenesis and progression of OSA-related complications. Moreover, the environmental context adds another layer of complexity. Lifestyle factors such as smoking, obesity, and sedentary behavior exacerbate the severity of OSA, further complicating its management and outcomes [40,41,42]. Comprehending the complex interplay among genetic predisposition, intermittent hypoxia, and environmental factors is essential to fully understand the spectrum of OSA and craft personalized therapeutic interventions.
A previous study found overall similar gene expression profiles in placenta from pregnant women with OSA compared to non-OSA [34]. The mean BMI was over 40 kg/m2, maybe because they over-included subjects with class III obesity. Therefore, obesity and the inclusion of women with GDM and preeclampsia in the study samples might have an impact on the findings. Additionally, it cannot be ruled out that the placenta may be able to compensate for the detrimental effects of OSA on gene expression. To the best of our knowledge, we analyzed for the first time the influence of gestational OSA on WCB gene expression profiles. Approximately 3000 genes were found to be differentially expressed, suggesting that the occurrence and consequences of maternal OSA on the offspring seems to be a complex biological process involving multiple genes and steps.
Furthermore, biological function and pathway enrichment analyses showed that DEGs were mainly involved in the GO terms or KEGG pathways associated with response to oxidative stress, insulin response and signaling pathways, placenta development, response to hypoxia, cell death, and formation of endothelial barrier. These findings provide novel insights into fetal development and fetal gene expression in maternal OSA, as umbilical cord blood samples are representative of the in utero milieu of a neonate shortly before birth.
It is commonly recognized that the prevalence of OSA during pregnancy fluctuates with maternal BMI and the timing of gestation, ranging from 8.5% in subjects with normal weight to 62% in women with obesity [43]. In recent years, growing evidence has shown that OSA may negatively impact pregnancy outcomes, such as a higher risk of GDM and preeclampsia, as well as preterm delivery, low birth weight, or higher risk of maternal morbidity [6,7]. Furthermore, a few studies have shown that OSA during the REM sleep phase may be particularly relevant in the context of pregnancy, as this phase entails increased relaxation of the upper airway muscles, thereby heightening the risk of obstructive apneas. In addition, REM OSA is usually associated with longer respiratory events and higher hypoxia than OSA during non-REM sleep [44]. Also, REM OSA has been linked to higher GDM risk [20].
PFN1 and EGR1 were identified in this study as differentially expressed genes in WCB samples from mothers who had OSA in the third trimester of pregnancy. Interestingly, our results also show different gene expression profiles of UBA52, STX4, PFN1, MYC, MAPKAP1, JUNB, and EGR1 in those women with REM OSA.
The expression levels of those genes have been implicated in perinatal health issues and childhood development. They were shown to play crucial roles in various cellular processes, including transcriptional regulation (EGR1, JUNB, and MYC), immune response (PRF1), protein degradation (UBA52), and both intracellular signaling (MAPKAP1) and vesicle trafficking (STX4) [39,45,46,47,48]. Dysregulation of these genes has been associated with adverse perinatal outcomes such as low birth weight, intrauterine growth restriction, and neonatal complications, as well as with developmental disorders in children [26,47,49]. The observed differential expression of PFN1 and EGR1 suggests a potential role for these genes in the pathophysiology of OSA during pregnancy and its impact on fetal development. PFN1, encoding profilin 1, is involved in actin dynamics and cellular processes that are crucial for proper fetal development. The dysregulation of PFN1 expression may reflect disturbances in cellular function and signaling pathways in response to maternal OSA [46]. In consonance with the results, Liu et al. found that a reduction in sleep duration upregulated several genes, including PFN1, which is also a negative regulator of the migratory and elimination capabilities of cytotoxic cells, and JUNB, an autoimmune gene.
The main objective of this study was to assess the impact of maternal OSA on the gene expression in WCB samples. However, the sample size of the present study was certainly insufficiently powered to find differences in perinatal outcomes. In our study, the median observed birth weight was 3205 g, and none of the subjects met the criteria for low birth weight, which could limit further analysis. Small for gestational age neonates were found to have a modified expression on the EGR1 gene network, which is involved in the regulation of cell proliferation and oxidative stress [50]. In addition, EGR1 was positively correlated with abdominal circumference and birthweight [39]. While we did not find significant differences in perinatal outcomes between OSA and non-OSA groups, we did find an association between altered expression of EGR1 and OSA and REM OSA in pregnant women, all of which could support the hypothesis that differential regulation of EGR1 may contribute to increased fetal susceptibility to complications, such as low birth weight and intrauterine growth restriction in the presence of maternal OSA [39]. Taken together, all these considerations point out that the significant alterations observed in the expression levels of all these genes underscore the potential impact of maternal OSA on fetal gene regulation during this critical period of life. These findings shed light on potential molecular mechanisms underlying this relationship, and they suggest that maternal OSA, particularly during REM sleep, may influence fetal gene expression patterns associated with key cellular functions, which could contribute to the adverse developmental outcomes observed in the offspring of mothers with OSA, as well as to long-term health outcomes. Further mechanistic studies are needed to elucidate the specific roles and pathways of these genes in mediating the effects of maternal OSA on fetal development.
In the present study, we evaluated for the first time the influence of maternal OSA on the gene expression in WCB samples. The strengths of this study comprised its multicenter and prospective design, systematic sleep, and clinical phenotyping, including hospital PSG (the gold standard investigation for OSA in pregnancy) [6,51], as well as a careful adjustment for confounding factors, including BMI, maternal age, and the gestation age both at PSG and at delivery. Additionally, women with significant comorbidities, such as gestational hypertension, GDM, and preeclampsia, among others, were carefully excluded from this study to minimize confounding factors that may modulate gene expression profiles. Yet, as with any study, we should point out some limitations. First, all women in the OSA group had mild OSA and had a slight impact on DI. It is well established that mild OSA accounts for most women during pregnancy, which is associated with an increased risk of hypertensive disorders, gestational diabetes, and poor pregnancy outcomes [6,9]. Therefore, a gene expression study was relevant in these patients to better understand the mechanisms and consequences of OSA in this unique population. Nevertheless, the impact of moderate/severe OSA with greater magnitude of nocturnal hypoxemia during pregnancy has yet to be determined with further studies. Second, we included mainly Caucasian women in their healthy weight range, thus, our results may not be applied to different ethnic backgrounds and/or to women with overweight or obesity. Finally, the current sample size was not sufficiently large to incorporate many factors into our analysis, such as demographic variables, environmental influences, lifestyle factors, medical history, or other variables that might be relevant to the study. Nonetheless, there were no differences in BMI or in maternal and gestational age, and the size was sufficient to demonstrate significant differences in gene expression patterns.

4. Materials and Methods

4.1. Study Population

We performed a case-control study. Women were selected from a large study evaluating consequences of OSA during pregnancy from three Spanish university hospitals (Son Espases, Araba, and Miguel Servet). Inclusion criteria were (1) singleton pregnant women in the third trimester and (2) signed and informed consent (IC). Participants with previous OSA diagnosis, complicated pregnancies (gestational hypertension, GDM, preeclampsia, and any other significant obstetrical complication), other prior chronic diseases (diabetes mellitus, pulmonary, cardiac, or kidney diseases), and imminent delivery due to maternal–fetal disease were excluded. Two study cohorts were used—the microarray cohort for gene expression analysis [OSA (n = 5), non-OSA (n = 5)] and the real-time quantitative polymerase chain reaction (qRTPCR) cohort for confirmation study [OSA (n = 7), non-OSA (n = 13)]. To obtain the sample size pre-determined for the experimental groups, and to include 7 pregnant women classified as OSA, we required assessing for eligibility 110 pregnant women, 32 of whom were not selected (25 refused, 1 technical sleep study dropout, 1 twin pregnancy, 4 delivery before PSG, 1 change of address), and finally, we needed to perform PSG on 78 women. We selected 18 women from the remaining non-OSA group, who were homogeneous in age and body mass index (BMI) for comparative purposes. Both OSA and non-OSA women were randomly selected to perform the experiments in each of the cohorts. This study was approved by the institutional ethics committees of the hospitals and all subjects gave their written informed consent.

4.2. Clinical and Sleep Evaluation

All participants had their anthropometric, clinical, and sleep information collected, including the Epworth Sleepiness Scale (ESS). After being discharged from the hospital, clinical information for all included women and their infants was collected.
At recruitment, all women underwent a polysomnography (PSG) at the sleep unit. Standard criteria for epochs of 30 s were used. Thoracoabdominal stain gauges, oronasal thermistors, and nasal cannulas were used to measure breathing. A pulse oximeter was used to assess the oxyhemoglobin saturation (SaO2) simultaneously. Apnea was defined as the lack of airflow (<90% reduction) for at least 10 s. Hypopnea was defined as an airflow reduction (30–90%) for at least 10 s with a drop in SaO2 ≥ 3% or final arousal. The total number of apneas/hypopneas divided by the total number of hours of sleep defined the apnea–hypopnea index (AHI). The ratio of apneas/hypopneas during rapid eye movement (REM) sleep to the total number of hours spent in REM was used to determine the REM-AHI. OSA and REM-OSA were defined as an AHI, and REM-AHI of ≥5 h−1, respectively. We calculated as indicators of nocturnal SaO2, the mean SaO2 throughout the course of the night, the minimum SaO2 (lowest values recorded during sleep), the proportion of the study’s total time spent with SaO2 90% (CT90%), and the total number of drops in SaO2 ≥ 3% divided by the total number of hours of sleep (desaturation index (DI)).

4.3. Sample Acquisition and Preparation

WCB samples were collected after delivery. Total RNA was isolated with Qiagen RiboPure kit TRI reagent-based protocol (Merck, Darmstadt, Germany) from blood cells using 250 µL of WCB and finally eluted in RNAse-free water. RNA concentration and purity was assessed measuring absorbance at 260 nm and 280 nm using a Synergy H1 spectrophotometer (BioTek Instruments, Santa Clara, CA, USA).

4.4. Gene Expression Analysis

Genome-wide gene expression analysis was performed at the IdISBa Genomics Unit (Palma, Spain) using human Clariom D microarrays (Thermo Fisher Scientific, Waltham, MA, USA) on total RNA extracted from cord blood cells from 10 neonates (five from the OSA group and five from the non-OSA group). Sample preparation was accomplished in accordance with the instructions detailed in the GeneChip WT PLUS reagent kit (Thermo Fisher Scientific, Waltham, MA, USA). Briefly, 90 ng of total RNA aliquots was used from each sample to achieve, via reverse transcription, second strand cDNA synthesis and in vitro transcription of 15 µg cRNA per sample. Sense-strand dUTP-labeled cDNA probes were synthesized through reverse transcription of cRNA, followed by cRNA hydrolysis. 5.2 μg of fragmented biotin-labeled cDNA probes, prepared in 160 μL hybridization cocktail, were hybridized to human Clariom D microarrays for 16 h at 45 °C with a rotation of 60 rpm. Subsequently, microarrays were washed and stained with streptavidin–phycoerythrin using the GeneChip Fluidics Station 450 (Thermo Fisher Scientific, Waltham, MA, USA) and scanned at 0.7 μm resolution using the GeneChip Scanner 3000 7G (Thermo Fisher Scientific, Waltham, MA, USA).
Background correction, normalization, and summarization of microarrays was conducted using the oligo package (version 1.66, Bioconductor). Quality control for the data was performed using the arrayQualityMetrics package (version 3.55, Bioconductor).
Differentially expressed genes (DEG) were identified using the limma package (version 3.58, Bioconductor), considering genes with an absolute fold change cut-off of >2.0 and an adjusted false discovery rate (FDR) p-value < 0.05. The data were deposited in the GEO database under the accession number GSE264558.
Functional enrichment analysis was performed using the Bioconductor packages Clusterprofiler (version 4.11) and fgsea (version 1.28) for Gene Ontology (GO) [52], Kyoto Encyclopedia of Genes and Genomes (KEGG) [53], and WikiPathways [54] databases. For each database, over-representation analysis (ORA) and gene set analysis enrichment (GSEA) were conducted. All analyses were performed using R (version 4.3.2).

4.5. qRTPCR Validation

qRT-PCR was conducted on the samples from the two groups (7 in the OSA group and 13 in the non-OSA group) to confirm a subset of DEG identified in the microarray study. First, RNA reverse transcription was performed using the SensiFAST cDNA Synthesis kit protocol (Bioline, London, UK) to create individual cDNA libraries from 1 μg of each total RNA sample. qRT-PCR was performed using the qRT-PCR system CFX96 Touch (Bio-Rad, Hercules, CA, USA). Then, 2 μL of 1/10 diluted cDNA was mixed with 5 μL of Qiagen AMPLIFYME SG Universal Mix (Merck, Darmstadt, Germany), 0.2 μL of each forward and reverse primer and with DNAse/RNAse free water, up to a final volume of 10 μL per well. The primers used in this study are listed in Table 2.

4.6. Statistical Analysis

The anthropometric characteristics and sleep study data of the women are shown in the table. Laboratory data of subjects included in the microarray, and the qPCR cohorts are presented as median + interquartile range (IQR) or percentage (Table 1). Differences between groups were analyzed using Student’s t-test or Mann–Whitney U test for continuous variables, and Fisher’s exact test (two-tailed) or chi-squared test were used for categorical variables. Gene data analysis was performed using RStudio [55]. The relative expression of messenger RNA (mRNA) was determined by the 2−∆∆Ct method normalized to 18S rRNA expression. Chi-test was applied to verify the statistical significance of mRNA expression levels between patients and controls. Error bars in graphs represent the standard error of the mean (SEM). Median with interquartile range is represented in the scatter plots.

5. Conclusions

In conclusion, WCB cells showed distinct gene expression profiles depending on the presence of maternal OSA and OSA during REM during pregnancy. This could potentially have an adverse influence on several biological and molecular processes throughout fetal development, which could finally contribute to long-term adverse health outcomes in the offspring. However, these promising findings need to be further validated in larger studies to establish a solid molecular foundation for the understanding of the adverse effects of maternal OSA on fetal health, which could finally lead to the development of therapeutic interventions for better pregnancy outcomes in this population.

Author Contributions

Conceptualization, L.C.-G., M.P.G., A.Á.R.D.L., A.S.B., M.C.M., M.D.-L.-P., D.M.-G., J.P.Z., C.P.Z., S.G.F. and A.A.; methodology, L.C.-G., A.F., J.M.-F. and A.A.; software, J.M.-F.; validation, L.C.-G. and A.F.; investigation, L.C.-G.; writing—original draft preparation, L.C.-G.; writing—review and editing, A.F. and A.A.; project administration, A.A.; funding acquisition, A.A. All authors have read and agreed to the published version of the manuscript.

Funding

This research was partially supported by grants from SEPAR-2020-820, Ministerio de Economia y Competitividad (PI11/00495), Ministerio de Ciencia, Innovación y Universidades (PI19/00875).

Institutional Review Board Statement

This study was conducted in accordance with the Declaration of Helsinki, and approved by the Institutional Ethic Committee of the Balearic Islands (IB1510/10PI, 13 December 2013).

Informed Consent Statement

Written informed consent was obtained from all subjects involved in this study.

Data Availability Statement

Acknowledgments

We sincerely thank all the patients who participated in this study, whose collaboration was invaluable in advancing our research. We also extend our gratitude to all the researchers who provided technical and scientific support throughout this project. Additionally, we express our appreciation to the IdISBa Biobank for their dedicated efforts in the preservation and management of the samples used in this study.

Conflicts of Interest

The authors declare no conflicts of interest.

References

  1. Peppard, P.E.; Young, T.; Barnet, J.H.; Palta, M.; Hagen, E.W.; Hla, K.M. Increased Prevalence of Sleep-Disordered Breathing in Adults. Am. J. Epidemiol. 2013, 177, 1006–1014. [Google Scholar] [CrossRef]
  2. Pamidi, S.; Kimoff, R.J. Maternal Sleep-Disordered Breathing. Chest 2018, 153, 1052–1066. [Google Scholar] [CrossRef] [PubMed]
  3. Izci, B.; Riha, R.L.; Martin, S.E.; Vennelle, M.; Liston, W.A.; Dundas, K.C.; Calder, A.A.; Douglas, N.J. The Upper Airway in Pregnancy and Pre-Eclampsia. Am. J. Respir. Crit. Care Med. 2003, 167, 137–140. [Google Scholar] [CrossRef] [PubMed]
  4. Alonso-Fernández, A.; Ribot Quetglas, C.; Herranz Mochales, A.; Álvarez Ruiz De Larrinaga, A.; Sánchez Barón, A.; Rodríguez Rodríguez, P.; Gil Gómez, A.V.; Pía Martínez, C.; Cubero Marín, J.P.; Barceló Nicolau, M.; et al. Influence of Obstructive Sleep Apnea on Systemic Inflammation in Pregnancy. Front. Med. 2021, 8, 674997. [Google Scholar] [CrossRef] [PubMed]
  5. Tayade, S.; Toshniwal, S. Obstructive Sleep Apnea in Pregnancy: A Narrative Review. Cureus 2022, 14, e30387. [Google Scholar] [CrossRef] [PubMed]
  6. Facco, F.L.; Parker, C.B.; Reddy, U.M.; Silver, R.M.; Koch, M.A.; Louis, J.M.; Basner, R.C.; Chung, J.H.; Nhan-Chang, C.-L.; Pien, G.W.; et al. Association Between Sleep-Disordered Breathing and Hypertensive Disorders of Pregnancy and Gestational Diabetes Mellitus. Obstet. Gynecol. 2017, 129, 31–41. [Google Scholar] [CrossRef] [PubMed]
  7. Truong, K.K.; Guilleminault, C. Sleep Disordered Breathing in Pregnant Women: Maternal and Fetal Risk, Treatment Considerations, and Future Perspectives. Expert Rev. Respir. Med. 2018, 12, 177–189. [Google Scholar] [CrossRef]
  8. Fung, A.M.; Wilson, D.L.; Lappas, M.; Howard, M.; Barnes, M.; O’Donoghue, F.; Tong, S.; Esdale, H.; Fleming, G.; Walker, S.P. Effects of Maternal Obstructive Sleep Apnoea on Fetal Growth: A Prospective Cohort Study. PLoS ONE 2013, 8, e68057. [Google Scholar] [CrossRef]
  9. Pamidi, S.; Marc, I.; Simoneau, G.; Lavigne, L.; Olha, A.; Benedetti, A.; Sériès, F.; Fraser, W.; Audibert, F.; Bujold, E.; et al. Maternal Sleep-Disordered Breathing and the Risk of Delivering Small for Gestational Age Infants: A Prospective Cohort Study. Thorax 2016, 71, 719–725. [Google Scholar] [CrossRef]
  10. Kneitel, A.W.; Treadwell, M.C.; O’Brien, L.M. Effects of Maternal Obstructive Sleep Apnea on Fetal Growth: A Case-Control Study. J. Perinatol. 2018, 38, 982–988. [Google Scholar] [CrossRef]
  11. Bourjeily, G.; Danilack, V.A.; Bublitz, M.H.; Lipkind, H.; Muri, J.; Caldwell, D.; Tong, I.; Rosene-Montella, K. Obstructive Sleep Apnea in Pregnancy Is Associated with Adverse Maternal Outcomes: A National Cohort. Sleep Med. 2017, 38, 50–57. [Google Scholar] [CrossRef] [PubMed]
  12. Lu, Q.; Zhang, X.; Wang, Y.; Li, J.; Xu, Y.; Song, X.; Su, S.; Zhu, X.; Vitiello, M.V.; Shi, J.; et al. Sleep Disturbances during Pregnancy and Adverse Maternal and Fetal Outcomes: A Systematic Review and Meta-Analysis. Sleep Med. Rev. 2021, 58, 101436. [Google Scholar] [CrossRef] [PubMed]
  13. Marshall, N.E.; Abrams, B.; Barbour, L.A.; Catalano, P.; Christian, P.; Friedman, J.E.; Hay, W.W.; Hernandez, T.L.; Krebs, N.F.; Oken, E.; et al. The Importance of Nutrition in Pregnancy and Lactation: Lifelong Consequences. Am. J. Obstet. Gynecol. 2022, 226, 607–632. [Google Scholar] [CrossRef]
  14. Ghesquière, L.; Deruelle, P.; Ramdane, Y.; Garabedian, C.; Charley-Monaca, C.; Dalmas, A.F. Obstructive Sleep Apnea in Obese Pregnant Women: A Prospective Study. PLoS ONE 2020, 15, e0238733. [Google Scholar] [CrossRef]
  15. Wilson, D.L.; Howard, M.E.; Fung, A.M.; O’Donoghue, F.J.; Barnes, M.; Lappas, M.; Walker, S.P. Sleep-Disordered Breathing Does Not Impact Maternal Outcomes in Women with Hypertensive Disorders of Pregnancy. PLoS ONE 2020, 15, e0232287. [Google Scholar] [CrossRef]
  16. Chami, H.A.; Gottlieb, D.J.; Redline, S.; Punjabi, N.M. Association between Glucose Metabolism and Sleep-Disordered Breathing during REM Sleep. Am. J. Respir. Crit. Care Med. 2015, 192, 1118–1126. [Google Scholar] [CrossRef]
  17. BaHammam, A.S.; Pirzada, A.R.; Pandi-Perumal, S.R. Neurocognitive, Mood Changes, and Sleepiness in Patients with REM-Predominant Obstructive Sleep Apnea. Sleep Breath. 2023, 27, 57–66. [Google Scholar] [CrossRef]
  18. Mokhlesi, B.; Finn, L.A.; Hagen, E.W.; Young, T.; Hla, K.M.; Van Cauter, E.; Peppard, P.E. Obstructive Sleep Apnea during REM Sleep and Hypertension. Results of the Wisconsin Sleep Cohort. Am. J. Respir. Crit. Care Med. 2014, 190, 1158–1167. [Google Scholar] [CrossRef] [PubMed]
  19. Newbold, R.; Benedetti, A.; Kimoff, R.J.; Meltzer, S.; Garfield, N.; Dasgupta, K.; Gagnon, R.; Lavigne, L.; Olha, A.; Rey, E.; et al. Maternal Sleep-Disordered Breathing in Pregnancy and Increased Nocturnal Glucose Levels in Women with Gestational Diabetes Mellitus. Chest 2021, 159, 356–365. [Google Scholar] [CrossRef]
  20. Balserak, B.I.; Pien, G.W.; Prasad, B.; Mastrogiannis, D.; Park, C.; Quinn, L.T.; Herdegen, J.; Carley, D.W. Obstructive Sleep Apnea Is Associated with Newly Diagnosed Gestational Diabetes Mellitus. Ann. Am. Thorac. Soc. 2020, 17, 754–761. [Google Scholar] [CrossRef]
  21. Hofman, P.L.; Cutfield, W.S.; Robinson, E.M.; Bergman, R.N.; Menon, R.K.; Sperling, M.A.; Gluckman, P.D. Insulin Resistance in Short Children with Intrauterine Growth Retardation. J. Clin. Endocrinol. Metab. 1997, 82, 402–406. [Google Scholar] [CrossRef] [PubMed]
  22. Leon, D.A.; Lithell, H.O.; Vågerö, D.; Koupilová, I.; Mohsen, R.; Berglund, L.; Lithell, U.-B.; McKeigue, P.M. Reduced Fetal Growth Rate and Increased Risk of Death from Ischaemic Heart Disease: Cohort Study of 15,000 Swedish Men and Women Born 1915-29. BMJ 1998, 317, 241–245. [Google Scholar] [CrossRef] [PubMed]
  23. Hincker, A.; Nadler, J.; Karan, S.; Carter, E.; Porat, S.; Warner, B.; Ju, Y.-E.S.; Ben Abdallah, A.; Wilson, E.; Lockhart, E.M.; et al. Sleep Apnea and Fetal Growth Restriction (SAFER) Study: Protocol for a Pragmatic Randomised Clinical Trial of Positive Airway Pressure as an Antenatal Therapy for Fetal Growth Restriction in Maternal Obstructive Sleep Apnoea. BMJ Open 2021, 11, e049120. [Google Scholar] [CrossRef] [PubMed]
  24. Kapral, N.; Miller, S.E.; Scharf, R.J.; Gurka, M.J.; DeBoer, M.D. Associations between Birthweight and Overweight and Obesity in School-Age Children. Pediatr. Obes. 2018, 13, 333–341. [Google Scholar] [CrossRef] [PubMed]
  25. Wang, L.; Cai, R.; Lv, G.; Huang, Z.; Wang, Z. Hypoxia during Pregnancy in Rats Leads to the Changes of the Cerebral White Matter in Adult Offspring. Biochem. Biophys. Res. Commun. 2010, 396, 445–450. [Google Scholar] [CrossRef] [PubMed]
  26. Brener, A.; Lebenthal, Y.; Levy, S.; Dunietz, G.L.; Sever, O.; Tauman, R. Mild Maternal Sleep-Disordered Breathing during Pregnancy and Offspring Growth and Adiposity in the First 3 Years of Life. Sci. Rep. 2020, 10, 13979. [Google Scholar] [CrossRef] [PubMed]
  27. Tauman, R.; Zuk, L.; Uliel-Sibony, S.; Ascher-Landsberg, J.; Katsav, S.; Farber, M.; Sivan, Y.; Bassan, H. The Effect of Maternal Sleep-Disordered Breathing on the Infant’s Neurodevelopment. Am. J. Obstet. Gynecol. 2015, 212, 656.e1–656.e7. [Google Scholar] [CrossRef] [PubMed]
  28. Morrakotkhiew, W.; Chirdkiatgumchai, V.; Tantrakul, V.; Thampratankul, L. Early Developmental Outcome in Children Born to Mothers with Obstructive Sleep Apnea. Sleep Med. 2021, 88, 90–95. [Google Scholar] [CrossRef] [PubMed]
  29. Christensson, E.; Mkrtchian, S.; Ebberyd, A.; Österlund Modalen, Å.; Franklin, K.A.; Eriksson, L.I.; Jonsson Fagerlund, M. Whole Blood Gene Expression Signature in Patients with Obstructive Sleep Apnea and Effect of Continuous Positive Airway Pressure Treatment. Respir. Physiol. Neurobiol. 2021, 294, 103746. [Google Scholar] [CrossRef]
  30. Moreira, S.; Rodrigues, R.; Barros, A.B.; Pejanovic, N.; Neves-Costa, A.; Pedroso, D.; Pereira, C.; Fernandes, D.; Rodrigues, J.V.; Barbara, C.; et al. Changes in Expression of the CLOCK Gene in Obstructive Sleep Apnea Syndrome Patients Are Not Reverted by Continuous Positive Airway Pressure Treatment. Front. Med. 2017, 4, 285306. [Google Scholar] [CrossRef]
  31. Xie, T.; Guo, D.; Luo, J.; Guo, Z.; Zhang, S.; Wang, A.; Wang, X.; Wang, X.; Cao, W.; Su, L.; et al. The Relationship Between HIF1α and Clock Gene Expression in Patients with Obstructive Sleep Apnea. Nat. Sci. Sleep 2022, 14, 381–392. [Google Scholar] [CrossRef] [PubMed]
  32. Zhang, M.; Lu, Y.; Sheng, L.; Han, X.; Yu, L.; Zhang, W.; Liu, S.; Liu, Y. Advances in Molecular Pathology of Obstructive Sleep Apnea. Molecules 2022, 27, 8422. [Google Scholar] [CrossRef] [PubMed]
  33. Kidron, D.; Bar-Lev, Y.; Tsarfaty, I.; Many, A.; Tauman, R. The Effect of Maternal Obstructive Sleep Apnea on the Placenta. Sleep 2019, 42, zsz072. [Google Scholar] [CrossRef] [PubMed]
  34. Johns, E.C.; Halligan, D.L.; Tammsalu, T.; Hill, E.A.; Riha, R.L.; Denison, F.C.; Reynolds, R.M. Gene Expression Profiling of Placentae from Women with Obesity and Obstructive Sleep Apnoea. Placenta 2022, 121, 53–60. [Google Scholar] [CrossRef] [PubMed]
  35. de Knegt, V.E.; Hedley, P.L.; Kanters, J.K.; Thagaard, I.N.; Krebs, L.; Christiansen, M.; Lausten-Thomsen, U. The Role of Leptin in Fetal Growth during Pre-Eclampsia. Int. J. Mol. Sci. 2021, 22, 4569. [Google Scholar] [CrossRef] [PubMed]
  36. Valverde-Pérez, E.; Prieto-Lloret, J.; Gonzalez-Obeso, E.; Cabero, M.I.; Nieto, M.L.; Pablos, M.I.; Obeso, A.; Gomez-Niño, A.; Cárdaba-García, R.M.; Rocher, A.; et al. Effects of Gestational Intermittent Hypoxia on Placental Morphology and Fetal Development in a Murine Model of Sleep Apnea. Adv. Exp. Med. Biol. 2023, 1427, 73–81. [Google Scholar] [CrossRef]
  37. Chen, L.; Zadi, Z.H.; Zhang, J.; Scharf, S.M.; Pae, E.K. Intermittent Hypoxia in Utero Damages Postnatal Growth and Cardiovascular Function in Rats. J. Appl. Physiol. 2018, 124, 821–830. [Google Scholar] [CrossRef] [PubMed]
  38. Weng, C.; Huang, L.; Feng, H.; He, Q.; Lin, X.; Jiang, T.; Lin, J.; Wang, X.; Liu, Q. Gestational Chronic Intermittent Hypoxia Induces Hypertension, Proteinuria, and Fetal Growth Restriction in Mice. Sleep Breath. 2022, 26, 1661–1669. [Google Scholar] [CrossRef]
  39. Sukarieh, R.; Joseph, R.; Leow, S.C.; Li, Y.; Löffler, M.; Aris, I.M.; Tan, J.H.; Teh, A.L.; Chen, L.; Holbrook, J.D.; et al. Molecular Pathways Reflecting Poor Intrauterine Growth Are Found in Wharton’s Jelly-Derived Mesenchymal Stem Cells. Hum. Reprod. 2014, 29, 2287–2301. [Google Scholar] [CrossRef]
  40. Locke, B.W.; Lee, J.J.; Sundar, K.M. OSA and Chronic Respiratory Disease: Mechanisms and Epidemiology. Int. J. Environ. Res. Public Health 2022, 19, 5473. [Google Scholar] [CrossRef]
  41. Meyer, E.J.; Wittert, G.A. Approach the Patient With Obstructive Sleep Apnea and Obesity. J. Clin. Endocrinol. Metab. 2024, 109, e1267–e1279. [Google Scholar] [CrossRef]
  42. Shobatake, R.; Ota, H.; Takahashi, N.; Ueno, S.; Sugie, K.; Takasawa, S. The Impact of Intermittent Hypoxia on Metabolism and Cognition. Int. J. Mol. Sci. 2022, 23, 12957. [Google Scholar] [CrossRef]
  43. Kapsimalis, F.; Kryger, M. Sleep Breathing Disorders in the U.S. Female Population. J. Women’s Health 2009, 18, 1211–1219. [Google Scholar] [CrossRef]
  44. Bonsignore, M.R.; Mazzuca, E.; Baiamonte, P.; Bouckaert, B.; Verbeke, W.; Pevernagie, D.A. REM Sleep Obstructive Sleep Apnoea. Eur. Respir. Rev. 2024, 33, 230166. [Google Scholar] [CrossRef]
  45. Mabry, S.; Wilson, E.N.; Bradshaw, J.L.; Gardner, J.J.; Fadeyibi, O.; Vera, E.; Osikoya, O.; Cushen, S.C.; Karamichos, D.; Goulopoulou, S.; et al. Sex and Age Differences in Social and Cognitive Function in Offspring Exposed to Late Gestational Hypoxia. Biol. Sex Differ. 2023, 14, 81. [Google Scholar] [CrossRef] [PubMed]
  46. Liu, X.; Chen, B.; Huang, Z.; Duan, R.; Li, H.; Xie, L.; Wang, R.; Li, Z.; Gao, Y.; Zheng, Y.; et al. Effects of Poor Sleep on the Immune Cell Landscape as Assessed by Single-Cell Analysis. Commun. Biol. 2021, 4, 1325. [Google Scholar] [CrossRef]
  47. Gluckman, P.D.; Hanson, M.A.; Cooper, C.; Thornburg, K.L. Effect of in Utero and Early-Life Conditions on Adult Health and Disease. N. Engl. J. Med. 2008, 359, 61–73. [Google Scholar] [CrossRef] [PubMed]
  48. Liew, S.C.; Aung, T. Sleep Deprivation and Its Association with Diseases—A Review. Sleep Med. 2021, 77, 192–204. [Google Scholar] [CrossRef] [PubMed]
  49. Alhendi, A.S.N.; Lim, D.; McKee, S.; McEntagart, M.; Tatton-Brown, K.; Temple, I.K.; Davies, J.H.; MacKay, D.J.G. Whole-Genome Analysis as a Diagnostic Tool for Patients Referred for Diagnosis of Silver-Russell Syndrome: A Real-World Study. J. Med. Genet. 2022, 59, 613–622. [Google Scholar] [CrossRef]
  50. Pagel, J.-I.; Deindl, E. Disease Progression Mediated by Egr-1 Associated Signaling in Response to Oxidative Stress. Int. J. Mol. Sci. 2012, 13, 13104–13117. [Google Scholar] [CrossRef]
  51. Louis, J.; Auckley, D.; Miladinovic, B.; Shepherd, A.; Mencin, P.; Kumar, D.; Mercer, B.; Redline, S. Perinatal Outcomes Associated with Obstructive Sleep Apnea in Obese Pregnant Women. Obstet. Gynecol. 2012, 120, 1085–1092. [Google Scholar] [CrossRef] [PubMed]
  52. The Gene Ontology Consortium; Aleksander, S.A.; Balhoff, J.; Carbon, S.; Cherry, J.M.; Drabkin, H.J.; Ebert, D.; Feuermann, M.; Gaudet, P.; Harris, N.L.; et al. The Gene Ontology Knowledgebase in 2023. Genetics 2023, 224, iyad031. [Google Scholar] [CrossRef] [PubMed]
  53. Jin, Z.; Sato, Y.; Kawashima, M.; Kanehisa, M. KEGG Tools for Classification and Analysis of Viral Proteins. Protein Sci. 2023, 32, e4820. [Google Scholar] [CrossRef] [PubMed]
  54. Agrawal, A.; Balcı, H.; Hanspers, K.; Coort, S.L.; Martens, M.; Slenter, D.N.; Ehrhart, F.; Digles, D.; Waagmeester, A.; Wassink, I.; et al. WikiPathways 2024: Next Generation Pathway Database. Nucleic Acids Res. 2024, 52, D679–D689. [Google Scholar] [CrossRef]
  55. Agapito, G.; Arbitrio, M. Microarray Data Analysis Protocol. Methods Mol. Biol. 2022, 2401, 263–271. [Google Scholar] [CrossRef]
Figure 1. Flowchart of the study. Pregnant women in the third trimester were recruited, and after a PSG, they were divided for the study on the basis of non-OSA and OSA and further divided into the microarray cohort and the qPCR cohort. Five non-OSA and five OSA patients were used to perform a general screening using microarrays. A total of 13 out of 3258 differentially expressed mRNAs were validated in an independent cohort by qRT-PCR.
Ijms 25 05537 g001
Figure 2. WCB differential gene expression in OSA compared to non-OSA. (a) Volcano plot showing significance (−log10 transformed p values) and magnitude (log2(fold change)) of differential gene expression in WCB from OSA compared to non OSA with p-value ≤ 0.05 and fold change ≥ 2.0 filters. Red dots showing significant DE genes significantly for both filters. (b) Heat map illustrating magnitude of differential gene expression in WCB from OSA compared to non-OSA. Green and red color represents the top 50 of under- and overexpressed genes, respectively.
Ijms 25 05537 g002
Figure 3. Potential biological pathways altered in WCB cells from OSA-affected mothers identified by microarray analysis. (a) Enrichment analysis of gene sets in the GO (Gene Ontology) database (GO-GSEA). For functional enrichment, “keywords” (pathologies and signaling pathways) associated with OSA were introduced. Significant positive NES (normalized enrichment scores) value indicates that members of a given gene set tend to appear at the top of the ranked transcriptome data. (b) The analysis after filtering by keywords showed 23 entries represented by the small squares, which were grouped into five main clusters: placenta development, response to insulin, response to oxidative stress, positive regulation of programmed cell death, and leukocyte adhesion to vascular endothelial cell.
Ijms 25 05537 g003
Figure 4. KEGG (KEGG-GSEA) pathway enrichment analysis reveals dysregulated pathways in WCB cells with OSA compared to control samples. KEGG pathway analysis led to the identification of 260 significant biological processes, among which, six of them were related to apoptosis, insulin resistance and signaling pathway, leukocyte endothelial migration, and type 1 diabetes mellitus.
Ijms 25 05537 g004
Figure 5. Potential signaling pathways triggered in WCB cells by maternal OSA. Pathway analysis indicated that five pathways corresponded to upregulated transcripts. The most enriched network was “response to oxidative stress”, comprising four target genes. The intensity of the blue color corresponds to the fold change; the higher the intensity, the higher the value. The size of the circle depends on the number of genes associated with each network.
Ijms 25 05537 g005
Figure 6. Gene expression patterns obtained by qRT-PCR in WCB with OSA versus non-OSA. Genes are represented on the Y-axis, while the X-axis denotes the frequency of their expression. Horizontal bars are colored in green for OSA samples and brown for non-OSA samples. Genes with significant differential gene expression pattern are highlighted in red. The different shades of green or brown indicate whether genes are up- or downregulated in WCB cells affected or not affected by maternal OSA.
Ijms 25 05537 g006
Figure 7. Gene expression patterns obtained by qRT-PCR in WCB with REM OSA versus non-REM OSA. Genes are represented on the Y-axis, while the X-axis denotes the frequency of their expression. Horizontal bars are colored in green for REM OSA samples and brown for non-REM OSA. Genes with significant differential gene expression pattern are highlighted in red. The different shades of green or brown indicate whether genes are up- or downregulated in REM OSA compared to non-REM OSA samples.
Ijms 25 05537 g007
Table 1. Anthropometric characteristics sleep and laboratory data of subjects included in the microarray and the qRT-PCR cohorts.
Microarray CohortqRT-PCR Cohort
OSA (n = 5)Non-OSA (n = 5)pOSA (n = 7)Non OSA (n = 13)p
Age (years)36 (36–40)36 (33–37)0.4236 (34–38)34 (33–37)0.64
BMI before pregnancy (kg/m2)22.3 (21–24)21.9 (20.1–21.9)0.7322.3 (20.8–24.8)21.7 (20.8–22.7)0.64
Neck circumference (cm)34 (32–34.5)32 (34–37)0.5334 (31.8–34.8)33.5 (32–34)0.94
Waist (cm)95.5 (95–106)107 (96–112)0.3599.5 (95.3–106.3)104 (96–108)0.49
Hip circumference (cm)102 (99.25–104)107.5 (99–116)0.56102 (99.3–104)106.5 (97–115)0.86
Gestational age at PSG (weeks)36 (32.5–38)31 (30–33)0.1134 (31–37)34 (31–35)0.77
First pregnancy (n)310.52450.64
Gestational smokers (n)101100.35
Epworth Sleepiness Scale7 (6–9)4 (3–5)0.17 (5–8)6 (4–10)1
AHI (h−1)6.4 (5.3–7.6)0.1 (0.0–0.2)0.016.4 (5.5–8.6)0.4 (0.1–0.7)0.00
Desaturation index (h−1)0.3 (0–1.1)0 (0–0.1)0.050.6 (0.3–1.7)0 (0–0.4)0.01
REM-AHI (h−1)10 (4.8–10.3)0 (0–1)0.0510 (3.3–16.5)0 (0–1)0.00
Birthweight (g)3180 (3015–3270)3210 (3200–3225)0.843180 (2967–3265)3232 (3080–3430)0.40
Cesarean section (n)111111
Neonatal gestational age (weeks)39 (38–40)39 (38–40)139 (39–40)40 (38–40)0.39
Descriptive analysis and comparison between groups. Continuous variables are presented as median + interquartile range (IQR) or percentage. Abbreviations: PSG, polysomnography; AHI, apnea-hypopnea index; BMI, body mass index; qRTPCR, real-time quantitative polymerase chain reaction; cm, centimeter; g; grams; h, hours; h−1, per hour.
Table 2. Primers (KiCqStart®, Sigma-Merck, Darmstadt, Germany) used to confirm differentially expressed genes by qRTPCR.
Selection of PrimersReference Sequence IDExon BoundaryForwardReverse
18S rRNANR_145820.1 5′-TAAGCAACGAGACTCTGGCAT5′-CGGACATCTAAGGGCATCACAG
AKT2NM_0012430272–35′-ACTTCCTGCTGAAGAGCGAC5′-CCTCCCTCTCGTCTGGAGAA
CATNM_00175212–135′-CTCTTCTGGACAAGTACAATG5′-AGGAGAATCTTCATCCAGTG
EGR1NM_0019641–25′-GCAGAGTCTTTTCCTGAC5′-TTGGTCATGCTCACTAGG
IGF2NM_0006123–45′-GGACAACTTCCCCAGATAC5′-GTGGGTAGAGCAATCAGG
JUNBNM_002229NA5′-TACTGTGGAAAAGAAACACG5′-GAACAAACACACACAAACAC
MAPKAP1NM_0010066176–75′-TAAATGCTGCTCATGGATTC5′-AACTTTCTGGGATCCTTTTC
MCL1NM_0011973203–45′-TAGTTAAACAAAGAGGCTGG5′-ATAAACTGGTTTTGGTGGTG
MYCNM_0024672–35′-TGAGGAGGAACAAGAAGATG5′-ATCCAGACTCTGACCTTTTG
PFN1NM_0050222–35′-TTCTTGTTGATCAAACCACC5′-GGGAATTTAGCATGGATCTTC
PPP1CBNM_002709NA5′-GACCATAGCAAATCACAGAG5′-GCAATCTATGGAGCAGATTC
PRKAR1ANM_0027346–75′-GAAGGGGATAACTTCTATGT5′-ATTCTTCTATAGCTGTCTCGG
STX4NM_0046049–105′-GATTGAGAAGAACATCCTGAG5′-CATTATCCAACCACTGTGAC
UBA52NM_0010339304–55′-CCTTATTTGACCTTCTTCTTGG5′-CTTGCCCAGAAATACAACTG
Disclaimer/Publisher’s Note: The statements, opinions and data contained in all publications are solely those of the individual author(s) and contributor(s) and not of MDPI and/or the editor(s). MDPI and/or the editor(s) disclaim responsibility for any injury to people or property resulting from any ideas, methods, instructions or products referred to in the content.

