
Prediction of Aggregate Packing with Tubular Macrocapsules in the Inert Structure of Self-Healing Concrete Based on Dewar’s Particle Packing Model

 ,
,  , , , ,
Abstract
:1. Introduction
2. Particle Packing Model of Dewar
3. Materials and Methods
3.1. Tubular Macrocapsules
3.2. Aggregates
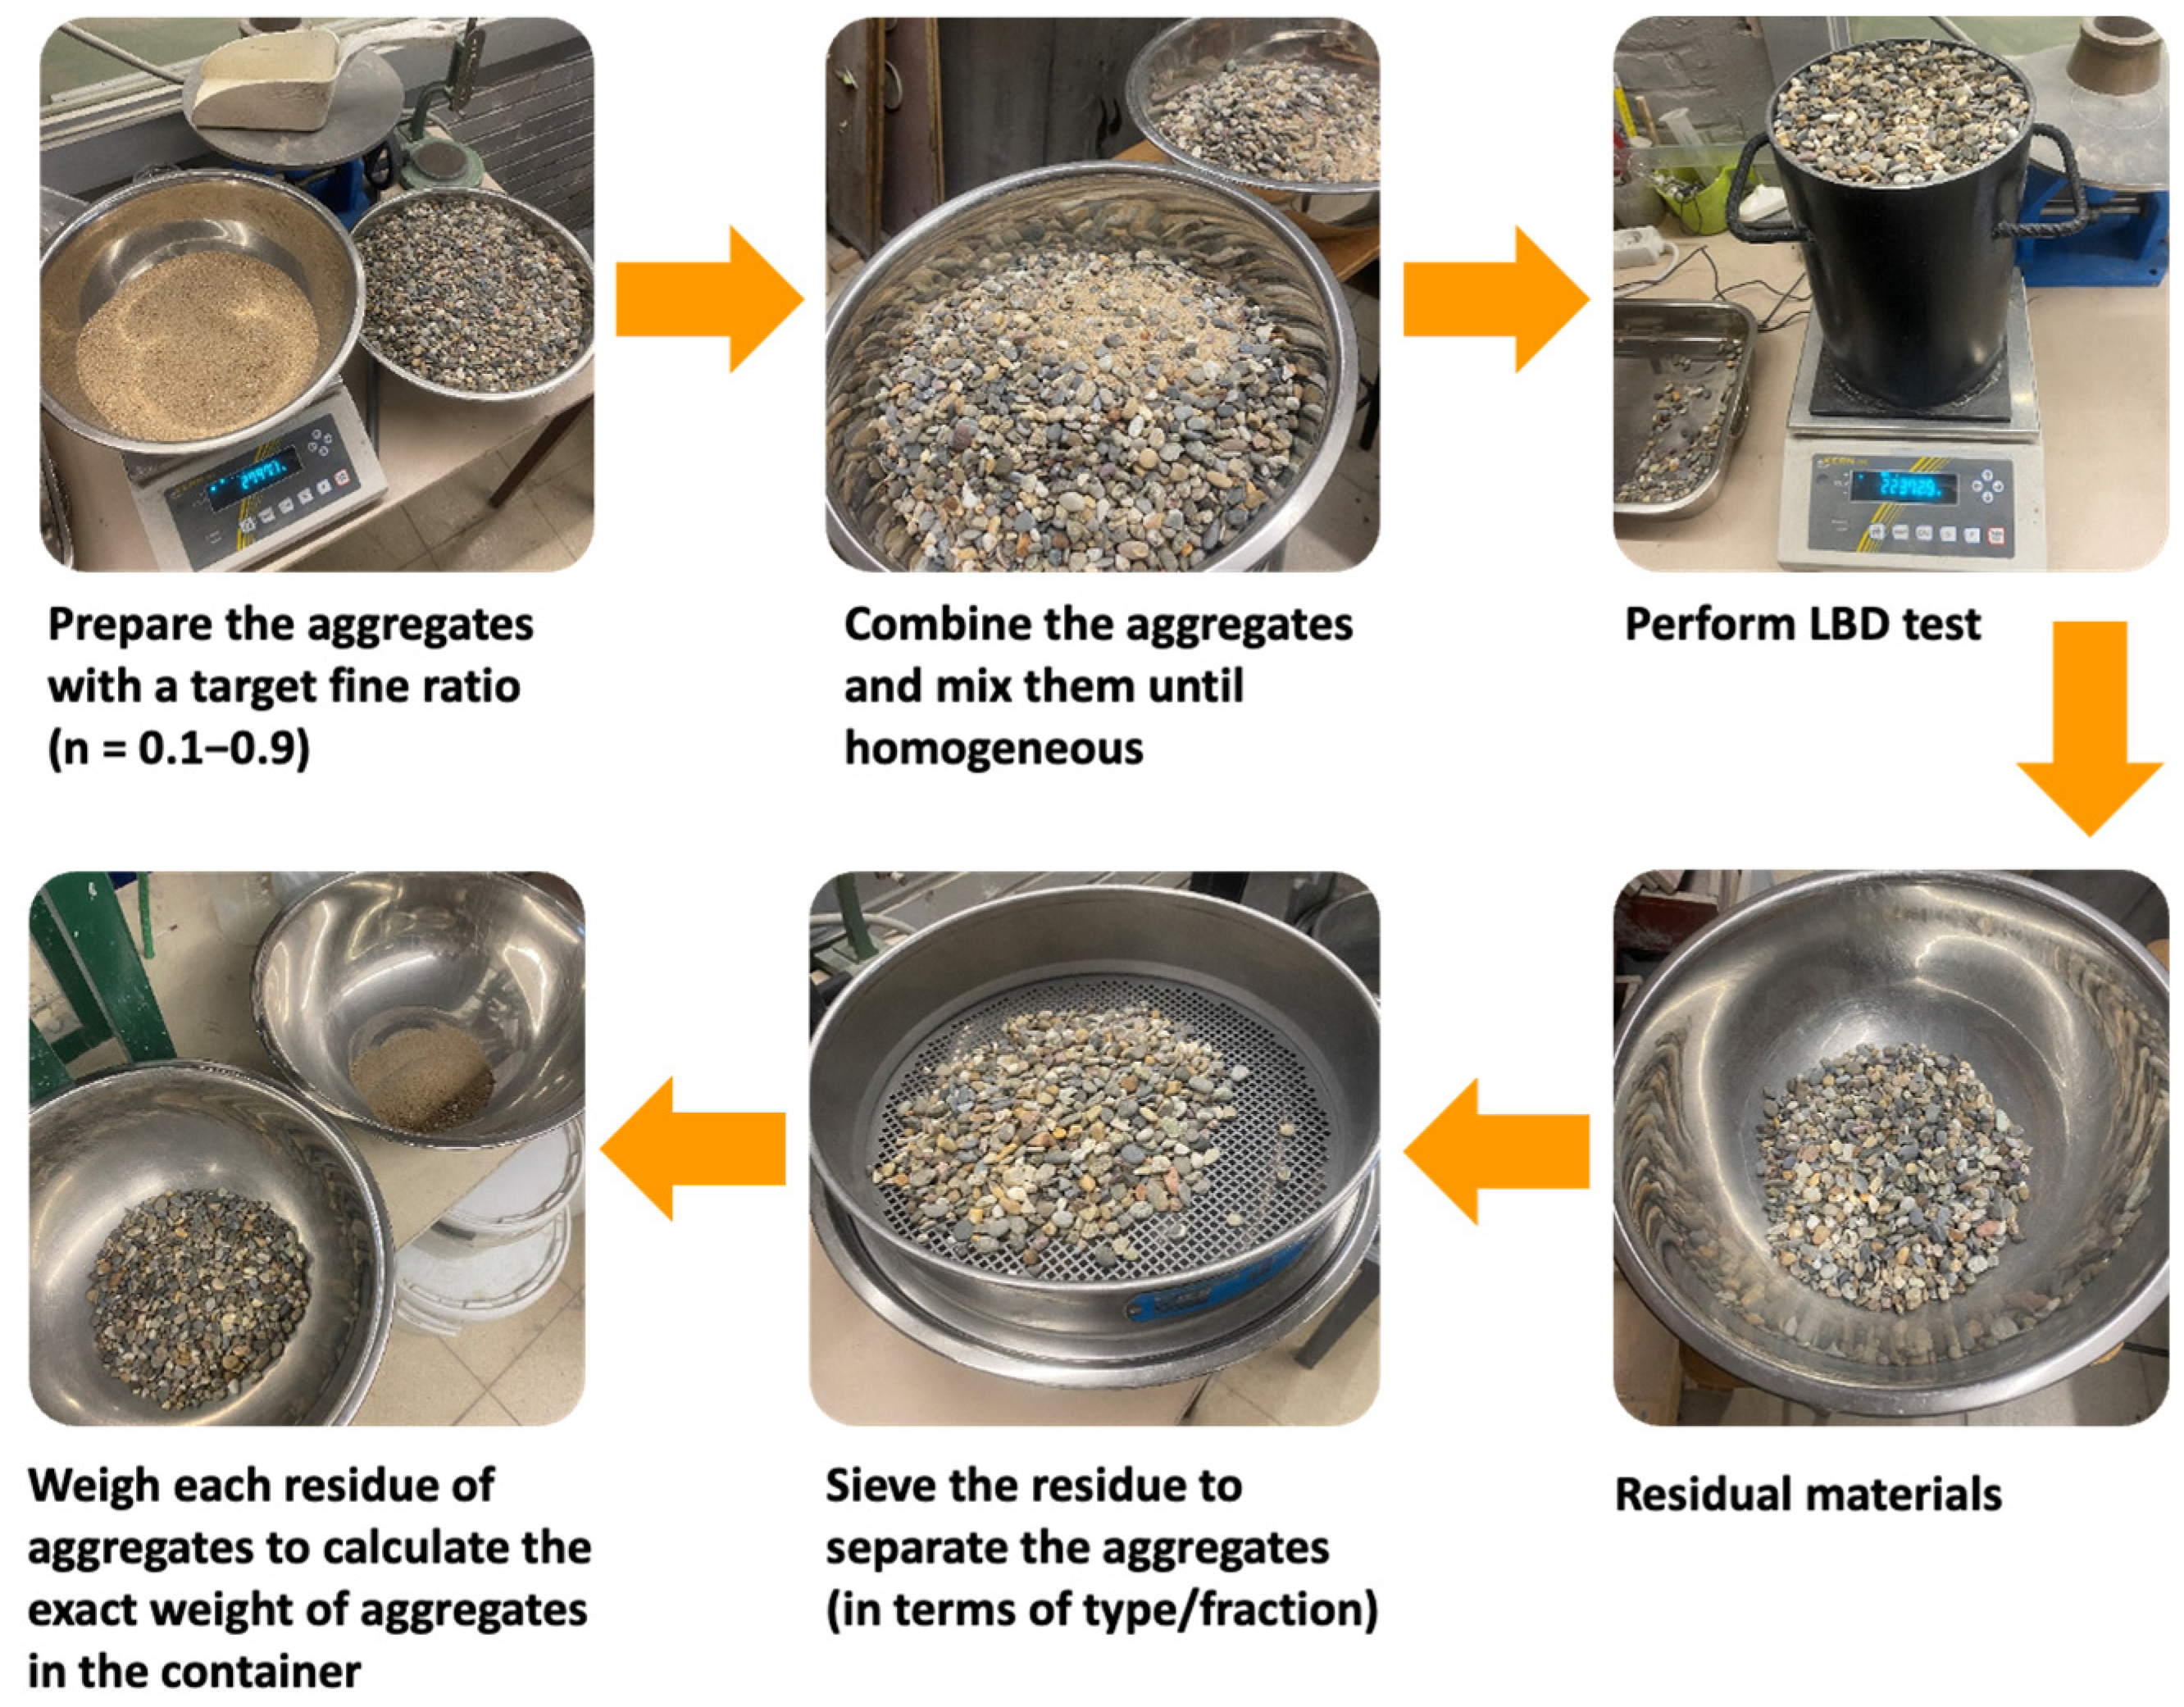
3.3. Testing Method
- Binary aggregate mixture (BAM): gravel 4/8 + gravel 8/16;
- Ternary aggregate mixture (TAM): sea sand 0/2.5 + (gravel 4/8 + gravel 8/16 with n = 0.65).
4. Results and Discussion
4.1. Voids Ratio of Aggregates
4.2. Interaction Diagram of Binary Aggregate Mixture (BAM)
4.3. Interaction Diagram of Ternary Aggregate Mixture (TAM)
4.4. Validation of the Regression Model for the Factor k vs. (Dagg/Dcaps)2(Lcaps/Dagg)
4.5. Validation of the ‘U Model’ for Capsules
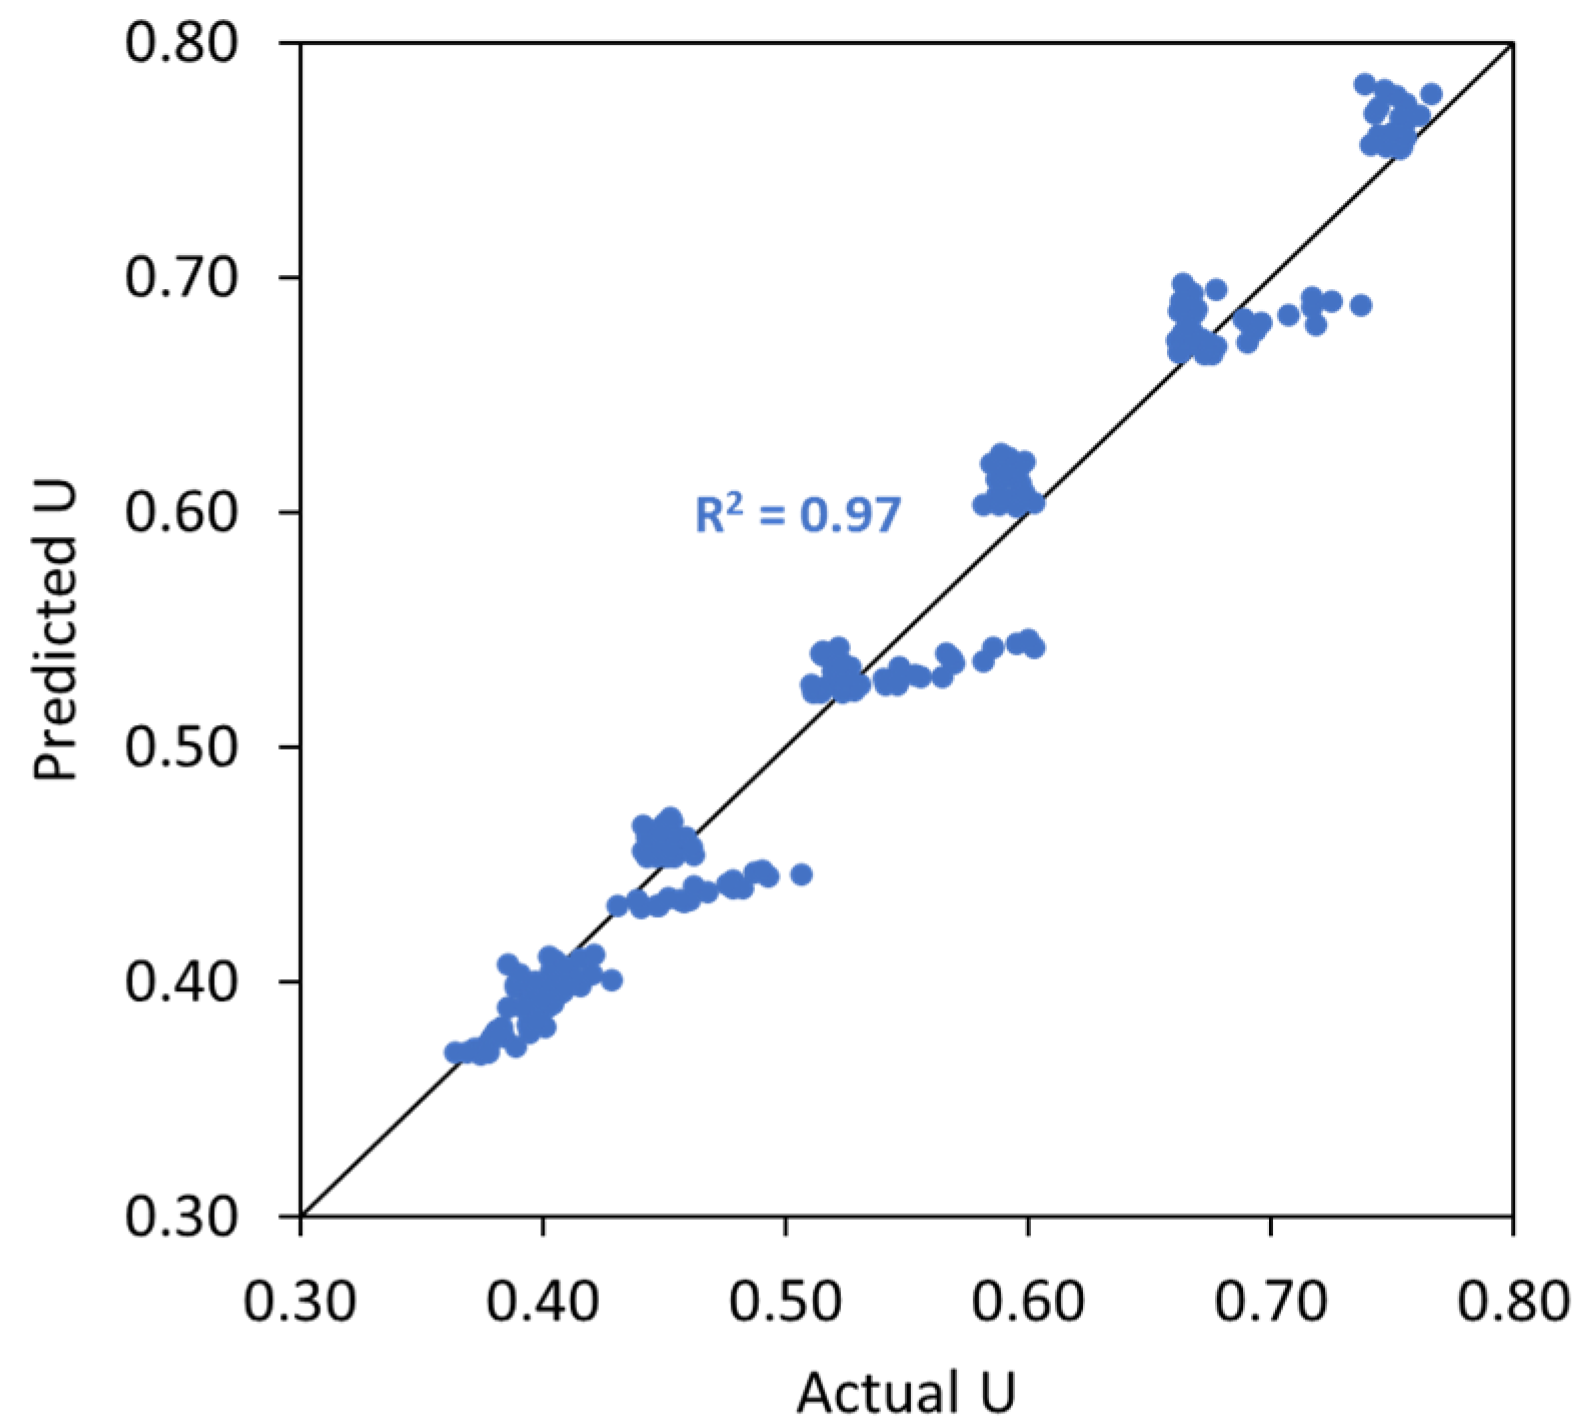
- The first scenario (Figure 24a) aims to validate the ‘U model’ based on the experimental approach. In this case, the actual (or measured) U values from the experimental results with capsules are compared with the predicted U values by computing the U values of aggregate mixtures without capsules (experiment-based) using the U values of aggregate mixtures with capsules via Equation (12). Finally, the statistical goodness-of-fit (R2) between the actual U and the predicted U is evaluated to justify the robustness of the ‘U model’.
- The second scenario (Figure 24b) aims to validate the ‘U model’ based on Dewar’s particle packing model. In Dewar’s model (step 1, black), the voids ratio diagram is constructed by calculating the points A–F based on U0 and U1 of single aggregates without capsules. Next, when the capsules are added, U0 and U1 of single aggregates are corrected by experimental tests (step 2, orange), resulting in an increase in U values at all points, as determined by application of Dewar’s model. It should be noted that the ratio of mean sizes (r) stays the same as in steps 1 and 2 because the capsules are not seen as aggregates; instead, they are considered as ‘barriers’ among aggregates that disturb the packing. In step 3, the U values of aggregate mixtures are computed via Equation (12) at the points B−E (green) and compared with the U values from Dewar’s model (from step 2, orange). In this case, the closeness of data points (B, C, D, E) is evaluated to justify the robustness of the ‘U model’.
4.5.1. Validation of the ‘U Model’ Based on the Experimental Approach (the First Scenario)
4.5.2. Validation of the ‘U Model’ Based on Dewar’s Modelling Approach (the Second Scenario)
5. Conclusions
- (1)
- The introduction of macrocapsules did not alter the voids ratio of fine aggregates, but considerably increased the voids ratio of coarse aggregates. A higher capsule dosage led to a higher voids ratio of coarse particles due to the secondary loosening and wall effects induced by the capsules.
- (2)
- The use of short capsules may be beneficial in terms of packing as they can blend well with aggregates in comparison with long capsules. Meanwhile, the use of crushed limestones exerted a higher impact on the packing with capsules than gravels due to their shape and surface roughness.
- (3)
- A slight mismatch between experimental and Dewar results from the aggregate mixtures (without capsules) can sometimes be found, which can be corrected with an adjustment factor to increase the accuracy of Dewar’s model.
- (4)
- The greater the content of coarse aggregates present in the inert structure, the larger the disturbance of the packing system due to the capsules. Therefore, the capsules’ effect can be minimised by using a high content of fine aggregates.
- (5)
- The voids ratio of aggregates in the presence of tubular capsules was successfully predicted by considering the capsule parameters (i.e., capsule dosage, capsule length, capsule diameter and empirical constants). The limitations of the proposed and currently validated ‘U model’ for aggregate mixtures with capsules are that (i) the aggregate mixtures should be composed of two or three aggregate types/fractions with a continuous grading and (ii) the maximum aggregate size is 20 mm. Validation/extension of the model for other materials (combinations) needs further research.
Author Contributions
Funding

Institutional Review Board Statement
Informed Consent Statement
Data Availability Statement
Acknowledgments
Conflicts of Interest
References
- Roy, R.; Rossi, E.; Silfwerbrand, J.; Jonkers, H. Self-Healing Capacity of Mortars with Added-in Bio-Plastic Bacteria-Based Agents: Characterization and Quantification through Micro-Scale Techniques. Constr. Build. Mater. 2021, 297, 123793. [Google Scholar] [CrossRef]
- Al-Tabbaa, A.; Litina, C.; Giannaros, P.; Kanellopoulos, A.; Souza, L. First UK Field Application and Performance of Microcapsule-Based Self-Healing Concrete. Constr. Build. Mater. 2019, 208, 669–685. [Google Scholar] [CrossRef]
- Shields, Y.; Van Mullem, T.; De Belie, N.; Van Tittelboom, K. An Investigation of Suitable Healing Agents for Vascular-Based Self-Healing in Cementitious Materials. Sustainability 2021, 13, 12948. [Google Scholar] [CrossRef]
- Anglani, G.; Van Mullem, T.; Tulliani, J.-M.; Van Tittelboom, K.; De Belie, N.; Antonaci, P. Durability of Self-Healing Cementitious Systems with Encapsulated Polyurethane Evaluated with a New Pre-Standard Test Method. Mater. Struct. 2022, 55, 143. [Google Scholar] [CrossRef]
- Lee, K.M.; Kim, H.S.; Lee, D.K.; Shin, K.J. Self-Healing Performance Evaluation of Concrete Incorporating Inorganic Materials Based on a Water Permeability Test. Materials 2021, 14, 3202. [Google Scholar] [CrossRef] [PubMed]
- Sayadi, S.; Mihai, I.; Jefferson, A. Time Dependent Micromechanical Self-Healing Model for Cementitious Material. In Proceedings of the RM4L2020 International Conference, Cambridge, UK, 14–17 September 2020; Cardiff University: Cardiff, UK, 2021. [Google Scholar]
- Alex, A.; Masoero, E. Autogenous Healing in Cement: A Kinetic Monte Carlo Simulation of CaCO3 Precipitation. In Computational Modelling of Concrete and Concrete Structures; CRC Press: Boca Raton, FL, USA, 2022; pp. 102–106. [Google Scholar] [CrossRef]
- Barros, L.B.; Knockaert, M.; Tenório Filho, J.R. Towards a More Sustainable Construction Industry: Bridging the Gap between Technical Progress and Commercialization of Self-Healing Concrete. Constr. Build. Mater. 2023, 403, 133094. [Google Scholar] [CrossRef]
- di Summa, D.; Camacho, E.; Ferrara, L.; De Belie, N. Towards a Conscious and Far-Sighted Construction Market Through the Use of Sustainability Indexes. In Proceedings of the Lecture Notes in Civil Engineering; Springer Science and Business Media Deutschland GmbH: Berlin/Heidelberg, Germany, 2023; Volume 349, pp. 870–877. [Google Scholar]
- Hermawan, H.; Minne, P.; Serna, P.; Gruyaert, E. Understanding the Impacts of Healing Agents on the Properties of Fresh and Hardened Self-Healing Concrete: A Review. Processes 2021, 9, 2206. [Google Scholar] [CrossRef]
- Papaioannou, S.; Hein, A.; Amenta, M.; Kilikoglou, V.; Gournis, D.; Karatasios, I. Simulation and Experimental Studies of Self-Healing Capacity in Cement Mortars Incorporating Cement-Based Capsules. Cem. Concr. Compos. 2023, 136, 104859. [Google Scholar] [CrossRef]
- Kanellopoulos, A.; Giannaros, P.; Palmer, D.; Kerr, A.; Al-Tabbaa, A. Polymeric Microcapsules with Switchable Mechanical Properties for Self-Healing Concrete: Synthesis, Characterisation and Proof of Concept. Smart Mater. Struct. 2017, 26, 045025. [Google Scholar] [CrossRef]
- Wang, X.; Xu, J.; Wang, Z.; Yao, W. Use of Recycled Concrete Aggregates as Carriers for Self-Healing of Concrete Cracks by Bacteria with High Urease Activity. Constr. Build. Mater. 2022, 337, 127581. [Google Scholar] [CrossRef]
- Wang, X.; Fang, C.; Li, D.; Han, N.; Xing, F. A Self-Healing Cementitious Composite with Mineral Admixtures and Built-in Carbonate. Cem. Concr. Compos. 2018, 92, 216–229. [Google Scholar] [CrossRef]
- Rossi, E.; Vermeer, C.M.; Mors, R.; Kleerebezem, R.; Copuroglu, O.; Jonkers, H.M. On the Applicability of a Precursor Derived from Organic Waste Streams for Bacteria-Based Self-Healing Concrete. Front. Built. Environ. 2021, 7, 632921. [Google Scholar] [CrossRef]
- Hermawan, H.; Simons, A.; Teirlynck, S.; Serna, P.; Minne, P.; Anglani, G. Applicability of Cementitious Capsules in Concrete Production: Initial Assessment on Capsule Robustness, Mechanical and Self- Sealing Properties of Concrete. In Proceedings of the MATEC Web of Conferences; EDP Sciences: Les Ulis, France, 2023; Volume 378. [Google Scholar]
- Kwan, A.K.H.; Fung, W.W.S. Packing Density Measurement and Modelling of Fine Aggregate and Mortar. Cem. Concr. Compos. 2009, 31, 349–357. [Google Scholar] [CrossRef]
- Kwan, A.K.H.; Chen, J.J. Adding Fly Ash Microsphere to Improve Packing Density, Flowability and Strength of Cement Paste. Powder Technol. 2013, 234, 19–25. [Google Scholar] [CrossRef]
- Chen, J.J.; Kwan, A.K.H. Superfine Cement for Improving Packing Density, Rheology and Strength of Cement Paste. Cem. Concr. Compos. 2012, 34, 1–10. [Google Scholar] [CrossRef]
- Furnas, C.C. Flow of Gasses Through Beds of Broken Solids; U.S. Department of Commerce: Washington, DC, USA, 1929. [Google Scholar]
- Toufar, W.; Born, M.; Klose, E. Packungsdichte Polydisperser Körniger Systeme; VEB Deutscher Verlag für Grundstoffindustrie: Leipzig, Germany, 1976; pp. 29–44. [Google Scholar]
- Johansen, V.; Andersen, P.J. Particle Packing and Concrete Properties; American Ceramic Society: Westerville, OH, USA, 1991. [Google Scholar]
- Dewar, J. Computer Modelling of Concrete Mixtures; Routledge: London, UK, 1999; ISBN 0419230203. [Google Scholar]
- De Larrard, F. Concrete Mixture Proportioning: A Scientific Approach; Taylor and Francis: London, UK, 1999. [Google Scholar]
- Schwanda, F. Das Rechnerische Verfahren Zur Bestimmung Des Hohlraumes Und Zementleimanspruches von Zuschlägen Und Seine Bedeutung Für Spannbetonbau. Zem. Und Beton 1966, 37, 8–17. [Google Scholar]
- Stovall, T.; de Larrard, F.; Buil, M. Linear Packing Density Model of Grain Mixtures. Powder Technol. 1986, 48, 1–12. [Google Scholar] [CrossRef]
- Yu, A.B.; Standish, N. Estimation of the Porosity of Particle Mixtures by Linear-Mixture Packing Model. Ind. Eng. Chem. Res. 1991, 30, 1372–1385. [Google Scholar] [CrossRef]
- Wang, X.; Ma, Z.; Wang, X.; Xue, S.; Shen, W.; Wu, D.; Zhang, X.; Han, Z.; Sui, S.; Wang, M.; et al. Design of Self-Compacting Ultra-High Performance Concrete (SCUHPC) towards to the Cementitious Materials Packing Optimization. Cem. Concr. Compos. 2024, 148, 105443. [Google Scholar] [CrossRef]
- Ding, Y.; Lu, Q.; Lu, F.; Zhang, X. A Novel Method for Generation of Particle Packing Model Used in Numerical Simulation for the Mechanical Behavior of Multi-Component Material. Mater. Des. 2022, 216, 110554. [Google Scholar] [CrossRef]
- Yanzhou, P.; Xiang, L.; Yujiao, L.; Binhe, Z.; Gang, X. Optimization for Mix Proportion of Reactive Powder Concrete Containing Phosphorous Slag by Using Packing Model. J. Adv. Concr. Technol. 2020, 18, 481–492. [Google Scholar]
- Sobolev, K.; Amirjanov, A. Application of Genetic Algorithm for Modeling of Dense Packing of Concrete Aggregates. Constr. Build. Mater. 2010, 24, 1449–1455. [Google Scholar] [CrossRef]
- Dingqiang, F.; Rui, Y.; Zhonghe, S.; Chunfeng, W.; Jinnan, W.; Qiqi, S. A Novel Approach for Developing a Green Ultra-High Performance Concrete (UHPC) with Advanced Particles Packing Meso-Structure. Constr. Build. Mater. 2020, 265, 120339. [Google Scholar] [CrossRef]
- Vatannia, S.; Kearsley, E.; Mostert, D. Development of Economic, Practical and Green Ultra-High Performance Fiber Reinforced Concrete Verified by Particle Packing Model. Case Stud. Constr. Mater. 2020, 13, e00415. [Google Scholar] [CrossRef]
- Gong, C.; Kang, L.; Liu, L.; Lei, M.; Ding, W.; Yang, Z. A Novel Prediction Model of Packing Density for Single and Hybrid Steel Fiber-Aggregate Mixtures. Powder Technol. 2023, 418, 118295. [Google Scholar] [CrossRef]
- Ganta, J.K.; Seshagiri Rao, M.V.; Mousavi, S.S.; Srinivasa Reddy, V.; Bhojaraju, C. Hybrid Steel/Glass Fiber-Reinforced Self-Consolidating Concrete Considering Packing Factor: Mechanical and Durability Characteristics. Structures 2020, 28, 956–972. [Google Scholar] [CrossRef]
- Chu, S.H.; Jiang, Y.; Kwan, A.K.H. Effect of Rigid Fibres on Aggregate Packing. Constr. Build. Mater. 2019, 224, 326–335. [Google Scholar] [CrossRef]
- Powers, T.C. The Properties of Fresh Concrete; John Wiley & Sons: New York, NY, USA, 1968. [Google Scholar]
- Anglani, G.; Van Mullem, T.; Zhu, X.; Wang, J.; Antonaci, P.; De Belie, N.; Tulliani, J.M.; Van Tittelboom, K. Sealing Efficiency of Cement-Based Materials Containing Extruded Cementitious Capsules. Constr. Build. Mater. 2020, 251, 119039. [Google Scholar] [CrossRef]
- Gruyaert, E.; Van Tittelboom, K.; Sucaet, J.; Anrijs, J.; Van Vlierberghe, S.; Dubruel, P.; De Geest, B.G.; Remon, J.P.; De Belie, N. Capsules with Evolving Brittleness to Resist the Preparation of Self-Healing Concrete. Mater. Constr. 2016, 66, e092. [Google Scholar] [CrossRef]
- EN 1097-6:2013; Test for Mechanical and Physical Properties of Aggregates—Part 6: Determination of Particle Density and Water Absorption. Bureau voor Normalisatie (NBN): Brussels, Belgium, 2013.
- EN 1097-3:1998; Tests for Mechanical and Physical Properties of Aggregates—Part 3: Determination of Loose Bulk Density and Voids. Bureau voor Normalisatie (NBN): Brussels, Belgium, 1998.
- EN 933-1:2012; Tests for Geometrical Properties of Aggregates—Part 1: Determination of Particle Size Distribution—Sieving Method. Bureau voor Normalisatie (NBN): Brussels, Belgium, 2012.
- Liu, S.; Minne, P.; Lulić, M.; Li, J.; Gruyaert, E. Implementation and Validation of Dewar’s Particle Packing Model for Recycled Concrete Aggregates. Constr. Build. Mater. 2021, 294, 123429. [Google Scholar] [CrossRef]


| Change Point | Parameters | ||
|---|---|---|---|
| m | kint | kp | |
| A (n = 0) | 0 | - | - |
| B | 0.3 | 0.12 | 0.60 |
| C | 0.75 | 0.06 | 0.65 |
| D | 3 | 0.015 | 0.8 |
| E | 7.5 | 0 | 0.9 |
| F (n = 1) | ∞ | - | - |
| Capsule Name | Length, Lcaps [mm] | Outer Diameter, Dcaps [mm] | Inner Diameter [mm] | Lcaps/Dcaps Ratio | Mass [g] | Volume [mm3] |
|---|---|---|---|---|---|---|
| CEM23 | 22.73 | 14.97 | 12.00 | 1.52 | 6.05 | 4000 |
| CEM54 | 54.19 | 9.06 | 6.00 | 5.98 | 5.98 | 3490 |
| POLY35 | 35.61 | 6.65 | 6.01 | 5.35 | 0.81 | 1240 |
| POLY50 | 50.10 | 6.65 | 6.01 | 7.53 | 1.07 | 1740 |
| POLY65 | 65.03 | 6.65 | 6.01 | 9.78 | 1.33 | 2260 |
| Aggregate | Oven-Dry Particle Density, ρrd [kg/m3] | Loose Bulk Density, ρb [kg/m3] | Voids Ratio, U [-] | Mean Size [mm] |
|---|---|---|---|---|
| Sea sand 0/2.5 | 2670 | 1520 | 0.751 | 0.40 |
| River sand 0/4 | 2690 | 1630 | 0.656 | 0.90 |
| Red sand 0/4 | 2640 | 1660 | 0.592 | 0.80 |
| Gravel 4/8 | 2600 | 1550 | 0.672 | 6.48 |
| Gravel 8/16 | 2600 | 1490 | 0.742 | 12.88 |
| Crushed limestone 2/6 | 2630 | 1350 | 0.952 | 4.30 |
| Crushed limestone 6/16 | 2640 | 1410 | 0.877 | 8.47 |
| Crushed limestone 16/20 | 2660 | 1400 | 0.905 | 18.00 |
| CEM23 | CEM54 | POLY35 | POLY50 | POLY65 | |||||
|---|---|---|---|---|---|---|---|---|---|
| No. of Caps. [pcs] | Caps. Dosage [% v/v] | No. of Caps. [pcs] | Caps. Dosage [% v/v] | No. of Caps. [pcs] | Caps. Dosage [% v/v] | No. of Caps. [pcs] | Caps. Dosage [% v/v] | No. of Caps. [pcs] | Caps. Dosage [% v/v] |
| 0 | 0 | 0 | 0 | 0 | 0 | 0 | 0 | 0 | 0 |
| 10 | 0.54 | 11 | 0.51 | 9 | 0.15 | 7 | 0.16 | 5 | 0.15 |
| 20 | 1.07 | 23 | 1.07 | 40 | 0.66 | 28 | 0.65 | 22 | 0.66 |
| 40 | 2.14 | 46 | 2.15 | 76 | 1.26 | 54 | 1.256 | 42 | 1.27 |
| 60 | 3.21 | 69 | 3.22 | 152 | 2.51 | 108 | 2.51 | 83 | 2.50 |
| 212 | 3.50 | 151 | 3.51 | 116 | 3.50 | ||||
| Aggregate | Factor k [%/(% v/v)] | Increment of k [%] | |
|---|---|---|---|
| CEM23 | CEM54 | ||
| Gravel 4/8 | 2.90 | 4.47 | 54 |
| Gravel 8/16 | 3.42 | 5.32 | 56 |
| Crushed limestone 2/6 | 1.31 | 2.41 | 84 |
| Crushed limestone 6/16 | 1.18 | 3.20 | 171 |
| Crushed limestone 16/20 | 2.00 | 5.52 | 176 |
| AM Type | ||
|---|---|---|
| A mixture of two aggregate types/fractions (= BAM) (e.g., gravel 4/8 + gravel 8/16) | 0.004 | 0.02 |
| A mixture of three aggregate types/fractions (= TAM) (e.g., sand 0/2.5 + gravel 4/8 + gravel 8/16) | 0.0004 | 0.009 |
| Aggregate Mixture (AM) | Fine Fraction (n) | Capsule Type and Dosage (dcaps) | |
|---|---|---|---|
| BAM #1 | Crushed limestone 2/6 + Crushed limestone 6/20 | 0, 0.2, 0.4, 0.6, 0.8, 1.0 | CEM23: 0, 0.53, 1.07% v/v CEM54: 0, 1.07, 2.15% v/v |
| BAM #2 | River sand 0/4 + Crushed limestone 6/20 | 0, 0.2, 0.4, 0.6, 0.8, 1.0 | CEM23: 0, 0.53, 1.07% v/v CEM54: 0, 1.07, 2.15% v/v |
| BAM #3 | Sea sand 0/2.5 + Gravel 4/8 | 0, 0.2, 0.4, 0.6, 0.8, 1.0 | CEM23: 0, 1.25% v/v CEM54: 0, 1.25% v/v POLY35: 0, 1.25% v/v POLY50: 0, 1.25% v/v POLY65: 0, 1.25% v/v |
| TAM #1 | Sand 0/1 + (Crushed limestone 2/6 + Crushed limestone 6/20 with n = 0.4) | 0, 0.2, 0.4, 0.6, 0.8, 1.0 | CEM54: 0, 0.53, 1.07% v/v POLY65: 0, 1.07, 2.15% v/v |
| Aggregate Mixture (AM) | |||
|---|---|---|---|
| BAM #1: | Crushed limestone 2/6 + Crushed limestone 6/20 + All CEM capsules | BAM #3: | Sea sand 0/2.5 + Gravel 4/8 + All capsules types (CEM and POLY) |
| BAM #2: | River sand 0/4 + Crushed limestone 6/20 + All CEM capsules | TAM #1: | Sand 0/1 + (Crushed limestone 2/6 + Crushed limestone 6/20 with n = 0.4) + two specific types of capsules (CEM54 and POLY65) |
Disclaimer/Publisher’s Note: The statements, opinions and data contained in all publications are solely those of the individual author(s) and contributor(s) and not of MDPI and/or the editor(s). MDPI and/or the editor(s) disclaim responsibility for any injury to people or property resulting from any ideas, methods, instructions or products referred to in the content. |
© 2024 by the authors. Licensee MDPI, Basel, Switzerland. This article is an open access article distributed under the terms and conditions of the Creative Commons Attribution (CC BY) license (https://creativecommons.org/licenses/by/4.0/).
Share and Cite
Hermawan, H.; Simons, A.; Teirlynck, S.; Anglani, G.; Serna, P.; Tulliani, J.-M.; Antonaci, P.; Minne, P.; Gruyaert, E. Prediction of Aggregate Packing with Tubular Macrocapsules in the Inert Structure of Self-Healing Concrete Based on Dewar’s Particle Packing Model. Materials 2024, 17, 2455. https://doi.org/10.3390/ma17102455
Hermawan H, Simons A, Teirlynck S, Anglani G, Serna P, Tulliani J-M, Antonaci P, Minne P, Gruyaert E. Prediction of Aggregate Packing with Tubular Macrocapsules in the Inert Structure of Self-Healing Concrete Based on Dewar’s Particle Packing Model. Materials. 2024; 17(10):2455. https://doi.org/10.3390/ma17102455
Chicago/Turabian StyleHermawan, Harry, Alicia Simons, Silke Teirlynck, Giovanni Anglani, Pedro Serna, Jean-Marc Tulliani, Paola Antonaci, Peter Minne, and Elke Gruyaert. 2024. "Prediction of Aggregate Packing with Tubular Macrocapsules in the Inert Structure of Self-Healing Concrete Based on Dewar’s Particle Packing Model" Materials 17, no. 10: 2455. https://doi.org/10.3390/ma17102455