Article

Characterization and Multi-Scenario Prediction of Habitat Quality Evolution in the Bosten Lake Watershed Based on the InVEST and PLUS Models

1
Ministry of Education Key Laboratory for Western Arid Region Grassland Resources and Ecology, College of Grassland Science, Xinjiang Agricultural University, Urumqi 830052, China
2
College of Resources and Environment, Xinjiang Agricultural University, Urumqi 830052, China
3
China National Environmental Monitoring Centre, General Office, Beijing 100012, China
4
State Key Laboratory of Desert and Oasis Ecology, Xinjiang Institute of Ecology and Geography, Chinese Academy of Sciences, Urumqi 830011, China
*
Authors to whom correspondence should be addressed.
These authors contributed equally to this work.
Sustainability 2024, 16(10), 4202; https://doi.org/10.3390/su16104202
Submission received: 17 April 2024 / Revised: 11 May 2024 / Accepted: 15 May 2024 / Published: 16 May 2024

Abstract

:
Habitat quality is an important basis for human well-being and the achievement of sustainable development. Based on land-use data for the Bosten Lake Basin in 2000, 2005, 2010, 2015, and 2022, the PLUS and InVEST models are applied in this study to predict and analyze land-use changes and explore the spatial and temporal evolution characteristics of the region’s habitat quality. Additionally, we use a geographic detector model to reveal the drivers of spatial variation in habitat quality. The results show that: (1) Land use in Bosten Lake Basin is dominated by grassland and bare land, with an area share of 93.21%. Habitat quality shows a trend of degradation followed by improvement, with a spatial pattern of high in the northwest and low in the southeast. (2) Habitat quality in 2030 increased from 2022 in all cases, with a mean of 0.354 for the natural development scenario, a maximum of 0.355 for the ecological development scenario, and a minimum of 0.353 for the economic development scenario. (3) The main drivers affecting habitat quality in the Bosten Lake watershed are DEM, mean annual precipitation (MAP), and GDP per capita. X1∩X4 (0.50) and X4∩X10 (0.51) are the interaction factors with the largest dominant effect in 2000, 2010 and 2020, respectively.

1. Introduction

Habitat quality, often defined in terms of the ability of ecosystems to provide suitable, sustained conditions for the survival of individuals and populations [1], is an important characterization of biodiversity and also an important component of the United Nations’ Sustainable Development Goals (SDG15) [2]. Land-use change, which is an important link between human socio-economic activities and the evolution of the natural environment, can visually reflect the transformation process of human activities on the land surface system and is the core content of global environmental change research [3,4]. The level of habitat quality is usually reflected in land-use status, as the two are closely related. By analyzing the spatial and temporal characteristics of land-use changes, habitat quality changes and their causes can be explored [5,6].
Land-use prediction is realized through a variety of models, with most studies employing the metacellular automata as the basis of model construction. After continuous development over the years, Logistic-CA [7], CLUES [8], FLUS [9], and other models have emerged. These approaches are widely used in the delineation of the ecological red line, analysis of the evolution of the geomorphological landscape, and optimization of national land space. Compared to others, the Logistic–CA model has difficulty reflecting the influence of factors such as socio-economic conditions on urban land-use patterns [10]. Similarly, the FLUS model has difficulty accurately capturing the spatial variations of land-use changes in different regions [9], and the CLUES model ignores the possibility of non-dominant land category conversion in its application, requiring the use of a separate mathematical model for non-spatial modules [8]. However, the Patch-level Land-Use Simulation (PLUS) model effectively solves these problems by introducing the Land Expansion Analysis Strategy (LEAS) and the CA based on a multiple Random Seeds (CARS) generation mechanism. The PLUS model has the advantages of high accuracy and speed and can simulate the complex evolution of various land types [11].
In a foreign study, Mutale et al. [12]. predicted and analyzed the future land use and land cover change in Ndola region from 2022 to 2042, considering three scenarios, Traditional Model (TM), Ecological Preservation (EP), and Economic Development (ED), to achieve an accurate prediction of LULUCF in Ndola region. Li et al. [13] used the PLUS model to predict the spatial and temporal evolution of land use in Tianjin in 2030 and the InVEST model to assess habitat quality from 2000 to 2030. Their aim was to reveal the impacts of urban land-use changes on habitat quality and to explore sustainable development planning. Xu et al. [14] utilized the PLUS model to interpret and predict the expansion of seven different land-use types in Hangzhou and simulated the urban expansion trend of the metropolitan area by selecting multiple driving factors.
The above studies show that the PLUS model generally has good applicability. Furthermore, by adjusting the model parameters, PLUS can better meet the needs of different scenario simulations for various policies and regions. At present, most of the research in the field of land-use scenario simulation mainly calculates the number of land images for future scenarios by explicitly setting the probability of land-use flow to obtain the number of land-use images. However, the fact that the sum of adjusted probabilities of land flow is not equal to 1 is ignored, which can lead to error and affect the accuracy of the results [15]. Therefore, improving the probabilistic land use transfer method has become the focus of current research.
Land-use change affects the level of habitat quality by influencing the flow-of-material cycle in a region. The study of habitat quality change can intuitively reflect the state of regional ecosystem service function and the trend of change, all of which can provide guidance for the development of regional ecological protection. At present, habitat quality evaluation models mainly include InVEST, SolVES [16], and ARIES [17]. The InVEST model is widely used to evaluate the habitat quality of an ecosystem due to its high evaluation accuracy, good visualization effect, and excellent theoretical system [18]. For example, Meng et al. [19] used the InVEST model to quantitatively evaluate the habitat quality of the Kubuzi Desert section of the Yellow River from 1991 to 2019, analyzing the factors affecting the spatial changes of habitat quality by using geoprobes. He et al. [2] employed the habitat quality evaluation module of the model to assess the spatial and temporal evolution characteristics of habitat quality in Guilin from 2000 to 2020. In a recent foreign study, Louis et al. [20] analyzed forest loss in a Malaysian tiger reserve using Sentinel-2 imagery and the InVEST habitat quality model. Meanwhile, there are also related studies in the Bosten Lake Basin. Zhai et al. [21]. analyzed the spatial and temporal evolution of habitat quality in the Bosten Lake Basin and the future trend of change based on the perspective of the “three life (production, living and ecological) spaces” and using the FLUS-InVEST model. The authors also analyzed the spatial and temporal impacts of 15 natural economic factors on habitat quality using the Random Forest (RF) and spatially weighted regression models. Numerous existing studies have measured and evaluated habitat quality at different scales with the help of the InVEST model, demonstrating its scientific validity and applicability.
Bosten Lake Basin is well known for its wealth of natural resources. However, under the current rate of urbanization development, construction land area is rapidly expanding and ecological land is being heavily occupied, leading to the deterioration of habitat quality. Based on this, this study takes Bosten Lake as the research hegemony area and improves the calculation method of land use transfer probability for different scenarios to reduce the simulation error. The evolutionary process of land use and habitat quality in the Bosten Lake Basin from 2000 to 2022 was analyzed, and based on this, a multi-scenario recursive simulation analysis of land use change and habitat quality in 2030 was conducted. The aim was to explore the evolution mechanism of land-use characteristics and habitat quality in the Bosten Lake watershed, with a view to providing effective scientific references for the management and protection of the ecological environment. At the same time, it can contribute to the sustainable development of the region.

2. Data and Materials

2.1. Study Area

The Bosten Lake Basin is situated in the interior of northwestern China, within the Bayin’guoleng Mongol Autonomous Prefecture (Bazhou for short) of Xinjiang. It occupies the northeastern portion of the Tarim Basin and the northeastern edge of the Taklamakan Desert (82°55′–90°25′ E, 39°35′–43°30′ N) and has a total area of approximately 104,698.38 km2. The basin consists of the Kaidu River Watershed, Bosten Lakes and the Peacock River Watershed (Figure 1). Originating in the southern foothills of the Tianshan Mountains, the basin’s rivers and streams meander through the Bayinbruk Grassland, which is an important water conservation area in the Bazhou region. The Kaidu River has a total length of 560 km and is the main source of water supply for Bosten Lake. It flows through a section of high mountain valleys, forming a deltaic impact plain shaping the fertile Yanqi Basin. From there, the Kaidu exits through the mountain passes, ultimately emptying into Bosten Lake (980 km2), which is Xinjiang’s largest freshwater lake and the source of the Peacock River. A relatively rare tributary-free river with a total length of 420 km, the Peacock overflows from the western part of Lake Bosten. It then crosses the southern Tian Shan tributary of the Hora Mountains and the Kuruktag Intersection and enters the Tarim Basin before fading into Lop Nor.
The terrain across the Bosten Lake Basin region has a complex topography but is generally high in the north and low in the south (Figure 1). The average multi-year precipitation from the upper to lower reaches of the basin is 47 mm to 75 mm, with most of the precipitation occurring during the summertime. The average potential evaporation over the years is 1887–2777 mm, and the average annual temperature is only −4.64 °C, with a minimum temperature of −48.13 °C and a maximum temperature of 40.18 °C. The basin has a mid-temperate and warm-temperate continental climate, which is typical of an arid desert region characterized by low rainfall, high evaporation, long sunshine hours, and abundant wind and sand. Overall, the Bosten Lake Basin is classified as having a fragile ecological environment.

2.2. Data Sources and Processing

Land use data: For this research, we chose land-use data for the years 2000, 2005, 2010, 2015, 2020, and 2022 with a resolution of 30 m, based on data in the published article “Study on China’s Year-by-Year 30 m Land Cover and Its Dynamics from 1990–2019”. The study was co-authored by Professors Yang Jie and Huang Xin of Wuhan University [22].
Elevation data (DEM): Our elevation data came from the Geospatial Data Cloud (http://www.gscloud.cn/; accessed on 14 April 2023) and have a spatial resolution of 30 m. The DEM was used to calculate slope and slope direction data.
Normalized Difference Vegetation Index (NDVI), soil type, climate, and socio-economic data were obtained from the Resource and Environmental Sciences Data Centre (http://www.resdc.cn/; accessed on 14 April 2023).
Road data: Data pertaining to regional railway networks and road levels were obtained from the GIS monitoring platform (http://www.dsac.cn/; accessed on 15 April 2023). The Euclidean Distance tool in ArcGIS 10.7 was applied to calculate the distances from different levels to roads and railways.
To ensure the consistency of the spatial accuracy of the data, the driving factor and land-use data were processed using cropping and resampling tools. These data were then uniformly converted into raster files with 100 m × 100 m accuracy.

2.3. Mode Selection and Profiles
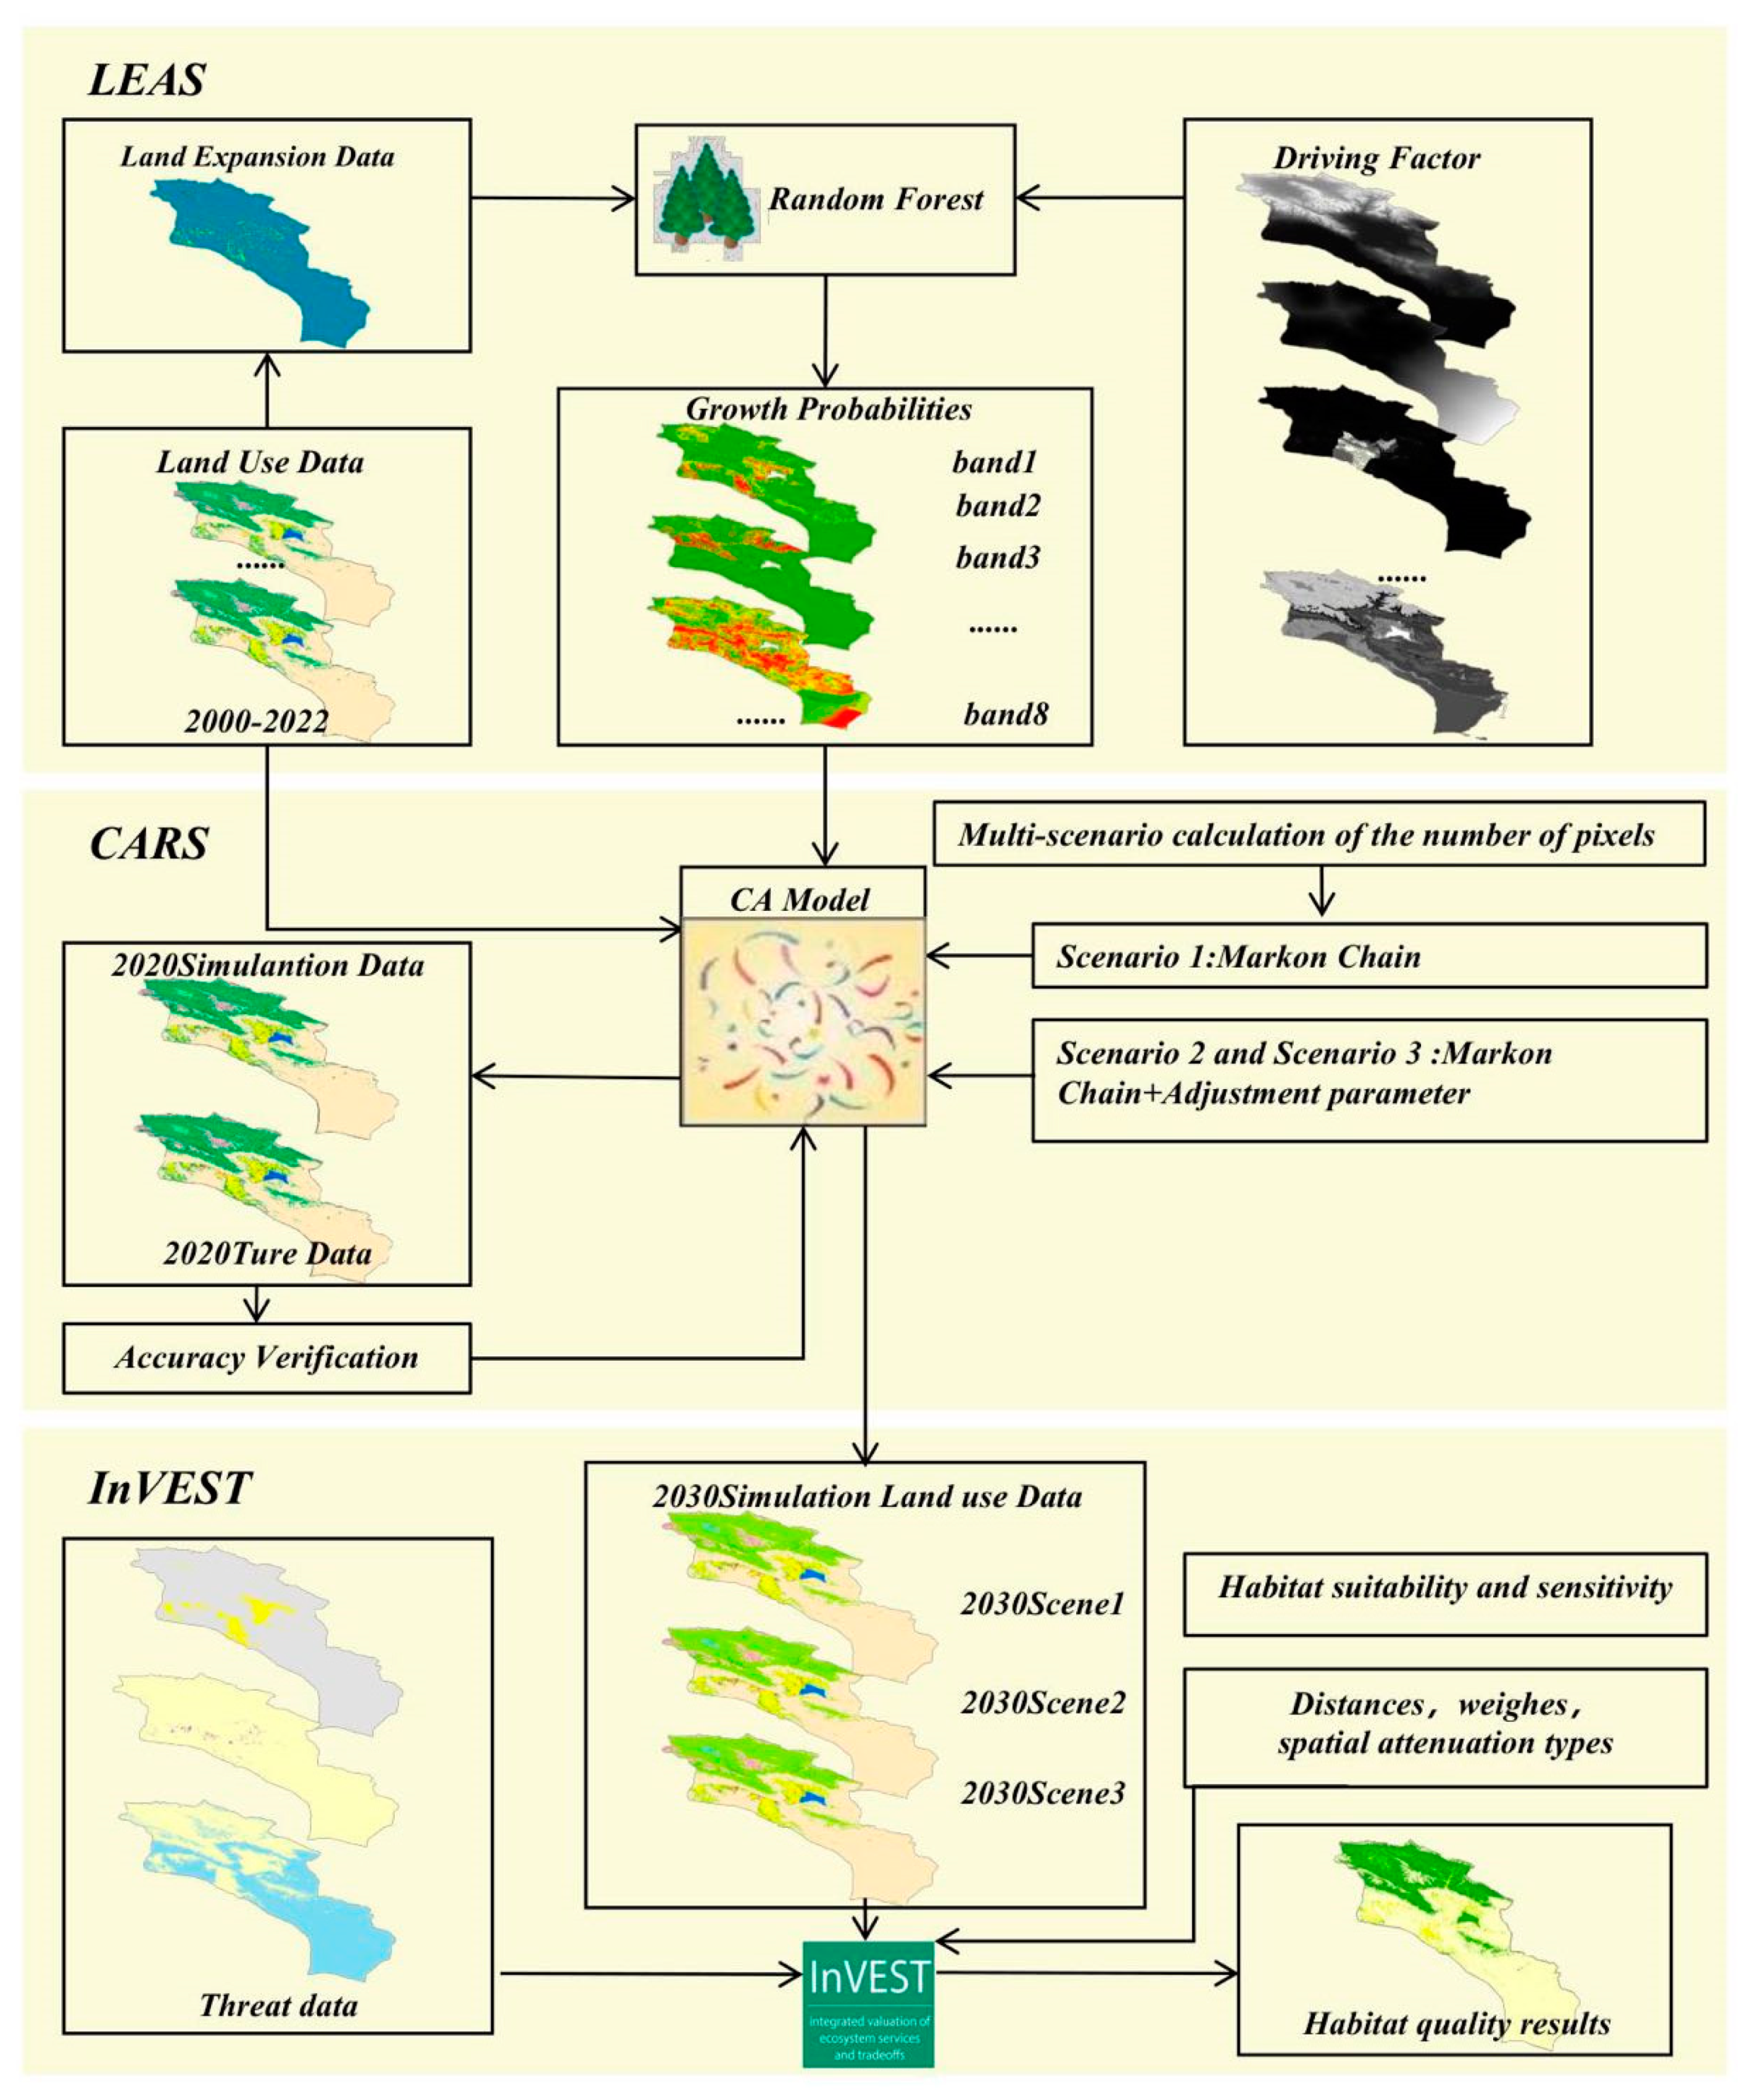
2.3.1. PLUS Models

PLUS is a new model that has been constructed based on metacellular automata. It analyzes the spatial characteristics of the expansion parts of various types of land use and the driving factors between two periods of land-use data. The model adopts the RF algorithm to sample and calculate the expansion parts of land use in order to obtain the probability of development of various types of land use one by one. Based on these results, it obtains the comprehensive probability of land-use change using the adaptive inertia competition mechanism of roulette (Figure 2). Finally, land use is optimized by integrating random patch generation, transition matrices, and threshold descent mechanisms [23,24].

2.3.2. LEAS (Land Expansion Strategy Analysis)

The RF algorithm was used to explore the drivers and influences of expansion for each land-use category separately and to maintain the probability of each driver contributing to the expansion of individual categories over the study period [25]. This was performed by extracting various land-use extensions between two periods of land-use change. The RF algorithm in LEAS determines the probability of occurrence of a local class on a single grid by randomly sampling the spatial data with the following mathematical expression [15]:
P i , j d ( x ) = n = 1 M I h n ( x ) = d M
where P i , j d ( x ) is the probability of growth of land class j at spatial unit i; d takes the value 0 or 1; d = 0 means that no other landforms can be transformed to landform j; d = 1 indicates that other land classes can be transformed into land class j; x denotes the vector consisting of the driving forces; h n ( x ) is the land-use type resulting from the computational prediction of vector n; M is the total number of decision trees; and I is the indicator function of the decision tree.

2.3.3. CARS (CA Based on Multiple Random Seeds)

CARS draws on the principle of randomly generated seeds and a threshold-decreasing mechanism to generate the plaque expansion portion by local dynamic simulation in the study area. Future land-use demand is predicted through the transfer transition matrix and weight parameter settings, with the matrix setting and weight setting referring to the previous experience setting and historical experimental setting, respectively. The formula is as follows [24]:
O P i , j d = 1 , t = R i , j d = 1 × Ω i , j t × D j t
where O P i , j d = 1 , t denotes the total probability of transformation of ground class j in not moment t and spatial cell i;   R i , j d = 1 denotes the transition probability of ground class j in spatial cell i;   Ω i , j t denotes the domain weight of momentary land class j in spatial single i, which takes the value of domain weight between [0, 1] and is set according to the summary of previous experience and combined with the actual development trend of the study area; and D j t represents the adaptive driving coefficient for predicting land class j in future periods.
Adaptive inertia can be adaptively adjusted in the iterative process according to the difference between the expected demand for land quantity and the existing actual situation. Accordingly, the quantity of land use can be developed towards the expected goal, thus achieving the simulation of changes in spatial land-use types. The formula to express this adjustment is as follows [15]:
D k t = D k t 1 G k t 1 G k t 2 D k t 1 × G k t 2 G k t 1 0 > G k t 2 > G k t 1 D k t 1 × G k t 1 G k t 2 G k t 1 > G k t 2 > 0
where D k t indicates the inertia coefficients for site type k at time t, and G k t 1 and G k t 2 are the differences between the demand for land and the actual quantity at moments t − 1 and t − 2, respectively.

2.3.4. InVEST Habitat Quality Model

The InVEST (Integrated Valuation of Ecosystem Services and Tradeoffs) model was developed jointly by Stanford University, the World-Wide Fund for Nature, and The Nature Conservancy. This modeling system supports environmental decision-making by simulating changes in ecosystem services under different land-cover scenarios [26,27]. In this study, the habitat quality module of the InVEST model is used to integrate the sensitivity of each land-cover type to threat factors in order to provide a quantitative assessment of habitat quality across the Bosten Lake Basin region (Figure 2). The strength of ecosystem functioning based on habitat quality scores is measured using a small amount of introduced data and a large amount of output data [28,29,30]. The formula is as follows:
Q x , j = H j 1 D x j z D x j z + K z
where Q x j is the habitat quality of grid x in the jth land-use/land-cover type, with a value range between [0, 1]; H j is the habitat suitability of the jth land-use/land-cover type; and the habitat suitability of each land-use type is expressed from 0 to 1, with 0 representing no conditions for biological survival and 1 representing extremely high habitat suitability. Furthermore, D x j is the degree of habitat degradation of grid x in the jth land-use/land-cover type; z is a normalization constant, usually taken as the default value of 2.5; and k is a half-saturation constant, usually taken as half the maximum habitat degradation raster value.
D xj = r = 1 R y = 1 Y r ω r / r = 1 R ω r r y i r x y β x S j r
where D x j is the degree of habitat degradation of grid x in the jth habitat type; R is the number of threat factors;   ω r is the weight of the rth threat factor, taking the range of [0, 1], with larger values indicating that the threat factor has a greater impact on habitat quality; Y r is the number of rasters of the threat source; r y is the stress value of the grid y; β x is the accessibility of the threat source to the grid x, which takes values in the range [0, 1];   S j r is the sensitivity of the jth habitat type to the threat factor r, which takes the range of [0, 1], with larger values being more sensitive; and i r x y indicates the stress level of the stress value of grid y on grid x. It is categorized into linear and exponential decay, which is expressed by the following equation [31]:
linear   attenuation   i r x y = 1 d x y d r max
exponential   decay   i r x y = exp 2.99 d x y d r max
where d x y is the straight-line distance between grid x and grid y, and d r m a x is the maximum coercive distance from the threat source r.
In addition to land-use data, factors such as stressors, habitat suitability of land-use types, and sensitivity to stressors need to be set in the context of the actual situation in the study area and the results of existing research. After referring to existing research results and the software manual [32], and taking into account the specific development of the Bosten Lake Basin, we set the weights, maximum impact distance, and degradation type for cropland, barren, and impervious surfaces as threat factors (Table 1). Habitat suitability, sensitivity of different habitats to threat factors, and maximum impact level set the distance and weight of each factor according to the actual situation [31,33,34,35] (Table 2).

2.3.5. Multi-Scenario Settings

Three typical models for scenarios of natural development, ecological protection, and economic development were designed to simulate and predict the number and spatial distribution of image elements of various land-use modes in the Bosten Lake Basin in 2030. The models predict the number of pixels for natural development scenarios and boundary constraint scenarios through Markov chains, based on China’s latest territorial spatial planning and regulations for regional economic development and environmental protection. The number of ecologically prioritized scenario pixels was determined based on the Markov chain and the above land-transfer probability parameters [15]. The settings for each scene are as follows:
(1)
Scenario One: Natural development scenario. Without considering urban master-planning factors and current ecological land-protection factors, urban development in 2030 was simulated using historical land-use transfer probabilities based on historical urban expansion trends only. The number of land image elements of each type in 2030 was predicted through Markov chains.
(2)
Scenario Two: Ecological protection scenario. Since the study area is home to China’s largest inland freshwater lake and contains the country’s only nature reserve for swans, the primary objective of ecological protection of the environment is to limit urbanization and develop land use in a more environmentally friendly direction. In this scenario, the probability of transferring forest land, grassland and water bodies to impervious is reduced by 30%; the probability of transferring cropland to forest land and grassland is increased by 30% by continuing the implementation of the ecological project of returning farmland to forests and grasslands; and the probability of transferring cropland to water bodies is increased by 10% by taking into account the return of cropland to wetland. Further, the probability of transferring unutilized land to forest land and grassland is increased by 20%, while the conversion of water bodies to other land types is restricted.
(3)
Scenario Three: Economic development scenario. Accompanied by rapid economic development and urbanization, the expansion of cities and arable land is increasing. This scenario sets a 20% increase in the probability of transferring cropland, forest land and grassland to impervious; a 20% increase in the probability of transferring bare land to impervious; and a 20% decrease in the probability of transferring impervious to land use other than cropland. The scenario also limits the conversion of impervious to other land-use categories.
Figure 2. Flow chart of data processing.
Sustainability 16 04202 g002

2.3.6. Geographic Detector Model

Geoprobes were utilized to quantitatively assess the factors affecting habitat quality in the study area and the intensity of the factors’ influence. This mathematical statistics analysis method was proposed by Wang Jinfeng and Xu Chengdong to explore the spatial differentiation of geographical entities and reveal their driving force, including factor detection, ecological detection, interaction detection, and risk detection [36]. In this paper, we discretize two types of factors, namely, natural environment factors, including DEM (X1), NDVI (X2), temperature (X3), precipitation (X4), soil type (X5) and slope (X6), and socio-economic factors, including distance to a road distance to township level and above (X7), distance to water (X8), population density (X9) and GDP per capita (X10). The main applications are its factorial detection and interaction detection. Factor probes measure the extent to which the independent variable explains the spatial differentiation of the dependent variable, and interaction probes analyze the extent to which the distribution of the dependent variable is affected by the superimposed effects of different factors. The formula is:
q = 1 i = 1 L N i σ i 2 N σ 2
where q is the detection value of each driving factor; Ni and N are the number of samples in the partition and the whole area, respectively; L is the number of evaluation units; σ i 2 and σ 2 are the discrete variances in the partition and the whole area, respectively.

3. Results and Analysis

3.1. Characteristics and Prediction of Land-Use Change

3.1.1. Analysis of Land-Use Characteristics from 2000 to 2022

Land-use distribution and changes in the Bosten Lake Basin from 2000 to 2022 are shown in Figure 3. As can be seen, land use is dominated by grassland and barren land, accounting for 93.21% of the area, with barren land making up more than 70%. During the study period, land-use changes were obvious, and impervious surfaces, cropland, and water bodies were mainly distributed in the plains in the middle reaches of the basin, while grassland, forest, snow/ice, and wetland were the primary land-cover types in the Tianshan Mountains, northwest of the basin. Barren land was mostly distributed in the desert area of the Tarim Basin in the lower reaches of the basin. The overall proportion of land types in the study area was barren > grassland > cropland > forest > snow/ice > water > impervious > wetlands > shrub. The land-use changes over the past 22 years also show an increase in economic land area and a decrease in ecological land area.
Specifically, the area of cropland, impervious surfaces, and forest land was expanded, while the area of grassland, water, snow/ice, wetland, and barren land was reduced. Impervious surface area changed the most due to the acceleration of urbanization and intensification of human activity, but cropland area likewise saw massive gains. Impervious surfaces increased 751.91% during the study period, from 50.19 km2 in 2000 to 427.59 km2 in 2022, while cropland area expanded 2343.50 km2, representing an increase of 58.16%. Forest area increased by 91.14 km2 (Table 3). On the other hand, grassland area across the basin shrank by 919.82 km2 and barren land area declined from 63,858.35 km2 to 62,355.03 km2, representing a reduction of 2.35% (Figure 4). Furthermore, thanks in large part to global warming as well as the expansion of cultivated land and the subsequent high demand for irrigation water, the area of water bodies was reduced by 93.57 km2 during the study period. At the same time, snow/ice decreased from 1484.40 km2 to 1207.83 km2 and wetlands shrank from 349.30 km2 to 326.45 km2.
Table 3 presents data on the transfer of land-use types in the Bosten Lake Basin from 2000 to 2022. As can be seen, there were frequent transfers. Cropland land area expanded dramatically, with 2838.30 km2 transferred from other land types such as forest land (98.84 km2), grassland (1521.97 km2), barren land (1125.21 km2), and water bodies (69.19 km2). Of these, barren land and grassland accounted for 93.27% of the area transferred to cropland, indicating that cropland expansion relied mainly on land reclamation and grassland. Forest area was mostly transferred from grassland (216.64 km2), and shrub land area and wetland area were relatively balanced, changing little. Of the grassland area (3794.57 km2), 387.78 km2 was transferred to cropland and 2241.19 km2 to barren land.

3.1.2. Multi-Scenario Analysis of Land-Use Prediction

Based on the PLUS model, land-use data for 2010 were used as base-period data for prediction and simulation. Twelve driving factors (temperature, precipitation, DEM, slope, aspect, NDVI, soil type, GDP per capita, population density, road distance to township level and above, distance to water, evapotranspiration) were selected to simulate the land-use data for 2020. The accuracy verification of the real and simulation land-use data for 2020 shows a Kappa coefficient of 0.9734 and an overall accuracy of 0.9853, indicating that the simulation results are highly accurate. Therefore, this paper uses the PLUS model based on the land-use data from 2020 to predict the land-use data for natural development, ecological protection, and economic development scenarios in the Bosten Lake Basin in 2030.
Under the natural development scenario, based on the spatiotemporal evolution of land-use change in the study region from 2000 to 2020, the dynamic prediction was carried out under the assumption that the law remains unchanged and no additional policy factors have been set. A comparative analysis of the 2020 (Figure 5a) and 2030 (Figure 5b) scenarios shows a trend of increasing cropland, a slight increase in impervious surfaces, and expanding water bodies. In this scenario, barren land was significantly reduced, mainly converting to cropland (563.73 km2), impervious surfaces (158.30 km2), and snow/ice (106.40 km2), for a total conversion of 863.16 km2. Secondly, grassland was converted to cropland (159.79 km2), decreasing by 224.07 km2. Cropland increased by 1021.72 km2, and the transfer from impervious surfaces (206.36 km2) and barren land (216.84 km2) was almost the same. There was a slight uptick in forest, water bodies, and snow/ice area and a slight decline in grassland and wetland area (Figure 6).
Under the ecological protection scenario, encroachment on forest, grassland, and water bodies is strictly restricted for the dynamic prediction (to prevent over-development during the process of urbanization and damage to the ecological environment). In this scenario, impervious surface area in 2030 (Figure 5c) is anticipated to increase only slightly compared to 2020 (Figure 5a), and water bodies will expand outward. However, compared with natural scenarios, impervious surfaces will spread relatively slowly and will not occupy grassland or water bodies. Further, the transfer area of impervious surfaces, grassland, and water bodies will be 0, with transfers mainly occurring from barren land to cropland, grassland, water bodies, and snow/ice, for a total of 1176.66 km2. In comparing the ecological protection scenario with the natural development one, we see a reduction in cropland of 284.92 km2 and an increase in grassland of 255.33 km2. These changes are the result of heavy restrictions and ecological protection policies, such as returning farmland to forest and grassland. By restricting the transfer of water bodies, water is anticipated to increase from an area of 1162.15 km2 to 1228.89 km2 between 2020 and 2030, and snow/ice will increase by 181.85 km2. The change trend of forest and wetland is not expected to be significant, and impervious surfaces show only a small expansion (Figure 6).
Under the scenario of economic development, however, impervious surfaces are anticipated to expand rapidly. Therefore, when predicting land use in 2030, the transfer probability of impervious surfaces should be increased, and the transformation of impervious surfaces to other land types should be restricted. In comparing Figure 5d with 2020 and the other two scenarios, we can see a massive increase in impervious surfaces occupying large swathes of grassland, barren land, and cropland. Under this scenario, cropland is also predicted to increase enormously, expanding in area by 736.41 km2, followed by impervious surfaces, which are predicted to increase from 405.25 km2 to 544.64 km2 (Figure 6). In contrast, grassland, barren land, and wetland are all expected to chart a downward trend, resulting in a major loss of ecological land for the development of agricultural economy. These predicted changes will seriously hinder the sustainable development of the study area.

3.2. Comparative Analysis of Spatial-Temporal Evolution of Habitat Quality and Multi-Scenario Simulation

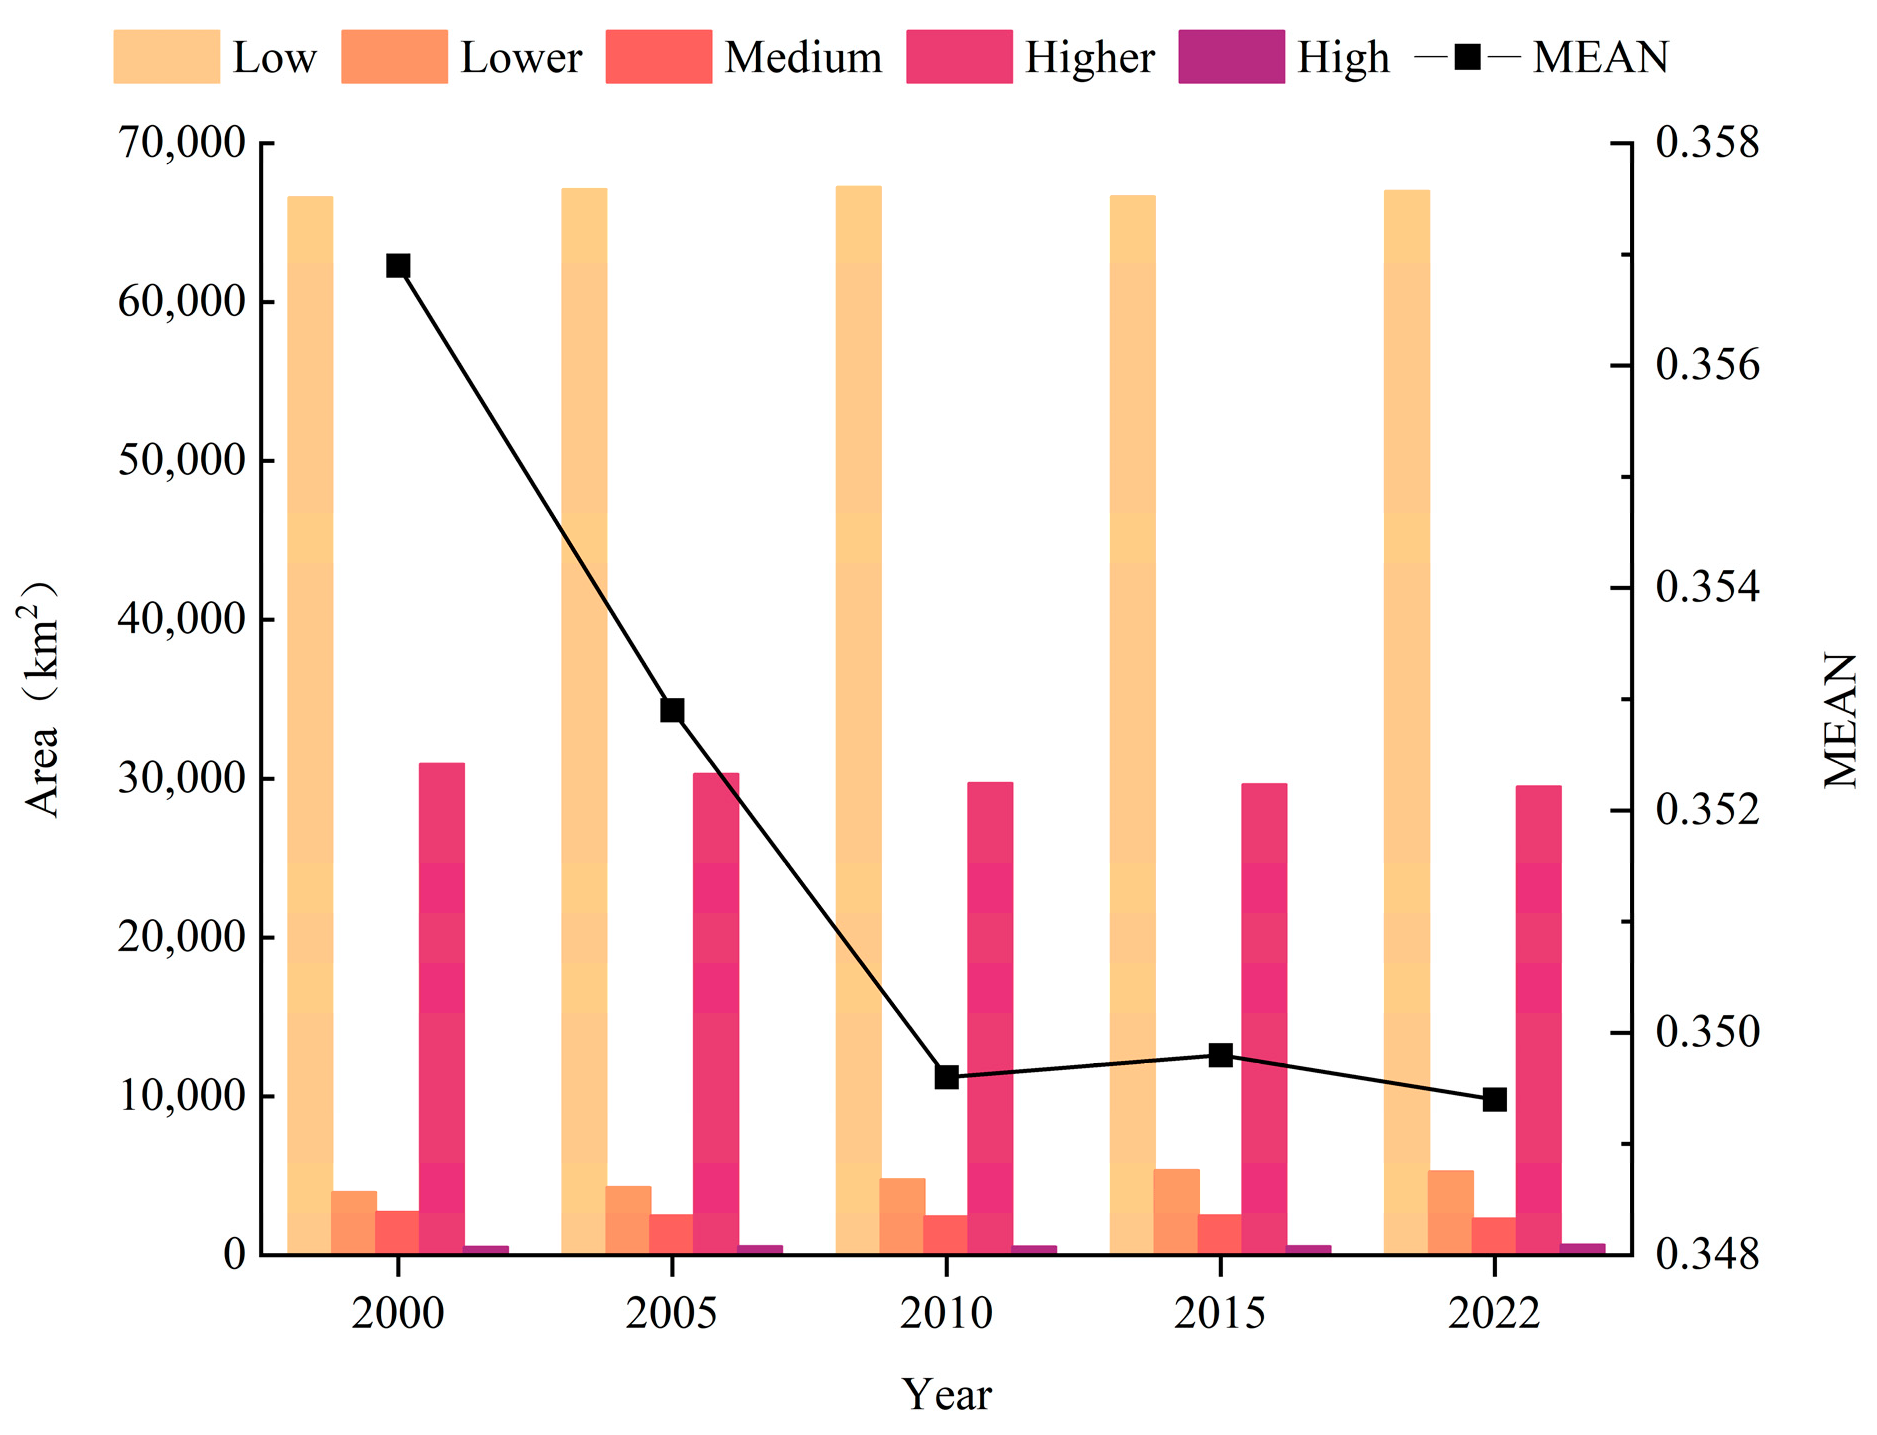
3.2.1. Characteristics of Habitat Quality Evolution in 2000–2022

The current data on land-use, ecological threat factor, and factor sensitivity were imported into the InVEST model to obtain the habitat quality data for the Bosten Lake Basin in 2000, 2005, 2010, 2015, and 2022. The value range of the habitat quality index was (0–1). Higher and larger habitat quality values indicate that the watershed’s ecosystem services are more comprehensive and thus more favorable for biodiversity conservation. In order to present the evolution of watershed habitat quality in different years, the results of the habitat quality assessment were categorized into five grades with the help of the natural discontinuities method in ArcGIS software. The five grades are: low (0, 0.2), lower (0.2, 0.4), medium (0.4, 0.6), higher (0.6, 0.8), and high (0.8, 1.0). The results reveal that the mean values of habitat quality in the basin from 2000 to 2022 were 0.3569, 0.3529, 0.3496, 0.3498, and 0.3494, respectively, showing a trend of degradation followed by gradual recovery.
In terms of spatial distribution (Figure 7), habitat quality status is closely related to land-use change, with a high degree of consistency. The landscape matrix for high-level habitat quality consists mainly of ecological land use such as forest, grassland, and water bodies, while medium-grade habitat quality is mainly composed of cropland and sparse grassland, and low-grade habitat quality comprises land-use categories such as impervious surfaces and barren land. Between 2000 and 2022, the habitat quality grade was mainly low and high, accounting for 92.15% of the total area. The low habitat quality was mostly distributed in the middle and lower reaches of the basin, accounting for more than 63.98% of the total area. This region is dominated by relatively high human activity, such as cultivated plains, urban and rural settlements, the edge of the Taklamakan Desert, and low-cover grasslands. High habitat quality was primarily distributed in the northern slopes of the Tianshan Mountains and at Bosten Lake in the northern part of the basin, which accounted for more than 28% of the total area of the study region. These locations are rich in species resources and biodiversity and have the best habitat quality thanks to relatively abundant annual precipitation, little evaporation, fewer human activities, and relatively rich biodiversity. The medium grade of habitat quality is mainly distributed in low vegetation cover locations, such as in the peripheral suburbs of an urban center or at the edge of a watershed. There is a small downward trend in medium-grade habitat due to the uncontrolled encroachment of man-made land into ecological land such as grassland and water bodies. Most regions of lower habitat quality are situated in the middle reaches of the watershed, where the terrain is flat, or distributed along a river or on farmland, forming a population agglomeration. This type of habitat is on the lower side of the quality scale and shows a tendency to increase due to the vigorous development of the economy. The result is an expansion of land for impervious surfaces and cropland. The regions of high habitat quality are distributed in the forest and grassland areas of the Tianshan Nature Reserve, showing a sporadic distribution and accounting for the smallest area. The reserve is the outcome of recent active promotion of ecological protection policies, such as returning farmland to forests, along with wetland protection and restoration projects. As a result of these efforts, the further degradation of high-grade habitat quality areas has been alleviated and there is a slight increase in the trend toward this habitat creation.
In terms of temporal distribution (Figure 8), habitat quality across the Bosten Lake Basin was significantly lower in 2010 than in previous or later years. Compared to the 2000 mean, there was a decrease of 0.0073 in 2010, characterized by a decrease in higher-quality habitat and an increase in low-quality habitat. Specifically, higher-grade habitat area decreased from 30,913.49 km2 to 29,707.72 km2 and low-grade habitat area increased from 66,594.61 km2 to 67,246.18 km2, while lower-grade habitat area increased by 820.90 km2 and medium-grade habitat area decreased by 286.31 km2. These changes are due primarily to the further implementation of the 2000–2010 “western development” strategy, which is aimed at building new urbanization zones driven by economic development strategies such as industry and tourism.
Then, from 2010 to 2022, the decreasing trend of habitat quality in the basin was controlled. The mean value decreased by 0.0002, showing a gradual reduction in low-grade land area and a further increase in high-grade land area. During these 12 years, the low-grade area of habitat quality decreased from 67,246.18 km2 in 2010 to 66,990.10 km2 in 2022, and the area of high-grade habitat quality increased from 541.18 km2 to 660.26 km2. Thus, the overall habitat quality in the study region from 2000 to 2022 shows a trend of decline followed by a stabilizing trend with a slight increase, indicating that the ecological environment governance in the Bosten Lake Basin has achieved remarkable results.

3.2.2. Comparative Analysis of Habitat Quality by Multiple Scenario Simulation

Using the prediction results of the PLUS and InVEST models, this study analyzed the habitat quality of natural growth, ecological protection, and economic development scenarios in the Bosten Lake Basin for 2030. The habitat quality spatial distribution (Figure 9) and area change (Figure 10) trends were compared with the 2020 habitat quality map (Figure 9a). As can be seen, the natural development scenario (Figure 9b) for 2030 predicts that habitat quality will have a slightly increasing trend, with reductions both in low-grade and medium-grade area but increases in higher-grade area. The land area of low- and medium-grade habitat quality is expected to decrease by 1495.34 km2 and 251.62 km2, respectively, while the land area of higher-grade habitat quality will increase by 925.06 km2. Additionally, a slight overall decrease is anticipated in high-grade habitat quality (52.81 km2).
Under the ecological protection scenario (Figure 9c), compared with the two scenarios in 2020 and the other two areas, the higher- and high-grade habitat quality area is expected to increase the most. Specifically, higher- and high-grade habitat quality increased by 789.74 km2 and 9.79 km2, respectively, while low-grade habitat quality area decreased by 2162.91 km2. Compared to the other two scenarios, high-grade land area is expected to expand the fastest under the ecological protection scenario, and low-level grade area is expected to decrease the most, indicating that the ecosystem is somewhat protected in this scenario.
Under the economic development scenario (Figure 9d), medium-grade habitat quality is anticipated to expand the most, with habitat quality overall showing a slight increasing trend. However, compared to the other two scenarios, the land area of high- and medium-grade habitat quality is expected to decrease. Specifically, high-grade habitat quality area shows a decrease of 7.08 km2, and medium-grade area is anticipated to shrink by 385.18 km2. These changes indicate that the rapid development of the economy may lead to major reductions in cropland and ecological land, which will seriously hinder the sustainable development of the region.
From the above, we can see that the spatial and temporal evolutionary trends of habitat quality under the three scenarios in 2030 are contrary to the evolutionary trends from 2000 to 2022. This difference is due to the implementation of several ecological restoration and restoration projects in ecologically sensitive areas of woodland and grassland in recent years. In locations with high habitat suitability, the projects have resulted in significant improvements in the ecological environment of the Bosten Lake Basin. Evaluating habitat quality through different scenario predictions reveals changes that are mainly concentrated in the middle of the basin’s population clusters and cropland, reflecting the various economic development and human activities occurring in those locations.

3.3. Mechanisms of Spatial Differentiation in Habitat Quality

3.3.1. Factor Detection

The results for each year are shown below, representing the extent to which individual drivers explain the distribution of the habitat quality index, and all factors have a p-value of 0, indicating that the results pass the test of significance at the 0.05 level and that the models are all plausible.
The drivers screened by the study all influenced the spatial differentiation of habitat quality in the Bosten Lake watershed to some extent (Figure 11). Among the drivers in 2000 and 2010, the order of magnitude according to the q-statistic was DEM (X1) > precipitation (X4) > temperature (X3) > soil type (X5) > per capita GDP (X10) > NDVI (X2) > slope (X6) >road distance to township level and above (X7) > distance to water (X8) > population density (X9). The top 5 q-values of the single-factor detection results of the habitat quality influencing factors in the Bosten Lake watershed in 2022 were, in descending order, precipitation (X4) > temperature (X3) > DEM (X1) > soil type (X5) > GDP per capita (X10). Taken together, the influence factor with the greatest explanatory power for habitat quality in 2000 and 2010 was DEM. The greatest explanatory power for habitat quality in 2022 is precipitation.
The mean value of the overall q-value statistic for the natural environment factor reached 0.876, with a maximum of 0.890 for the three-phase factor detection. Among them, DEM and precipitation had the highest q-value statistics of 0.29 and 0.31, respectively, reflecting that DEM and precipitation had the greatest influence on the spatial differentiation of habitat quality. Secondly, the q-value statistic for temperature was also close to 0.15, indicating that climate has a place in influencing habitat quality. Finally, the natural environmental factors of soil type and NDVI had q-values close to 0.1, which influenced the spatial differentiation of regional habitat quality to some extent. In addition, the q-value of the socio-economic factor, GDP per capita, reached 0.174, and the q-values of the remaining socially driven factors all ranged from 1% to 10%, suggesting that they have a weak influence on habitat quality differentiation.

3.3.2. Interaction Detection

The results of the interaction detection of driving factors for spatial differentiation of habitat quality in Bosten Lake Basin showed that the q values under the interaction of two factors in the study area were larger than those of a single factor, and the types of interactions between the selected factors were dominated by two-factor enhancement and nonlinear enhancement, indicating that the spatial differentiation of habitat quality in Bosten Lake Basin was caused by the complex coupling between multiple factors, not by a single influencing factor (Figure 12). Interactions within natural environmental factors and between socio-economic factors and natural environmental factors are strong. Among them, the interaction effect q-values in 2000 were all greater than 0.45 for X1∩X4 (0.50), X1∩X10 (0.48), X4∩X7 (0.47), and X4∩X5 (0.46); In 2010, the interaction effect q values were all greater than 0.45 for X1∩X4 (0.49), X1∩X10 (0.48), X4∩X7 (0.46), and X4∩X5 (0.46); in 2022, the interaction effect q values were all greater than 0.45 for X4∩X10 (0.51), X3∩X10 (0.48), X1∩X10 (0.48), X4∩X7 (0.46), and X1∩X7 (0.46), and X4∩X7 (0.46). The interactions within the socioeconomic factors were weak, but the synergistic enhancement between the socioeconomic factors also had an effect on the degree of spatial differentiation of habitat quality in the Bosten Lake Basin. Taken together, the largest explanatory power of the interactions in 2000 and 2010 was the combination of a single factor dominated by DEM and precipitation with other factors, and the largest explanatory power of the interactions in 2022 was the combination of a single factor dominated by precipitation and GDP per capita with other factors, suggesting that DEM together with precipitation and GDP per capita determine the spatial distribution of different habitat types.

4. Discussion

This paper analyzes the spatial and temporal trends of land use and habitat quality in the study region. Based on the results of land-use prediction under three different scenarios for 2030, the study found that the ecological protection scenario led to the greatest improvement in habitat quality across the basin. The results of the study provide a scientific basis for the protection of biodiversity in arid inland river basins, the construction of an economic layout for high-quality development, the optimization of ecological security patterns, and the orderly guidance of efficient and green development in towns and cities.

4.1. Analysis of Land-Use Change Attribution

The land-use/land-cover system is a complex ecosystem in which human activities have a significant impact on its development and change, while the ecosystem also influences humans [20,37]. Land-use change in the Bosten Lake Basin is the result of numerous factors. Our analysis indicates that due to an increase in population and rapid economic and social development, a large amount of new farmland has been reclaimed in the region, expanding the area of towns and cities and occupying large swathes of barren land and grassland. This phenomenon is extremely prominent in the plains in the middle of the study area, where the natural conditions are more favorable for human development, a finding also shared by Zhang et al. study [38] on the basin. In addition to the encroachment of production land, other reasons for the degradation of grassland area include the degradation of alpine meadows and mountain grasslands caused by overgrazing of grasslands, along with insect and rodent infestations [39].
By comparing watershed area trends from 2000 to 2022, we found that a decreasing trend was followed by an increasing one, which was consistent with the research results of Li Yujiao [40]. The main reason for this change is the sharp rise in agricultural irrigation demand, resulting in a massive increase in water consumption. At the same time, the average annual temperature charts a rising trend, with the resultant warming leading to watershed area shrinkage. However, the national ecological comprehensive management project carried out in recent years includes a variety of ecological measures, such as river management, irrigation district water-saving renovation, ecological water transfer, and ecological construction, all of which have led to an upward trend in the water area of rivers and lakes in the Bosten Lake Basin [41].

4.2. Impacts of Land-Use Change on Habitat Quality

Expansion of construction land and cropland in the basin during the study period is closely related to the socio-economy. Combined with the actual degree of habitat quality degradation, it can be seen (Figure 13) that impervious surfaces, cropland, and barren land have the most drastic impact on habitat quality among all land-use types. Any area changes occurring in these three land-use types will therefore directly impact changes in habitat quality [42]. We used the PLUS-InVEST model for prediction analysis of the basin, where the ecological environment is already fragile. In so doing, we artificially imposed ecological zoning planning and land-use conversion restriction zones for key ecological reserves to determine the optimal balance between socio-economic development and habitat quality protection [43]. The results of this analysis are similar to those in Zhai Yuxin et al. research [21], showing that the area of land for production and habitation is still expanding while the ecological area in undergoing a decreasing trend. Therefore, adjusting the land-use pattern of the region is an effective means to optimize habitat quality.

4.3. Comparative Analysis of Habitat Quality under Multiple Scenarios

Using the prediction results, we compared the spatial distribution of habitat quality degradation in the basin under the three scenarios in 2030 (Figure 14). It was found that under the natural development scenario, the high degradation and low degradation areas progressively increase in size and the degradation of habitat quality is more pronounced. Under the ecological protection scenario, stabilized areas gradually encroach on highly degraded and less degraded areas, and the degree of degradation of habitat quality improves. This is because the study area includes complex ecosystems such as mountains, grasslands, rivers, lakes, and deserts with fragile ecosystems and prominent human relationships [44]. During “the 14th Five-Year Plan” period, it was proposed that the concept of green development be adhered to and that economic and social development be consciously integrated with the building of an ecological civilization [45]. This has slowed down the flow of ecological land in the basin and improved degradation. Under the economic development scenario, land transformation is prioritized towards urban living land, agricultural production land, and industrial production land, which seriously affects the ecology and the environment and may even lead to serious human-land and human-nature conflicts, which is in line with the findings of Gao et al. research conclusions [46]. Therefore, it is necessary to actively promote the ecological management and protection in the watershed to provide a good ecological security guarantee for the construction of a new pattern of Western development, the Belt and Road Economic Belt, and rural revitalization, all while building a firm ecological foundation and enhancing the quality and effectiveness of the ecological barrier.

4.4. Limitations and Outlook

This study investigated the dynamic changes of habitat quality in Bosten Lake Basin from 2000 to 2022 and predicted the spatial distribution of habitat quality in the basin under three scenarios in 2030 using the PLUS-InVEST model. The results and findings of this research can provide a reference basis for ecological zoning planning and habitat quality improvement in arid zones. However, this study has a few limitations, as detailed below.
First, the PLUS model predicted only land-use data, natural drivers, GDP per capita, population density, road distance, and other drivers for model construction. Additional socio-economic factors affecting human activities were not fully considered. Therefore, the indicator construction system must be further enriched and improved. Second, the InVEST-HQ model requires input parameters, and the relevant parameters used in this study were obtained from model manuals, related studies, and expert experience, so there is a certain degree of subjectivity in parameter setting that can lead to uncertainty in the evaluation results. Therefore, future research could focus on exploring effective ways to optimize the parameter settings.
We should also take into consideration that, among all the basins in China, the Bosten Lake Basin has one of the highest degrees of water resources development and utilization and the most prominent contradiction in water use. These characteristics are of critical significance in the integrated promotion of social and economic development and regional ecological environment construction. From the analysis of land use and habitat quality changes, there are still some problems that need attention. In terms of land use, the problem of ecological land being occupied by construction land and arable land expansion is an ongoing issue. The solution to this problem could be to further promote land-use policies that highlight saving and intensifying land use, and to scientifically guide urban expansion and coordinated regional development. In terms of habitat quality, the middle reaches of the basin, where the level of economic development is high and the population is concentrated, have poor habitat quality and serious degradation trends. Habitat quality can be improved by reinforcing land-use control, strengthening the “three-in-one” protection system for the quantity, quality, and ecology of arable land, and increasing the area of urban greening.

5. Conclusions

This paper evaluated the habitat quality of Bosten Lake Basin from 2000 to 2022 with the help of the InVEST model. Three scenarios (natural development, ecological protection, and economic development) were set up, and the PLUS model was used to dynamically simulate land-use status and evaluate habitat quality predictions for 2030 under the different scenarios. The main influencing factors of habitat quality were investigated with the geographical detector model, and the spatial differentiation mechanism was analyzed. The results of the study are as follows:
(1)
Habitat quality degrades and then improves from 2000 to 2022, reaching its lowest mean habitat quality value in 2010. Spatially, it is characterized by high in the northwest and low in the southeast. Comparison of the habitat quality of the different scenarios in 2030 reveals that the ecological protection scenario has the highest mean value and the lowest degree of degradation.
(2)
The PLUS model projections show that land use changes in 2022–2030 are similar to actual changes in 2000–2022, but with a slowdown in the degree of land turnover. Trends in agricultural land and impervious surface expansion have slowed, and the shrinkage of ecological land use has been controlled.
(3)
DEM, mean annual precipitation and GDP per capita are the main drivers of differences in the spatial distribution of habitat quality in the Bosten Lake Basin. Stronger interactions within natural environmental factors and between socio-economic factors and natural environmental factors. X1∩X4 (0.50) and X4∩X10 (0.51) are the interaction factors with the largest dominant effect in 2000, 2010 and 2020, respectively.

Author Contributions

Y.W. contributed to the formulation of the research questions; Z.S. performed the data analysis and paper writing; H.W. and X.X. were responsible for data processing and interpretation of the results. J.H. and Y.Y. managed the project and funded this paper. All authors have read and agreed to the published version of the manuscript.

Funding

The National Natural Science Foundation of China (No. 42277480, 42122004); Xinjiang Natural Science Foundation (No. 2023D01A09, 2022D01A348).

Data Availability Statement

The data presented in this study are available on request from the corresponding author.

Conflicts of Interest

The authors declare no conflicts of interest.

References

  1. Hall, L.S.; Krausman, P.R.; Morrison, M.L. The habitat concept and a plea for standard terminology. Wildl. Soc. Bull. 1997, 25, 173–182. [Google Scholar]
  2. He, Y.; Mo, Y.; Ma, J. Spatio-Temporal Evolution and Influence Mechanism of Habitat Quality in Guilin City, China. Int. J. Environ. Res. Public Health 2023, 20, 748. [Google Scholar] [CrossRef] [PubMed]
  3. Newbold, T.; Hudson, L.N.; Hill, S.L.L.; Contu, S.; Lysenko, I.; Senior, R.A.; Börger, L.; Bennett, D.J.; Choimes, A.; Collen, B.; et al. Global effects of land use on local terrestrial biodiversity. Nature 2015, 520, 45–50. [Google Scholar] [CrossRef] [PubMed]
  4. Rao, Y.X.; Zhou, M.; Ou, G.; Dai, D.; Zhang, L.; Zhang, Z.; Nie, X.; Yang, C. Integrating ecosystem services value for sustainable land-use management in semi-arid region. J. Clean. Prod. 2018, 186, 662–672. [Google Scholar] [CrossRef]
  5. Otto, C.R.; Roth, C.L.; Carlson, B.L.; Smart, M.D. Land-use change reduces habitat suitability for supporting managed honeybee colonies in the Northern Great Plains. Proc. Natl. Acad. Sci. USA 2016, 113, 10430–10435. [Google Scholar] [CrossRef] [PubMed]
  6. Terrado, M.; Sabater, S.; Chaplinkramer, B.; Mandle, L.; Ziv, G.; Acuña, V. Model development for the assessment of terrestrial and aquatic habitat quality in conservation planning. Sci. Total Environ. 2016, 540, 63–70. [Google Scholar] [CrossRef] [PubMed]
  7. Dessel, W.V.; Rompaey, A.V.; Szilassi, P. Sensitivity analysis of logistic regression parameterization for land use and land cover probability estimation. Int. J. Geogr. Inf. Sci. 2011, 25, 489–508. [Google Scholar] [CrossRef]
  8. Verburg, P.H.; Soepboer, W.; Veldkamp, A.; Limpiada, R.; Espaldon, V.; Mastura, S.S.A. Modeling the spatial dynamics of regional land use: The CLUES model. Environ. Manag. 2002, 30, 391–405. [Google Scholar] [CrossRef] [PubMed]
  9. Liu, X.; Liang, X.; Li, X.; Xu, X.; Ou, J.; Chen, Y.; Li, S.; Wang, S.; Pei, F. A future land-use simulation model (FLUS) for simulating multiple land-use scenarios by coupling human and natural effects. Landsc. Urban Plan. 2017, 168, 94–116. [Google Scholar] [CrossRef]
  10. Xia, M.; Zhang, Y.; Zhang, Z.; Liu, J.; Ou, W.; Zou, W. Modeling agricultural land-use change in a rapidly urbanizing town: Linking the decisions of government, peasant households and enterprises. Land Use Policy 2020, 90, 104266. [Google Scholar] [CrossRef]
  11. Li, C.; Wu, Y.; Gao, B.; Zheng, K.; Wu, Y.; Li, C. Multi-scenario simulation of ecosystem service value for optimization of land use in the Sichuan- Yunnan ecological barrier, China. Ecol. Indic. 2021, 132, 108328. [Google Scholar] [CrossRef]
  12. Mutale, B.; Qiang, F. Modeling future land use and land cover under different scenarios using patch-generating land use simulation model. A case study of Ndola district. Front. Environ. Sci. 2024, 12, 1362666. [Google Scholar] [CrossRef]
  13. Li, X.; Liu, Z.; Li, S.; Li, Y. Multi-Scenario Simulation Analysis of Land Use Impacts on Habitat Quality in Tianjin Based on the PLUS Model Coupled with the InVEST Model. Sustainability 2022, 14, 6923. [Google Scholar] [CrossRef]
  14. Xu, L.F.; Liu, X.; Tong, D.; Liu, Z.; Yin, L.; Zheng, W. Forecasting Urban Land Use Change Based on Cellular Automata and the PLUS Model. Land 2022, 11, 652. [Google Scholar] [CrossRef]
  15. Wang, J.; Wu, Y.; Gou, A. Habitat quality evolution characteristics and multi-scenario prediction in Shenzhen based on PLUS and InVEST models. Front. Environ. Sci. 2023, 11, 46347. [Google Scholar] [CrossRef]
  16. Sherrouse, B.C.; Clement, J.M.; Semmens, D.J. A CIS application for assessing, mapping, and quantifying the social values of ecosystem services. Appl. Geogr. 2011, 31, 748–760. [Google Scholar] [CrossRef]
  17. Villa, F.; Ceroni, M.; Bagstad, K.; Johnson, G.; Krivov, S. ARIES (ARtificial Intelligence for Ecosystem Services): A New Tool for Ecosystem Services Assessment, Planning, and Valuation. In Proceedings of the 11th Annual BIOECON Conference on Economic Instruments to Enhance the Conservation and Sustainable Use of Biodiversity, Venice, Italy, 21 September 2009. [Google Scholar]
  18. Tang, F.; Fu, M.C.; Wang, L.; Zhang, P. Land-use change in Changli County, China: Predicting its spatio-temporal evolution in habitat quality. Ecol. Indic. 2020, 117, 106719. [Google Scholar] [CrossRef]
  19. Meng, R.; Cai, J.; Xin, H.; Meng, Z.; Dang, X.; Han, Y. Spatio-Temporal Changes in Land Use and Habitat Quality of the Hobq Desert along the Yellow River Section. Int. J. Environ. Res. Public Health 2023, 20, 3599. [Google Scholar] [CrossRef] [PubMed]
  20. Louis, V.; Page, S.E.; Tansey, K.J.; Jones, L.; Bika, K.; Balzter, H. Tiger Habitat Quality Modelling in Malaysia with Sentinel-2 and InVEST. Remote Sens. 2024, 16, 284. [Google Scholar] [CrossRef]
  21. Zhai, Y.X.; Zhang, F.Y.; Ma, L.N. Evolution and prediction of habitat quality in the Bosten Lake Basin based on production-living ecological space. Arid Land Geogr. 2023, 46, 1792–1802. [Google Scholar]
  22. Yang, J.; Huang, X. The 30 m annual land cover dataset and its dynamics in China from 1990 to 2019. Earth Syst. Sci. Data 2021, 13, 3907–3925. [Google Scholar] [CrossRef]
  23. Guo, H.J.; Cai, Y.P.; Li, B.W.; Tang, Y.; Qi, Z.; Huang, Y.; Yang, Z. An integrated modeling approach for ecological risks assessment under multiple scenarios in Guangzhou, China. Ecol. Indic. 2022, 142, 109270. [Google Scholar] [CrossRef]
  24. Liang, X.; Guan, Q.; Clarke, K.C.; Liu, S.; Wang, B.; Yao, Y. Understanding the drivers of sustainable land expansion using a patch-generating land use simulation (PLUS) model: A case study in Wuhan, China. Comput. Environ. Urban Syst. 2021, 85, 101569. [Google Scholar] [CrossRef]
  25. Zhang, D.C.; Liu, X.P.; Yao, Y.; Zhang, J.B. Simulating Spatiotemporal Change of Multiple Land Use Types in Dongguan by Using Random Forest Based on Cellular Automata. Geogr. Geo-Inf. Sci. 2016, 32, 29–36. [Google Scholar]
  26. Wang, A.; Zhang, M.; Kafy, A.A.; Tong, B.; Hao, D.; Feng, Y. Predicting the impacts of urban land change on LST and carbon storage using InVEST, CA-ANN and WOA-LSTM models in Guangzhou, China. Earth Sci. Inform. 2022, 16, 437–454. [Google Scholar] [CrossRef]
  27. Wei, Q.; Abudureheman, M.; Halike, A.; Yao, K.; Yao, L.; Tang, H.; Tuheti, B. Temporal and spatial variation analysis of habitat quality on the PLUS-InVEST model for Ebinur Lake Basin, China. Ecol. Indic. 2022, 145, 109632. [Google Scholar] [CrossRef]
  28. Wang, B.; Cheng, W. Effects of Land Use/Cover on Regional Habitat Quality under Different Geomorphic Types Based on InVEST Model. Remote Sens. 2022, 14, 1279. [Google Scholar] [CrossRef]
  29. Zhang, H.T.; Li, J.L.; Tian, P.; Wang, Z.Y.; Shen, X. Spatio-temporal evolution of habitat quality in the East China Sea continental coastal zone based on land use changes. Acta Ecol. Sin. 2023, 43, 1–11. [Google Scholar]
  30. Chen, H.; Zhao, Y.; Fu, X.; Wu, G. Characteristics of Spatio-temporal evolution and influence mechanism of habitat quality in the upper reaches of the West Liaohe River. Acta Ecol. Sin. 2023, 43, 1–14. [Google Scholar]
  31. Ji, Y.F.; Jia, L.J.; Yang, L.A.; Li, Y.L.; Dong, Q.H. Spatio-temporal evolution and prediction analysis of habitat quality in Yulin city coupled with InVEST-PLUS model. J. Soil Water Conserv. 2023, 37, 123–132. [Google Scholar]
  32. Sharp, R.; Tallis, H.T.; Ricketts, T.; Guerry, A.D.; Wood, S.A.; Chaplin-Kramer, R.; Nelson, E.; Ennaanay, D.; Wolny, S.; Olwero, N.; et al. InVEST 3.2.0 User’s Guide. In The Natural Capital Project; Stanford University: Stanford, CA, USA; University of Minnesota: Minneapolis-Saint Paul, MN, USA; The Nature Conservancy: Arlington, VA, USA; World Wildlife Fund: Gland, Switzerland, 2017. [Google Scholar]
  33. Deng, C.X.; Guo, F.Y.; Huang, D.L.; Li, Z. Research on the impact of land use and landscape pattern on habitat quality in Dongting Lake area based on InVEST model. Ecol. Sci. 2021, 40, 99–109. [Google Scholar]
  34. Teng, Y.; Xie, M.; Wang, H.; Chen, Y.; Li, F. Land use transition in resource-based cities and its impact on habitat quality, a case of Wuhai City. Acta Ecol. Sin. 2022, 42, 1–11. [Google Scholar]
  35. Zhao, Q.J.; Wu, X.Z. Research on the impact of land use change on habitat quality in Minjiang River Basin based on InVEST Model. Ecol. Sci. 2022, 41, 1–10. [Google Scholar]
  36. Wang, J.; Xu, C. Geodetector: Principle and prospective. Acta Geogr. Sin. 2017, 72, 116–134. [Google Scholar]
  37. Santos-Martin, F.; Zorrilla-Miras, P.; Palomo, I.; Montes, C.; Benayas, J.; Maes, J. Protecting nature is necessary but not sufficient for conserving ecosystem services: A comprehensive assessment along a gradient of land-use intensity in Spain. Ecosyst. Serv. 2019, 35, 43–51. [Google Scholar] [CrossRef]
  38. Zhang, F.; Yusufujiang, R.; Aierken, T. Spatio-temporal change of ecosystem service value in Bosten Lake Watershed based on land use. Acta Ecol. Sin. 2021, 41, 5254–5265. [Google Scholar]
  39. Wang, X.Q.; Lin, M.I.; Ding, Z.; Zhou, J.; Wang, C.; Chen, J. Ecological health assessment of Kaikong River Basin based on automatic screening of indicators in Xinjiang. Acta Ecol. Sin. 2020, 40, 4302–4315. [Google Scholar]
  40. Li, Y.; Chen, Y.; Zhang, Q.; Fang, G. Analysis of the change in water level and its influencing factors on Bosten Lake from 1960 to 2018. Arid Zone Res. 2021, 38, 48–58. [Google Scholar]
  41. Li, M.; Yu, X.L. Research on Evaluation and Development of Wetland Ecotourism Resources in Bazhou, Xinjiang. Ind. Sci. Trib. 2020, 19, 20–23. [Google Scholar]
  42. Wu, D.; Zhu, K.; Zhang, S.; Huang, C.Q.; Li, J. Evolution Analysis of Carbon Storage in Chengdu–Chongqing Economic Zone Based on PLUS Model and InVEST Model. Ecol. Environ. Monit. Three Gorges 2022, 7, 1–18. [Google Scholar]
  43. Wang, Z.Y.; Huang, C.L.; Li, L.; Lin, Q. Ecological zoning planning and dynamic evaluation coupled with Invest-HFI-Plus model: A case study in Bortala Mongolian Autonomous Prefecture. Acta Ecol. Sin. 2022, 42, 5789–5798. [Google Scholar]
  44. Gulimire, A.; Paruke, W.; Ayituerxun, S. Change of Regional Ecosystem Service Value of Land Use/Cover Change in Kaikong River Basin. Acta Agric. Jiangxi 2020, 32, 118–124. [Google Scholar]
  45. Du, F. Ecological environment evaluation and land use change simulation in Bosten Lake Basin. Ph.D. Thesis, Xinjiang University, Ürümqi, China, 2022. [Google Scholar]
  46. Gao, Z.B.; Wang, X.R.; Sui, X.Y.; Wang, X.; Fan, Y.T.; Zhu, Q.; Lü, L.G. Multi-scenario prediction of habitat quality in Nanjing based on FLUS and INVEST modes. J. Agric. Resour. Environ. 2022, 39, 1001–1013. [Google Scholar]
Figure 1. Overview map of the study area. Note: Drawing No. GS (2022) 1873.
Sustainability 16 04202 g001
Figure 3. Distribution of land use in the Bosten Lake Basin, 2000–2022.
Sustainability 16 04202 g003
Figure 4. Land-use transfer chord map.
Sustainability 16 04202 g004
Figure 5. Distribution of land use in the Bosten Lake Basin in 2030 under different scenarios (a) 2020, (b) natural development scenario, (c) ecological protection scenario (d) economic development scenario.
Sustainability 16 04202 g005
Figure 6. Land use transfer matrix chord map for Bosten Lake Basin in 2020–2030 under different scenarios.
Sustainability 16 04202 g006
Figure 7. Spatial distribution of habitat quality in the Bosten Lake Basin, 2000–2022.
Sustainability 16 04202 g007
Figure 8. Trends in the area of different classes of habitat quality in the Bosten Lake Basin, 2000–2022.
Sustainability 16 04202 g008
Figure 9. Spatial distribution of habitat quality in the Bosten Lake Basin in 2030 under different scenarios: (a) 2020, (b) natural development scenario, (c) ecological protection scenario, (d) economic development scenario.
Sustainability 16 04202 g009
Figure 10. Trends in the area of different classes of habitat quality by scenario in 2030.
Sustainability 16 04202 g010
Figure 11. Contribution rate of each impact factors of habitat quality.
Sustainability 16 04202 g011
Figure 12. Geographic detector interactive detector results.
Sustainability 16 04202 g012
Figure 13. Spatial distribution of habitat quality degradation, 2000–2022.
Sustainability 16 04202 g013
Figure 14. Spatial distribution of habitat quality degradation in Bosten Lake Basin under different scenarios in 2030: (a) natural development scenario, (b) ecological protection scenario, (c) economic development scenario.
Sustainability 16 04202 g014
Table 1. Maximum influence distance and weight of duress factors.
Threat TypesMax_Dist/kmWeightSpatial Decay Type
Cropland30.7linear
Barren10.1linear
Impervious61exponential
Table 2. Sensitivity to stressors and habitat suitability of each land use type.
Land Use and Land CoverHabitat QualityCroplandImperviousBarren
Cropland0.30.40.60.1
Forest10.50.60
Shrub0.910.80.5
Grassland0.70.60.60.7
Waters0.70.20.30.4
Snow/Ice0.100.10.2
Barren0.20.10.40.2
Impervious0000
Wetland0.80.20.60.7
Table 3. Land Use Transfer Matrix of Bosten Lake Basin in 2000–2022.
CroplandForestShrubGrasslandWatersSnow/IceBarrenImperviousWetlandTotal (2000)Transfer Out
Cropland3534.344.63-387.7813.74-19.9964.424.244029.15494.81
Forest98.84449.17-24.675.15-0.035.190.86583.92134.75
Shrub--0.01------0.010.01
Grassland1521.97216.641.1029,319.3619.5068.991678.35175.95112.0733,113.923794.57
Waters69.193.62-40.681064.771.0126.8316.850.601223.56158.80
Snow/Ice-0.09-64.6010.64927.94481.11-0.011484.40556.46
Barren1125.210.230.012241.1914.49209.8860,148.08119.250.0263,858.353710.27
Impervious1.89--1.590.19-0.5945.93-50.194.27
Wetland21.203.69-114.221.510.010.04-208.64349.30140.66
Total (2022)6372.65678.061.1232,194.101129.991207.8362,355.03427.59326.45104,692.81
Transfer in2838.30228.901.122874.7465.22279.902206.95381.66117.81
Disclaimer/Publisher’s Note: The statements, opinions and data contained in all publications are solely those of the individual author(s) and contributor(s) and not of MDPI and/or the editor(s). MDPI and/or the editor(s) disclaim responsibility for any injury to people or property resulting from any ideas, methods, instructions or products referred to in the content.

