Article

How Credible Is the 25-Year Photovoltaic (PV) Performance Warranty?—A Techno-Financial Evaluation and Implications for the Sustainable Development of the PV Industry

by
Pao-Hsiang Hsi
* and
Joseph C. P. Shieh
Graduate Institute of Finance, National Taiwan University of Science and Technology, Taipei 10607, Taiwan
*
Author to whom correspondence should be addressed.
Sustainability 2024, 16(9), 3880; https://doi.org/10.3390/su16093880
Submission received: 3 April 2024 / Revised: 3 May 2024 / Accepted: 3 May 2024 / Published: 6 May 2024
(This article belongs to the Special Issue Solar Energy Utilization and Sustainable Development)

Abstract

:
To support the bankability of PV projects, PV manufacturers have been offering one of the longest warranties in the world, typically in the range of 25–30 years. During the warranty period, PV manufacturers guarantee that the degradation of PV modules will not exceed 0.4–0.6% each year, or the buyer can at any time make a claim to the manufacturer for replacement or compensation for the shortfall. Due to its popularity, the performance warranty terms have become more and more competitive each year. However, long-term PV operating data have been very limited and bankruptcy of PV manufacturers has been quite common. Without a proper methodology to assess the adequacy of PV manufacturer’s warranty fund (WF) reserve, the 25-year performance warranty can become empty promises. To ensure sustainable development of the PV industry, this study develops a probability-weighted expected value method to determine the necessary WF reserve based on benchmark field degradation data and prevailing degradation cap of 0.55% per year. The simulation result shows that, unless the manufacturer’s degradation pattern is significantly better than the benchmark degradation profile, 1.302% of the sales value is required for the WF reserve. To the best of our knowledge, this is the first study that provides WF reserve requirement estimation for 25-year PV performance warranty. The result will provide transparency for PV investors and motivation for PV manufacturers for continuous quality improvement as all such achievement can now be reflected in manufacturers’ annual report result.

1. Introduction

Global photovoltaic (PV) installation has been growing rapidly in recent years. Of the 1.6 terawatt solar panels installed worldwide since 2000, more than 60% were installed in the last 4 years [1,2]. Meanwhile, in pursuit of higher efficiency and lower cost, PV technology has been undergoing constant changes. The industry-wide move from polycrystalline to monocrystalline in 2018 [3], aluminum back surface field (Al-BSF) to passivated emitter and rear contact cells (PERC) in 2019 [4], and the racing for ever-thinner wafers and glasses [5,6] are just a few examples. In many ways, the market is always pressure-testing PV manufacturers for their ability to produce more using newer and cheaper materials. This brings about uncertainties in the quality and long-term performance of the PV modules. The cell cracking issues as a result of thinner wafers [7] and the Boron-oxygen light induced degradation (LID) issue of early PERC modules are two manifestations of such uncertainties [6,8]. The wide range of reported degradation rates for grid-connected PV systems also confirms this concern [9,10,11,12,13,14,15]. Figure 1 summarizes the development of the PV market during the last 25 years [1,2,5,6,16].
Power output degradation is a natural phenomenon of PV modules. Once installed in the field, PV modules are subject to a variety of environmental stresses such as ultraviolet (UV) exposure, thermal cycling, moisture ingress, wind and snow loading, chemical corrosion, and electrical stress, etc. These stresses cause the power output of PV modules to decay over time. Table 1 summarizes the common PV module degradation and failure modes [17,18,19,20,21,22,23]. Regardless of the cause of degradation, the performance warranty guarantees that the sum of all degradation effects each year will not exceed the guaranteed cap.
Various studies have suggested that the median degradation of PV modules is between 0.5–0.7% per year [10,22,24,25,26,27,28,29,30] with the addition of light-induced degradation of approximately 1.1–1.5% in the first year when PV modules are first exposed to sunlight [17]. The same PV module can exhibit a very different degradation rate when installed in different climate zones [22,31]; and the variability in the degradation rate can increase with time [32,33].
The degradation of output has a direct impact on PV investment and the levelized cost of energy (LCOE) [23,34]. Compared to zero degradation, a linear annual degradation of 0.5% reduces total energy production over a 25-year period by 6.5% [35], while a degradation of 0.7% reduces total production by 9.1%. If a greater-than-expected degradation occurs in earlier years, the impact would be even greater.
To support PV bankability, most PV manufacturers provide 25–30 years long-term performance warranty. During the warranty period, the PV manufacturers guarantee that the degradation of PV module will not exceed 0.4–0.6% each year, or the buyer can at any time make a claim to the manufacturer for replacement or compensation for the shortfall. With this performance warranty, PV manufacturers provide an “insurance” to PV investors for unexpected degradation. This has become extremely popular with PV investors in recent years as investors face more uncertainties in the era when feed-in-tariff (FIT) is cancelled in most markets. Due to its popularity, some PV manufacturers began to compete on performance warranty by reducing the annual degradation cap, extending the guaranteed duration, or both. This forces other manufacturers to follow, and as a result, PV manufacturers just keep adding more and more exposure onto their balance sheets.
Table 2 summarizes the representative performance warranty term for monocrystalline solar panels offered by top 6 PV manufacturers of 2022 whose combined global market share is around 75% [36]. Three important observations can be made from Table 2: (a) The average guaranteed degradation cap has decreased from 0.7% per year in 2018 to 0.504% in 2023. (b) New technology such as N-type or bifacial modules often come with the most optimistic degradation cap (0.4–0.45% per year) and the longest warranty period (30 years). (c) Even for the same model type (e.g., Jinko Cheetah, JA Solar JAM60S20, JAM72D40), the guaranteed degradation cap can decrease over time. Considering the huge impact on PV investment should this 25-year performance warranty become empty promises, it is important to examine closely the techno-financial basis supporting this warranty.
On the technical side, while one may expect that each new “recipe” must have undergone extensive testing before being mass produced and guaranteed for 25–30 years, in reality, the only common industry practice is to send 12 modules for qualification test against IEC 61215 [37,38]. Being a one-time qualification test, IEC 61215 neither predicts service life nor provides any continuous, quantitative estimate of the performance risk.
On the financial side, Table 3 summarizes the warranty fund (WF) provisions of the top 6 PV manufacturers based on their financial reports which are publicly available as all of them are public-listed companies (Note: The WF is a fund set aside by manufacturers to pay future warranty claims). Again, three important observations can be made from Table 3: (a) The total WF ratio (estimated by total WF provision/ last 4-year combined revenue) ranges from 0% to 0.88%, with two companies below 0.4% and the rest between 0.6–0.88%. (b) While the revenue keeps growing at a double-digit rate, this is not the case for WF. In fact, in 2021 most of the top 6 PV manufacturers set aside much less WF provision when the industry-wide profit ratio is poor (see Figure 2). In the absence of a market standard, the WF appears to have become an earning management tool [39]. (c) Half of the top 6 PV manufacturers have a debt-to-equity ratio greater than 2. In case of warranty event, these highly leveraged companies can experience financial stress testing.
In 2022, the International Energy Agency (IEA) indicated in its special report that “one-third of global PV manufacturing capacity is at medium or high risk of bankruptcy and this could slow the pace of clean energy transitions” [40]. Although PV price was the key bankruptcy risk driver in the IEA report, the tremendous growth of warranty exposure during the last 2 years can further increase PV manufacturers’ bankruptcy risk.
Estimating the WF necessary for the 25-year performance warranty presents a unique challenge for PV manufacturers. The traditional WF estimation method is mostly based on a same “failure definition” that remains unchanged throughout the warranty period. The “failure rate” during the warranty period is also often assumed to be constant due to the so-called “bathtub curve” theory [41]. However, for the 25-year PV performance warranty, neither the “failure definition (each year’s warranty trigger)” nor the “failure rate (each year’s degradation rate)” is constant. The problem is further complicated by the fact that the degradation rate needs to be estimated based on a fleet of PV modules that is mostly younger than 5 years with many different recipes and application environment.
Several studies have investigated the risk of performance warranty of PV manufacturers in recent years. In [38], the authors estimated the probability that the performance warranty is triggered during its 25-year warranty period, given an annual degradation rate distribution and assuming 3 different types of degradation mode during the 25-year period. While the authors have incorporated different warranty trigger level throughout the 25-year period, they focus on estimating the “failure rate (probability of warranty claim)” and did not produce a monetary estimate of the WF. It also used predefined degradation modes over the 25-year period, which can be restrictive, particularly if we need to update the WF estimate each year based on actual degradation rate as required by international accounting principle [42]. In [32], the authors have similarly estimated the “failure rate (probability of warranty claim)” and assume that the degradation rate is normally distributed. Again, the study did not produce a monetary estimate of the WF and the probability of warranty claim is underestimated, as the authors did not consider the existence of the annual degradation cap.
Other studies on PV reliability have focused mainly on the study of PV module failure modes and degradation rates [10,24,25,26,27,28,29,30,31], the development of testing methodology [22,43,44] and investment risk management [45,46,47,48]. To our knowledge, none of the literature to date has proposed a method to assess the adequacy of WF of PV manufacturers. This study aims to fill this gap by developing a probability-weighted expected value method to determine the necessary WF for PV manufacturers based on benchmark field degradation data.
The contributions of this paper are the following:
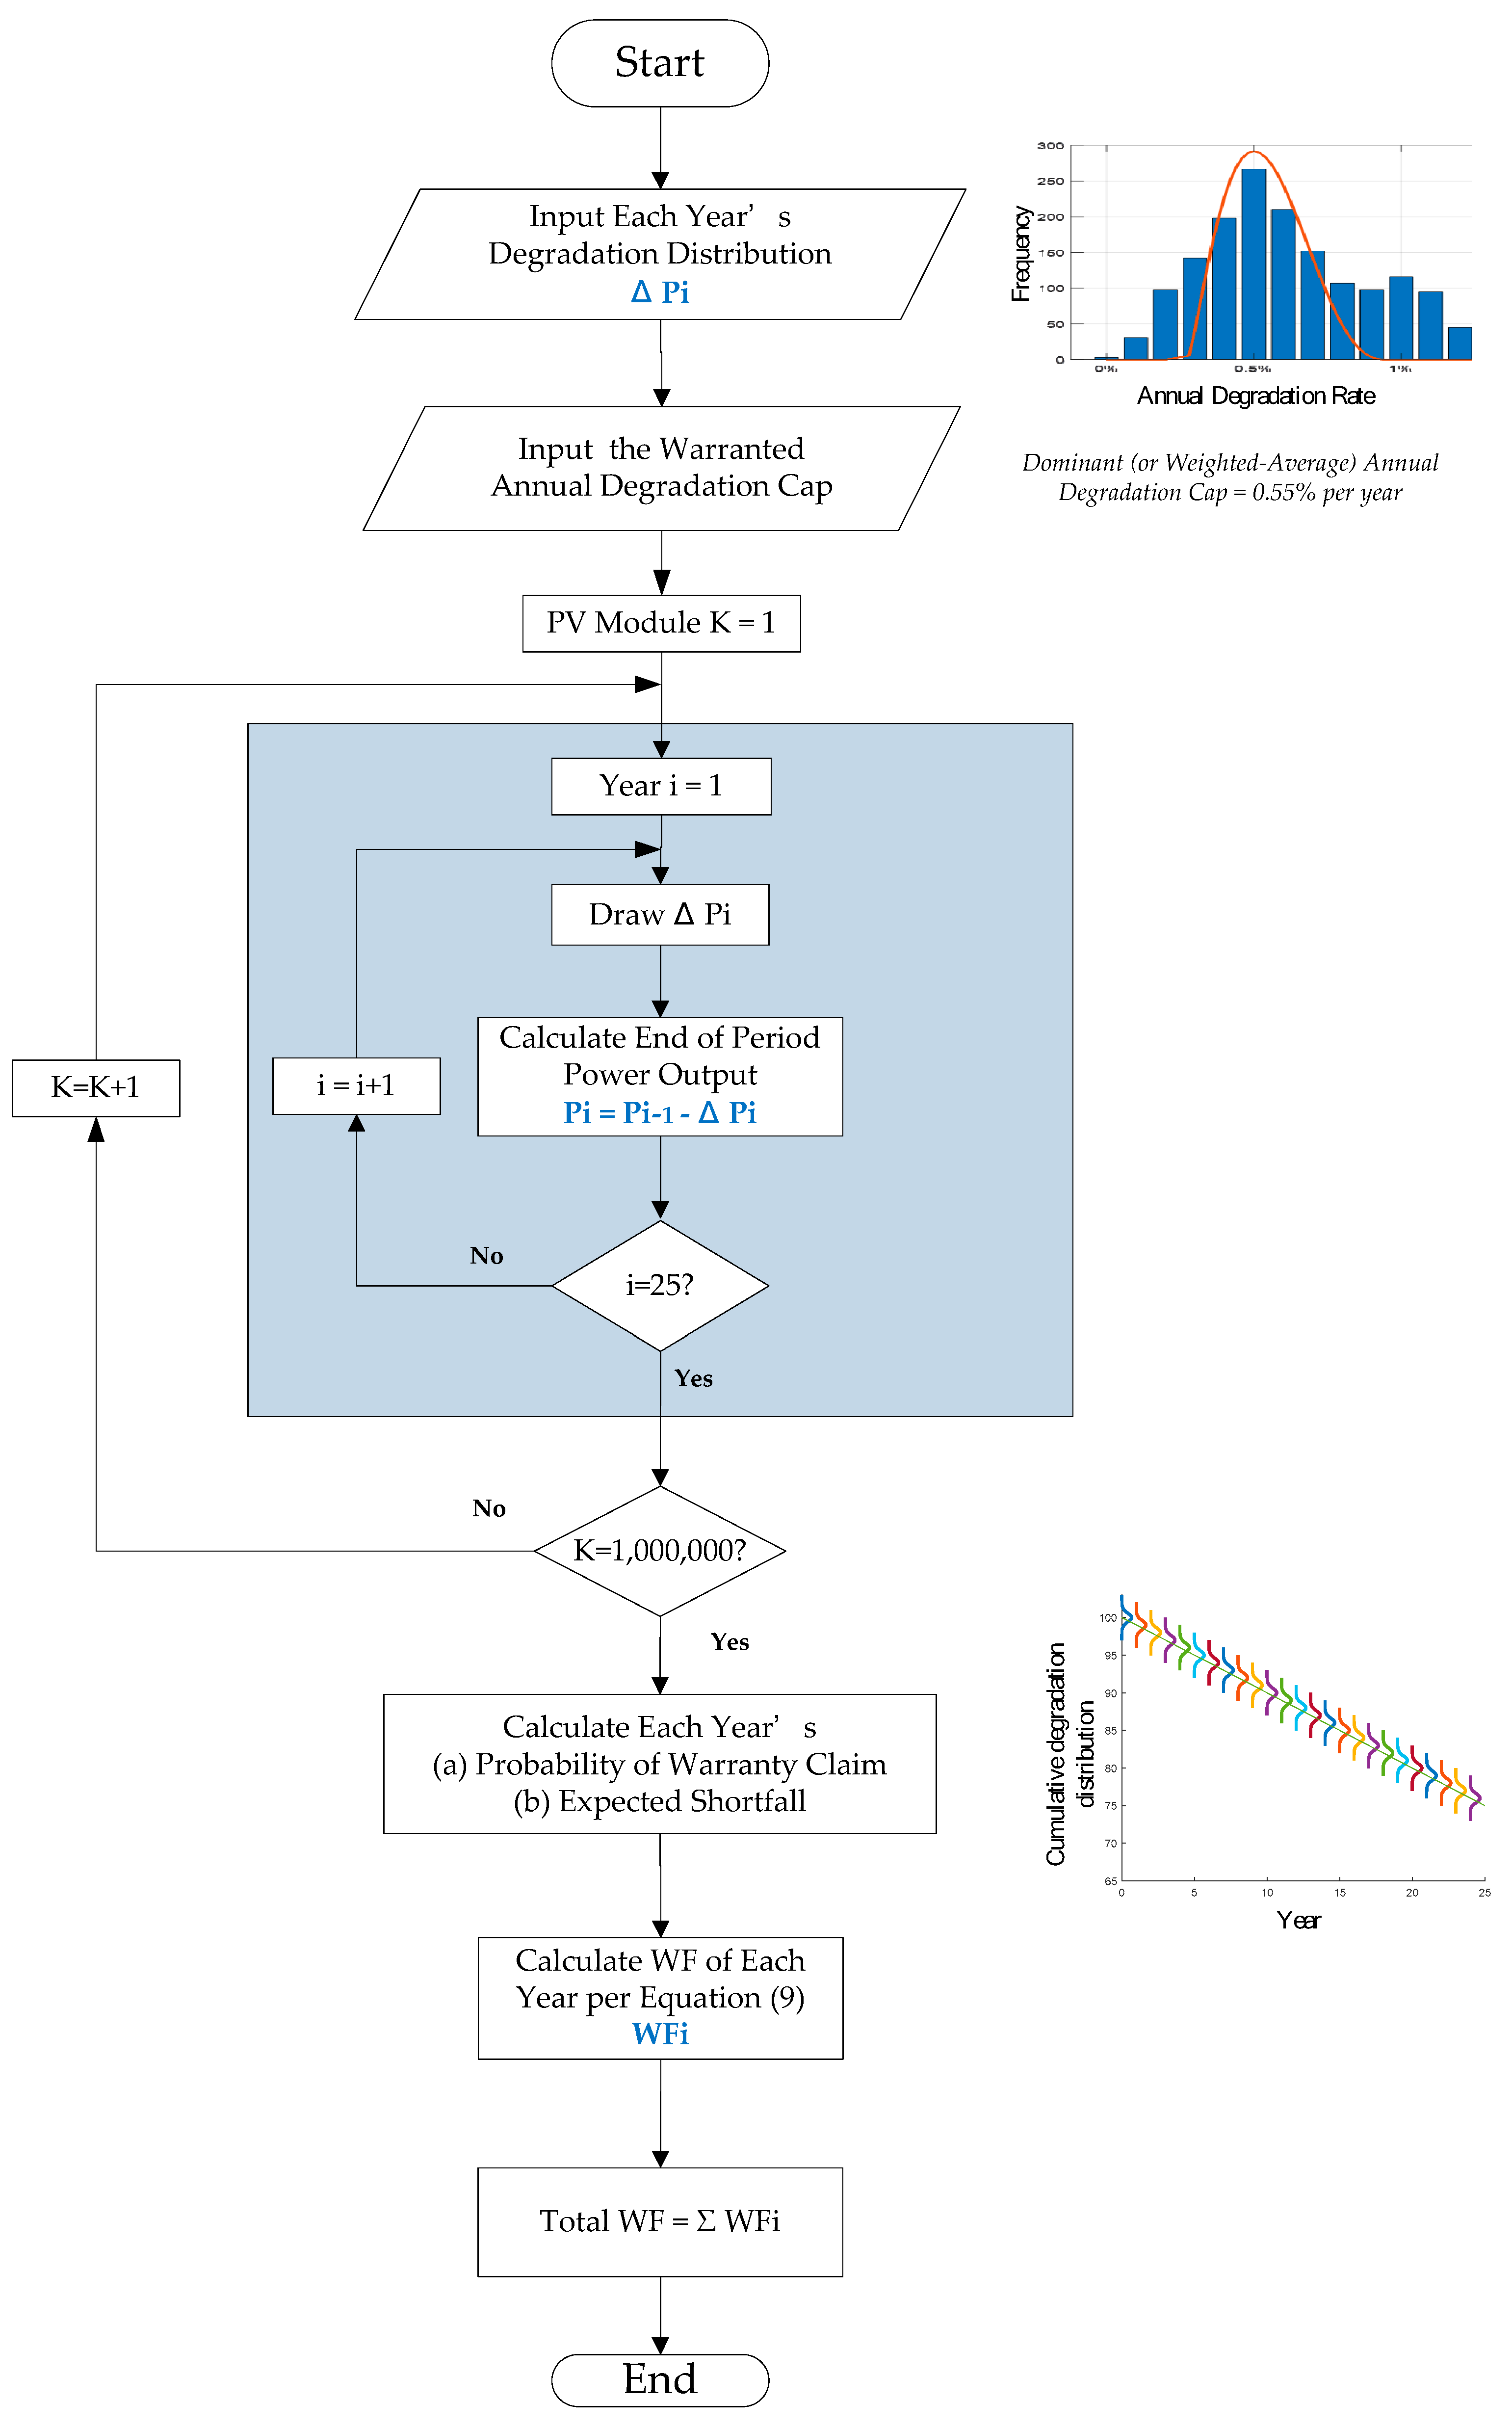
  • Develop a new method using Monte Carlo simulation and expected shortfall (ES) to estimate, in monetary terms, the necessary WF for 25-year PV performance warranty considering annual degradation cap.
  • Adopt the benchmark degradation profile as the basis for WF estimation to avoid selection bias and also to provide stability for the estimation over time, given the portfolio nature of the benchmark degradation profile.
  • The methodology proposed is in line with international accounting principles and therefore provides a transparent and fair basis for comparison among the PV manufacturers.
  • Provide a visualization summary of the top 6 PV manufacturer’s warranty terms and their WF versus respective revenue and profit ratio based on extensive public domain data research.
  • Base-case and sensitivity analysis simulations to demonstrate the benchmark WF requirement and key drivers of the WF.
The rest of the paper is organized as follows. Section 2 covers the materials and methods of this study, starting with a review of the traditional WF estimation method, followed by a description of the unique challenges for estimating the WF for the 25-year PV performance warranty, and then the proposed methodology to tackle this problem. Section 3 provides various case simulations using the methodology developed in Section 2. The cases considered include: (a) base case using the benchmark degradation profile and 0.55% annual degradation cap, which is the mainstream degradation cap at the time of this writing. (b) Sensitivity analysis of the base case considering variations in the degradation profile parameters and the degradation cap. Section 4 provides discussions on the results in broader context. Section 5 offers the concluding remark of this study.

2. Materials and Methods

2.1. Review of The Traditional WF Estimation Method

For traditional product defects warranty, the WF is most commonly estimated using Equation (1) [49]:
W F = 0 w 1 t w f t d t = F w 1 w E ( t )
where:
  • WF = warranty fund
  • w = warranty period
  • t = failure time
  • f(t) = probability distribution function of failure time
  • F(t) = cumulative distribution function of failure time
  • E(t) = expected value of the failure time
Equation (1) is based on the so-called linear pro-rata warranty (PRW) policy [49] where the manufacturer will refund a fraction of the purchase price proportional to the remaining portion of the warranty period, that is, (1 − t/w). This amount is then weighted by the probability of claim at time t. The total warranty cost can then be derived by integrating the above over the warranty period w.
The probability distribution function f(t) in Equation (1) can be any distribution, but it must be known to the manufacturer. Most manufacturers assume a constant failure rate during the warranty period based on the so-called “bathtub curve theory” [41]. This implies that f(x) is of exponential distribution as per Equation (2).
f t = λ e λ t ,   t 0
where the parameter λ can be estimated using the reciprocal of the product’s mean-time-to-failure (MTTF) and the constant failure rate is as per Equation (3).
h t = f ( t ) R ( t ) = f ( t ) 1 F ( t ) = λ e λ t 1 ( 1 e λ t ) = λ
where:
  • h(t) = failure rate
  • f(t) = probability distribution function of failure time
  • F(t) = cumulative distribution function of failure time
  • R(t) = survival function = 1 − F(t)
  • λ = distribution rate and 1/λ = MTTF
From the above it can be seen that the traditional WF estimation method is built upon the assumptions that (a) the “failure (defect) definition” is the same throughout the warranty period and (b) the failure rate is constant and can be estimated with the product’s MTTF which can be measured given a fixed failure definition.

2.2. Unique Aspects of PV Performance WF Estimation

The degradation rate of the PV modules is defined according to Equation (4)
D R = P n o m i n a l P a c t u a l P n o m i n a l 100 %
where:
  • DR = degradation rate
  • Pnominal = nominal or rated output of the PV module
  • Pactual = actual module output measured under standard testing condition (STC)
For 25-year PV performance warranty, PV manufacturers guarantee that PV module degradation will not exceed 0.4–0.6% each year, or the buyer can at any time make a claim to the manufacturer for replacement or compensation for the shortfall. As such, the definition of “failure” is different each year. Using 0.55% degradation cap as an example, the failure definition for year 1 is “degradation in excess of 0.55%”, for year 2 it is ”cumulative degradation in excess of 1.10%”, and so on.
The changing “failure definition” throughout the 25-year warranty period means that each year’s “failure distribution” will be different. Also, the “failure (degradation) rate” changes each year due to different environmental stresses.
To solve this problem, in this study, we use a two-step approach:
  • Each year’s degradation rates are considered independent random variables: Once a PV module is manufactured and installed in the field, environmental stress (weather) is the biggest influencing factor of each year’s degradation rate, assuming maintenance work is done in accordance with manufacturer recommendations. Since the weather is basically independent each year, the degradation rate each year can be considered as independent random variables. That is, if the degradation rate for years 1–3 are ΔP1, ΔP2, ΔP3, respectively, then ΔP1, ΔP2, ΔP3 are considered as independent random variables in this study. The cumulative degradation of each year is the sum of the current and all prior-year degradations. For example, the cumulative degradation for year 2 is ΔP1 + ΔP2, and for year 3 it is ΔP1 + ΔP2 + ΔP3.
  • The values of each year’s degradation rate are sampled from the benchmark degradation distribution that is representative of a portfolio of technologies: As each manufacturer has many products which continue evolving, the degradation rate should be sampled from a common benchmark degradation distribution that is representative of a portfolio of technologies. Unless the manufacturer can demonstrate that its degradation pattern is significantly better than the benchmark profile, the common benchmark degradation distribution should be used as the basis of the WF estimation. This will avoid selection bias and ensure stability of the WF estimate over time.

2.3. Benchmark Degradation Distribution

Figure 3 shows the benchmark degradation distribution used in this study, which is reported in [24]. This distribution is based on nearly 2000 cases published in the literature over the past 4 decades and the result is widely recognized in the PV industry. As can be seen, the distribution in Figure 3 is right-skewed with a median degradation rate of 0.5% per year and with a range of around 4%.
To ensure that the advances in technology and manufacturing are taken into account, we consider the latest study by the same author in 2022 on 7.2 GW of utility scale PV fleet reported in [9], noting that at the system level, the annual degradation rate has a median of 0.95% per year. As this degradation rate includes also impacts from other components such as inverters, we consider that 0.95% per year would be a conservative upper bound estimate of the degradation rate. Also, in view that the distribution in Figure 3 has quite few observations below the 0.3% bracket, we use 0.275% as a conservative lower-bound estimate of the degradation rate. (Note: the choice of 0.275% instead of 0.3% is to make the spread between “median − minimum” equivalent to 50% of the spread between “maximum − median” to reflect the right-skewed nature of the distribution.)
The benchmark degradation distribution is then approximated using the PERT (or Beta-PERT) distribution as defined in Equation (5) [50]
f x = ( x x m i n ) α 1 1 ( x m a x x ) α 2 1 β ( α 1 , α 2 ) ( x m a x x m i n ) α 1 + α 2 1
where β is the beta function and
μ ( x m i n + 4 x m . l i k e l y + x m a x ) 6 α 1 6 μ x m i n x m a x x m i n α 2 6 x m a x μ x m a x x m i n
PERT is widely used in insurance risk analysis [50] and is defined by three parameters, i.e., Minimum, Most likely, and Maximum. Based on the above, in this study the values would be 0.275% (Minimum), 0.5% (Most likely), and 0.95% (Maximum). Using the PERT approximation will provide some flexibility than directly sampling from Figure 3 as the parameters can be verified and updated regularly based on actual field data. The parameters are also intuitive for experts to estimate in the absence of sufficient field data.

2.4. Probability of Warranty Claim and Expected Shortfall (ES)

To estimate 25-year PV performance WF, we need to estimate, for each year, both (a) the probability of warranty claim and (b) the expected claim amount given that a claim has occurred (also known as expected shortfall, ES).
For the probability of claim part, the 25-year PV performance warranty allows the buyer to make a claim to the manufacturer when PV module’s actual degradation exceeds the guaranteed degradation cap. Using the 0.55% degradation cap as an example, a buyer can make a warranty claim at each anniversary if PV modules’ actual output is less than the guaranteed amount as per Equation (6) [51].
P A c t u a l < P N o m i n a l ( 1 2 % + 0.55 % N 1 )
where N is the age of the PV module between 2–25. Equation (6) contains an extra LID degradation allowance for the first year (approximately 1.1–1.5% according to [17]). If we assume that this extra allowance is offset exactly by the LID, then Equation (6) can be simplified to Equation (7) for years 1–25.
P A c t u a l < P N o m i n a l ( 1 0.55 % N )
The probability of warranty claim can be derived based on the cumulative degradation distribution of each year and calculate the area for the portion of degradation that exceeds the threshold per Equation (7). For example, suppose for a particular year the guaranteed degradation cap is 0.55% and the actual degradation distribution for hundreds of PV panels is as per Figure 4, then the area of the shaded region in Figure 4 represents the probability of claim as these are the modules whose degradation exceeds 0.55%.
For the ES part, since the degradation rates of PV modules in the shaded area in Figure 4 range from 0.55% to 1.2%, each with a different probability of occurring, we need an estimate of the expected degradation rate, given that the degradation rate is greater than the cutoff threshold (i.e., 0.55% in the case above). This is a risk measure widely used in financial risk management called expected shortfall and is given by Equation (8) [52,53].
E S = E X C u t o f f
ES represents “the average level of degradation, given that the degradation exceeds the cut-off threshold”. For the purpose of illustration, suppose that in Figure 4 the area of the shaded region is 0.2266 and the ES estimated by Equation (8) is 0.67%, then the WF requirement of the year can be estimated using Equation (9):
W F = 0.2266 × 0.67 % 0.55 % = 0.0272 %
where:
  • WF = warranty fund requirement
  • 0.2266 = probability that degradation exceeds the cutoff threshold
  • 0.67% = average level of degradation, given that the degradation exceeds the cutoff threshold
  • 0.55% = the cut-off threshold or the guaranteed degradation cap of that particular year
International Accounting Standard (IAS) 37, which is applicable to most public-listed companies, requires that “warranty provisions be measured at probability-weighted expected value and be updated annually to reflect the current best estimate” [42]. Given that in Equation (9) the expected warranty payment is weighted by the probability of warranty claim and the estimate can be updated by adjusting the parameters of the PERT distribution based on latest field data or results of accelerated testing [43], the method proposed above is in line with the requirement of IAS 37 and would provide an objective and transparent comparison basis among the PV manufacturers.

2.5. Monte Carlo Simulation

We can now estimate the 25-year WF using Monte Carlo simulation as shown in Figure 5. The procedure can be applied at the company-wide level (using the benchmark distribution profile and the weighted-average degradation cap) or to an individual product (using the individual product’s degradation profile and degradation cap). The product-level simulation can be used to help PV manufacturers evaluate the impact of new products or understand the key drivers affecting the WF. In this study, we will consider the company-wide level case as the WF is often reported on company level.
In Step 1 of Figure 5, we will use the benchmark distribution profile as input, as we are estimating the WF on company-wide level. In Step 2, the dominant degradation cap will be used (alternatively, the weighted average threshold can also be used where the weight is based on the sales volume). The simulation then starts with Module 1, drawing its Year 1 degradation from the benchmark distribution and calculate the end-of-year power output for later comparison with year 1’s degradation cap, then drawing the Year 2 degradation and so on until Year 25. The procedure is then repeated for Module 2 to Module 1,000,000 to derive the 25 cumulative degradation distribution.
With the 25 cumulative degradation distributions, the probability of claim and ES of each year can then be derived through the method in Figure 4 and Equation (8). The 25-year performance WF can be derived by adding up the 25 WF derived from Equation (9).

3. Results

3.1. Baseline Case

The first case we consider is the baseline case using the benchmark degradation profile and the 0.55% annual degradation cap (which is the dominant degradation cap at the time of this writing) to estimate the company-wide WF requirement. This will provide a benchmark WF for all PV manufacturers unless the PV manufacturer can demonstrate that its degradation profile is significantly better than the benchmark degradation profile.
Simulation of 1,000,000 iterations shows that the total WF required for the 25-year warranty period is 1.302%. In other words, the benchmark company-wide WF ratio is 1.302% of total revenue.
Figure 6 shows the WF payout pattern during the 25-year warranty period. As can be seen, the payout increases starting at year 2 and peaks at years 3–4, then reduces to a stable value after year 10. The payout pattern in Figure 6 can be used as a reference schedule for the release of WF over the 25-year period. When actual PV performance is better than expected, excess WF can be released and become available to the manufacturer for other use, creating a positive cycle. On the other hand, if the actual payout exceeds the value predicted in Figure 6, it provides an early indication that the degradation profile is worse than expected and the manufacturer should consider both finding the root cause of the development and upward adjustment of the WF.

3.2. Sensitivity Analysis

In this sub-section, we look at the impact of different median, minimum, and maximum degradation values on the company-wide WF. The impact will be reviewed individually with +/−10% changes from the baseline case, holding other parameters constant. The results are summarized in Table 4.
The following observations can be drawn from Table 4:
  • Changes in the median degradation value have the largest impact on WF: If the company-wide median degradation rate can be reduced by 10% (from 0.5% to 0.45%, holding other conditions constant, including the annual degradation cap), the company-wide WF can be significantly reduced from 1.302% to 0.412%. On the contrary, if the company-wide median degradation rate increases by 10% (from 0.5% to 0.55%), the required WF almost doubles and becomes 2.555%. The reduction in PV module median degradation value often represents an upgrade in PV technology or manufacturing technique. If such an upgrade only applies to a particular product line, the adjustment of median degradation value should only be made on a pro-rata basis. For example, if a company has cumulatively sold 100 GW of PV modules and only 15% of the modules represents new technology with a lower median degradation rate of 0.45%, then the appropriate median degradation rate to be applied for the simulation should be 85% * 0.5% + 15% * 0.45% = 0.4925%.
  • Changes in maximum degradation value have the 2nd largest impact on WF: If the company-wide maximum degradation rate decreases by 10% (from 0.95% to 0.855%), the company-wide WF can be reduced by half to 0.615%. On the other hand, an increase of the maximum degradation value by 10% would result in a 60% increase in WF. Unlike the changes in the median degradation rate, the changes in maximum degradation rate are an increase in the “spread” of degradation and are often a result of quality control issue or application environment issue. For example, if the products of a manufacturer are mostly sold to extremely hot and humid environments with freezing temperatures in the evening, the manufacturer should consider using a higher maximum degradation value for the simulation.
  • Changes in the minimum degradation value have the least impact on WF: For +/−10% changes in company-wide minimum degradation rate, the company-wide WF changes approximately +/−5.5%.
Based on the above, it can be seen that in order to keep the company-wide WF at 0.6–0.9% level (as 4 of the top 6 manufacturers do), the manufacturer must be able to have a degradation profile that is significantly better than the benchmark degradation profile. It should also be noted that the profit margin of most of the top 6 PV manufacturers are consistently below 5%, a 10% increase in either the median or maximum degradation value will wipe out the majority of most PV manufacturer’s profit. This demonstrates the importance of having a method to estimate the WF and the importance of setting quality control objective or warranty policy based on the result of the sensitivity analysis.

3.3. Reduction in the Degradation Allowance

We now look at the case where due to market competition the dominant guaranteed cap is further reduced from 0.55% to 0.525% per year. Holding other conditions constant (that is, using the benchmark degradation profile), the simulation result shows that this small reduction in guaranteed degradation cap will cause the WF to increase from 1.302% to 2.209%.
From Section 1 we note that the dominant (weighted-average) degradation cap will soon reduce to the 0.525% level as new technologies such as N-type or bifacial modules often come with most optimistic degradation cap (0.4–0.45% per annum) and PV module sale grew at exponential rate in recent years. In order to offset this impact, PV manufacturers must be able to reduce the company-wide median degradation value from 0.5% to 0.465%.

4. Discussion

The 25-year PV performance warranty plays an important role for the bankability of PV projects. Most PV investments are project financed with 70–80% debt which can only be repaid using the future cash flow generated by the PV asset. Given the continuous reduction of the global average auction price for solar energy (from USD 89.3/MWh in 2016 to USD 37.2/MWh in 2022) [54], the payback period for PV investment can now easily exceed 15 years [55]. Ensuring the certainty of long-term future cash flow of PV assets thus become a priority consideration for the banks to grant the loan. The 25-year PV performance warranty is one critical pillar for ensuring the certainty of PV assets future cash flow. As such, its credibility can have a huge impact on the overall financing cost and thus the sustainable development of the PV industry.
The WF reserve is the capital buffer that provides the first line of defense for PV manufacturers to honor their promises and absorb the loss due to warranty events. As Table 3 and Figure 2 indicate, most PV manufacturers have very low profit margins and many of them are also highly leveraged. This means that in case of warranty events it will be extremely challenging for the PV manufacturers to raise additional debt to pay the loss. As such, if the WF reserve is insufficient, a warranty event can quickly escalate to a wide-spread credit event affecting tens or even hundreds of GW of PV assets.
To estimate the necessary WF reserve, we need to estimate, for each year, both (a) the probability of warranty claim and (b) the expected claim amount given that a claim has occurred. To the best of our knowledge, no literature thus far has proposed a method to estimate the necessary WF for the 25-year PV performance warranty. Traditional warranty fund estimation methods cannot handle this situation because for 25-year PV warranty, both the “failure definition” and the “failure rate” are different for each of the 25 years. The latest research on this topic in 2023 [38] and 2020 [32] also fall short on this as they only estimate the probability of warranty claim without addressing the expected claim amount part of the question. As a result, it can be seen from Table 3 that there has been no consistency in WF reserve practice among the top 6 PV manufacturers. It can also be seen from Figure 2 that the WF reserve appears to have become an earning management tool for many of the PV manufacturers.
This study proposed a novel method to estimate the necessary WF reserve for 25-year PV performance warranty. For the estimation of “the probability of warranty claim”, this study assumes that the degradation rates of each year are independent random variables. This is consistent with the fact that, once PV modules are manufactured and installed in the field, environmental stress (weather) is the biggest influencing factor of each year’s degradation rates and the weather is basically independent each year. This also allows PV modules of different technologies and application environments to be evaluated on a portfolio basis as we do not assume any fixed degradation pattern such as those in the previous research [32,38]. For the estimation of “the expected claim amount given that a claim has occurred”, this study makes use of the “expected shortfall” method to come up with the measurement of the expected claim amount. This fills the research gap of previous studies and with this measurement the necessary WF reserve for 25-year PV performance warranty can be estimated by summing up the WF estimate of each year produced according to Equation (9).
In this study, the values of each year’s degradation rate are sampled from the benchmark degradation distribution that is widely recognized in the PV industry and representative of a portfolio of technologies and application environments. The benefits of using this benchmark degradation distribution are three-folds:
  • Avoid selection bias—Most PV manufacturers have many different products with different technologies. The same product model can be manufactured using different bill of materials (BOM) or different tool settings over time. The application environments for each sales contract can also be very different. Unless the manufacturer can demonstrate that its degradation pattern is significantly better than the benchmark profile, the benchmark degradation distribution should represent a best estimate of the actual degradation profile on a company-wide basis. This would avoid selection bias and also provide a common measurement basis for all PV manufacturers.
  • Ensure stability of the WF reserve estimate over time—The benchmark degradation profile was based on nearly 2000 cases published in the literature over the past 4 decades. In this study the advances in technology and manufacturing have also been taken into consideration by capping the maximum degradation based on latest field measurement data. WF reserve estimates based on the benchmark degradation profile will therefore be more stable over time.
  • Updateable based on latest field data—International Accounting Standard (IAS) 37 requires that the warranty fund provision “be measured at probability-weighted expected value and be updated annually to reflect the current best estimate”. If the latest field measurement data suggests or the manufacturers can demonstrate that the actual degradation profile has improved (or deteriorated), the benchmark degradation profile can be updated to reflect the current best estimate of the WF reserve. However, to ensure stability of the WF reserve, it is important that the key drivers behind the improvement (or deterioration) be clearly analyzed when updating the benchmark degradation profile. The key drivers should also preferably be confirmed by accelerated aging test such as those per IEC 63209 [56,57].
Compared with previous results, this study not only produces an estimate for the probability of a warranty claim but also the necessary WF reserve for PV manufacturers to honor the 25-year PV performance warranty. This will provide motivation for the manufacturers for continuous quality improvement as all achievement can be reflected in the annual report. The transparency thus provided will also enable investors to make better investment decisions thus supporting the sustainable development of the PV industry.

5. Conclusions

The 25-year PV performance warranty plays a key role for PV investment and bankability. To ensure that it does not become empty promises, the techno-financial basis supporting this long-term warranty need to be examined closely.
In this study, we develop a new method using Monte Carlo simulation and Expected Shortfall method to estimate the necessary WF for 25-year PV performance warranty considering annual degradation cap. The simulation result shows that, unless the PV manufacturer’s degradation profile is significantly better than the benchmark degradation profile, the necessary WF for the 25-year performance warranty is 1.302% of total revenue.
In this study, the degradation rates of each year are assumed to be independent random variables. This is consistent with the facts that once PV modules are manufactured and installed, environmental stress (the weather) is the biggest influencing factor of each year’s degradation rates and weather are basically independent each year. The values of each year’s degradation rate are then sampled from the benchmark degradation profile that is widely recognized in the PV industry and representative of a portfolio of technologies and application environments. This will avoid selection bias by the PV manufacturers and also ensures stability of the WF estimate over time.
Sensitivity analysis indicates that a 10% increase in the manufacturer’s company-wide median degradation value will almost double the WF requirement, while a 10% increase in the maximum degradation value will increase the WF estimate by 60%. If the degradation cap guaranteed by PV manufacturer is reduced from the prevailing 0.55% to 0.525% due to market competition, the impact must be offset by a corresponding reduction of the median degradation from 0.5% to 0.465%. Changes in median degradation are often due changes in technology or manufacturing technique, whereas changes in maximum degradation are often a result of quality control or the application environment.
As a risk management measure, PV manufacturers should continuously monitor both their field degradation data and the warranty payout pattern and compare them with the expected payout pattern such as Figure 6. If the actual payout exceeds the value predicted in Figure 6, it is an early indication that the degradation rate is worse than expected and the manufacturer should consider both finding the root cause of the development and an upward adjustment of the WF immediately rather than waiting until the accumulation of risk is too high to correct. Also, when considering adjusting the degradation distribution, it is important that the key drivers behind the improvement (or deterioration) be clearly analyzed and confirmed by accelerated aging test such as those per IEC 63209 so that a sound technical basis can be established for the adjustment. The adjustment and its basis should also be clearly documented to ensure transparency.
For PV investors, the methodology proposed in this study will provide a transparent basis to compare the sufficiency of the WF provisions among the PV manufacturers. This will ensure better quality of the PV investment decision and thus support the sustainable development of the PV industry and the global energy transition.

Author Contributions

Conceptualization, P.-H.H.; methodology, P.-H.H. and J.C.P.S.; software, P.-H.H.; validation, P.-H.H. and J.C.P.S.; formal analysis, P.-H.H.; investigation, P.-H.H.; resources, P.-H.H.; data curation, P.-H.H.; writing—original draft preparation, P.-H.H.; writing—review and editing, P.-H.H. and J.C.P.S.; visualization, P.-H.H.; supervision, J.C.P.S. All authors have read and agreed to the published version of the manuscript.

Funding

This research received no external funding.

Data Availability Statement

The data presented in this study are available on request from the corresponding author.

Conflicts of Interest

The authors declare no conflicts of interest.

References

  1. Masson, G.; de l’Epine, M.; Kaizuka, I.; Jäger-Waldau, A. Snapshot of Global PV Markets 2023; IEA: Paris, France, 2023. [Google Scholar]
  2. Weaver, J.F. New Solar Installations to Hit 413 GW This Year, Says BloombergNEF. Available online: https://www.pv-magazine.com/2023/11/29/new-solar-installations-to-hit-413-gw-this-year-says-bloombergnef/ (accessed on 25 March 2024).
  3. International Technology Roadmap for Photovoltaic (ITRPV), 10th ed.; Verband Deutscher Maschinen- und Anlagenbau: Frankfurt, Germany, 2019.
  4. International Technology Roadmap for Photovoltaic (ITRPV), 11th ed.; Verband Deutscher Maschinen- und Anlagenbau: Frankfurt, Germany, 2020.
  5. Fraunhofer Institute for Solar Energy Systems. ISE Photovoltaic Report; Fraunhofer Institute for Solar Energy Systems: Freiburg, Germany, 2023. [Google Scholar]
  6. Zuboy, J.; Springer, M.; Palmiotti, E.; Barnes, T.; Karas, J.; Smith, B.; Woodhouse, M. Technology Scouting Report: Reliability Implications of Recent PV Module Technology Trends; U.S. Department of Energy: Washington, DC, USA, 2022.
  7. Papargyri, L.; Theristis, M.; Kubicek, B.; Krametz, T.; Mayr, C.; Papanastasiou, P.; Georghiou, G.E. Modelling and Experimental Investigations of Microcracks in Crystalline Silicon Photovoltaics: A Review. Renew. Energy 2020, 145, 2387–2408. [Google Scholar] [CrossRef]
  8. Zuboy, J.; Springer, M.; Palmiotti, E.C.; Karas, J.; Barnes, T.M. Getting Ahead of the Curve: Assessment of New Photovoltaic Module Reliability Risks Associated With Projected Technological Changes. IEEE J. Photovolt. 2023, 14, 4–22. [Google Scholar] [CrossRef]
  9. Jordan, D.C.; Anderson, K.; Perry, K.; Muller, M.; Deceglie, M.; White, R.; Deline, C. Photovoltaic Fleet Degradation Insights. Prog. Photovolt. Res. Appl. 2022, 30, 1166–1175. [Google Scholar] [CrossRef]
  10. Bolinger, M.; Gorman, W.; Millstein, D. System-Level Performance and Degradation of 21 GWDC of Utility-Scale PV Plants in the United States. J. Renew. Sustain. Energy 2020, 12, 043501. [Google Scholar] [CrossRef]
  11. Jordan, D.C.; Marion, B.; Deline, C.; Barnes, T.; Bolinger, M. PV Field Reliability Status—Analysis of 100,000 Solar Systems. Prog. Photovolt. Res. Appl. 2020, 28, 739–754. [Google Scholar] [CrossRef]
  12. Atsu, D.; Seres, I.; Aghaei, M.; Farkas, I. Analysis of Long-Term Performance and Reliability of PV Modules under Tropical Climatic Conditions in Sub-Saharan. Renew. Energy 2020, 162, 285–295. [Google Scholar] [CrossRef]
  13. Da Fonseca, J.E.F.; de Oliveira, F.S.; Massen Prieb, C.W.; Krenzinger, A. Degradation Analysis of a Photovoltaic Generator after Operating for 15 Years in Southern Brazil. Sol. Energy 2020, 196, 196–206. [Google Scholar] [CrossRef]
  14. Lillo-Sánchez, L.; López-Lara, G.; Vera-Medina, J.; Pérez-Aparicio, E.; Lillo-Bravo, I. Degradation Analysis of Photovoltaic Modules after Operating for 22 Years. A Case Study with Comparisons. Sol. Energy 2021, 222, 84–94. [Google Scholar] [CrossRef]
  15. Dhimish, M. Performance Ratio and Degradation Rate Analysis of 10-Year Field Exposed Residential Photovoltaic Installations in the UK and Ireland. Clean Technol. Environ. Policy 2020, 2, 170–183. [Google Scholar] [CrossRef]
  16. Solar (Photovoltaic) Panel Prices. Available online: https://ourworldindata.org/grapher/solar-pv-prices (accessed on 18 March 2024).
  17. Fokuhl, E.; Philipp, D.; Mülhöfer, G.; Gebhardt, P. LID and LETID Evolution of PV Modules during Outdoor Operation and Indoor Tests. EPJ Photovolt. 2021, 12, 9. [Google Scholar] [CrossRef]
  18. Lindroos, J.; Savin, H. Review of Light-Induced Degradation in Crystalline Silicon Solar Cells. Sol. Energy Mater. Sol. Cells 2016, 147, 115–126. [Google Scholar] [CrossRef]
  19. Kontges, M.; Kurz, S.; Packard, C.; Jahn, U.; Berger, K.A.; Kato, K.; Friesen, T.; Liu, H.; Van Iseghem, M. Review of Failures of Photovoltaic Modules; IEA PVPS: Paris, France, 2014. [Google Scholar]
  20. Law, A.M.; Jones, L.O.; Walls, J.M. The Performance and Durability of Anti-Reflection Coatings for Solar Module Cover Glass—A Review. Sol. Energy 2023, 261, 85–95. [Google Scholar] [CrossRef]
  21. Bossens, M. Unveiling Potential-Induced Degradation (PID): Causes, Detection, and Effective Mitigation for PV Modules. Available online: https://www.sitemark.com/blog/unveiling-potential-induced-degradation-pid-causes-detection-and-effective-mitigation-for-pv-modules/ (accessed on 26 April 2024).
  22. Wohlgemuth, J.H. Photovoltaic Module Reliability; Wiley: Hoboken, NJ, USA, 2020; ISBN 9781119458999. [Google Scholar]
  23. TamizhMani, G.; Kuitche, J. Accelerated Lifetime Testing of Photovoltaic Modules; Solar America Board for Codes and Standards: Torrance, CA, USA, 2013. [Google Scholar]
  24. Jordan, D.C.; Kurtz, S.R. Photovoltaic Degradation Rates—An Analytical Review. Prog. Photovoltaics Res. Appl. 2013, 21, 12–29. [Google Scholar] [CrossRef]
  25. Jordan, D.C.; Kurtz, S.R.; VanSant, K.; Newmiller, J. Compendium of Photovoltaic Degradation Rates. Prog. Photovolt. Res. Appl. 2016, 24, 978–989. [Google Scholar] [CrossRef]
  26. Alimi, O.A.; Meyer, E.L.; Olayiwola, O.I. Solar Photovoltaic Modules’ Performance Reliability and Degradation Analysis—A Review. Energies 2022, 15, 5964. [Google Scholar] [CrossRef]
  27. Ishii, T.; Masuda, A. Annual Degradation Rates of Recent Crystalline Silicon Photovoltaic Modules. Prog. Photovoltaics Res. Appl. 2017, 25, 953–967. [Google Scholar] [CrossRef]
  28. Kim, J.; Rabelo, M.; Padi, S.P.; Yousuf, H.; Cho, E.-C.; Yi, J. A Review of the Degradation of Photovoltaic Modules for Life Expectancy. Energies 2021, 14, 4278. [Google Scholar] [CrossRef]
  29. Denz, J.; Hepp, J.; Buerhop, C.; Doll, B.; Hauch, J.; Brabec, C.J.; Peters, I.M. Defects and Performance of Si PV Modules in the Field—An Analysis. Energy Environ. Sci. 2022, 15, 2180–2199. [Google Scholar] [CrossRef]
  30. Lindig, S.; Ascencio-Vásquez, J.; Leloux, J.; Moser, D.; Reinders, A. Performance Analysis and Degradation of a Large Fleet of PV Systems. IEEE J. Photovolt. 2021, 11, 1312–1318. [Google Scholar] [CrossRef]
  31. Jordan, D.C.; Silverman, T.J.; Sekulic, B.; Kurtz, S.R. PV Degradation Curves: Non-linearities and Failure Modes. Prog. Photovolt. Res. Appl. 2017, 25, 583–591. [Google Scholar] [CrossRef]
  32. Prieto-Castrillo, F.; Núñez, N.; Vázquez, M. Warranty Assessment of Photovoltaic Modules Based on a Degradation Probabilistic Model. Prog. Photovolt. Res. Appl. 2020, 28, 1308–1321. [Google Scholar] [CrossRef]
  33. Vázquez, M.; Rey-Stolle, I. Photovoltaic Module Reliability Model Based on Field Degradation Studies. Prog. Photovolt. Res. Appl. 2008, 16, 419–433. [Google Scholar] [CrossRef]
  34. Darling, S.B.; You, F.; Veselka, T.; Velosa, A. Assumptions and the Levelized Cost of Energy for Photovoltaics. Energy Environ. Sci. 2011, 4, 3133–3139. [Google Scholar] [CrossRef]
  35. Kneifel, J.D.; Webb, D.; O’Rear, E.G. Energy and Economic Implications of Solar Photovoltaic Performance Degradation; National Institute of Standards and Technology: Gaithersburg, MD, USA, 2016.
  36. Santos, B. Top PV Module Manufacturers by Shipment Volume in 2022. Available online: https://www.pv-magazine.com/2023/04/13/top-pv-module-manufacturers-by-shipment-volume-in-2022/ (accessed on 21 April 2023).
  37. IEC 61215-1: 2021; Terrestrial Photovoltaic (PV) Modules—Design Qualification and Type Approval—Part. 1: Test. Requirements. IEC: Geneva, Switzerland, 2021.
  38. Karatas, E.; Gottschalg, R. Predicting Warranty Risk of PV Modules. IEEE J. Photovolt. 2023, 13, 945–950. [Google Scholar] [CrossRef]
  39. Cohen, D.; Darrough, M.N.; Huang, R.; Zach, T. Warranty Reserve: Contingent Liability, Information Signal, or Earnings Management Tool? Account. Rev. 2011, 86, 569–604. [Google Scholar] [CrossRef]
  40. International Energy Agency. Special Report on Solar PV Global Supply Chains; IEA: Paris, France, 2022. [Google Scholar]
  41. O’Connor, P.P.; Kleyner, A. Practical Reliability Engineering, 5th ed.; Wiley: Hoboken, NJ, USA, 2012; ISBN 9780470979815. [Google Scholar]
  42. IAS 37—Provisions, Contingent Liabilities and Contingent Assets. Available online: https://www.iasplus.com/en/standards/ias/ias37 (accessed on 22 April 2023).
  43. Kuitche, J.M. Statistical Approach to Solar Photovoltaic Module Lifetime Prediction. Ph.D. Thesis, Arizona State University, Tempe, AZ, USA, 2014. [Google Scholar]
  44. Kurtz, S.; Wohlgemuth, J.; Kempe, M.; Bosco, N.; Hacke, P.; Jordan, D.; Miller, D.C.; Silverman, T.J.; Phillips, N.; Earnest, T.; et al. Photovoltaic Module Qualification Plus Testing; NREL: Golden, CO, USA, 2013. [Google Scholar]
  45. Solar Bankability Consortium. Technical Bankability Guidelines: Recommendations to Enhance Technical Quality of Existing and New PV Investments; Solar Bankability EU: Andalucía, Spain, 2017. [Google Scholar]
  46. Sauer, T.C. Solar Investment Risk Mitigation—Are We All on the Same Page? EPJ Photovolt. 2019, 10, 7. [Google Scholar] [CrossRef]
  47. Moser, D.; Lindig, S.; Richter, M.; Ascencio-Vásquez, J.; Horvath, I.; Müller, B.; Green, M.; Vedde, J.; Herz, M.; Herteleer, B.; et al. Bengt Stridh Uncertainties in Yield Assessments and PV LCOE 2020. Available online: https://iea-pvps.org/key-topics/uncertainties-yield-assessments/ (accessed on 25 March 2024).
  48. Jahn, U.; Herz, M.; Moser, D.; Belluardo, G.; Richter, M. Managing Technical Risks in PV Investments: How to Quantify the Impact of Risk Mitigation Measures for Different PV Project Phases? Prog. Photovolt. Res. Appl. 2018, 26, 597–607. [Google Scholar] [CrossRef]
  49. Blischke, W.R.; Prabhakar Murthy, D.N. (Eds.) Warranty Cost Analysis; CRC Press: Boca Raton, FL, USA, 1993. [Google Scholar]
  50. Yoe, C. Principles of Risk Analysis: Decision Making Under Uncertainty, 2nd ed.; CRC Press: Boca Raton, FL, USA, 2019; ISBN 9781138478206. [Google Scholar]
  51. LONGi Limited Warranty for LONGi PV Modules HE Single Glass Series 2022. Available online: https://static.longi.com/Limited_Warranty_for_LON_Gi_PV_Modules_HE_Single_Glass_Series_20220530_7d6b6431b8.pdf (accessed on 25 March 2024).
  52. Alexander, C. Market Risk Analysis, Value at Risk Models; Wiley: Hoboken, NJ, USA, 2009; Volume IV, ISBN 9780470997888. [Google Scholar]
  53. Parodi, P. Pricing in General Insurance; Chapman and Hall/CRC: Boca Raton, FL, USA, 2014; ISBN 9781466581449. [Google Scholar]
  54. Average Auction Prices for Solar PV by Region and Commissioning Date, 2016–2022. Available online: https://www.iea.org/data-and-statistics/charts/average-auction-prices-for-solar-pv-by-region-and-commissioning-date-2016-2022 (accessed on 27 January 2023).
  55. Santos, B. PV Payback Times Hit Average of 20 Years in 2022, Says SolarPower Europe. Available online: https://www.pv-magazine.com/2023/03/31/pv-payback-times-hit-average-of-20-years-in-2022-says-solarpower-europe/ (accessed on 24 April 2023).
  56. IEC TS 63209-1:2021; Photovoltaic Modules—Extended-Stress Testing—Part. 1: Modules. IEC: Geneva, Switzerland, 2021.
  57. IEC TS 63209-2:2022; Photovoltaic Modules—Extended-Stress Testing—Part. 2: Polymeric Component Materials. IEC: Geneva, Switzerland, 2022.
Figure 1. Global PV installation, module price, and technical development 2000–2023.
Sustainability 16 03880 g001
Figure 2. Top 6 PV manufacturers’ profit margin vs. new WF provision.
Sustainability 16 03880 g002
Figure 3. Benchmark PV degradation rate distribution and PERT approximation.
Sustainability 16 03880 g003
Figure 4. Illustration example for deriving probability of claim and expected shortfall
Sustainability 16 03880 g004
Figure 5. Monte Carlo simulation procedure used in this study
Sustainability 16 03880 g005
Figure 6. WF payout pattern estimate.
Sustainability 16 03880 g006
Table 1. Common PV module degradation and failure modes (Note: Total degradation is the sum of all effects).
Degradation and Failure ModeCommon Cause of FailureDegradation Impacts over 25 Years
Light induced degradation (LID)Increased minority-carrier recombination, Boron-oxygen defect1.1~1.5% [17,18]
Glass anti-reflection degradationDurability issue of the anti-reflection coating<3~4% [19,20]
EVA discoloringEVA additive issue, UV exposure at high temperature<10% [19]
Potential induced degradation (PID)Sodium ion flow through front glass and shunt the solar cellsUp to 30% [21]
DelaminationContamination, lamination process issue, environmental factors<4% [19]
Corrosion of cell metallizationMoisture ingress following delamination >5% [22]
Broken cell, snail trailsThinner cells, poor handling of module, silver acetate~10% [19,22]
Broken string interconnectThermal expansion stress, stiffer ribbon, flexing due to wind~10% [22]
Broken glass/loose frameHigh impact, hot spot, improper handling, misuse of supportUp to 100%
Junction box failureMaterial defect, condensation of water within the box, detachmentUp to 100%
Connector failureInsufficient current rating, water ingress, UV induced degradationUp to 100%
Table 2. Representative performance warranty for monocrystalline solar panels offered by top 6 PV manufacturers. Figures shown are the guaranteed annual degradation cap for respective products. (Compiled from company warranty policy and product catalogue).
Product201820192020202120222023Remarks
Longi Hi-MO1 0.55%0.55%0.55%0.55%0.55%25Y
Trina TSM-DE18M(II) 0.55%0.55%0.55%0.55%25Y
Trina TSM-DEG18MC.20(II) 0.45%0.45%0.45%0.45%30Y, Bifacial
Jinko Cheetah0.70%0.60%0.60%0.60%0.60%0.60%25Y
Jinko Tiger N 0.40%0.40%0.40%0.40%30Y
Jinko Tiger Pro 0.45%0.45%0.45%0.45%30Y, Bifacial
JA Solar JAM60S20 0.60%0.55%0.60%0.55%0.55%25Y
JA SolarJAM72D40 0.50%0.45%0.45%0.40%0.40%30Y, Bifacial
Canadian Solar KU Series 0.55%0.55%0.55%0.55%25Y
Canadian Solar CS1HA-MS0.70%0.60%0.60% 25Y
Risen Energy RSM40-8-xxxMB 0.55%0.55%0.55%25Y
Risen Energy RSM40-8-xxxN 0.40%0.40%0.40%25Y
Risen Energy RSM72-6-xxxM 0.60%0.60%0.60%0.60%0.60%25Y
Average0.700%0.575%0.523%0.513%0.504%0.504%
Table 3. Top 6 PV manufacturers’ revenue vs. warranty fund (WF) reserve (Compiled from respective company financial reports).
RankCompany2020
Revenue
(‘000 $)
2021
Revenue
(‘000 $)
2022
Revenue
(‘000 $)
2020
New WF
(‘000 $/%*)
2021
New WF
(‘000 $/%*)
2022
New WF
(‘000 $/%*)
Total
WF
Ratio
Lever-age
Ratio
1LONGi8,003,399 11,866,899 18,914,679 53,998
(0.67%)
81,152
(0.68%)
116,748
(0.62%)
0.74%1.24
2Trina Solar4,313,486 6,522,051 12,470,937 5857
(0.14%)
−386
(−0.01%)
26,214
(0.21%)
0.62%2.12
3Jinko Solar4,935,419 5,948,624 12,122,592 34,923
(0.71%)
17,061
(0.29%)
93,970
(0.78%)
0.88%2.96
4JA Solar3,789,812 6,055,976 10,702,258 14,488
(0.38%)
22,160
(0.37%)
51,028
(0.48%)
0.71%1.40
5Canadian Solar3,476,495 5,277,169 7,468,610 −18,146
(−0.52%)
7414
(0.14%)
31,531
(0.42%)
0.39%0.45
6Risen Energy2,355,351 2,761,103 4,308,610 −554
(−0.02%)
−930
(−0.03%)
−143
(−0.00%)
0.00%2.68
* The figure in parentheses shows the provision of new WF in % of that year’s revenue.
Table 4. WF estimate after changes in the median, maximum, and minimum parameters
ChangesWF Estimate after
Changes in Median (Most Likely) Degradation Value
WF Estimate after
Changes in Maximum Degradation Value
WF Estimate after
Changes in Minimum Degradation Value
−10%0.412%0.615%1.230%
+10%2.555%2.085%1.374%
Disclaimer/Publisher’s Note: The statements, opinions and data contained in all publications are solely those of the individual author(s) and contributor(s) and not of MDPI and/or the editor(s). MDPI and/or the editor(s) disclaim responsibility for any injury to people or property resulting from any ideas, methods, instructions or products referred to in the content.

