Article

The Impact of Suspension Fertilizers Based on Waste Phosphorus Salts from Polyol Production on the Yield of Maize Intended for Green Fodder

by
Paulina Bogusz
1,2,*,
Marzena Sylwia Brodowska
2 and
Piotr Rusek
1
1
Fertilizers Research Group, Łukasiewicz Research Network–New Chemical Syntheses Institute, Al. Tysiąclecia Państwa Polskiego 13a, 24-110 Puławy, Poland
2
Department of Agricultural and Environmental Chemistry, University of Life Sciences in Lublin, Akademicka 13, 20-950 Lublin, Poland
*
Author to whom correspondence should be addressed.
Agronomy 2024, 14(5), 1054; https://doi.org/10.3390/agronomy14051054
Submission received: 16 April 2024 / Revised: 8 May 2024 / Accepted: 14 May 2024 / Published: 15 May 2024
(This article belongs to the Section Soil and Plant Nutrition)

Abstract

:
The need to import phosphorus raw materials for fertilizer purposes in Europe as well as the need to manage increasing amounts of waste contributed to the search for alternative sources of phosphorus. One of these is waste sodium–potassium phosphate from the production of polyols. Additionally, a current problem is providing an adequate amount of food, where fertilizers play the main role. Due to the increase in meat consumption, the attractiveness of growing corn for feed is increasing due to its high yield potential and rich composition. The article presents the impact of suspension fertilizers based on waste from the production of polyols on the yield of corn intended for green fodder. In a 3-year field study, the effects of a waste phosphorus source were compared with a commercial granulated phosphorus fertilizer—fosdar. In addition, the suspension fertilizers were assessed according to their composition by testing fertilizers containing only basic nutrients (NPK) and ones enriched with secondary ingredients (S and Mg) and microelements (Zn, Mn and B). The research confirmed the effectiveness of the tested suspension fertilizers. Although the yield obtained was lower than in the case of fosdar fertilization, it still remained at a high level of over 70 t∙ha−1 of fresh yield.

1. Introduction

Corn (Zea mays L.) comes from Central America, where it was domesticated about 7000 years ago, and since European settlement, it has spread rapidly around the world. Since then, it has played an increasingly larger and more diversified role in the agri-food system [1,2,3,4,5].
In response to the growing world population, increasing crop production has become one of the main goals to ensure enough food. Within this framework, cereals play a key role [6]. The world’s three staple grains—wheat, rice and corn—are key components of the human diet, accounting for approximately 42% of global calorie intake and 37% of protein intake [1,3,6,7]. In Sub-Saharan Africa, Latin America and some Asian countries, corn plays an important role in human food, providing over 20% of calories consumed [1,8].
The advantage of corn over other cereals is its high yield potential for both grain and fodder [6]. Moreover, it can be grown in a wide range of climatic and soil conditions. It provides more nutrients compared to other cereals and legumes [5,9,10]. Corn contains approximately 72% starch, 10% protein and 4% fat, providing an energy density of 365 Kcal∙100 g1, but has a lower protein content compared to rice and wheat [7].
Corn is a very versatile grain that has many prospective applications [9,11,12]. It can be used as a plant for food, animal feed, industrial raw material and in energy production [9,11,12]. In the food field, corn is used in the production of a variety of products, such as corn starch, dextrose, corn syrup and corn flakes [1,9,11].
In developed economies, the consumption of more animal products leads to the increased use of corn in the production of feed for farm animals [1]. It is one of the most valuable and efficient fodder plants cultivated on a global scale [13,14,15]. It is used to produce roughage, used mainly in winter, but increasingly also throughout the year to feed ruminant animals. The most popular form is silage made from whole corn plants [14].
The development of green fodder production is due to its potential for high yields, its high digestibility and its greater resistance to lodging compared to small-grain cereals such as barley and oats [13]. In cultivation, it ensures stable yields in various environmental and agronomic conditions. It is characterized by high energy values and excellent properties for pickling [10].
Corn creates an opportunity to increase meat and milk production without the need to expand the use of agricultural land [16]. In the diet of dairy cows, it increases feed intake, milk yield and protein content [9]. On farms, feed silage is typically cheaper than dry concentrates and can be produced with lower energy inputs, such as energy needed for drying and transportation [17,18].
Over the last few decades, corn production around the world has increased rapidly. This is the result of the growing demand for this plant raw material, as well as the synergy between technological progress, higher yields and expansion of cultivation areas. Corn cultivation extends to more than 170 countries around the world, including both emerging and developed economies. The area of its cultivation is mainly concentrated in both Americas and Asia, with the largest share in North America (mainly in the USA) and East Asia (especially in China). These regions provide more than half of the world’s corn production [1,4]. The main corn-exporting countries are the United States, Brazil, Argentina and Ukraine. In 2020–2021, cumulative maize exports from these four countries accounted for 88.12% of global exports. This means that while China is a major corn producer, it is not a major corn exporter. The US and China are the two largest consumers of corn [5].
The paper presents the results of 3-year field tests with corn intended for green fodder in which the effect of suspension fertilizers based on waste sodium–potassium phosphate from the production of polyols was tested.

2. Materials and Methods

2.1. Field Research Methodology

In a field experiment, the effects of 6 suspension fertilizers, in which the source of phosphorus was waste sodium–potassium phosphate from the production of polyols, were tested. Polyols are raw materials for the production of polyurethanes, which are widely used in such areas of life and economy as transport, construction, the furniture industry and mining.
The waste used came from PCC Rokita S. A. in Brzeg Dolny, Poland. Research shows that it contains nearly 19% phosphorus and about 8% potassium. The content of impurities is well below the threshold value set by the European Commission in new regulations. This makes the tested waste a competitive raw material in relation to phosphate rocks, which are often contaminated with cadmium. Due to its high water content, the most advantageous form of its use is the production of fertilizers based on it in the form of suspensions [19].
The compositions of the fertilizers were developed based on recommendations for growing green maize. In the first series, three fertilizers were proposed with the main nutrients, NPK, in the following percentages: 9.5–4-11. Fertilizer 1 contained only the main nutrients (N, P and K); fertilizer 2 was additionally enriched with secondary nutrients: magnesium (3% MgO) and sulfur (6% S); and fertilizer 3 was enriched with microelements of key importance in corn cultivation: boron (0.01%), manganese (0.1%) and zinc (0.01%). In the second series, the dose of phosphorus was increased by 2% with the same content of nitrogen, potassium, secondary nutrients and microelements as the fertilizers in the first series. The proposals for the 6 suspension fertilizers were selected in such a way as to easily compare the yield-forming efficiency of corn in relation to the amount of the phosphorus component and depending on the addition of secondary nutrients and microelements [20].
The detailed characteristics of the waste used are presented in the article “The Possibility of Using Waste Phosphates from the Production of Polyols for Fertilizing Purposes” [19], while the article “Suspension Fertilizers Based on Waste Phosphates from the Production of Polyols” [20] describes the method of producing the used waste suspension fertilizers.
Table 1 shows the division of fertilizers used in the field experiment according to their composition and the nitrogen dose applied.
The field experiment consisted of a total of 17 objects. The fertilizers marked nos. 1–6 were multi-component suspension fertilizers in which the source of phosphorus was liquid sodium–potassium phosphate from the production of polyols. All suspension fertilizers had the same N and K composition—9.5 and 11%, respectively. Suspension fertilizers 1–3 contained 4% P, and fertilizers 4–6 contained 6% P. Suspension fertilizers 1 and 4 contained only the main nutrients—NPK. Fertilizers 2 and 5, in addition to the main nutrients, contained secondary components—S and Mg. Fertilizers 3 and 6, in addition to the main and secondary nutrients, also contained microelements. The research included 3 controls: K1 (without fertilization), K2 (NPK composition the same as for suspension fertilizers 1–3) and K3 (NPK composition the same as for suspension fertilizers 4–6). Each fertilizer was applied to the field in an amount corresponding to two doses of nitrogen: a—180 kg∙ha1; b—135 kg∙ha1. The sources of N and K for all fertilizers (suspension and control) were potassium salt and ammonium urea solution. The source of P in the suspension fertilizers was liquid sodium–potassium phosphate from the production of polyols, while in the control samples (K2 and K3) it was granulated commercial fosdar fertilizer.
Field tests were carried out at the Experimental Farm of the University of Life Sciences in Lublin in Czesławice (51°18′24″ N, 22°16′04″ E) in the growing seasons of 2021, 2022 and 2023. The experimental plant was a new variety of corn grown for silage by the company Pioneer P8244. It is a medium-early variety with FAO: K240, single S.C. hybrid, grain type—dent. The field experiment was carried out using the randomized block method in three repetitions, giving a total of 51 experimental plots (3 × 17). The plots had an area of 25 m2 and consisted of 8 rows spaced 75 cm apart (due to the spacing of the seeder nozzles).
The soil in the area designated for the field experiments was characterized by a very high content of phosphorus (350 mg∙kg−1 of soil P2O5), potassium (291 mg∙kg1 of soil K2O) and magnesium (92 mg∙kg1 of soil) and an average content of sulfur (10.4 mg∙kg1 of soil SO3) and nitrogen (30.3 kg∙ha1). Microelements important for corn cultivation, such as zinc and manganese, were at an average level (10.6 mg∙kg1 of soil Zn, 260 mg∙kg1 of soil Mn), while the boron content was low (0.99 mg∙kg1 of soil). The soil reaction was slightly acidic (pH 6.3 in 1 mol KCl · dm3).
Sowing was carried out on the optimal dates for maize, i.e., 12 May 2021, 15 June 2022 and 9 May 2023. The maize sowing date in the second year of the study was later than in the remaining years due to the damage caused by wild boars and the need to repeat sowing. The sowing density was 80,000 grains∙ha1. During the growth period, the plants were protected against weeds by spraying with Lumax 537.5SE insecticide. Fertilizers were applied before sowing in an amount corresponding to 70% of the total fertilizer dose with the remaining part as top dressing in the 5–6 leaf phase.
Corn was harvested at the milky–waxy ripeness stage, when the dry matter content was 30–35%. Yield parameters were determined based on a 2 m2 harvest taken from the two central rows of each experimental plot. Above-ground plant parts were collected by manually cutting the plants 10 cm above the soil surface.
The yield of the above-ground part was weighed as the sum of the grain yield and the vegetative part, and the weight of the cobs was measured separately. From each experimental plot, 8 plants were randomly selected, their height was measured, and the number of cobs and the number of rows of grains in the cob were counted. Then, test plants from each plot were cut into pieces in a forage harvester, from which, after mechanical mixing, 500 g samples were taken. After weighing, the samples were placed in an air circulation oven set at 70 °C until the plant biomass reached a constant weight in order to estimate the dry weight value. The dried samples were ground and some were mineralized to prepare them for further research.

2.2. Statistical Analysis

The statistical results were prepared using the Statistica 13 program. For this purpose, ANOVA (analysis of variance) for factorial designs was used, and the significance of differences was determined using the Tukey test at a significance level of α = 0.05 for each year of research separately. Assumptions for the ANOVA test were tested using the Levene test (homogeneity of variances) and the Shapiro–Wilk test (normality of distribution).
For each parameter in individual years, the impact of individual factors (marked with the letters A, B and C) and the impact of their interaction effects (A × B, A × C, B × C and A × B × C) are presented. The measure of this influence was determined by calculating the coefficient—partial eta squared (η2p)—which determines which factor explains to a greater extent the variability in the measured parameter.
The statistical analysis of the results was divided into two parts:
Part I—The effects of fertilizers were compared depending on the source of phosphorus (superior factor, 2 levels: polyol waste or phosphorus fertilizer). The secondary factors in this analysis were the phosphorus dose (2 levels: 4% or 6%) and the nitrogen dose (2 levels: 135 or 180 kg N∙ha1). The obtained results were compared after a control test without fertilization. Using the Tukey test, homogeneous groups were determined for individual results (marked with lowercase letters: a or b) and homogeneous groups for mean values regardless of the nitrogen dose (vertical) and mean values regardless of the phosphorus dose (horizontal), marked with capital letters: G, H, I or J.
Part II—The effects of the produced suspension fertilizers were compared in terms of the dose of phosphorus (4% or 6%), the type of fertilizer (NPK, NKP + Mg + S or NPK + Mg + S + micro) and the dose of nitrogen (135 or 180 kg N∙ha1). Using the Tukey test, homogeneous groups were distinguished for individual results (marked with lowercase letters: a or b) and homogeneous groups for average values regardless of the nitrogen dose (vertical) and average values regardless of the type of fertilizer (horizontal), which were marked with uppercase letters: G, H, I or J.

3. Results

3.1. Meteorological Conditions during the Field Experiment

Meteorological conditions during the field experiment varied in individual years of the study (Table 2 and Table 3).
The highest average temperature during the growing season was recorded in the third year of field research (16.1 °C), and the lowest was recorded in the second year (13.1 °C). However, the highest average rainfall was recorded in the first year of research (80.7 mm) and the lowest in the third year (57.3).
The third year of field research was the most favorable during the plant emergence period—it was characterized by the highest temperature and rainfall in April and May.
In order to more fully characterize the meteorological conditions that occurred during the field experiment, the Sielianinow hydrothermal index (k) was calculated [21]:
k = P 0.1 · Σ t
where:
  • P—monthly sum of atmospheric precipitation (mm);
  • Σt—monthly sum of air temperatures > 0 °C.
The Sielianinow coefficient indicates the water supply of plants during the growing season and is divided into classes presented in Table 4.
Using the Sielianinow coefficient (Table 5), it can be stated that in each year of field research, corn sowing was preceded by a month with favorable moisture conditions (k: 2.35–3.01). The best sowing conditions occurred in May in the first year of research (k: 1.43) and the worst in June in the second year of research (k: 0.66). The subsequent stages of corn development were accompanied by different conditions in individual years. The harvest stage in September varied greatly each year. The most optimal conditions were recorded in the first year of research (k: 1.62), in the second year the conditions were extremely humid (k: 3.47), and in the third year they were very dry (k: 0.54).

3.2. Results of Field Tests

Figure 1 shows a top view of experimental plots with corn made in the third year of field research. The marked plots with a clearly lighter shade of green represent objects without fertilization.

3.2.1. Dry Matter Content

The date of corn harvest was determined based on the dry matter content so that its value was in the range of 30–35%. In the first year of the study, the average dry matter content was 33.49%, in the second year it was 32.49%, and in the third year of the study it was 33.06%.
Table 6 lists the average yield of dry matter of corn plants depending on the type of phosphorus source in the fertilizer and its percentage, separated into individual years of research and the nitrogen dose applied.
In the first and third years of the study, the source of phosphorus used in fertilizers had a significant impact on the amount of fresh matter obtained, explaining 51.57% of the variability in the first year and 32.52% in the second year. In each case, a higher yield of green matter was obtained on plots where fosdar was the source of phosphorus. However, regardless of the type of phosphorus source in the fertilizer, the average dry matter yield exceeded 22 t∙ha1, while the yield of plots without fertilization was around 19 t/ha. In the second year of the study, the cause of significant variability in the amount of biomass obtained was the phosphorus content in the fertilizer. For fertilizers containing 6% P, a higher average dry matter yield was obtained (24.09 t∙ha1) than for fertilizers containing 4% P (22.99 t∙ha1). The nitrogen dose applied did not have a significant impact on this parameter.
Table 7 lists the average yield of dry matter of corn plants depending on the type of suspension fertilizer and the percentage of phosphorus, divided into individual years of research and the nitrogen dose applied.
The type of suspension fertilizer significantly differentiated the average dry matter yield in the first and second years of field tests, accounting for approximately 26% of the variability. In both years, significant differences were noted between NPK fertilizers and NPK S Mg micro fertilizers, for which the dry matter yield was significantly higher. In the third year of research, the cause of variability in the average dry matter yield turned out to be the phosphorus content in the fertilizer (Ƞ2p = 27.45%). In this case, fertilizers with a higher phosphorus content gave an average dry matter yield significantly higher by 0.95 t∙ha−1. In the experiment, the nitrogen dose had no significant effect on the yield.
Figure 2 shows the distribution of dry matter measurement results for all objects tested in the field test over 3 years. It is clearly visible that the dry matter yield for plots without fertilization is much lower than for plots where fertilization was applied. However, there are no such significant differences between fertilized plots. It can be noticed that the median value of dry matter for plots where a reduced dose of nitrogen was applied (b—135 kg/ha) is lower compared to plots where the nitrogen dose was 180 kg/ha (a). This difference is most clearly visible in suspension fertilizers with a basic NPK composition and a lower dose of phosphorus (1a and 1b). The presented graph also indicates higher dry matter yields for plots fertilized with suspension fertilizers with a phosphorus content of 6% (fertilizers 4–6) compared to suspension fertilizers with a 4% phosphorus content (fertilizers 1–3). For the control plots (K2 and K3), where the source of phosphorus was granulated fosdar fertilizer, a large scatter of results was observed. In these cases, however, the obtained media values were higher compared to the values obtained in plots where the source of phosphate was polyol waste (fertilizers 1–6).

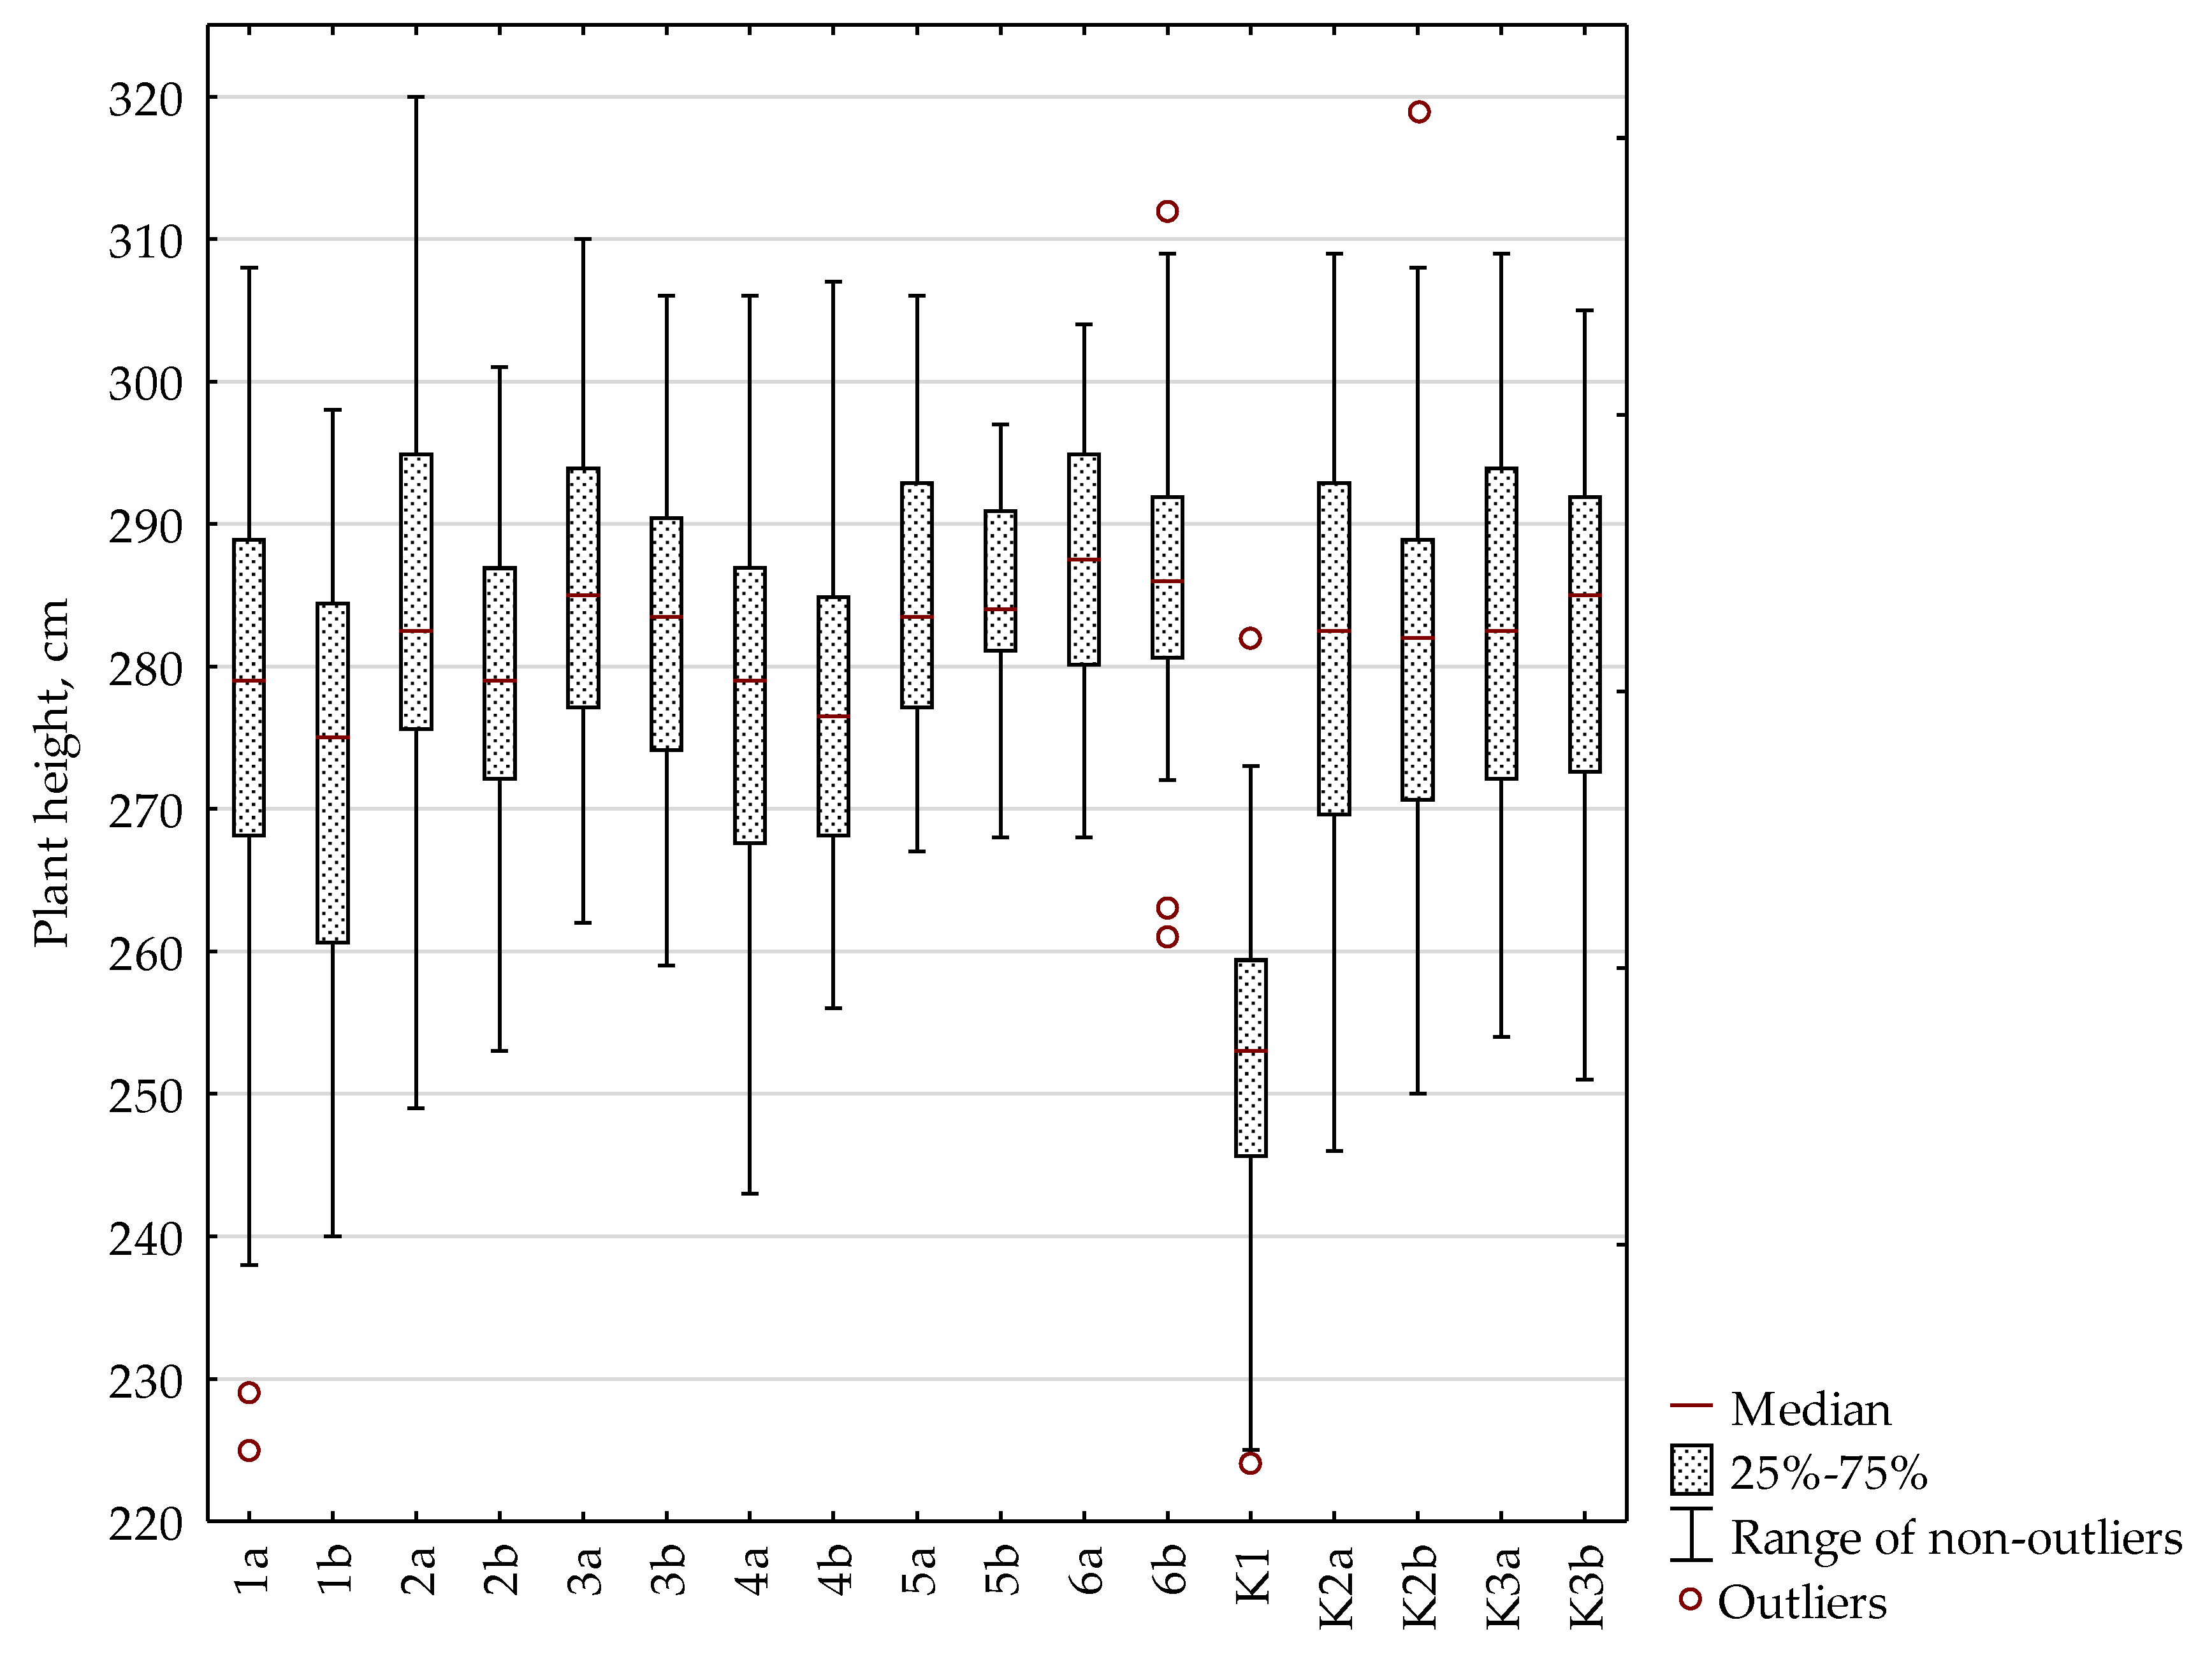
3.2.2. Maize Plant Height

Table 8 lists the average height of corn plants depending on the type of phosphorus source in the fertilizer and its percentage, divided into individual years of research and the nitrogen dose applied.
In the first and second years of the study, there were slightly significant differences in the height of corn plants depending on the source of phosphorus used in fertilization. The highest average height of plants in both years was recorded for plants fertilized with fertilizers containing fosdar (xI fosdar = 285.26 cm, xII fosdar = 283.39 cm). The height of plants fertilized with suspension fertilizers based on polyol waste was lower by an average of 4.77 cm and 8.31 cm in the first and second years of the study, respectively. In each year, the lowest values of average plant height were obtained for plants on plots without fertilization. The percentage of phosphorus in the fertilizer did not significantly differentiate the height of plants, nor did the dose of nitrogen.
Table 9 lists the average height of corn plants depending on the type of suspension fertilizer and the percentage of phosphorus, divided into individual years of research and the nitrogen dose applied.
The analysis of variance showed a significant impact of the type of suspended fertilizer used on the average height of plants in each year of the study. Regardless of the percentage of P, fertilizers with a basic NPK composition significantly influenced the lower height of plants compared to fertilizers with the addition of secondary and micronutrients. In the second and third years of field tests, a significant impact of the percentage of P on this parameter was also noted, in favor of fertilizers with a higher P content.
Figure 3 shows the distribution of the obtained results of plant height measurement for all objects examined in the field test over 3 years. The graph clearly shows that the lowest plant heights were recorded in plots without fertilization.

3.2.3. The Ratio of the Weight of the Cob to the Weight of the Green Fodder

Table 10 lists the average share of corn cobs in biomass depending on the type of phosphorus source in the fertilizer and its percentage, divided into individual years of research and the nitrogen dose applied.
The average percentage of cobs in the total biomass was significantly different only compared to the treatment without fertilization. For fertilized plots, it was in the range of 44–47%, and for plots without fertilization it was 36–38%.
Table 11 lists the average share of corn cobs in biomass depending on the type of suspension fertilizer and the percentage of phosphorus, divided into individual years of research and the nitrogen dose applied.
The type of suspension fertilizer applied in the field study did not have a significant impact on the share of cobs in biomass.

3.2.4. Cobs on the Plant

Table 12 lists the average number of cobs on a single plant depending on the type of phosphorus source in the fertilizer and its percentage, broken down into individual years of research and the nitrogen dose used.
In the field study, no significant differences were found in the number of cobs per plant due to the source of phosphorus in the fertilizers used. The number of cobs on individual plants usually ranged between one and two pieces; occasionally, there were plants with three cobs. In the third year of the study, the content of phosphorus in fertilizers had a slightly significant impact, differentiating the number of cobs in plots fertilized with fertilizers containing 6% P and those in plots without fertilization. In the latter there was a greater share of plants with one cob.
Table 13 shows the average number of cobs on a single plant depending on the type of suspension fertilizer and the percentage of phosphorus, divided into individual years of research and the nitrogen dose applied.
When differentiating the suspension fertilizers used in the experiment due to their composition, no significant differences were noted in the number of cobs on individual plants. In the third year of research, a significant relationship was noted between the number of cobs and the phosphorus content in fertilizers, where a lower amount of P in the fertilizer resulted in a larger number of plants with fewer cobs. The nitrogen dose applied did not significantly affect the number of cobs on the plants.

3.2.5. Number of Rows of Grains in the Cob

Table 14 lists the average number of rows of grains in a cob depending on the type of phosphorus source in the fertilizer and its percentage, divided into individual years of research and the nitrogen dose applied.
In the second and third years of the study, significant differences were noted in the number of grain rows in the cob due to the phosphorus source used in fertilization. In both years, corn fertilized with fosdar had cobs with a larger number of rows of grains. Table 15 lists the average number of grain rows in a cob depending on the type of suspension fertilizer and the percentage of phosphorus, divided into individual years of research and the nitrogen dose applied.
In the first and second years of field research, the only significant influence on the number of grain rows in the cob was the interaction effect between the type of fertilizer and the phosphorus content. In both cases, it accounted for only 3–4% of the variability.

4. Discussion

  • Choice of variety
The appropriate selection of varieties is a key factor in growing corn for silage from whole plants because it determines the success of this process in almost 30% of cases [14,22]. A new “stay-green” corn variety intended for green fodder from Pioneer-P8244-was selected for field tests. It is a medium-early variety with FAO 240 and dent-type grain.
Hybrids intended for the production of whole-plant silage should be so early that the grain reaches at least the waxy maturity phase during the growing season [14]. The introduction of new varieties contributed to qualitative and quantitative progress in maize breeding. Hybrids with a shorter vegetation period were created, which enabled cultivation in regions that were less favorable in terms of thermal conditions and a shorter vegetation period. This had a direct impact on the growth of crops [12,16].
High-yielding modern corn hybrids accumulate more biomass and respond better to fertilizers. This, combined with increased photosynthetic efficiency, results in greater yield and nitrogen use efficiency, which reduces fertilizer doses, lowering costs [9]. Modern corn varieties have greater yield potential than those developed a few or a dozen years ago. In addition to higher productivity, they are also characterized by greater resistance to stress factors and have other important agronomic and utility features [23].
“Stay-green” varieties work very well in crops for fodder purposes. This genetically modified feature affects the prolonged accumulation of nutrients in plants and leaves during the ripening period. Therefore, these varieties are characterized by a large share of green plant parts when the grain reaches late-wax maturity. This allows for the production of good-quality raw material containing properly developed grain with preserved green leaves and stems. Such raw material is beneficial for the proper ensiling process [23].
The “stay-green” effect is particularly beneficial when growing on soils with weaker water retention and when droughts occur frequently. Such varieties are less susceptible to premature drying of plants. Their higher drought tolerance is due to their developed root system, which ensures better use of available moisture [23].
Long-term preservation of green and healthy leaves also acts as a natural barrier hindering the development of fungal diseases in plants. Corn varieties with the “stay-green” feature show higher resistance to fusarium diseases, which particularly attack corn under stressful conditions, such as drought [23].
  • Selection of the earliness of the variety
The earliness of the variety is decisive when choosing the direction of cultivation—grain or silage [23]. When selecting it, the climatic conditions of the region where the cultivation is planned should also be taken into account [22,23].
Early varieties are characterized by a shorter vegetation period. As a result, they have lower yields but have a large share of cobs in both green and dry matter. They are also characterized by lower humidity of 25–30% [22].
Medium-early ripening hybrids take 10–12 days longer to fully mature but produce a 5–10% higher seed yield. Nevertheless, the share of cobs in the mass intended for ensiling is lower compared to early varieties [22]. Medium-late ripening varieties reach harvest maturity 23–26 days after early varieties. The grain yield is up to 15% higher, but they have the lowest share of cobs in silage [22].
  • Influence of climatic conditions
Environmental parameters such as temperature, precipitation and sun exposure significantly modify physiological processes and plant growth on a large spatial scale, which can have a significant impact on yield and quality [24].
Corn, a C4-type plant, is characterized by high efficiency of photosynthesis and the ability to adapt to various environmental conditions. It can grow both in the tropics and in temperate and sub-tropical zones [1,25]. However, drought and heat, common environmental factors, have a significant impact on green fodder yield and quality [26].
Corn is a plant with high thermal requirements resulting from its natural origin [22]. The rate of subsequent development stages of corn is determined by the sum of physiologically effective temperatures (SPET). The base temperature is assumed to be approximately 8 °C. It is assumed that half of the heat needs to fall in the vegetative growth period (until flowering) and the other half in the generative period (kernel development). SPETs vary depending on the corn variety. The higher the FAO number, the higher the SPET value and the longer the growing season. For example, for medium-earliness varieties, regardless of the biomass purpose, the sum of effective temperatures ranges from 1310 °C to 1370 °C, while for late varieties it most often ranges from 1420 °C to 1480 °C [22].
The growth of corn intended for silage can be favorably stimulated by relatively high temperatures, provided that it is supplied with an appropriate amount of water. As a result, plants reach the SPET more quickly and the growth period may be shorter compared to crops in regions with lower temperatures and rainfall. However, corn, being a short-day plant, may delay the flowering phase in case of longer hours of sunlight. This leads to delayed maturity and an extended growth period. The quality of the feed then gradually deteriorates as a result of the increasing stem-to-leaf ratio. This leads to a decrease in dry matter digestibility due to an increase in cellulose and lignin content [16,24].
Heat stress, in addition to affecting the pollination process, may limit the development of the seed after pollination. This development is divided into a phase of stagnation and a phase of linear growth, during which a significant accumulation of dry matter occurs. The stagnation phase begins immediately after pollination and lasts from 10 to 12 days. Despite the small growth of the seed during this period, it plays a key role in development. The division of endosperm cells in this phase affects its ability to accumulate starch in the grain. High temperatures after the silking period limit this process. Grains subjected to heat stress accumulate from 18% to 75% less dry matter, which is associated with reduced starch synthesis in the endosperm at temperatures above 35 °C [26].
Low temperature causes leaves to narrow, cell walls to thicken and fiber content to increase [24]. However, thanks to the introduction of short-season hybrids, green fodder production has also become possible in colder regions [16]. There, corn grown for feed may also outweigh corn for grain [1]. Therefore, silage maize varieties that have a short growth period and are resistant to low temperatures should be grown in high-latitude areas [24].
A plant’s water supply is determined by various factors, including the amount and distribution of rainfall, evapotranspiration, and the water retention capacity of the soil. The interaction of these factors can have a significant impact on the yield and nutritional composition of maize intended for silage production [26].
Despite the farmer’s limited influence on water conditions in the soil, it is possible to modify the soil profile to better prepare plants for abiotic stress. This often requires adjusting the agrochemical characteristics of the soil, such as pH and mineral content [22].
Corn is characterized by intensive growth and extensive above-ground biomass, which translates into a high demand for water, despite a relatively low transpiration coefficient [22].
Corn is water efficient, using less per unit weight than wheat and alfalfa. To produce 1 kg of dry matter, corn uses about 360 L of water, while wheat needs approximately 500 L and alfalfa as much as 860 L [1,25,27]. Despite this, growing corn per 1 ha requires significant amounts of water, even several or several million liters [23]. Corn also has a favorable water footprint per energy unit of 0.41 L of water per kilocalorie but still contributes 6% to the global water footprint [1,25].
Corn reacts strongly to periodic water shortages, especially before flowering [22]. Appropriate soil hydration is crucial for efficient germination and emergence. Reducing irrigation in the silking phase leads to a reduction in grain yield, but the number of grains in the ear does not change. Drought stress during the growing season may threaten dry matter yields but does not necessarily affect grain development and the potential nutritional composition of silage [26].
Drought stress and heat stress often occur simultaneously. High ambient temperatures increase evapotranspiration, which worsens the effects of drought, especially when accompanied by low relative humidity [26].
  • Optimal date for sowing corn
Selecting the appropriate sowing date allows for optimal use of climatic conditions, such as temperature, humidity and day length, and allows for synchronizing the flowering time with the appropriate temperature [6,28].
Corn is characterized by a strong photoperiodic response and responds very strongly to day length [23]. Therefore, the selection of the appropriate date for sowing corn is crucial for the proper course of its development phases, yielding and shaping the proportions between various components of the yield [15].
When severe frosts occur in early spring, all emerging plants die, regardless of their developmental stage. Temporary frosts damage the first leaves, but the plant can quickly regenerate from the underground part of the stem, where the growth cone is located, when thermal conditions become favorable. Corn plants are susceptible to damage at temperatures of 0–5 °C. If they are exposed to such cooling for a long time, it may lead to their death [22].
Timely and correctly performed sowing ensures optimal conditions for germination and emergence, adequate time for growth and development, greater resistance to pests and diseases, and greater competitiveness with weeds [22].
There are greater benefits from accelerating sowing than delaying it [23]. Early and intermediate sowing dates usually allow the best use of solar energy for grain production [13,29]. However, too early sowing results in prolonged germination and emergence due to too low soil temperature, and the seeds are susceptible to damage by diseases and pests [22].
When corn sowing is delayed, the initial development of plants occurs during the lengthening of the day. In such a situation, the corn accumulates a larger vegetative mass and moves to the phase of generative development and maturation with a delay [15]. A delayed sowing date has a beneficial effect on quick and uniform emergence, but in the case of growing maize for silage, it leads to a reduction in the share of cobs in the total yield, which in turn reduces the feed value of the silage [22].
Research has shown that delaying the sowing date leads to a reduction in the thousand-seed weight, the number of seeds per corn cob, the length of the cob, the seed yield, and the protein, ash and oil content in the seeds. These effects result from shortening the vegetation period and limiting the seed filling process [6,29,30]. The reduction in yield in the case of late sowing of corn is the result of the fact that the grain filling phase coincides with the arrival of cold weather in autumn, as well as the lack of adequate heat supply during the growing season [6]. Early varieties are more tolerant of delayed sowing [23].
The optimal sowing date varies depending on the region, due to the length of the growing season and the level of average temperatures [22].
  • Proper sowing depth of corn seeds
The seed sowing depth depends on the type of soil and the sowing date. In the case of more compact and moist soil and earlier sowing, it is recommended to sow at a depth of 4–5 cm. However, on lighter and more permeable soils, and when sowing later, the optimal depth is 5–8 cm [22].
The use of deeper sowings has a beneficial effect on the availability of moisture, but in this case the soil temperature around the seeds is lower, which leads to a slower process of nutrient uptake. However, in a situation where the top layer of soil is significantly dry and there are no forecasts of upcoming rainfall, the decision to sow seeds deeper is justified [23].
  • Sowing density and its impact on yield
Corn is one of the plants that is particularly susceptible to fluctuations in planting density [31]. Due to its photophilous origin, it reacts very strongly to any shading. Therefore, accuracy and precision during sowing are of great importance in corn cultivation technology [23].
Adjusting sowing density is one of the key crop management tools that allows the use of environmental factors, nutrients and especially light to optimize the structure of corn plantations and maximize yields [6,32].
The optimal density of plants aims to minimize competition between them while ensuring the largest possible number of well-seeded cobs per unit area. Any errors in this area have a strong impact on the yield, and repairing them during the growing season is impossible [22,23].
The selection of plant stock should take into account the variety, its earliness, soil fertility and the recommendations of specialists from breeding and seed companies [22,23].
Higher plant density has a positive effect on dry matter production [10].
In the 1930s in the United States, the average planting density of grain corn was approximately 3 plants∙m2 or less [14]. Currently, in intensively cultivated areas in the USA, the average planting density is about 8 plants∙m2 [14,31]. However, in European Union countries, where soil and climatic conditions are more diverse, this value may vary from 6 to 8 plants∙m2 [23,31,33]. In both of these regions, a common row spacing at current planting densities is around 0.70–0.75 m [31,33].
When growing maize for silage and on less fertile soils, as well as when using earlier varieties, a higher planting density is recommended. In this case, the sowing density is 9–10 plants∙m2 [22,23] and may even reach 12–16 plants∙m2 [12].
In areas where there are repeated periods of drought, especially in fields with light soils, a lower planting density is recommended. In the case of better soils, a larger number of plants per unit area is favorable for development and yield [22,23].
The optimal plant density is not only a matter of the number of plants per unit area but also their even distribution [22,23]. Minimizing local crowding caused by uneven sowing reduces competition between plants for key growth factors. The most important of these factors is light, followed by nutrients and water. Even planting increases the productivity of individual plants and allows them to achieve their full yield potential [31,34,35].
The main goal of increasing the planting density of corn plants is to achieve higher grain or biomass yields, which contributes to greater efficiency and competitiveness of the cultivation system per unit area. In the absence of biotic and abiotic stresses, yield is directly related to the amount of sunlight the crop is able to capture [31].
Modern hybrids show higher tolerance to higher plant densities and are more resistant to stressful conditions of intraspecific competition. This leads to fewer barren plants and less stem lodging [31]. These hybrids are characterized by more vertical growth and shorter leaves and also have greater synchronization between female and male inflorescences, which reduces infertility [16,31].
Reducing the distance between adjacent rows of plants brings a number of benefits. Close row spacing accelerates corn growth at the beginning of the season, which leads to more efficient use of radiation and higher yields. Optimal light capture by closing the canopy earlier limits light penetration, reducing competition from weeds, especially those that are shade-intolerant. Faster shading ensures better water management by limiting the evaporation of water from the soil. In addition, it contributes to better soil protection, reduces water runoff and prevents erosion [35].
Increasing the plant density above the critical density increases competition between neighboring plants [6,35]. Too high a density of plants in a field impairs the supply of light and access to water and nutrients [15]. This has a negative impact on the quantity and quality of the obtained crop. In extreme cases, it prolongs the intervals between flowering and silking, which leads to failure to set the cobs, poorer graining and delayed ripening [6,15,35,36]. Moreover, in such an environment, more plants are infertile. Plants are weakened and more susceptible to lodging, and with increased humidity in the canopy, they are more susceptible to the development of diseases [22,36]. Increased corn planting densities may exacerbate the negative effects of drought, thereby reducing biomass yields [36]. Such effects are observed both in the case of excessive density of corn plants and heavy weed infestation [23]. Too sparse sowing, however, reduces the yield and deteriorates its quality due to the increased risk of weed infestation [22].
Increasing planting density increases the yield of silage corn but does not increase its nutritional value [24,36]. Competition between plants causes a decrease in nitrogen uptake by plants, which reduces the quality of feed, especially the protein content [24,37]. Whole green fodder under such conditions has a higher fiber content and lower energy concentration due to limited grain development and a lower grain-to-biomass ratio [36]. The fiber content also increases, which adversely affects the digestibility of the produced silage [15,24,37]. Appropriate planting density is therefore essential to obtain silage maize yield and quality balance [24,37]

5. Conclusions

The conducted 3-year field tests confirm the positive impact of the applied suspension fertilizers on the yield of green maize. There were significant differences in dry matter yield and plant height compared to the control, where no fertilization was used, in favor of suspension fertilizers. However, compared to the control where phosphorus was applied, they had a less beneficial effect on corn yield. However, the advantage of using suspension fertilizers based on waste phosphate from the production of polyols is the lower cost and the possibility of using waste that has not been used so far [19]. The great advantage of this phosphorus source is the low content of impurities, especially cadmium, which is a big problem in phosphate rock deposits. Fertilizer regulations are introducing more and more restrictive parameters regarding this contamination, which results in limited use of some phosphate rock deposits. Moreover, the fertilizer industry in Europe is almost 90% dependent on the import of this raw material. That is why it is important to diversify its source as much as possible [19]. This confirms the validity of using a waste source of phosphorus in the form of waste from the production of polyols.

Author Contributions

Conceptualization, P.B.; methodology, P.B. and M.S.B.; investigation, P.B.; resources, P.B.; data curation, P.B.; statistical analysis, P.B.; writing—original draft preparation, P.B.; writing—review and editing, P.B.; visualization, P.B.; supervision, M.S.B. and P.R.; project administration, P.B. All authors have read and agreed to the published version of the manuscript.

Funding

This research received no external funding.

Data Availability Statement

Dataset available on request from the authors. The raw data supporting the conclusions of this article will be made available by the authors on request.

Conflicts of Interest

The authors declare no conflicts of interest.

References

  1. Erenstein, O.; Jaleta, M.; Sonder, K.; Mottaleb, K.; Prasanna, B.M. Global maize production, consumption and trade: Trends and R&D implications. Food Secur. 2022, 14, 1295–1319. [Google Scholar]
  2. Awika, J.M. Major cereal grains production and use around the world. In Advances in Cereal Science: Implications to Food Processing and Health Promotion; American Chemical Society: Washington, DC, USA, 2011; Volume 1089, pp. 1–13. ISBN 9780841226364. [Google Scholar]
  3. Florası, T.; Ot, Y.; Kaydı, T. Sustainable Weed Management in Maize (Zea mays L.) Production: A Review in Perspective of Southern Asia. Turkish J. Weed Sci. 2018, 21, 36–38. [Google Scholar]
  4. Wang, J.; Hu, X. Research on corn production efficiency and influencing factors of typical farms: Based on data from 12 corn-producing countries from 2012 to 2019. PLoS ONE 2021, 16, e0254423. [Google Scholar] [CrossRef] [PubMed]
  5. Gwirtz, J.A.; Garcia-Casal, M.N. Processing maize flour and corn meal food products. Ann. N. Y. Acad. Sci. 2014, 1312, 66–75. [Google Scholar] [CrossRef]
  6. Rabbani, B.; Safdary, A.J. Effect of sowing date and plant density on yield and yield components of three maize (Zea mays L.) genotypes in Takhar climatic conditions of Afghanistan. Cent. Asian J. Plant Sci. Innov. 2021, 2, 109–120. [Google Scholar] [CrossRef]
  7. Skowera, B.; Puła, J. Global maize production, utilization, and consumption. Acta Agrophysica 2014, 3, 171–177. [Google Scholar]
  8. Shiferaw, B.; Prasanna, B.M.; Hellin, J.; Bänziger, M. Crops that feed the world 6. Past successes and future challenges to the role played by maize in global food security. Food Secur. 2011, 3, 307–327. [Google Scholar] [CrossRef]
  9. Gheith, E.M.S.; El-Badry, O.Z.; Lamlom, S.F.; Ali, H.M.; Siddiqui, M.H.; Ghareeb, R.Y.; El-Sheikh, M.H.; Jebril, J.; Abdelsalam, N.R.; Kandil, E.E. Maize (Zea mays L.) Productivity and Nitrogen Use Efficiency in Response to Nitrogen Application Levels and Time. Front. Plant Sci. 2022, 13, 941343. [Google Scholar] [CrossRef]
  10. García-Chávez, I.; Meraz-Romero, E.; Castelán-Ortega, O.; Zaragoza-Esparza, J.; Avalos, J.O.; Jiménez, L.E.R.; González-Ronquillo, M. Corn silage, a systematic review of the quality and yield in different regions around the world. Cienc. Tecnol. Agropecu. 2022, 23, 1–23. [Google Scholar] [CrossRef]
  11. Gul, H.; Rahman, S.; Shahzad, A.; Gul, S.; Qian, M.; Xiao, Q.; Liu, Z. Maize (Zea mays L.) Productivity in Response to Nitrogen Management in Pakistan. Am. J. Plant Sci. 2021, 12, 1173–1179. [Google Scholar] [CrossRef]
  12. Bogucka, B.; Szempliński, W.; Wróbel, E. Nawożenie azotem a plon kukurydzy uprawianej na ziarno w warunkach północno-wschodniej Polski. Acta Sci. Pol. Agric. 2008, 7, 21–30. [Google Scholar]
  13. Khan, N.A.; Yu, P.; Ali, M.; Cone, J.W.; Hendriks, W.H. Nutritive value of maize silage in relation to dairy cow performance and milk quality. J. Sci. Food Agric. 2015, 95, 238–252. [Google Scholar] [CrossRef]
  14. Gołębiewska, M.; Wróbel, E. Nawożenie azotem a plon i jakość roślin kukurydzy z przeznaczeniem na zakiszenie. Biul. Inst. Hod. i Aklim. Roślin 2010, 256, 117–132. [Google Scholar] [CrossRef]
  15. Szempliński, W.; Bogucka, B.; Wróbel, E. Przydatność mieszańców kukurydzy o zróżnicowanej wczesności do uprawy na kiszonkę w warunkach województwa warmińsko-mazurskiego. Acta Sci. Pol. Agric. 2009, 8, 57–68. [Google Scholar]
  16. Guyader, J.; Baron, V.S.; Beauchemin, K.A. Corn forage yield and quality for silage in short growing season areas of the canadian prairies. Agronomy 2018, 8, 164. [Google Scholar] [CrossRef]
  17. Galassi, G.; Malagutti, L.; Rapetti, L.; Crovetto, G.M.; Zanfi, C.; Capraro, D.; Spanghero, M. Digestibility, metabolic utilisation and effects on growth and slaughter traits of diets containing whole plant maize silage in heavy pigs. Ital. J. Anim. Sci. 2017, 16, 122–131. [Google Scholar] [CrossRef]
  18. Amin, M.E.M.H. Effect of different nitrogen sources on growth, yield and quality of fodder maize (Zea mays L.). J. Saudi Soc. Agric. Sci. 2011, 10, 17–23. [Google Scholar] [CrossRef]
  19. Bogusz, P. The Possibility of Using Waste Phosphates from the Production of Polyols for Fertilizing Purposes. Molecules 2022, 27, 5632. [Google Scholar] [CrossRef]
  20. Bogusz, P.; Rusek, P.; Brodowska, M.S. Suspension Fertilizers Based on Waste Phosphates from the Production of Polyols. Molecules 2022, 27, 7916. [Google Scholar] [CrossRef] [PubMed]
  21. Skowera, B.; Puła, J. Skrajne Warunki Pluwiometryczne w Okresie Wiosennym na Obszarze Polski w Latach 1971-2000. Acta Agrophysica 2004, 3, 171–177. [Google Scholar]
  22. Rutkowski, J. Technologia Uprawy Kukurydzy–od Siewu do Zbioru; Warmińsko-Mazurski Ośrodek Doradztwa Rolniczego: Olsztyn, Poland, 2018. [Google Scholar]
  23. Bereś, P.; Mrówczyński, M.; Roślin, I.O. Metodyka Integrowanej Ochrony i Produkcji Kukurydzy dla Doradców: Opracowanie Zbiorowe; Michalski, T., Ed.; Instytut Ochrony Roślin-Państwowy Instytut Badawczy: Poznań, Poland, 2016; ISBN 9788364655234. [Google Scholar]
  24. Zhao, M.; Feng, Y.; Shi, Y.; Shen, H.; Hu, H.; Luo, Y.; Xu, L.; Kang, J.; Xing, A.; Wang, S.; et al. Yield and quality properties of silage maize and their influencing factors in China. Sci. China Life Sci. 2022, 65, 1655–1666. [Google Scholar] [CrossRef]
  25. Mekonnen, M.M.; Gerbens-Leenes, W. The water footprint of global food production. Water 2020, 12, 2696. [Google Scholar] [CrossRef]
  26. Ferreira, G.; Brown, A.N.; Ferreira, G.; Brown, A.N. Environmental factors affecting corn quality for silage production. In Advances in Silage Production and Utilization; BoD-Books on Demand: Norderstedt, Germany, 2016; pp. 1–15. [Google Scholar]
  27. Bereś, P.; Mrówczyński, M.; Korbas, M.; Kierzek, R.; Węgorek, P.; Sulewska, H.; Szulc, P.; Siódmiak, J. Metodyka Integrowanej Ochrony Kukurydzy dla Producentów; Michalski, T., Ed.; Instytut Ochrony Roślin: Poznań, Poland, 2013; ISBN 978-83-89867-97-1. [Google Scholar]
  28. Sawan, Z.M. Climatic variables: Evaporation, sunshine, relative humidity, soil and air temperature and its adverse effects on cotton production. Inf. Process. Agric. 2018, 5, 134–148. [Google Scholar] [CrossRef]
  29. Koca, Y.O.; Canavar, Ö. The Effect of Sowing Date on Yield and Yield Components and Seed Quality of Corn (Zea mays L.). 2014; Volume LVII, pp. 227–231. Available online: https://agronomyjournal.usamv.ro/pdf/2014/art40.pdf (accessed on 15 April 2024).
  30. Kamara, A.Y.; Ekeleme, F.; Chikoye, D.; Omoigui, L.O. Planting date and cultivar effects on grain yield in dryland corn production. Agron. J. 2009, 101, 91–98. [Google Scholar] [CrossRef]
  31. Testa, G.; Reyneri, A.; Blandino, M. Maize grain yield enhancement through high plant density cultivation with different inter-row and intra-row spacings. Eur. J. Agron. 2016, 72, 28–37. [Google Scholar] [CrossRef]
  32. Rahmani, A.; Alhossini, M.; Khorasani, S. Effect of Planting Date and Plant Densities on Yield and Yield Components of Sweet Corn (Zea mays L. var saccharata). Am. J. Exp. Agric. 2016, 10, 1–9. [Google Scholar] [CrossRef]
  33. Sharratt, B.S.; McWilliams, D.A. Microclimatic and rooting characteristics of narrow-row versus conventional-row corn. Agron. J. 2005, 97, 1129–1135. [Google Scholar] [CrossRef]
  34. Zhang, F.; Wang, X.; Lu, W.; Li, F.; Ma, C. Improved Quality of Corn Silage When Combining Cellulose-Decomposing Bacteria and Lactobacillus buchneri during Silage Fermentation. Biomed Res. Int. 2019, 2019, 4361358. [Google Scholar] [CrossRef]
  35. Gurmu, S.; Biya, M.; Yadete, E. Effect of NP Fertilizer Rates and Plant Population Density on Late Maturing Maize Variety at Jimma and Buno-Bedele Zone, Southwestern Ethiopia. J. Environ. Earth Sci. 2020, 10, 1–9. [Google Scholar] [CrossRef]
  36. Ferreira, G.; Alfonso, M.; Depino, S.; Alessandri, E. Effect of planting density on nutritional quality of green-chopped corn for silage. J. Dairy Sci. 2014, 97, 5918–5921. [Google Scholar] [CrossRef]
  37. Morris, T.F.; Murrell, T.S.; Beegle, D.B.; Camberato, J.J.; Ferguson, R.B.; Grove, J.; Ketterings, Q.; Kyveryga, P.M.; Laboski, C.A.M.; McGrath, J.M.; et al. Strengths and limitations of Nitrogen rate recommendations for corn and opportunities for improvement. Agron. J. 2018, 110, 1–37. [Google Scholar] [CrossRef]
Figure 1. Drone photo of experimental plots in the third year of research—marked plots show objects without fertilization.
Agronomy 14 01054 g001
Figure 2. Box-plot showing the distribution of the amount of dry matter for individual objects in the field experiment, taking into account the median value, the range between 25 and 75% of the results, the range of non-outlier results and outliers.
Agronomy 14 01054 g002
Figure 3. Box-plot showing the distribution of plant heights for individual objects in the field experiment, taking into account the median value, the range between 25 and 75% of the results, the range of non-outlier results and outlier values.
Agronomy 14 01054 g003
Table 1. Division of fertilizers used in the field experiment according to their composition and the nitrogen dose applied (a—180 kg∙ha−1; b—135 kg∙ha−1).
Basic Composition NPK9.5-4-11 9.5-6-11 0
P, %4 6 0
P sourceWaste Fosdar Waste Fosdar
0
Type of fertilizerNPKNPK
S Mg
NPK
S Mg
micro
NPK NPKNPK
S Mg
NPK
S Mg
micro
NPK 0
Fertilizer123 K2 456 K3
K1
N dosea ba ba b a b a ba ba b a b 0
Table 2. Average monthly air temperatures (°C) throughout the field experiment.
YearsMonthsAvg.
IVVVIVIIVIIIIX
I6.412.619.722.317.312.815.2
II5.912.819.419.420.510.813.1
III8.212.917.420.021.017.616.1
Avg.6.812.818.820.619.613.7
Avg. 2011–20209.514.418.520.119.714.7
Table 3. Monthly totals of rainfall (mm) throughout the field experiment.
YearsMonthsAvg.
IVVVIVIIVIIIIX
I49.155.743.243.0231.762.180.7
II53.236.338.7111.852.3112.367.4
III57.966.060.084.746.428.557.3
Avg.53.452.747.379.8110.167.6
Avg. 2011–202040.880.364.391.354.960.2
Table 4. Division of the Sielianinow coefficient into classes.
Color Codingk-Factor RangeDescription
k ≤ 0.4Extremely dry conditions
0.4 < k ≤ 0.7 Very dry conditions
0.7 < k ≤ 1.0 Dry conditions
1.0 < k ≤ 1.3 Quite dry conditions
1.3 < k ≤ 1.6 Optimal conditions
1.6 < k ≤ 2.0 Quite humid conditions
2.0 < k ≤ 2.5 Humid conditions
2.5 < k ≤ 3.0 Very humid conditions
k > 3.0Extremely humid conditions
Table 5. Sielininov’s coefficient values throughout the field research period.
YearsMonths
IVVVIVIIVIIIIX
I2.561.430.730.624.321.62
II3.010.910.661.860.823.47
III2.351.651.151.370.710.54
Table 6. Average amount of dry matter (t∙ha−1) and division into homogeneous groups using the Tukey test (HSD) for α = 0.05 due to the source of phosphorus and its percentage in the fertilizer.
YearN dose, kg N/ha (C)Source of Phosphorus in Fertilizer (A)Control
without
Fertilization
Polyol WasteFosdar (Control)
Percentage of P (B)
4%6%Avg.4%6%Avg.
I18024.74
ab
24.86
ab
24.80
GH
25.90
b
26.13
b
26.02
H
19.27
c
13522.87
a
24.98
ab
23.93
H
25.53
b
25.72
b
25.63
H
Avg.23.81
G
24.92
GH
25.71
H
25.93
H
Avg.24.36
G
25.82
H
A–Ƞ2p = 51.57%
B–s.i.
C–s.i.A × B–s.i.
A × C–s.i.
B × C–s.i.
A × B × C–s.i.
II18023.41
ab
23.48
ab
23.45
G
23.11
ab
24.55
b
23.83
G
18.52
c
13522.45
a
24.32
ab
23.39
G
22.99
ab
23.99
ab
23.49
G
Avg.22.93
G
23.90
GH
23.05
G
24.27
H
Avg.23.42
G
23.66
G
A–s.i.
B–Ƞ2p = 45.80%
C–s.i.A × B–s.i.
A × C–s.i.
B × C–s.i.
A × B × C–s.i.
III18023.98
a
24.43
a
24.21
G
24.80
a
24.91
a
24.85
G
19.31
b
13523.05
a
24.22
a
23.64
G
24.84
a
25.08
a
24.96
G
Avg.23.52
G
24.33
GH
24.82
GH
24.99
H
Avg.23.92
G
24.91
H
A–Ƞ2p = 32.52%
B–s.i.
C–s.i.A × B–s.i.
A × C–s.i.
B × C–s.i.
A × B × C–s.i.
Table 7. Average amount of dry matter (t∙ha−1) and division into homogeneous groups using the Tukey test (HSD) for α = 0.05 due to the type of suspension fertilizer and the percentage of phosphorus.
YearN Dose, kg N/ha (C)Percentage of P (A)
4%6%
Type of Fertilizer (B)
NPKNPK S MgNPK S Mg MicroAvg.NPKNPK S MgNPK S Mg MicroAvg.
I18024.74
ab
25.71
a
25.22
ab
25.22
G
24.86
ab
25.14
ab
25.71
a
25.24
G
13522.87
b
24.92
ab
24.97
ab
24.25
G
24.98
ab
24.67
ab
25.55
ab
25.07
G
Avg.23.81
G
25.31
GH
25.10
GH
24.92
GH
24.91
GH
25.63
H
Avg.24.74
G
25.15
G
A–s.i.
B–Ƞ2p = 26.72%
C–s.i.A × B–s.i.
A × C–s.i.
B × C–s.i.
A × B × C–s.i.
II18023.41
a
24.81
a
24.08
a
24.10
G
23.48
a
24.21
a
24.76
a
24.15
G
13522.45
a
23.44
a
24.10
a
23.33
G
24.32
a
24.13
a
24.44
a
24.30
G
Avg.22.93
G
24.12
GH
24.09
GH
23.90
GH
24.17
GH
24.60
H
Avg.23.71
G
24.22
G
A–s.i.
B–Ƞ2p = 26.93%
C–s.i.A × B–s.i.
A × C–s.i.
B × C–s.i.
A × B × C–s.i.
III18023.98
a
23.90
a
24.53
a
24.14
GH
24.43
a
24.64
a
25.59
a
24.89
H
13523.05
a
24.06
a
23.30
a
23.47
G
24.22
a
24.51
a
25.10
a
24.61
GH
Avg.23.52
G
23.98
GH
23.91
GH
24.33
GH
24.57
GH
25.35
H
Avg.23.80
G
24.75
H
A–Ƞ2p = 27.45%
B–s.i.
C–s.i.A × B–s.i.
A × C–s.i.
B × C–s.i.
A × B × C–s.i.
Table 8. Average height of plants (cm) and division into homogeneous groups using the Tukey test (HSD) for α = 0.05 due to the source of phosphorus and its percentage in the fertilizer.
YearN Dose, kg N/ha (C)Source of Phosphorus in Fertilizer (A)Control without
Fertilization
Polyol WasteFosdar (Control)
Percentage of P (B)
4%6%Avg.4%6%Avg.
I180283.71
b
280.67
ab
282.19
GH
287.42
b
285.71
b
286.56
H
256.75
c
135272.29
a
285.29
b
278.79
G
285.38
b
282.54
ab
283.96
GH
Avg.278.00
G
282.98
GH
286.40
H
284.13
GH
Avg.280.49
G
285.26
H
A–Ƞ2p = 4.02%
B–s.i.*
C–s.i.A × B–Ƞ2p = 2.36%
A × C–s.i.
B × C–Ƞ2p = 2.49%
A × B × C–Ƞ2p = 3.28%
II180274.04
ab
279.88
abc
276.96
GH
284.38
bc
281.67
abc
283.02
G
254.38
d
135273.04
a
273.38
ab
273.21
H
281.38
abc
286.13
c
283.75
G
Avg.273.45
G
276.63
GH
282.88
HI
283.90
I
Avg.275.08
G
283.39
H
A–Ƞ2p = 9.13%
B–s.i.
C–s.i.A × B–s.i.
A × C–s.i.
B × C–s.i.
A × B × C–s.i.
III180272.21
a
274.08
a
273.15
G
274.38
a
278.17
a
276.27
G
243.08
b
135273.57
a
275.29
a
274.48
G
276.83
a
278.50
a
277.67
G
Avg.272.94
G
274.69
G
275.60
G
278.33
G
Avg.273.81
G
276.97
G
A–s.i.
B–s.i.
C–s.i.A × B–s.i.
A × C–s.i.
B × C–s.i.
A × B × C–s.i.
* Statistically insignificant.
Table 9. Average plant heights (cm) and division into homogeneous groups using the Tukey test (HSD) for α = 0.05 due to the type of suspension fertilizer and the percentage of phosphorus.
YearN Dose, kg N/ha (C)Percentage of P (A)
4% 6%
Type of Fertilizer (B)
NPKNPK S MgNPK S Mg MicroAvg.NPKNPK S MgNPK S Mg MicroAvg.
I180283.71
a
285.88
a
287.92
a
285.83
H
280.67
ab
283.87
a
287.88
a
284.14
GH
135272.29
b
283.88
a
287.75
a
281.31
H
285.29
a
284.58
a
286.50
a
285.46
GH
Avg.278.00
G
284.88
H
287.83
H
282.98
GH
284.23
H
287.19
H
Avg.283.57
G
284.80
G
A–s.i.
B–Ƞ2p = 7.68%
C–s.i.A × B–s.i.
A × C–Ƞ2p = 2.10%
B × C–s.i.
A × B × C–Ƞ2p = 3.31%
II180274.00
ac
280.71
abcd
285.29
abd
280.55
G
279.88
abcd
284.71
abd
285.79
bd
283.46
G
135273.04
c
276.25
abc
275.67
abc
274.99
H
273.38
c
287.21
d
284.71
abd
281.76
G
Avg.273.54
G
278.48
GH
280.48
HI
276.63
GH
285.96
I
285.25
I
Avg.277.50
G
282.61
H
A–Ƞ2p = 4.87%
B–Ƞ2p = 8.87%
C–Ƞ2p = 2.16%A × B–s.i.
A × C–s.i.
B × C–s.i.
A × B × C–s.i.
III180272.21
a
283.04
abc
280.67
abc
278.64
G
274.08
ab
286.13
abc
288.83
c
283.01
G
135273.67
ab
275.67
abc
282.50
abc
277.28
G
275.29
abc
282.63
abc
287.17
bc
281.69
G
Avg.278.94
G
279.35
GHI
281.58
HIJ
274.69
GH
284.38
IJ
288.00
J
Avg.277.96
G
282.35
H
A–Ƞ2p = 2.26%
B–Ƞ2p = 9.34%
C–s.i.A × B–s.i.
A × C–s.i.
B × C–s.i.
A × B × C–s.i.
Table 10. The ratio of the mass of cobs to the total green fodder (%) and division into homogeneous groups using the Tukey test (HSD) for α = 0.05 due to the source of phosphorus and its percentage content in the fertilizer.
YearN Dose, kg N/ha (C)Source of Phosphorus in Fertilizer (A)Control without
Fertilization
Polyol WasteFosdar (Control)
Percentage of P (B)
4%6%Avg.4%6%Avg.
I18045.37
a
45.68
a
45.52
G
44.97
a
45.02
a
44.99
G
38.21
b
13545.60
a
45.07
a
45.34
G
45.04
a
45.81
a
45.43
G
Avg.45.48
G
45.38
G
45.39
G
45.03
G
A–s.i.
B–s.i.
C–s.i.A × B–s.i.
A × C–s.i.
B × C–s.i.
A × B × C–s.i.
II18045.75
ab
45.67
ab
45.71
G
47.91
b
46.59
b
47.25
G
38.58
a
13545.99
ab
46.23
ab
46.11
G
46.83
b
44.95
ab
45.89
G
Avg.45.87
G
45.95
G
47.37
G
45.77
G
A–s.i.
B–s.i.
C–s.i.A × B–s.i.
A × C–s.i.
B × C–s.i.
A × B × C–s.i.
III18045.43
a
44.86
a
45.15
AG
45.47
a
46.16
a
45.81
G
36.97
b
13545.36
a
47.44
a
46.40
G
47.22
a
45.4546.34
G
Avg.45.39
G
46.15
G
46.35
G
45.80
G
A–s.i.
B–s.i.
C–s.i.A × B–s.i.
A × C–s.i.
B × C–s.i.
A × B × C–s.i.
Table 11. The ratio of the mass of cobs to the total green fodder (%) and division into homogeneous groups using the Tukey test (HSD) for α = 0.05 due to the type of suspension fertilizer and the percentage of phosphorus.
YearN Dose, kg N/ha (C)Percentage of P (A)
4% 6%
Type of Fertilizer (B)
NPKNPK S MgNPK S Mg MicroAvg.NPKNPK S MgNPK S Mg MicroAvg.
I18045.37
a
46.21
a
45.74
a
45.77
G
45.68
a
46.05
a
45.11
a
45.61
G
13545.60
a
45.34
a
45.40
a
45.45
G
45.07
a
46.20
a
45.19
a
45.49
G
Avg.45.48
G
45.77
G
45.57
G
45.38
G
46.13
G
45.15
G
A–s.i.
B–s.i.
C–s.i.A × B–s.i.
A × C–s.i.
B × C–s.i.
A × B × C–s.i.
II18045.75
a
45.20
a
48.59
a
46.51
G
45.67
a
46.83
a
48.27
a
46.92
G
13545.99
a
45.38
a
45.19
a
45.52
G
46.23
a
45.38
a
46.10
a
45.90
G
Avg.45.87
G
45.29
G
46.89
G
45.95
G
46.10
G
47.18
G
A–s.i.
B–s.i.
C–s.i.A × B–s.i.
A × C–s.i.
B × C–s.i.
A × B × C–s.i.
III18045.43
a
46.76
a
44.79
a
45.66
G
44.86
a
44.80
a
46.20
a
45.29
G
13545.36
a
46.18
a
45.75
a
45.76
G
47.44
a
45.30
a
46.67
a
46.47
G
Avg.45.39
G
46.47
G
45.27
G
46.15
G
45.05
G
46.43
G
A–s.i.
B–s.i.
C–s.i.A × B–s.i.
A × C–s.i.
B × C–s.i.
A × B × C–s.i.
Table 12. Average number of cobs per plant (pcs) and division into homogeneous groups using the Tukey test (HSD) for α = 0.05 due to the source of phosphorus and its percentage in the fertilizer.
YearN Dose, kg N/ha (C)Source of Phosphorus in Fertilizer (A)Control without
Fertilization
Polyol WasteFosdar (Control)
Percentage of P (B)
4%6%Avg.4%6%Avg.
I1801.63
a
1.83
a
1.73
G
1.79
a
1.67
a
1.73
G
1.71
a
1351.67
a
1.83
a
1.75
G
1.75
a
1.88
a
1.81
G
Avg.1.65
G
1.83
G
1.77
G
1.77
G
Avg.1.74
G
1.77
H
A–s.i.
B–s.i.
C–s.i.A × B–s.i.
A × C–s.i.
B × C–s.i
A × B × C–s.i.
II1801.50
a
1.54
a
1.52
G
1.75
a
1.79
a
1.77
GH
1.58
a
1351.83
a
1.83
a
1.83
H
1.67
a
1.63
a
1.65
GH
Avg.1.67
G
1.69
G
1.71
G
1.71
G
Avg.1.68
G
1.71
G
A–s.i.
B–s.i.
C–s.i.A × B–s.i.
A × C–Ƞ2p = 4.97%
B × C–s.i.
A × B × C–s.i.
III1801.58
a
1.33
a
1.46
G
1.46
a
1.50
a
1.48
G
1.25
a
1351.33
a
1.25
a
1.29
G
1.67
a
1.33
a
1.50
G
Avg.1.46
GH
1.29
G
1.56
H
1.42
GH
Avg.1.38
G
1.49
G
A–s.i.
B–Ƞ2p = 2.58%
C–s.i.A × B–s.i.
A × C–s.i.
B × C–s.i.
A × B × C–s.i.
Table 13. Average number of cobs per plant (pcs) and division into homogeneous groups using the Tukey test (HSD) for α = 0.05 due to the type of suspension fertilizer and the percentage of phosphorus.
YearN Dose, kg N/ha (C)Percentage of P (A)
4% 6%
Type of Fertilizer (B)
NPKNPK S MgNPK S Mg MicroAvg.NPKNPK S MgNPK S Mg MicroAvg.
I1801.63
a
1.67
a
1.71
a
1.67
G
1.83
a
1.88
a
1.88
a
1.86
G
1351.67
a
1.79
a
1.75
a
1.74
G
1.83
a
1.67
a
1.71
a
1.74
G
Avg.1.65
G
1.73
G
1.73
G
1.83
G
1.77
G
1.79
G
Avg.1.70
G
1.80
G
A–s.i.
B–s.i.
C–s.i.A × B–s.i.
A × C–s.i.
B × C–s.i.
A × B × C–s.i.
II1801.50
a
1.67
a
1.71
a
1.62
G
1.54
a
1.67
a
1.83
a
1.68
G
1351.83
a
1.46
a
1.58
a
1.63
G
1.83
a
1.63
a
1.88
a
1.78
G
Avg.1.67
GH
1.56
G
1.65
GH
1.69
GH
1.65
GH
1.85
H
Avg.1.63
G
1.73
G
A–s.i.
B–s.i.
C–Ƞ2p = 2.16%A × B–s.i.
A × C–s.i.
B × C–Ƞ2p = 3.69%
A × B × C–s.i.
III1801.58
ab
1.38
ab
1.78
b
1.56
H
1.33
ab
1.17
a
1.21
a
1.24
H
1351.33
ab
1.50
ab
1.75
b
1.53
H
1.25
a
1.50
ab
1.33
ab
1.36
GH
Avg.1.46
GH
1.44
G
1.73
H
1.29
G
1.33
G
1.27
G
Avg.1.30
G
1.54
H
A–Ƞ2p = 6.55%
B–s.i.
C–s.i.A × B–Ƞ2p = 2.75%
A × C–s.i.
B × C–Ƞ2p = 3.07%
A × B × C–s.i.
Table 14. Average number of rows of grains in a cob (pieces) and division into homogeneous groups using the Tukey test (HSD) for α = 0.05 due to the source of phosphorus and its percentage in the fertilizer.
YearN Dose, kg N/ha (C)Source of Phosphorus in Fertilizer (A)Control without
Fertilization
Polyol WasteFosdar (Control)
Percentage of P (B)
4%6%Avg.4%6%Avg.
I18014.33
ab
13.83
ab
14.08
G
13.88
ab
14.79
b
14.33
G
13.71
ab
13514.38
ab
13.96
ab
14.17
G
14.13
ab
13.33
a
13.73
G
Avg.14.35
G
13.90
G
14.00
G
14.06
G
Avg.14.13
G
14.03
G
A–s.i.
B–s.i.
C–s.i.A × B–s.i.
A × C–s.i.
B × C–Ƞ2p = 1.91%
A × B × C–Ƞ2p = 2.31%
II18014.13
a
14.88
ab
14.50
G
14.83
ab
15.33
ab
15.08
G
15.08
ab
13514.58
ab
15.00
ab
14.79
G
15.71
b
14.83
ab
15.27
G
Avg.14.35
G
14.94
GH
15.27
H
15.08
GH
Avg.14.65
G
15.18
H
A–Ƞ2p = 2.58%
B–s.i.
C–s.i.A × B–s.i.
A × C–s.i.
B × C–Ƞ2p = 2.14%
A × B × C–s.i.
III18013.96
ab
14.29
abc
14.13
G
15.13
c
14.67
abc
14.90
H
14.63
abc
13514.92
bc
13.67
a
14.29
GH
14.46
abc
14.54
abc
14.50
GH
Avg.14.44
GH
13.98
G
14.79
H
14.60
GH
Avg.14.21
G
14.70
H
A–Ƞ2p = 3.36%
B–s.i.
C–s.i.A × B–s.i.
A × C–s.i.
B × C–s.i.
A × B × C–Ƞ2p = 3.94%
Table 15. Average number of grain rows in a cob (pieces) and division into homogeneous groups using the Tukey test (HSD) for α = 0.05 due to the type of suspension fertilizer and the percentage of phosphorus.
YearN Dose, kg N/ha (C)Percentage of P (A)
4% 6%
Type of Fertilizer (B)
NPKNPK S MgNPK S Mg MicroAvg.NPKNPK S MgNPK S Mg MicroAvg.
I18014.33
ab
14.50
ab
13.96
ab
14.26
G
13.83
a
14.63
ab
15.21
b
14.56
G
13514.38
ab
14.29
ab
14.38
ab
14.35
G
13.96
ab
14.54
ab
14.54
ab
14.35
G
Avg.14.35
GH
14.40
GH
14.17
GH
13.90
G
14.58
GH
14.87
H
Avg.14.31
G
14.45
G
A–s.i.
B–s.i.
C–s.i.A × B–Ƞ2p = 3.17%
A × C–s.i.
B × C–s.i.
A × B × C–s.i.
II18014.13
a
15.00
a
14.92
a
14.68
G
14.88
a
14.58
a
14.08
a
14.51
G
13514.58
a
14.75
a
14.92
a
14.75
G
15.00
a
14.75
a
14.33
a
14.69
G
Avg.14.35
G
14.88
G
14.92
G
14.94
G
14.67
G
14.21
G
Avg.14.72
G
14.60
G
A–s.i.
B–s.i.
C–s.i.A × B–Ƞ2p = 3.83%
A × C–s.i.
B × C–s.i.
A × B × C–s.i.
III18013.96
a
14.08
a
14.38
a
14.14
G
14.29
a
14.46
a
13.92
a
14.22
G
13514.92
a
14.38
a
14.67
a
14.65
G
13.67
a
14.46
a
14.38
a
14.17
G
Avg.14.44
G
14.23
G
14.52
G
13.98
G
14.46
G
14.15
G
Avg.14.40
G
14.19
G
A–s.i.
B–s.i.
C–s.i.A × B–s.i.
A × C–s.i.
B × C–s.i.
A × B × C–s.i.
Disclaimer/Publisher’s Note: The statements, opinions and data contained in all publications are solely those of the individual author(s) and contributor(s) and not of MDPI and/or the editor(s). MDPI and/or the editor(s) disclaim responsibility for any injury to people or property resulting from any ideas, methods, instructions or products referred to in the content.

