Article

Predictive Modeling for Microchannel Flow Boiling Heat Transfer under the Dual Effect of Gravity and Surface Modification

1
School of Physics, Sun Yat-sen University, Guangzhou 510006, China
2
China Shuifa Singyes Energy Holdings Limited, Zhuhai 519000, China
3
Shuifa Energy Engineering Co., Ltd., Zhuhai 519000, China
4
Shuifa Singyes Energy (Zhuhai) Co., Ltd., Zhuhai 519000, China
*
Author to whom correspondence should be addressed.
Processes 2024, 12(5), 1028; https://doi.org/10.3390/pr12051028
Submission received: 26 April 2024 / Revised: 15 May 2024 / Accepted: 17 May 2024 / Published: 19 May 2024
(This article belongs to the Section Energy Systems)

Abstract

:
This paper investigates the heat transfer performance of flow boiling in microchannels under the dual effect of gravity and surface modification through both experimental studies and mechanistic analysis. Utilizing a test bench with microchannels featuring surfaces of varying wettability levels and adjustable flow directions, multiple experiments on R134-a flow boiling heat transfer under the effects of gravity and surface modification were conducted, resulting in 1220 sets of experimental data. The mass flux ranged from 735 kg/m2s to 1271 kg/m2s, and the heating heat flux density ranged from 9 × 10³ W/m2 to 46 × 103 W/m2. The experimental results revealed the differences in the influence of different gravity and surface modification conditions on heat transfer performance. It was found that the heat transfer performance of super-hydrophilic surfaces in horizontal flow is optimal and more stable heat transfer performance is observed when gravity is aligned with the flow direction. And the impact of gravity and surface modification on heat transfer has been explained through mechanistic analysis. Therefore, two new dimensionless numbers, Fa and Conew, were introduced to characterize the dual effects of gravity and surface modification on heat transfer. A new heat transfer model was developed based on these effects, and the prediction error of the heat transfer coefficient was reduced by 12–15% compared to existing models, significantly improving the prediction accuracy and expanding its application scope. The applicability and accuracy of the new model were also validated with other experimental data.

1. Introduction

With the advancement of science and technology, there is an urgent need to address high heat flux issues in electronic components [1,2,3,4], necessitating innovative cooling methods. Microchannel cooling technology provides an efficient heat dissipation solution for these compact, high-heat-flux components [5,6,7,8,9]. In the field of photovoltaic power generation, concentrated photovoltaic (CPV) cells operate typically under 500–1000 times concentration, resulting in extremely high heat flux densities and demanding heat dissipation requirements. Moreover, the non-uniform temperature distribution significantly degrades the photovoltaic performance of CPV cells [10,11]. In the energy storage sector, during the charging and discharging processes of energy storage batteries, the accumulation of reaction heat and Joule heat over time leads to uneven heat accumulation within the battery due to stacking issues. This temperature variation within the battery cell stack results in inconsistencies in internal resistance and capacity among individual cells. Prolonged operation under significant temperature differences can cause some cells to overcharge or over-discharge, thereby impacting the lifespan and performance of the energy storage system and potentially posing safety hazards [12,13]. At the same time, small-sized, high-heat-flux computer chips are also the most suitable application scenarios for microscale phase-change heat dissipation. To address these challenges, microchannel phase-change cooling technology offers advantages such as high heat dissipation capability, excellent thermal performance, and constant temperature cooling. Hence, it finds applications in these domains. Due to their size effects [14] and surface tension effects [15], microchannels can quickly reach the nucleate boiling stage with the highest heat transfer coefficient, thereby improving the average heat transfer coefficient throughout the flow process. Surface modifications have a significant impact on heat transfer in the use of microchannels [16,17,18], and the orientation of the heat exchanger can also cause gravity to play different roles in the flow process [19].
Regarding the influence of gravity, existing research has shown its effect on the heat transfer process. First and foremost, it should be clarified that in order to alter the influence of gravity in flow boiling, one can achieve this by changing the relationship between the direction of working fluid flow and the direction of gravity within the microchannel. Devahdhanush and Mudawar et al. [20] conducted flow boiling heat transfer experiments under gravity in a vertical upward flow, summarizing the performance and key parameters of the flow process under conditions such as single-sided and double-sided heating, high subcooling and near-saturation at the inlet, and low and high mass fluxes. Visualization showed the variations in bubble activity in the boundary layer, and changes in local and average heat transfer coefficients as well as the onset of nucleate boiling under different conditions were presented. Konishi et al. [21] explored the mechanism of critical heat flux in flow boiling of working fluid FC-72 in a rectangular channel with a heated wall, focusing on the triggering mechanisms for critical heat flux density under different flow directions, mass fluxes, and inlet dryness. They pointed out that flow direction has a greater influence on critical heat flux density at low mass flux, and less so at high mass flux. Saisorn et al. [22] conducted flow boiling experiments using R134a in stainless steel circular channels with a diameter of 1 mm, in horizontal, vertical upward, and vertical downward flow directions. They found that the heat transfer coefficient was highest for vertical downward flow, but it also resulted in the largest pressure drop. On the other hand, the heat transfer coefficient was moderate for vertical upward flow, with the lowest pressure drop. Gao et al. [23] investigated the flow boiling heat transfer coefficients in horizontal and vertical downward flow directions in small-scale channel evaporators. They found that when the mass flux was less than 264.3 kg/m2s and the heat flux was less than 3.0 W/cm2, the difference in heat transfer coefficients between vertical downward flow and horizontal flow exceeded 10%. Some studies have also elucidated the relationship between the differences in heat transfer coefficients in different flow orientations and bubble activity during two-phase flow boiling [24,25,26]. Although the existing studies involve different working fluids and various pipeline designs and operating conditions, they consistently demonstrate significant differences in average heat transfer coefficients between horizontal and vertical flow directions, indicating varying degrees of gravity influence. While there is no definitive conclusion on which flow direction exhibits better heat transfer performance, there is certainly a noticeable difference between the two that cannot be overlooked.
Surface modification techniques alter the structure of the channel surface, rendering it hydrophobic, hydrophilic, or super-hydrophilic, thereby influencing two-phase flow dynamics and affecting heat transfer performance. Li et al. [27] conducted experiments on saturated flow boiling in a high-aspect-ratio, single-sided heated rectangular microchannel using deionized water as the working fluid. They found that due to the capillary wetting effects of hydrophobic ZnO micro-rod surfaces, there was no local dry-out or rewetting in the experiments. Furthermore, these surfaces had numerous nucleation sites and led to greater disruption of the annular flow liquid film by transient bubble flow, ultimately resulting in severe heat transfer deterioration under high heat flux. Li et al. [28] and Ren et al. [29] created a large number of micro-holes or micro-grooves on the surface of microchannels, which improved the wettability of the channel surface. This maintained the integrity of the liquid film during flow boiling and facilitated high-frequency re-wetting. Numerically, they observed average heat transfer coefficient enhancements of 208% and 72%, respectively, in their experiments. Additionally, they observed a decrease in the pressure drop. These findings suggest that surface modification of the channels has a positive impact on the heat transfer performance of microchannels. In our preliminary research, Zhou et al. [30] mechanistically explained the differences between hydrophilic, super-hydrophilic, and regular surface microchannels, stating that the structure of super-hydrophilic surfaces can affect the forces acting on two-phase flows during flow boiling, making the sum of surface tension and inertial forces greater than (or equal to) the sum of evaporative momentum force and shear force, thus reducing the flow resistance and avoiding drying. And Zhang et al. [31] improved the accuracy of pressure drop prediction for microchannels with different wetting surfaces by introducing a flow order degree and combining it with a pressure drop prediction model. Meanwhile, several studies have also shown the promoting effects of super-hydrophilic surfaces on the flow process and the enhancement of the average heat transfer coefficient, effectively suppressing dry-out phenomena during boiling [32,33]. These studies all indicate that surface modification, especially transforming surfaces into hydrophilic or super-hydrophilic ones, has a positive impact on the heat transfer performance of flow boiling inside microchannels.
Existing research has shown us the individual effects of gravity and surface modification on the heat transfer performance of microchannels. In short, hydrophilic surfaces can enhance heat transfer performance by promoting flow, while the varying effects of gravity can also influence heat transfer performance. Additionally, in practical applications, it is unavoidable to use heat exchangers in tilted positions. In such cases, the degree of gravity’s influence will also be altered. When both effects occur simultaneously, how the dual effect affects the heat transfer performance of microchannels is an essential topic for research. This paper focuses on designing experiments that incorporate extreme gravity conditions and surface modification factors, attempting to reflect the dual effects of both factors in its predictive model, which can indicate the magnitude of their influence mathematically.

2. Experiments and Results Analysis

2.1. Experimental Apparatus

Our experimental apparatus consists of a gas–liquid two-phase flow circulation system. The system uses R134-a refrigerant as the working fluid. In the experimental process, the working fluid first flows out of the storage tank and passes through a filter, then is accelerated by a gear pump and flows through a volumetric flow meter. The gear pump provides the necessary power and adjusts the flow velocity for the working fluid, while the volumetric flow meter ensures that we can adjust the flow rate as required for the experiment. After this, the working fluid enters a preheating section to adjust its inlet vapor quality. Upon completing this process, the working fluid enters the microchannel test section for heat exchange experiments, and temperature and pressure data are recorded. Finally, the working fluid enters the condenser, where it is cooled to saturation or a subcooling state before returning to the storage tank, completing one cycle. In the laboratory, a constant temperature of 20 °C is maintained. Prior to the experiment, the experimental system is evacuated using a vacuum pump to ensure that the air pressure within the experimental circuit is maintained below 0.1 kPa. Then, saturated R134a from the reservoir tank is introduced into the circuit, filling the entire loop, to prevent external temperature changes and the presence of air within the circuit from affecting the experiment.
It is worth noting that both the preheating and testing sections use electric heating methods, where the electric power to the heating wire is controlled. In the testing section, temperature and pressure data are gathered using thermocouples and a differential pressure transmitter connected to a data acquisition system. A high-speed camera is used to capture visual images of the flow process. In the condenser section, a fully enclosed water-cooling system is used, with the temperature set at 20 °C to control the working fluid’s temperature below saturation.
The microchannel test section is based on an aluminum substrate and has three parallel channels distributed across it. The microchannel surfaces were corroded with a mixed solution of 500 mL, 0.5 mol/L copper sulfate and sodium chloride for 60 s and 40 s respectively. Subsequently, they were rinsed with deionized water and cleaned using an ultrasonic cleaner, followed by drying to obtain super-hydrophilic and hydrophilic microchannel surfaces. The contact angle test images and SEM images of the hydrophilic surface and super-hydrophilic surface obtained after corrosion, as well as the untreated ordinary surface, are shown in Figure 1. From the figure, it can be observed that the ordinary surface was relatively smooth and flat, while the hydrophilic and super-hydrophilic surfaces were rough and had many uneven surface features. The dimensions of the test section are presented in Table 1.

2.2. Methods of Controlling the Influence of Gravity

In order to vary the influence of gravity during the experiment, three extreme gravity conditions were designed: vertical upward, horizontal, and vertical downward. When the working fluid flowed in the vertical direction, the direction of gravity was collinear with the flow direction. Gravity was aligned or opposed to the flow direction. When the working fluid flowed in the horizontal direction, the direction of gravity was perpendicular to the flow direction, and the influence of gravity was considered to be the weakest at this point. Through this method, the extent of gravity’s influence on the two-phase flow became variable. To maintain consistent data collection and visualization during the tilting process, both the data acquisition instruments and the high-speed camera were rotated along with the test section to preserve optimal contact and observation angles.
For the horizontal experiments, the test bench was positioned horizontally, and the recording equipment was vertically oriented for the purpose of capturing images. To set up the vertical upward flow experiment, the test section was rotated in alignment with the existing flow circuit of the test bench, ensuring that the fluid flowed in an upward direction as it passed through the test section. Following the completion of the vertical upward flow experiments, the test bench was modified to invert the test section, altering the flow direction to downward. The data acquisition and imaging equipment were also rotated correspondingly, and the system was calibrated for use.
The schematic diagram of the experimental system and the test section is shown in Figure 2, with the test section located at the position of the evaporator in the refrigeration cycle. A physical representation of the test section in different orientations is shown in Figure 3, with the flow direction of the working fluid and the direction of gravity labeled. In addition, the operating conditions of this experiment and the uncertainties of various physical quantities are shown in Table 2 and Table 3.

2.3. Experimental Data Processing Method

In the experimental section, we conducted a total of five experiments: horizontal flow with ordinary surface, horizontal flow with hydrophilic surface, horizontal flow with super-hydrophilic surface, vertical upward flow with super-hydrophilic surface, and vertical downward flow with super-hydrophilic surface. The working fluid that flowed out of the storage tank was considered to be in a saturated state. The heat transfer and pressure drop between the initial pressure measurement location and the pump outlet were negligible; therefore, the working fluid in this segment was also considered to be saturated. The pump speed and ambient temperature between the initial pressure measurement location and the entrance to the pre-heating section were constant, leading to a fixed mass flow rate in the test section. By adjusting the power input to the pre-heating section, the vapor quality at the entrance of the microchannel could be controlled.
According to the principle of energy conservation, the inlet vapor quality can be calculated as follows:
x i n = h f , r e s + P m ˙ h f , i n h f g , i n
where h f , r e s is the saturated liquid enthalpy based on the pressure in the storage tank, h f , i n is the saturated liquid enthalpy at the microchannel inlet, and h f g , i n is the latent heat of vaporization at the inlet. All enthalpies are in units of kJ / kg . P is the heating power at the pre-heating section, and m ˙ represents the mass flow rate.
Upon entering the microchannel test section, the working fluid absorbed heat, which further increased the vapor quality. We assumed a uniform pressure drop within the test section, and thereby used the inlet pressure to calculate the pressure at each position within the test section. Based on the principle of thermal equilibrium, the local vapor quality at each position was calculated as follows:
x z = x i n + Q t e s t m ˙ h f g , z × Z L
where Q t e s t is the heating power within the test section and h f g , z is the latent heat of vaporization at a given position. The latent heat was determined using the saturated pressure at that location. The saturated pressure at the position can be expressed as:
P s a t , i n = P s a t , i n P Z L
where P s a t , i n represents the saturated pressure at the inlet.
The local heat transfer coefficient was then calculated using the following formula:
h z = q T w , z T s a t , z
where T w , z denotes the local wall temperature; q represents the effective heat flux density, according to preliminary measurements q = 0.5 Q t e s t ; and T s a t , z is the saturation temperature based on the local saturation pressure.
Therefore, the average heat transfer coefficient could be calculated as:
h = 1 L 0 L h z d l

2.4. Experimental Results and Discussion

2.4.1. Experimental Results

In the results analysis section, we will utilize the average heat transfer coefficient to characterize the heat transfer performance. Figure 4 illustrates the variation in the average heat transfer coefficient with heat flux density under different experimental conditions at an inlet vapor mass flow rate of 740 kg/m2s. In Figure 4a–d, line 1 represents the horizontal ordinary surface, line 2 represents the horizontal hydrophilic surface, and line 3 represents the horizontal super-hydrophilic surface. Regarding the effect of surface modification, we initially observed that, in terms of the average heat transfer coefficient, line 1 was lower than line 2, which was lower than line 3. The average heat transfer coefficient of the super-hydrophilic surface was about 130% higher than that of the hydrophilic surface and 310% higher than that of the ordinary surface. In terms of the trend of heat transfer performance, the microchannel of the ordinary surface represented by line 1 showed a relatively small change in the average heat transfer coefficient with the variation in heat flux density, maintaining its heat transfer performance at a relatively low level. The microchannel of the hydrophilic surface represented by line 2 exhibited a trend of first decreasing and then increasing with regard to the average heat transfer coefficient, while the microchannel of the super-hydrophilic surface represented by line 3 maintained an upward trend in the average heat transfer coefficient with the increase in heat flux density, which remained stable under different inlet vapor qualities (except for the condition with an inlet vapor quality of 0.04; there was a singular point present under this condition). Therefore, super-hydrophilic surfaces exhibited the strongest surface modification effects among various modified surfaces, significantly surpassing other surface types in their impact on heat transfer, thus holding promise for practical applications.
To investigate the influence of gravity on the surface modification effect under the strongest condition, we conducted experimental studies on the super-hydrophilic surface microchannel under two extreme gravity conditions. Their relationships between the average heat transfer coefficient and heat flux density are shown in lines 4 and 5 of the figures, representing upward vertical flow and downward vertical flow, respectively. Compared with the horizontal flow represented by line 3, the average heat transfer coefficient of line 4 decreased by about 140%, while line 5 decreased by about 130%. When gravity was involved, the enhanced effect of super-hydrophilicity was weakened, resulting in a decrease in heat transfer performance. In the two vertical flow situations, at 740 kg/m2s and different inlet vapor qualities, the average heat transfer coefficient of downward vertical flow was 5% higher than that of upward vertical flow, and both maintained a high dependency on heat flux density, with a relationship close to linear. Therefore, when considering the effect of gravity, the enhancing effect of surface modification was weakened, especially in the case of super-hydrophilic surfaces.
Figure 5 shows the variation in the average heat transfer coefficient, with the inlet vapor quality at different conditions, at a fixed mass flux of 740 kg/m2s and a constant heat flux density. This reflects the instability of the average heat transfer coefficient caused by the variation in the inlet vapor quality at different heat flux densities. At a heat flux density of 18 × 103 W/m2, as shown in Figure 5a, the fluctuation amplitude of the hydrophilic surface in horizontal flow represented by line 2 was the largest, while the rest of the conditions exhibited a relatively stable trend. The two vertical flow conditions represented by lines 4 and 5, where gravity was aligned with the flow direction, exhibited smaller fluctuations in the average heat transfer coefficient with changes in the inlet vapor quality compared to the super-hydrophilic surface microchannel in horizontal flow, which is represented by line 3.
When the heat flux density increased to 36 × 10³ W/m2, as shown in Figure 5b, both the hydrophilic surface represented by line 2 and the ordinary surface represented by line 1 exhibited stable and relatively low average heat transfer coefficients. Meanwhile, Line 3, representing the horizontal super-hydrophilic surface microchannel, began to exhibit significant fluctuations in the average heat transfer coefficient. The average heat transfer coefficients of vertical flow represented by lines 4 and 5 also remained relatively low and stable. The exception was in line 5, where the inlet vapor quality was minimal, resulting in a significant drop in the average heat transfer coefficient. All experimental results will be subjected to mechanistic analysis in the following Section 2.4.2.
Based on our analysis, in practical applications, the heat transfer performance of surface-modified microchannels is superior to that of unmodified surfaces, with the super-hydrophilic surface exhibiting the best performance. Regarding the influence of gravity, the best heat transfer performance was observed when the microchannels were horizontally oriented, without gravity affecting the flow direction. When vertically oriented, the heat transfer performance of downward vertical flow was better than that of upward vertical flow. Additionally, when the gravity direction aligned with the flow direction, it enhanced the stability of the heat transfer performance.

2.4.2. Mechanism Analysis

Based on the experimental results demonstrating the differences in heat transfer performance under different conditions, the following mechanistic analysis will explore how gravity and surface modification influence heat transfer performance.
We introduce dimensionless numbers as discrimination criteria to gauge the relative importance of different physical quantities. In these criteria, the degree to which each quantity influences the system is presented in the form of dimensionless numbers, delineating the regions where the effects are significant or negligible. The versatility of dimensionless numbers allows them to be universally applicable and extended to a variety of fluids, scales, and pipe materials. Therefore, the applicability of these discrimination criteria is quite broad.
Here, we select the dimensionless Liftoff criterion [34]. The Liftoff criteria use the relationship between the Jakob number Ja and the dimensionless flow parameter ψ to categorize gravity-dependent and gravity-independent regions. The Ja characterizes the ratio of sensible heat to latent heat during liquid phase change processes, while the ψ reflects the relationship between surface tension, viscous forces, and buoyancy. The foundation of the Liftoff criteria is the bubble detachment model, utilizing bubble dynamics to determine whether the flow boiling conditions are influenced by gravitational fields. For each operating condition, the Jakob number and the dimensionless flow parameter ψ are calculated. A curve defined by J a = 21.975 ln ψ + 82.748 serves as the boundary line to ascertain whether the flow boiling conditions are dependent on gravitational variations.
By applying the Liftoff criterion to the data from the experiments with three different levels of gravity influence on the super-hydrophilic surface on the J a ψ graph in Figure 6, we found that over 80% of the data points were located in the gravity-dependent region. This implies that, in most of the conditions examined in this study, gravity had a significant influence on the heat transfer performance during flow boiling. As reflected in Figure 4, the significant difference in the average heat transfer coefficients between the horizontal flow represented by line 3 and the two vertical flows represented by lines 4 and 5 was primarily caused by the influence of gravity.
Subsequently, through two-phase flow pattern analysis, as shown in Figure 7a, for the ordinary surface, intermittent drying began to appear in the annular flow region at 55 ms. Then, at 85 ms, the interfacial shear stress between the gas and liquid phases increased, leading to film rupture and entering the early drying stage. With the passage of time, at 115 ms, the drying area expanded, even entering a completely dry stage, indicating unstable annular flow. From Figure 7b, it can be observed that compared to the ordinary surface microchannels, the hydrophilic surface microchannels had reduced dry spots and decreased dry areas on the surface, resulting in improved heat transfer performance. However, localized dry-out phenomena were still present. For the super-hydrophilic surface, Figure 7c indicates no drying phenomenon in the annular flow region. This can be attributed to the excellent rewetting capability of the super-hydrophilic surface microchannels. As the heated liquid film thinned, there was sufficient liquid replenishment to fill the gap between the wall and gas bubble, ensuring continuous and uniform distribution of the liquid film and effectively preventing drying. It was this rewetting phenomenon that prevented a significant decrease in the average heat transfer coefficient of the super-hydrophilic surface within the experimental conditions.
Through the above analysis, we figured out the influence of surface modification on heat transfer performance. In Figure 4a–d, line 1 represents the ordinary surface microchannel, which, due to early occurrence of local drying, resulted in the average heat transfer coefficient remaining at a relatively low level as the heat flux density increased, unable to improve. Therefore, under the same heat flux density, the average heat transfer coefficient was able to stabilize at a low value under different inlet vapor qualities, as shown by line 1 in Figure 5a,b. Hydrophilic surface microchannels underwent a transition of flow patterns, exhibiting slug flow when the heat flux density was low, hindering flow and causing deterioration of heat transfer, followed by the appearance of annular flow, leading to a steady increase in the average heat transfer coefficient. However, as local drying still occurred, the average heat transfer coefficient could not increase significantly, as shown by line 2 in Figure 4a–d. When the heat flux density was low, being in the slug flow stage led to an unstable heat transfer performance, resulting in fluctuations, as shown by line 2 in Figure 5a. Subsequently, with an increase in heat flux density, local drying occurred, causing a stable decrease in the average heat transfer coefficient, as shown by line 2 in Figure 5b. Super-hydrophilic surface microchannels, due to their excellent rewetting properties, can prevent the occurrence of local drying in a timely manner, resulting in a steady increase in the average heat transfer coefficient within the experimental range without a decreasing trend, as shown by Line 3 in Figure 4a–d. The superb rewetting properties of super-hydrophilic surfaces stabilized the heat transfer performance, resulting in smaller fluctuations, as shown by line 3 in Figure 5a,b.
For the distribution and evolution of the gas–liquid interface within the horizontal microchannels, as depicted in Figure 8a, it can be considered to primarily depend on the interaction of six forces: surface tension F σ , inertia F i , shear stress F τ , evaporation momentum F M , gravity G , and buoyancy F b . Both surface tension and inertia act in the same direction as the flow, serving as the driving forces for two-phase flow and influencing the merging and formation of bubbles. Shear stress and evaporation momentum act in the opposite direction to the flow and serve as resistance to the two-phase flow. Gravity causes heavier liquid to sink, while buoyancy causes lighter bubbles to rise, affecting the departure of bubbles to complete the circulation of gas–liquid phases. In super-hydrophilic surfaces, the effect of surface tension is more significant compared to ordinary and hydrophilic surfaces. It can better overcome resistance and quickly rewet the surface. The greater surface tension promotes bubble formation, which, under the influence of gravity and buoyancy, leaves the surface more readily. Therefore, horizontal super-hydrophilic surface channels exhibit better heat transfer performance than those in ordinary and hydrophilic surfaces.
When microchannels are vertically oriented, the directions of gravity and buoyancy align with the flow direction of the two-phase flow. At this time, the effect of surface modification can still enhance the action of surface tension, promoting flow and formation of bubbles. However, at these orientations, gravity cannot bring the liquid to the wall, and buoyancy cannot bring the bubbles to the middle of the channel. This inhibits the departure of bubbles, acting as an obstacle. Consequently, it can be observed that the average heat transfer coefficient of vertical flow is lower than that of horizontal flow. Thus, the mechanism analysis validates the heat transfer performance reflected in the experimental data.
Through the mechanism analysis of gravity and surface modification, we identified their respective effects and the combined impact when both factors are in play on the flow boiling heat transfer in microchannels. The existence of this dual effect renders traditional heat transfer models, based on horizontal flow of ordinary surface microchannels, ineffective. These models also cannot mathematically express the interaction between these two factors. Therefore, it is necessary to enhance existing heat transfer models.

3. New Heat Transfer Model Development and Evaluation

3.1. Evaluation of Existing Heat Transfer Models

Before establishing a new heat transfer model, it is crucial to evaluate existing models using the experimental data collected in this study. We calculated the experimental average heat transfer coefficient and compared it with the predicted average heat transfer coefficient obtained from the existing models. The mean absolute error (MAE) served as an indicator of the model’s accuracy and was calculated using the following equation:
M A E = h e x p h p r e d h e x p × 100 %
In Table 4, some existing heat transfer models are given, complete with their respective calculation correlations and predictive errors under three experiments utilizing the super-hydrophilic surface. We will evaluate the performance of these models within the context of the experimental data collected in this study.
Based on the evaluation, Table 4 shows evidence that the Kim and Mudawar model performed the best under the channel characteristics and experimental conditions utilized in this study. This model is categorized as a progressive model and has been derived considering a broad range of working fluids and channel dimensions. The prediction errors for the average heat transfer coefficients of super-hydrophilic surface microchannels in upward flow, horizontal flow, and downward flow were 36.2%, 45.5%, and 32.6%, respectively.
Figure 9 further provides details of the predictive outcomes of the Kim and Mudawar model for the three different experiments. From the figure, it is evident that the model tended to overestimate the average heat transfer coefficient for vertical upward and vertical downward flows. Conversely, for horizontal flow, the model tended to underestimate the average heat transfer coefficient. We believe that the model neglected the dual effect of gravity and surface modification on two-phase flow, specifically in calculating the heat transfer coefficient for nucleate boiling. It neglected the enhancing effect of surface modification, leading to an underestimation of the predicted values, and ignored the inhibiting effect of gravity, resulting in an overestimation of the predicted values. Therefore, below, we will propose a new model.

3.2. Introduction of New Physical Parameters

The Kim and Mudawar model does not explicitly account for the effects of gravitational force and surface modification on nucleate boiling in two-phase flow boiling scenarios. To adapt this model for more complex operating conditions, it becomes necessary to introduce new parameters that capture the dual effect of gravity and surface modification on two-phase flow boiling.
Firstly, we introduce the dimensionless number F a , proposed by Fang [39], to characterize the influence of gravitational force. Fa is a novel dimensionless number that encompasses the ratio of gravitational, buoyancy, surface tension, and inertial forces. Its expression is as follows:
F a = ρ l ρ g σ G 2 D h = ρ l ρ g g L 3 ρ g L 3 × L σ ρ V 3 L 2
In the specific formulation of this dimensionless number, the first term represents the ratio of buoyancy force to gravitational force, while the second term represents the ratio of surface tension to inertial forces. In the context of flow boiling, these terms can shed light on the bubble formation and detachment processes. As shown in Figure 10, we observed that, for identical operating conditions with varying inclination angles, the Fa values for vertical flow conditions are consistently higher than those for horizontal flow conditions. This is attributable to the more significant roles played by buoyancy and gravitational forces in the vertical direction compared to the horizontal scenario. This heightened impact is ultimately reflected in the heat transfer coefficients.
Secondly, we introduce a modified confinement number, C o n e w , to characterize the effects of surface modification. C o n e w is derived from the original confinement number C o , which represents the ratio of liquid surface energy to gravitational potential energy. The modification process involves altering the surface energy parameter γ , changing it from the liquid surface energy parameter γ l to the solid surface energy parameter γ s , which can characterize the channel surface structure [40]. The expression for γ s is as follows:
γ s = γ l 2 1 + sin 2 θ + c o s θ
In this context, θ represents the contact angle of channel surface. For super-hydrophilic surfaces, θ = 0 . For hydrophilic surfaces, θ = 43 . For ordinary surfaces, θ = 70 .
Therefore, the expression for C o n e w becomes:
C o n e w = γ s g ρ f ρ g D 2
At this point, C o n e w represents the ratio of solid surface energy parameters to gravitational potential energy. The solid surface energy parameter actually reflects the contact angle of different wettable surfaces.
By integrating F a and C o n e w , we identified two independent dimensionless numbers that can individually characterize the effects of gravity and surface modification on the flow process. However, the two individual dimensionless numbers alone cannot directly reflect the coupled effects generated by the interaction between the two factors. Therefore, it is necessary to combine these two dimensionless numbers with the heat transfer model. Through a certain mathematical form of these two physical quantities, the dual effect of the two actions can be manifested, and then we can develop a new comprehensive model for heat transfer.

3.3. New Developed Heat Transfer Model

In the preceding sections of this chapter, we arrived at several conclusions: (1) Among various existing models, the Kim and Mudawar model shows the best predictive accuracy for the experimental data collected in this study. (2) The model tends to over-predict for vertical flow conditions and under-predict for horizontal flow conditions. This discrepancy is attributed to the lack of consideration of the interplay of two distinct factors during the nucleate boiling stage. (3) The incorporation of the two new dimensionless numbers, F a and C o n e w , can better capture the effects of gravity and surface modification in the heat transfer model.
Therefore, we employed F a and C o n e w to modify the nucleate boiling heat transfer coefficient h n b using the power function in the Kim and Mudawar model. The revised form is as follows:
h n b , n e w = a F a b C o n e w c h n b
In the current study, we first utilized 320 sets of data for vertical upward flow within a mass flux range of 735 kg/m2s to 1271 kg/m2s, a heating heat flux density range of 9 × 10³ W/m2 to 46 × 103 W/m², and an inlet vapor quality range of 0.018 to 0.182. Based on these conditions, we obtained the applicable values of a, b, and c for the current working conditions as follows:
a = 6.02 ,   b = 0.485 ,   c = 0.12
Thus, building upon the Kim and Mudawar model as a foundation, we developed a new heat transfer model that is more applicable under conditions influenced by the dual effect of gravity and surface modification. Intended for engineering applications, its correlation is as follows:
h t p , n e w = h n b , n e w 2 + h c b 2
h n b , n e w = 6.02 F a 0.485 C o n e w 0.12 h n b
h n b = 2345 B o P H P F 0.7 P R 0.38 1 x 0.51 0.023 R e f 0.8 P r f 0.4 k f D h
h c b = 5.2 B o P H P F 0.08 W e f o 0.54 + 3.5 1 X t t 0.94 ρ g ρ l 0.25 0.023 R e f 0.8 P r f 0.4 k f D h

3.4. Evaluation of the New Model

The predictive performance of the new model under vertical upward flow conditions is shown in Figure 11: the model yielded a mean absolute error of 21.4%. The prediction errors were reduced by 14.8% compared to the best existing Kim and Mudawar model.
To assess the applicability of the new model, we validated it using experimental results for horizontal flow and vertical downward flow. The predicted average relative errors were 33.7% and 20.9%, respectively, as illustrated in the following Figure 12. The prediction errors were reduced by 11.8% and 11.6%, respectively, compared to the best existing Kim and Mudawar model.
Meanwhile, when predicting the average heat transfer coefficients on horizontally flowing microchannels with ordinary and hydrophilic surfaces, the prediction errors were 26.6% and 25.8%, respectively, as shown in Figure 13. These errors are relatively acceptable, benefiting from the introduction of the two new dimensionless numbers, thus expanding the applicability range of the new model.
Finally, Figure 14 illustrates a comparison between the experimental and predicted values of the average heat transfer coefficients for all conditions in this experiment using the new model.
The new model, formulated as a power function utilizing F a and C o n e w , has enhanced the accuracy of predictions and the applicability of the model in predicting nucleate boiling heat transfer. However, there may exist limitations in the form of extreme values of F a and C o n e w (such as F a approaching 0), which could lead to significant prediction biases. From a physical standpoint, C o n e w may not have extreme values, while F a could. That is to say, when surface tension approaches 0 (theoretically possible in certain special surface cases), the predicted nucleate boiling heat transfer coefficient also approaches 0. Therefore, future improvements in prediction work may involve refining the mathematical expressions to further enhance the model’s applicability.
Nevertheless, the proposed new model represents a significant step forward in predicting flow boiling heat transfer in microchannels under complex conditions, laying the groundwork for future research. Improving the model and extending its validation to a broader and more complex range of conditions are crucial for enhancing its applicability in future studies.

4. Conclusions

In this study, we combined experimental research with mechanistic analysis to predict the heat transfer performance of flow boiling in microchannels under the dual effect of gravity and surface modification.
The main conclusions are as follows:
  • By varying the influence of gravity and surface modification on heat transfer in microchannels, the experimental results indicate that the optimal heat transfer performance occurs during horizontal flow with a super-hydrophilic surface, and its average heat transfer coefficients are about 130% and 310% higher than those of the hydrophilic surface and the ordinary surface, respectively. Additionally, a more stable heat transfer performance is observed when gravity is aligned with the flow direction. However, the influence of gravity significantly weakens the surface modification effect, especially for super-hydrophilic modified surfaces. For the super-hydrophilic surface microchannels, their heat transfer performance decreased by about 140% and 130% compared to the horizontal flow condition.
  • Through mechanism analysis, it has been confirmed that, in the case of horizontal super- hydrophilic surface microchannels, there is greater surface tension compared to normal and hydrophilic surfaces, promoting fluid flow and bubble formation. Additionally, under the influence of gravity and buoyancy, these bubbles detach from the surface. Hence, it exhibits the best heat transfer performance. However, when vertically oriented, the action of gravity and buoyancy cannot facilitate bubble detachment from the surface, thus leading to a decline in heat transfer performance.
  • Among existing heat transfer models, the Kim and Mudawar models have the best prediction accuracy. The prediction errors for the three experiments were conducted using super-hydrophilic surface microchannels with varying degrees of gravity influence. The vertical upward flow, horizontal flow, and vertical downward flow were 36.2%, 45.5%, and 32.6%, respectively. In order to improve the prediction accuracy, we introduced dimensionless numbers F a and C o n e w to characterize the effects of gravity and surface modification and established a new flow boiling heat transfer prediction model.
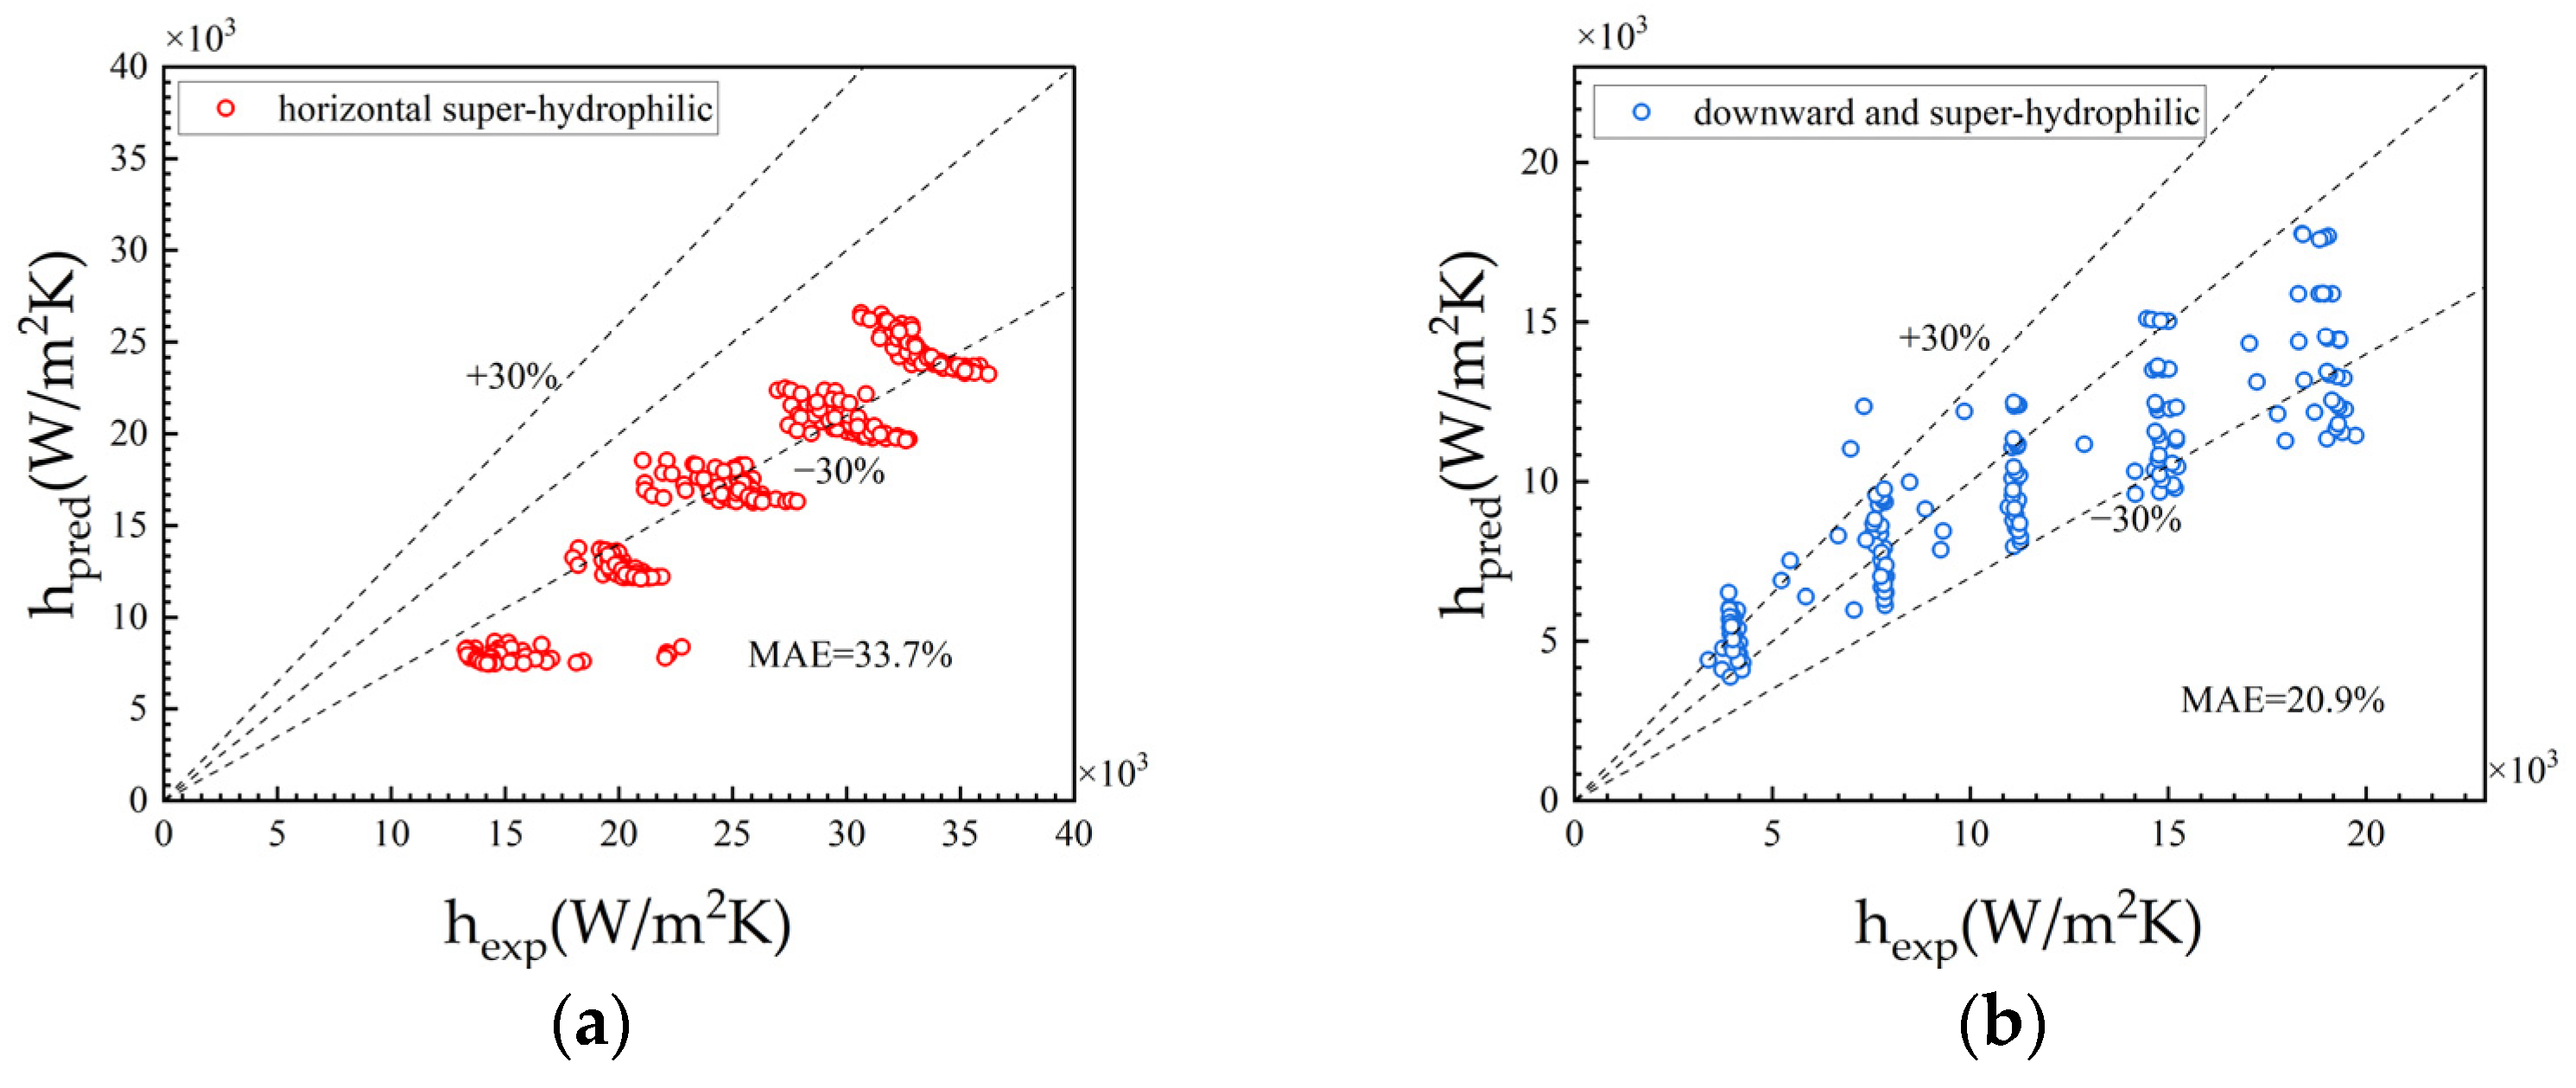
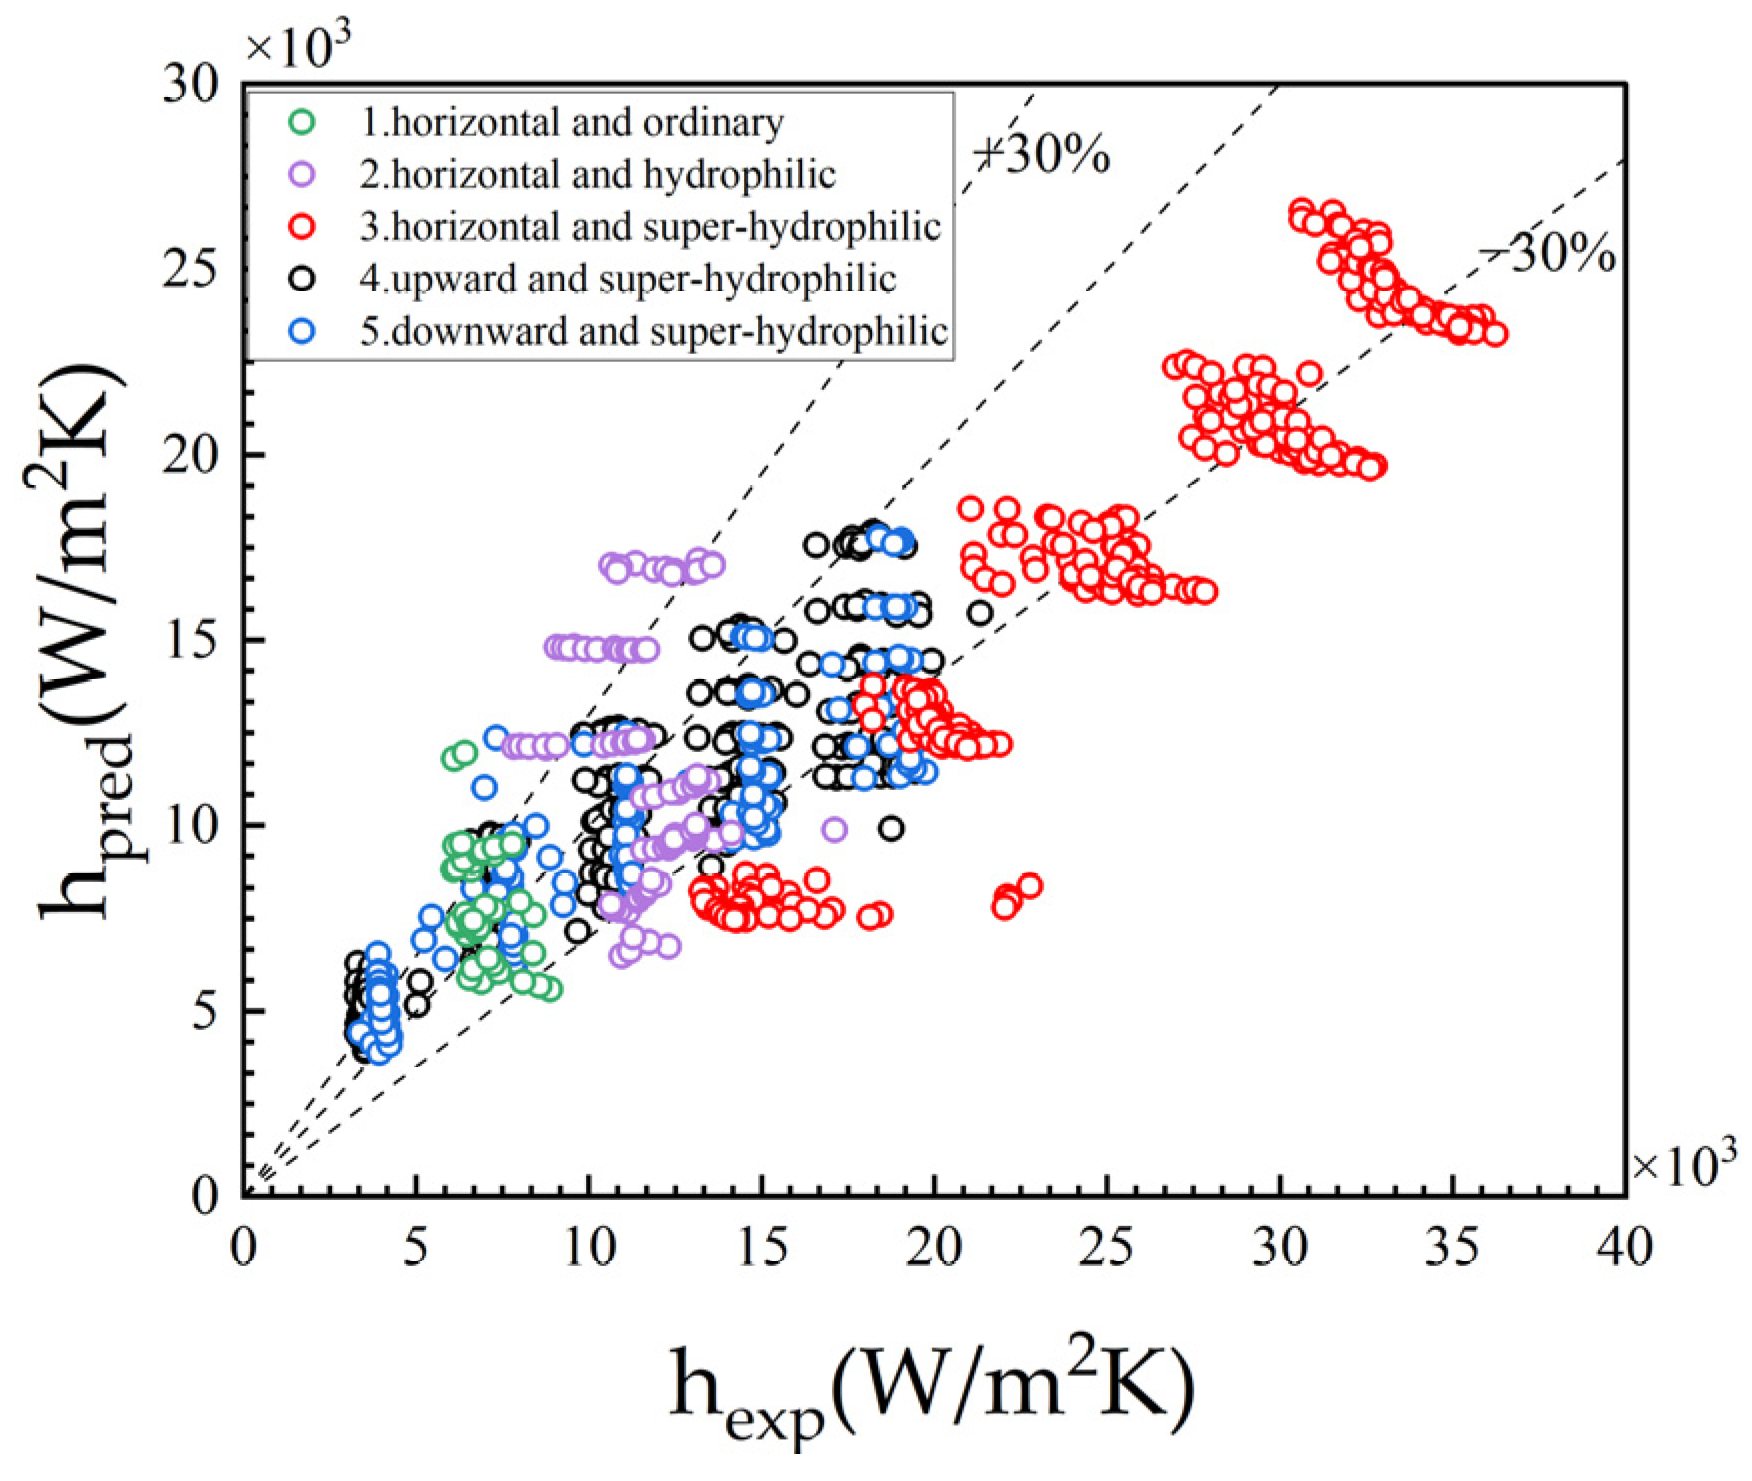
  • The new model can effectively predict the flow boiling heat transfer performance of microchannels under different gravity and surface modification conditions. For the super-hydrophilic surface in vertical upward, horizontal, and vertical downward flow, the prediction errors were 21.4%, 33.7%, and 20.9%, respectively. Compared with the best existing model, the prediction errors were reduced by 12–15%. The application scope of the new model has also been expanded. Furthermore, there is still room for improvement in the model expressed in power function form.

Author Contributions

Conceptualization, H.W. and S.Z.; data curation, H.W. and Y.Y.; formal analysis, H.W.; methodology, H.W. and S.Z.; validation, H.W.; resources, D.W. and L.L.; investigation, H.W. and Y.Y.; software, L.L.; visualization, H.M.; writing—original draft, H.W.; writing—review and editing, H.W., D.W., L.L., H.M., and B.S.; supervision, D.W., L.L., and B.S.; funding acquisition, D.W., L.L., H.M., and B.S.; project administration, B.S.. All authors have read and agreed to the published version of the manuscript.

Funding

This research was funded by the Natural Science Foundation of Guangdong Province of China, grant number 2021A1515010608.

Data Availability Statement

The data presented in this study are available upon request from the corresponding author. The data are not publicly available due to privacy.

Conflicts of Interest

Author Dongwei Wang was employed by the company China Shuifa Singyes Energy Holdings Limited. The remaining authors declare that the research was conducted in the absence of any commercial or financial relationships that could be construed as a potential conflict of interest. Authors Linglin Liu and Huijie Mao were employed by the companies Shuifa Energy Engineering Co., Ltd. and Shuifa Singyes Energy (Zhuhai) Co., Ltd. The remaining authors declare that the research was conducted in the absence of any commercial or financial relationships that could be construed as a potential conflict of interest.

Nomenclature

Nomenclature
B d = ρ l ρ g g D h 2 σ , Bond number [-]
B o = q G , boiling number [-]
C o confinement number [-]
D h hydraulic diameter [mm]
E E factor [-]
F F factor [-]
F a Fang number [-]
F r = W e B o , Froude number [-]
G mass flux [kg/m2s]
g gravitational acceleration [m/s2]
h average heat transfer coefficient [kW/m2K]
h f , r e s fluid enthalpy in storage tank [kJ/kg]
h f , i n inlet fluid enthalpy [kJ/kg]
h f g , i n inlet latent heat of vaporization [kJ/kg]
h f g , z latent heat of vaporization at a given position [kJ/kg]
J a = ρ l C p l T s a t ρ g h f g , Jacob number [-]
k thermal conductivity [W/m K]
L channel length [mm]
M A E mean absolute error [-]
m ˙ mass flow rate [kg/s]
P heating power in preheating section [W]
P F wetted perimeter of channel [m]
P H heated perimeter of channel [m]
P R reduced pressure [-]
P r = c p μ k , Prandtl number [-]
Q heating power in test section [W]
q effective heat flux density [kW/m2]
R e = G D h μ , Reynolds number [-]
T Temperature [°C]
W e = G 2 D h ρ σ , Webb number [-]
x vapor quality [-]
X t t Lockhart–Martinelli parameter based on turbulent liquid-turbulent vapor flows [-]
Y = ρ l ρ g sin β d p d z f , g , Y parameter [-]
Z coordinate along microchannel [m]
ρ density [kg/m3]
μ dynamic viscosity [N·s/m2]
σ surface tension [N/m]
ψ = W e R e ρ l ρ l ρ g , dimensionless flow parameter [-]
θ contact angle [°]
γ surface energy parameter [N/m]
Subscript
c b convective boiling dominant heat transfer
e x p experimental
f saturated liquid
f o liquid only
g saturated vapor
i n inlet
l liquid
n e w new modified
n b nucleate boiling dominant heat transfer
p r e d predicted
s solid
s a t saturation
s p single-phase
t e s t test section
t p two-phase
w wall
z coordinate along microchannel

References

  1. Mudawar, I. Two-Phase Microchannel Heat Sinks: Theory, Applications, and Limitations. J. Electron. Packag. 2011, 133, 041002. [Google Scholar] [CrossRef]
  2. Valeh-e-Sheyda, P.; Rahimi, M.; Karimi, E.; Asadi, M. Application of Two-Phase Flow for Cooling of Hybrid Microchannel PV Cells: A Comparative Study. Energy Convers. Manag. 2013, 69, 122–130. [Google Scholar] [CrossRef]
  3. Oliet, C.; Oliva, A.; Castro, J.; Perez-Segarra, C.D. Parametric Studies on Automotive Radiators. Appl. Therm. Eng. 2007, 27, 2033–2043. [Google Scholar] [CrossRef]
  4. Mudawar, I. Recent Advances in High-Flux, Two-Phase Thermal Management. J. Therm. Sci. Eng. Appl. 2013, 5, 021012. [Google Scholar] [CrossRef]
  5. Fang, Y.; Zhang, Z.; Xu, D.; Wang, Y.; Yang, H.; Huang, Y. Experimental Investigation on Flow Pattern and Bubble Behavior during Subcooled Flow Boiling of R1233zd(E) in Parallel Channels. J. Therm. Sci. 2023, 32, 2374–2385. [Google Scholar] [CrossRef]
  6. Subramanian, M.; Hoang, A.T.; B, K.; Nižetić, S.; Solomon, J.M.; Balasubramanian, D.; C, S.; G, T.; Metghalchi, H.; Nguyen, X.P. A Technical Review on Composite Phase Change Material Based Secondary Assisted Battery Thermal Management System for Electric Vehicles. J. Clean. Prod. 2021, 322, 129079. [Google Scholar] [CrossRef]
  7. Liu, P.; Guo, Y.; Ding, W.; Tang, M.; Song, Y.; Peng, X.; Ji, J.; Chen, Q.; Mao, X. Critical Heat Flux (CHF) Correlations for Subcooled Water Flow Boiling at High Pressure and High Heat Flux. J. Therm. Sci. 2021, 30, 279–293. [Google Scholar] [CrossRef]
  8. Liang, G.; Mudawar, I. Review of Channel Flow Boiling Enhancement by Surface Modification, and Instability Suppression Schemes. Int. J. Heat Mass Transf. 2020, 146, 118864. [Google Scholar] [CrossRef]
  9. Yang, Q.; Shu, B.; Wang, J.; Guo, Y. Experimental Investigation on Flow Boiling Heat Transfer and Flow Patterns in a Single Micro-Channel with Large Mass Velocity. Exp. Therm. Fluid Sci. 2018, 91, 283–291. [Google Scholar] [CrossRef]
  10. Shi, Q.; Shu, B.; Jiang, J.; Zhang, Y. Effect of Optical–Electrical–Thermal Coupling on the Performance of High-Concentration Multijunction Solar Cells. Appl. Sci. 2022, 12, 5888. [Google Scholar] [CrossRef]
  11. Chen, H.; Zhang, H.; Li, M.; Liu, H.; Huang, J. Experimental Investigation of a Novel LCPV/T System with Micro-Channel Heat Pipe Array. Renew. Energy 2018, 115, 773–782. [Google Scholar] [CrossRef]
  12. Karayiannis, T.G.; Mahmoud, M.M. Flow Boiling in Microchannels: Fundamentals and Applications. Appl. Therm. Eng. 2017, 115, 1372–1397. [Google Scholar] [CrossRef]
  13. Zhang, G.; Kandlikar, S.G. A Critical Review of Cooling Techniques in Proton Exchange Membrane Fuel Cell Stacks. Int. J. Hydrog. Energy 2012, 37, 2412–2429. [Google Scholar] [CrossRef]
  14. Tran, T.N.; Chyu, M.C.; Wambsganss, M.W.; France, D.M. Two-Phase Pressure Drop of Refrigerants during Flow Boiling in Small Channels: An Experimental Investigation and Correlation Development. Int. J. Multiph. Flow 2000, 26, 1739–1754. [Google Scholar] [CrossRef]
  15. Size Effect on Two-Phase Regime for Condensation in Micro/Mini Tubes. Available online: https://www.webofscience.com/wos/alldb/full-record/INSPEC:7600318 (accessed on 27 November 2022).
  16. Jothi Prakash, C.G.; Prasanth, R. Enhanced Boiling Heat Transfer by Nano Structured Surfaces and Nanofluids. Renew. Sustain. Energy Rev. 2018, 82, 4028–4043. [Google Scholar] [CrossRef]
  17. Liu, T.Y.; Li, P.L.; Liu, C.W.; Gau, C. Boiling Flow Characteristics in Microchannels with Very Hydrophobic Surface to Super-Hydrophilic Surface. International J. Heat Mass Transf. 2011, 54, 126–134. [Google Scholar] [CrossRef]
  18. Choi, C.; Shin, J.S.; Yu, D.I.; Kim, M.H. Flow Boiling Behaviors in Hydrophilic and Hydrophobic Microchannels. Exp. Therm. Fluid Sci. 2011, 35, 816–824. [Google Scholar] [CrossRef]
  19. Azizifar, S.; Ameri, M.; Behroyan, I. An Experimental Study of Subcooled Flow Boiling of Water in the Horizontal and Vertical Direction of a Metal-Foam Tube. Therm. Sci. Eng. Prog. 2020, 20, 100748. [Google Scholar] [CrossRef]
  20. Devahdhanush, V.S.; Mudawar, I.; Nahra, H.K.; Balasubramaniam, R.; Hasan, M.M.; Mackey, J.R. Experimental Heat Transfer Results and Flow Visualization of Vertical Upflow Boiling in Earth Gravity with Subcooled Inlet Conditions—In Preparation for Experiments Onboard the International Space Station. Int. J. Heat Mass Transf. 2022, 188, 122603. [Google Scholar] [CrossRef]
  21. Konishi, C.; Mudawar, I.; Hasan, M.M. Investigation of the Influence of Orientation on Critical Heat Flux for Flow Boiling with Two-Phase Inlet. Int. J. Heat Mass Transf. 2013, 61, 176–190. [Google Scholar] [CrossRef]
  22. Saisorn, S.; Wongpromma, P.; Wongwises, S. The Difference in Flow Pattern, Heat Transfer and Pressure Drop Characteristics of Mini-Channel Flow Boiling in Horizontal and Vertical Orientations. Int. J. Multiph. Flow 2018, 101, 97–112. [Google Scholar] [CrossRef]
  23. Gao, W.; Xu, X.; Liang, X. Experimental Study on the Effect of Orientation on Flow Boiling Using R134a in a Mini-Channel Evaporator. Appl. Therm. Eng. 2017, 121, 963–973. [Google Scholar] [CrossRef]
  24. Kaya, A.; Lecompte, S.; De Paepe, M. Experimental Flow Boiling Study of R245a at High Reduced Pressures in a Large Diameter Horizontal Tube. Energies 2022, 15, 864. [Google Scholar] [CrossRef]
  25. Balasubramanian, K.R.; Peter, R.J.; Krishnan, R.A. Recent Hypotheses on the Parameters of Microchannel Flow Boiling: A Comprehensive Overview. Microfluid. Nanofluid. 2022, 26, 80. [Google Scholar] [CrossRef]
  26. Li, W.; Chen, Z.; Li, J.; Sheng, K.; Zhu, J. Subcooled Flow Boiling on Hydrophilic and Super-Hydrophilic Surfaces in Microchannel under Different Orientations. Int. J. Heat Mass Transf. 2019, 129, 635–649. [Google Scholar] [CrossRef]
  27. Li, J.; Lin, Y.; Li, W.; Zhou, K. Local Heat Transfer of Saturated Flow Boiling in Vertical Narrow Microchannel. J. Heat Transf. 2020, 142, 071601. [Google Scholar] [CrossRef]
  28. Li, W.; Ma, J.; Alam, T.; Yang, F.; Khan, J.; Li, C. Flow Boiling of HFE-7100 in Silicon Microchannels Integrated with Multiple Micro-Nozzles and Reentry Micro-Cavities. Int. J. Heat Mass Transf. 2018, 123, 354–366. [Google Scholar] [CrossRef]
  29. Ren, C.; Li, W.; Ma, J.; Huang, G.; Li, C. Flow Boiling in Microchannels Enhanced by Parallel Microgrooves Fabricated on the Bottom Surfaces. Int. J. Heat Mass Transf. 2021, 166, 120756. [Google Scholar] [CrossRef]
  30. Zhou, S.; Shu, B.; Yu, Z.; Huang, Y.; Zhang, Y. Experimental Study and Mechanism Analysis of the Flow Boiling and Heat Transfer Characteristics in Microchannels with Different Surface Wettability. Micromachines 2021, 12, 881. [Google Scholar] [CrossRef]
  31. Zhang, Y.; Wu, H.; Zhang, L.; Yang, Y.; Niu, X.; Zeng, Z.; Shu, B. Flow Pattern Study and Pressure Drop Prediction of Two-Phase Boiling Process in Different Surface Wettability Microchannel. Micromachines 2023, 14, 958. [Google Scholar] [CrossRef]
  32. rieu Phan, H.; Caney, N.; Marty, P.; Colasson, S.; Gavillet, J. Flow Boiling of Water on Nanocoated Surfaces in a Microchannel. J. Heat Transf. 2012, 134, 020901. [Google Scholar] [CrossRef]
  33. Zhou, K.; Coyle, C.; Li, J.; Buongiorno, J.; Li, W. Flow Boiling in Vertical Narrow Microchannels of Different Surface Wettability Characteristics. Int. J. Heat Mass Transf. 2017, 109, 103–114. [Google Scholar] [CrossRef]
  34. Bower, J.S.; Klausner, J.F. Gravity Independent Subcooled Flow Boiling Heat Transfer Regime. Exp. Therm. Fluid Sci. 2006, 31, 141–149. [Google Scholar] [CrossRef]
  35. Lazarek, G.M.; Black, S.H. Evaporative Heat Transfer, Pressure Drop and Critical Heat Flux in a Small Vertical Tube with R-113. Int. J. Heat Mass Transf. 1982, 25, 945–960. [Google Scholar] [CrossRef]
  36. Schrock, V.E.; Grossman, L.M. Forced Convection Boiling in Tubes. Nucl. Sci. Eng. 1962, 12, 474–481. [Google Scholar] [CrossRef]
  37. Gungor, K.E.; Winterton, R.H.S. Simplified General Correlation for Saturated Flow Boiling and Comparison with Data. Chem. Eng. Res. Des. 1987, 65, 148–156. [Google Scholar]
  38. Kim, S.-M.; Mudawar, I. Universal Approach to Predicting Saturated Flow Boiling Heat Transfer in Mini/Micro-Channels—Part II. Two-Phase Heat Transfer Coefficient. Int. J. Heat Mass Transf. 2013, 64, 1239–1256. [Google Scholar] [CrossRef]
  39. Fang, X. A New Correlation of Flow Boiling Heat Transfer Coefficients for Carbon Dioxide. Int. J. Heat Mass Transf. 2013, 64, 802–807. [Google Scholar] [CrossRef]
  40. Zhu, D.-Y.; Dai, P.-Q.; Luo, X.-B.; Zhang, Y.-C. Novel Characterization of Wetting Properties and the Calculation of Li2id-Solid Interface Tension(I). Sci. Technol. Eng. 2007, 7, 3057–3062. [Google Scholar]
Figure 1. Contact angle test images and SEM images for (a,d) ordinary surface, (b,e) hydrophilic surface, and (c,f) super-hydrophilic surface.
Processes 12 01028 g001
Figure 2. Schematic diagram of the experimental devices and test section. (a) Experimental devices, (b) test section.
Processes 12 01028 g002
Figure 3. Different flow orientations of test section. (a) Vertical upward flow, (b) horizontal flow, (c) vertical downward flow.
Processes 12 01028 g003
Figure 4. The average heat transfer coefficient under different conditions varied with heat flux density at different inlet vapor quality.(a) xin=0.04, (b) xin=0.08, (c) xin=0.10, (d) xin=0.14.
Processes 12 01028 g004
Figure 5. The average heat transfer coefficient under different conditions varied with inlet vapor quality at different heat flux densities. (a) q = 18 × 103 W/m2, (b) q = 36 × 103 W/m2.
Processes 12 01028 g005
Figure 6. The performance of the experimental data under a super-hydrophilic surface according to Liftoff criteria.
Processes 12 01028 g006
Figure 7. Comparison of flow patterns in microchannels with different wettability levels under G = 950 kg/m2s, xin = 0.07, q = 46 kW/m2 for (a) ordinary surface, (b) hydrophilic surface, and (c) super-hydrophilic surface.
Processes 12 01028 g007aProcesses 12 01028 g007b
Figure 8. Schematic diagram of the force analysis of the vapor–liquid interface in the annular flow region in the microchannel for (a) horizontal flow, (b) vertical upward flow, and (c) vertical downward flow.
Processes 12 01028 g008
Figure 9. Comparison between the experimental average heat transfer coefficients and predictions of the Kim and Mudawar model for three experiments utilizing the super-hydrophilic surfaces: (a) vertical upward flow, (b) horizontal flow, and (c) vertical downward flow.
Processes 12 01028 g009
Figure 10. Experimental results of variation in Fa in different orientations under super-hydrophilic surfaces versus mass flux.
Processes 12 01028 g010
Figure 11. Comparison of experimental heat transfer coefficients with predictions of new model (vertical upward flow with super-hydrophilic surface).
Processes 12 01028 g011
Figure 12. Comparison of experimental heat transfer coefficients with predictions of new model for (a) horizontal flow with super-hydrophilic surface, (b) vertical downward flow with super-hydrophilic surface.
Processes 12 01028 g012
Figure 13. Comparison of experimental heat transfer coefficients with predictions of new model for (a) horizontal flow with ordinary surface, (b) horizontal flow with hydrophilic surface.
Processes 12 01028 g013
Figure 14. Comparison of experimental heat transfer coefficients with predictions of new model for all conditions.
Processes 12 01028 g014
Table 1. Dimension parameters of microchannel.
ParameterDimensions
Number of channels3
Channel length/mm78
Channel width/mm1.6
Channel depth/mm0.6
Hydraulic   diameter ,   D h /mm0.872
Table 2. Operating conditions for single microchannel.
Parameter Range Unit
Mass flux735–1271 × 103 g / m 2 s
Heat flux density9–46 × 103 W / m 2 K
Inlet vapor quality0.018–0.182 1
Table 3. Uncertainty of variables.
Parameter Uncertainty
Pressure 0.7%
Pressure drop1.0%
Wall temperature0.5 °C
Fluid temperature0.5 °C
Heat flux0.5%
Mass flux0.5%
Vapor quality7.2%
Local heat transfer coefficient12.5%
Average heat transfer coefficient12.5%
Table 4. Existing models and MAEs.
Author (s)Model (s)MAE (Upward/Horizontal/Downward)
Lazarek and Black [35] h t p = 30 R e f o 0.857 B o 0.714 k f D h
R e f o = G D h μ
B o = q G h f g
33.5%/73.2%/35.1%
Schrock and Grossman [36] h t p = h n b + h c b
h n b h s p , f o = 7391.3 B o
h c b h s p , f o = F = 1.11 1 X t t 2 3
h s p , f o = 0.023 R e f o 0.8 P r f 1 3 k f D h
48.4%/59.5%/50.2%
Gungor and Winterton [37] h t p = E + h n b h s p , f + h c b h s p , f
h n b h s p , f = 300 E B o 0.86
h c b h s p , f = F = 1.12 E x e 1 x e 0.75 ρ f ρ g 0.41
h s p , f = 0.023 R e f 0.8 P r f 0.4 k f D h
For vertical flow, E = 1
74.9%/62.3%/76.2%
Kim and Mudawar [38] h t p = h n b 2 + h c b 2
h n b = 2345 B o P H P F 0.7 P R 0.38 1 x 0.51 0.023 R e f 0.8 P r f 0.4 k f D h
h c b = 5.2 B o P H P F 0.08 W e f o 0.54 + 3.5 1 X t t 0.94 ρ g ρ l 0.25 0.023 R e f 0.8 P r f 0.4 k f D h
36.2%/45.5%/32.6%
Disclaimer/Publisher’s Note: The statements, opinions and data contained in all publications are solely those of the individual author(s) and contributor(s) and not of MDPI and/or the editor(s). MDPI and/or the editor(s) disclaim responsibility for any injury to people or property resulting from any ideas, methods, instructions or products referred to in the content.

