
Mechanical Analysis and Simulation of Wood Textile Composites

1
Institute of Material Engineering, Plastics Engineering, University of Kassel, Mönchebergstr. 3, 34125 Kassel, Germany
2
Institute of Structural Engineering, Timber Structures and Building Rehabilitation, University of Kassel, Kurt-Wolters-Str. 3, 34125 Kassel, Germany
*
Author to whom correspondence should be addressed.
J. Compos. Sci. 2024, 8(5), 190; https://doi.org/10.3390/jcs8050190
Submission received: 29 March 2024
/
Revised: 8 May 2024
/
Accepted: 16 May 2024
/
Published: 18 May 2024
(This article belongs to the Special Issue Characterization and Modelling of Composites, Volume III)
Abstract
:Wood Textile Composites (WTCs) represent a new and innovative class of materials in the field of natural fiber composites. Consisting of fabrics made from willow wood strips (Salix americana) and polypropylene (PP), this material appears to be particularly suitable for structural applications in lightweight construction. Since the threads of the fabric are significantly oversized compared to classic carbon or glass rovings, fundamental knowledge of the mechanical properties of the material is required. The aim of this study was to investigate whether WTCs exhibit classic behavior in terms of fiber composite theory and to classify them in relation to comparable composite materials. It was shown that WTCs meet all the necessary conditions for fiber-reinforced composites in tensile, bending, and compression tests and can be classified as natural-fiber-reinforced polypropylene composites. In addition, it was investigated whether delamination between the fiber and matrix can be simulated by using experimentally determined mechanical data as input. Using finite element analysis (FEA), it was shown that the shear stress components of a stress tensor in the area of the interface between the fiber and matrix are responsible for delamination in the composite material. It was also shown that the resistance to shear stress depends on the geometric conditions of the reinforcing fabric.
Keywords:
wood textile composites; natural fiber composites; simulation; materials testing; SEM; FEA1. Introduction
Against the backdrop of the circular economy, different industrial sectors are always on the lookout for new and innovative material solutions for a wide range of applications. In the construction sector in particular, materials with a high potential for lightweight construction are being targeted [1,2,3].
Wood is an ideal raw material for the construction sector due to its naturally grown lightweight construction potential, its thousands of years of use as a building material, and its ability to store CO2 [4]. Thanks to the centuries-long sustainable management of forests in various regions, e.g., in Germany, it can also be expected that the raw material will be readily available in the long term. For a long time, it was believed that, due to climate change, timber tree species such as spruce (Picea abies) in particular will experience a significant decline in the middle European forests. For the European beech (Fagus sylvatica), on the other hand, an increase in occurrence was predicted, as it was assumed that, as the natural main tree species in Central Europe, it is more resistant to the consequences of climate change than other tree species. As a result, the focus of technical research was strongly on beech in order to open up new fields of application [5,6]. However, the droughts in Central Europe from 2018 to 2022 have shown that European beech is also highly susceptible to drought stress, which results in a high mortality rate among trees of all ages [7,8]. In response to this, it makes sense to spread the risk of the unavailability of various trees or wood species through developments in other tree species [9].
The willow used for the branches in this study is not yet state of the art in the field of timber construction. However, willow branches have various advantages that make it an interesting material for construction. In addition to its flexibility, which is known from traditional basket weaving, willow wood, just like other types of wood, has very good strength and low weight, which makes it interesting for lightweight construction applications [10,11]. In addition, willows often grow on moist soils that are generally unsuitable for other tree species, so as a niche tree species, it has a certain potential for utilization [12]. Compared to other tree species, however, willows are usually harvested for branches rather than trunks. On the one hand, this excludes applications such as veneer or plywood; on the other hand, fiber material for fiber-reinforced plastics can be obtained in this way. At the same time, this is a particularly sustainable application, as it is not the entire tree that is harvested, but only the required branch material. The tree itself sprouts again and the branches can be harvested in annual cycles [12].
The WTCs investigated in this study (Figure 1) represent an intermediate stage between solid wood applications such as plywood and fiber applications such as natural fiber composites (NFCs) based on woven fabrics. The willow strips obtained from the harvested willow branches are processed into woven fabrics with traditional weaving techniques. These are then processed in combination with thermoplastics to create panels with excellent mechanical performance in terms of strength and stiffness in combination with a high design value.
However, knowledge of the technical properties of the material and their predictability is essential for use in the construction industry, especially as there have only been a few studies on this composite material to date [13,14]. The aim of this study is to determine these parameters in the quasi-static range by means of tensile, bending, and compression tests, to classify them with regard to the theory of fiber-reinforced composites, to classify them with respect to comparable composite materials, and to check the predictability of the mechanical behavior by means of simulation.
For the latter aspect, an approach was taken to investigate the extent to which the material properties of the composite can be predicted when subjected to a tensile load. As experience has shown that the crossing points of the threads in fabric-reinforced composites are particularly problematic and shear forces play a decisive role, the simulation carried out here focused on their characterization. Alfano et al. [15] showed, for example, that the delamination of composites can be analyzed by using interface elements and an interface damage law. In this way, they developed a model that allowed mixed-mode delamination without the use of a hypothesis regarding the respective mode ratio. Since composite materials obtain their mechanical properties from their internal boundary conditions, the parameterization of these boundary conditions is of crucial importance. Zhang et al. [16] have considered the multi-step woven yarn configuration separately in order to be able to use so-called “unit cells” as a basis for FEA. Here, these unit cells represent the different localities of the structure model. In addition, the effect of the weaving angle on the mechanical behavior was investigated. It could be concluded that with regard to the composite, the surface and corner regions in particular need to be assessed in order to simulate elastic properties more accurately. Le Page et al. [17] described that the strain energy release rate associated with crack initiation is significantly dependent on the locality of the fracture. They concluded that yarn configurations especially, with their high number of crossing points, induce cracks. It is considered possible to use a non-linear FEA to perform more accurate calculations regarding the energy recovery rate. In addition to typical material properties, damage progression for woven composites has already been demonstrated in the scientific literature. For a two-dimensional woven composite, the mechanical behavior could be determined and verified in the form of stress–strain graphs [18]. Cohesive elements, which are capable of describing the onset of damage and crack propagation in the FEA, were defined in this approach. These parametrized elements were therefore able to predict the damage behavior for the points with the highest stress within the context of a unit cell model. In addition to classical FEA, there are also approaches for using homogenization techniques to simulate heterogeneous microstructures. It was shown that homogenization techniques with a repeating unit cell (RUC) can be used to make predictions of macroscopic mechanical properties [19]. Mitchell et al. [20] investigated for woven fabrics whether a beam-shell model can be used to predict the mechanical behavior during the forming process. However, their results showed a deviation from their expected trends. This was explained by the fact that the simplified beam theory did not reproduce the actual material behavior. In this simplified model, the fiber reinforcement that determines the lateral stiffness and shear stiffness was therefore not taken into account. Thus, the parameterization of the model should always be sufficient so that the quantities to be predicted can be computed validly. The present article attempts to simulate the delamination of the fabric from the plastic matrix in WTCs using the shear stress modes of a stress tensor and to validate the model using experimental data.
2. Materials and Methods
2.1. Manufacturing of WTC
To manufacture WTCs, quasi-endless willow wood strips (Salix americana) with a defined cross-section of 3 mm × 1 mm were produced from willow branches. These were then processed into woven fabrics on a specially converted loom [21], in this case using the atlas weave (1:7), which creates different patterns on the top and bottom and a fabric with anisotropic characteristics. The atlas weave was chosen because it has significantly fewer crossing points than the plain weave for the same amount of material. Although this results in a slightly lower resistance to displacement, it produces very good draping properties with increased mechanical strength due to the reduced number of crossing points [22]. In a subsequent hot-compacting process, two fabrics are draped with their bottom sides facing each other but with the same main fiber direction and coated with a thermoplastic matrix. The matrix consists of twelve parts neat polypropylene (Sabic® PP 520P, SABIC SALES Europe B. V., Sittard, The Netherlands) and, for reasons of improved adhesion, four parts PP with 5 wt.% maleic anhydride-grafted polypropylene (MAH-PP) (Licocene PP MA 6452, CLARIANT INTERNATIONAL LTD, Muttenz, Switzerland) close to the wood surface areas. The finished composite contains 60% matrix and 40% wood by weight. At a maximum temperature of 180 °C, a maximum pressure of 0.32 MPa, and a maximum dwell time of 30 min including cooling time, sheets with a size of 500 mm × 500 mm and a thickness of 5 mm were produced [14]. The test specimens required for the mechanical characterization were cut out of the panels using a laboratory circular saw and stored at 23 °C and 50% r. h. in a standard climate in accordance with DIN EN ISO 291 [23] until testing.
2.2. Preparation Prior Testing
All mechanical tests were carried out on a universal testing machine (ZwickRoell GmbH & Co., KG, Ulm, Germany) together with individual fixtures for the various test set-ups. In addition to WTCs, neat willow and neat polypropylene were each analyzed. In the case of the composite material, the tests were carried out in the direction of the fiber (0°) and across the fiber (90°). In the case of the willow strips used in the composite, their high flexibility poses a problem in the mechanical tests carried out here. While it is possible to carry out the tensile test in the fiber direction without any problems, neither the tensile test transverse to the fiber direction nor the three-point bending or compression test can be carried out on the individual strips. In order to solve this problem, solid willow wood was therefore procured and the test specimens for tensile tests transverse to the fiber, three-point bending, and compression tests were cut out of it using a laboratory circular saw, in the same way as for the composite.
2.3. Tensile Test
The tensile tests were carried out in accordance with EN ISO 527-4 [24]. In the case of the willow, 10 willow strips with a length of 155 mm were tested. With a cross-section of 3 mm × 1 mm, they corresponded to the willow strips used for production of the composite material. However, as the strips could only be used to determine values in the direction of the fiber (0°), test specimens made of solid willow wood transverse to the fiber (90°) were also produced and tested. In the case of WTCs and polypropylene, shoulder bars (type 2) with a length of 95 mm were produced. The test was carried out at a testing speed of 2 mm/s, and 5 specimens of each variant were tested. The strain values were recorded with the aid of an extensometer. The tensile strength and Young’s modulus were evaluated and the results of selected specimens of each material are presented in stress–strain diagrams. Since no literature values are available for the Poisson’s ratio of willow, which is required for the parameterization of the simulation, the tensile test was supported by the use of a ONE1-M9 video extensometer (Hegewald & Peschke, Nossen, Germany). This non-contact deformation measuring device can be used to determine the transverse deformation and, subsequently, the transverse strain εy. This is then used together with the longitudinal strain εx to determine the Poisson’s ratio νxy according to Equation (1):
The determination was carried out in accordance with DIN EN ISO 527-1 [25] between 0.05% and 0.25% of transverse strain, whereby an average value was formed from the values determined for the Poisson’s ratio in this range.
2.4. Three-Point Bending Test
Three-point bending tests were carried out with reference to DIN EN ISO 178 [26]. The specimens of the WTC (0° and 90°) and polypropylene had a length of 100 mm, a width of 25 mm, and a thickness of about 5 mm. The test specimens for willow (0° and 90°) had a length of 80 mm and a width of 10 mm with a thickness of 4 mm. The test speed was 2 mm/min, and 5 specimens of each variant were tested. The three-point-bending strength and the flexural modulus were evaluated and the results of selected samples of each material are presented in stress–strain diagrams.
2.5. Compression Test
The compression strength was measured in accordance with EN ISO 604 [27]. Here, too, polypropylene, WTC (0°), and WTC (90°), as well as solid willow (0° and 90°), were tested. The dimensions of the test specimens followed the standard with 10 mm × 10 mm × 4 mm, whereby the thickness of the WTC was left at its original dimension of about 5 mm. The thickness was determined individually for each test specimen. The test set-up consists of two load plates between which the specimens were placed (Figure 2). The loading was deformation-controlled with a test speed of 1 mm/min. The force–deformation ratio was measured and documented. The compressive strength fc was calculated as follows (Equation (2)):
For samples that do not have a specific failure point, Fmax was defined at the point where plastic deformation occurs before a multidimensional stress state occurs in the sample. This is the point from which the axial compression continues to increase without the compressive stress increasing. This point was reached after a deformation of 1.5 mm at the latest. The compressive strength and compressive modulus were evaluated and the results of selected samples of each material are presented in stress–compression diagrams.
2.6. Short-Beam Shear Test
Short-beam shear tests were carried out to determine the interlaminar shear strength required as input for the simulation. The basic structure of the test (Figure 3) corresponds to that of a three-point bending test, whereby the ratio of the thickness of the test specimen to the support span should not exceed 1:4. Due to the special nature of the composite material, two different standards were used, with the main difference being the test specimen geometry. The dimensions of the test specimens according to DIN EN ISO 14130 [28] were a length of 45 mm and a width of 22.5 mm with a specimen height of 4.5 mm. The resulting support width was 22.5 mm, and 10 test specimens were tested at a test speed of 1 mm/min. The dimensions of the test specimens according to ASTM D2344 [29], on the other hand, were a length of 27 mm, a width of 9 mm, and a height of 4.5 mm with a support width of 18 mm. The apparent interlaminar shear strength τ (short-beam shear strength FSBS) was determined according to Equation (3) based on both standards mentioned:
2.7. Scanning Electron Microscopy (SEM)
For a closer look at the interlaminar relationships, SEM measurements were carried out on selected test specimens after tensile and compression tests. The CAMSCAN MC 2300 device (Electron Optic Services, Inc., Ottawa, ON, Canada) was used here and the resulting images were used to carry out a more detailed interpretation of the results of the mechanical tests.
3. Numerical Simulation
A structural–mechanical three-dimensional FEA was carried out to show the initial delamination effects in the WTC, which were not visible during the test, due to the structure of the composite. To this end, the extent to which individual stress states or components of a Cauchy stress tensor cause delamination between the fiber and matrix was investigated. For this purpose, one binding rapport (a unit cell) of the WTC was modeled (Figure 4) in Marc-Mentat (e-Xstream Engineering S.A, Bommel, Luxembourg). In this illustration, the encasing polymer matrix itself remains concealed for illustrative purposes.
In Marc-Mentat, tetrahedral elements were used for the clamping jaws to generate the mesh. The heterogeneous WTC (polymer matrix and fabric) was linearly meshed with hexahedral elements to simulate potentially high deformations with increased computational accuracy. The approximately 700,000 elements were parameterized with linear-elastic material properties. With the exception of the Poisson’s ratio of PP, which was taken from the literature, the values used for the parameterization were determined in the course of the investigations carried out and are described in this paper:
- ▪
- Young’s modulus of the polymer matrix (polypropylene): 1480 MPa;
- ▪
- Young’s modulus of the willow strip (0°): 7840 MPa;
- ▪
- ▪
- Poisson’s ratio of the willow strip: 0.49.
The load displacement was defined in the simulation as 15 mm, which was divided into 1000 time steps (increments). To simulate the effective shear strength between the fiber and matrix, the adhesion was also parameterized on the basis of experimental data. The interlaminar shear strength of 10.03 MPa, which had been determined in the short-beam shear test, was used as input data. The geometric properties of the WTC were therefore used to simulate the location where the delamination originally occurred. To maximize the accuracy of the simulation, a mesh resolution or node spacing of 0.6 mm was used in Marc-Mentat. The contact of the clamping jaws to the specimen was defined with an indestructible bond in order to be able to exclude the clamping jaws in the evaluation. As a result, these clamping jaws serve primarily as an illustration. The FE simulation was subsequently parameterized to calculate the moment of delamination. A general material failure was not parameterized. In addition, delamination transitions to frictionless sliding, as friction effects between the polymer matrix and the fabric were not parameterized. The model is therefore based exclusively on the stiffnesses of the materials and the contact conditions of the individual components. The anisotropic macroscopic material behavior was expected due to the geometric properties of the fabric.
4. Results
4.1. Tensile Test
The results of the tensile test are shown in Figure 5a,b. The individual willow strips (0°) have the highest values in terms of tensile strength and tensile modulus. The values of the WTC tested parallel to the main fiber direction (0°) are in the middle range, while polypropylene together with the values of the WTC tested transverse to the main fiber direction (90°) have the lower values. Willow wood, which was tested transverse to the fiber (90°), shows the lowest values. This is also reflected in the stress–strain diagram, which shows a selected curve of a typical test specimen for each material. The highest stiffness values are shown for the willow fiber and the highest strains for the polypropylene. The WTC in the 0° direction are also in the medium range here. As can already be seen in Figure 5a, WTC 90° shows a slightly higher stiffness than neat polypropylene, but the strength is reduced. As expected, the neat willow wood transverse to the fiber (90°) shows the lowest stiffness. The values determined for the elongation at break can be found in Table 1. The Poisson’s ratio additionally determined for willow (0°) was 0.49 ± 0.11.
Figure 6a,b show SEM images in the loading direction of a typical fracture surface of a WTC after the tensile test at 0° and 90°. A direct comparison shows, as expected due to the fabric type, that the number of willow strips in the direction of loading is higher in the specimen tested at 0° than in the specimen tested at 90°. The willow strips lying in the direction of loading show clear signs of cracking, and the individual fibers of the willow strips are visibly torn. This indicates a high resistance to the tensile load. In contrast, the willow strips lying transverse to the direction of loading show an almost smooth fracture surface, indicating low resistance to the tensile load. The number of willow strips that can absorb high tensile forces is therefore significantly reduced transverse to the main fiber direction. Figure 6b also shows a partial fiber pull-out in the area of a crossing point (marked area), which indicates a failure of the interlaminar adhesion due to shear stresses and low adhesion [33].
4.2. Three-Point-Bending Test
The results of the three-point-bending tests are shown in Figure 7a,b. As in the tensile test, it can be observed that both the strength and the modulus transverse to the main fiber direction of the WTC are significantly reduced. As expected, the stiffness of the polypropylene is low in comparison, but comparable with the stiffnesses of the WTC and the willow transverse to the main fiber direction. Although the flexural strength of the PP is clearly below that of the WTC and willow parallel to the main fiber direction, it is higher compared to the measurements transverse to the fiber direction. The values shown in Figure 7a are confirmed by the stress–strain curves in Figure 7b, which are shown for a typical sample for each material tested. Here, too, the neat willow shows the highest stiffness, which decreases slightly when combined with PP; PP exhibits a high elongation; and the stiffnesses of the WTC and willow transverse to the main fiber direction are in the lower range.
4.3. Compression Test
The results of the compression test are shown in Figure 8a,b. They show very similar tendencies to the bending test; only the discrepancy between measurements parallel and transverse to the main fiber direction appear less pronounced. In addition, in contrast to the tensile and flexural tests, the strength of the matrix is higher than the strength of the composite. This is also confirmed in Figure 8b, which shows the stress–strain curves of a typical sample of each of the materials tested.
SEM images of a compression test specimen are shown in Figure 9a,b, exemplified on a WTC specimen tested parallel to the main fiber direction (0°). Figure 7a shows an overview image of the sample at 29× magnification, with pressure applied from the side. The delamination between the fibers and the matrix is clearly visible, as is the buckling of the individual components. The detailed image of the same sample at 500× magnification in Figure 9b shows the polymer part of the delamination in the lower area. The remains of the mechanical anchoring between the matrix and the willow strips, which can be seen in the area of the matrix, are clearly visible here.
4.4. Short-Beam Shear Test
Using the short-beam shear test, an average interlaminar shear strength of 10.03 ± 1.13 MPa was determined for the WTC, which was used as the input value for the simulation. Using a VHX7000 digital microscope (Keyence Deutschland GmbH, Neu-Isenburg, Germany), the images shown in Figure 10 were taken of the test specimens after the short-beam shear test. Cracks in the wood as well as delamination and cracks in the matrix can be seen. In particular, the detachment of the matrix from the wood threads is clearly visible.
4.5. FE-Analysis
To identify a potential delamination between the fiber and matrix, the parameter “Adhesion Deactivation” was visualized using Marc-Mentat after simulation as shown in Figure 11a,b. The selected value is a binary dimensionless parameter, whereby a value of 0 represents existing adhesion (blue areas), while a value of 1 indicates delamination (red areas). The red areas in Figure 11a,b indicate that at the time of evaluation, after five increments, the first delamination exhibits “adhesion deactivation” at the crossing points of the tissue. Based on this result, a spot within a crossing point was selected in order to examine it in detail with regard to its behavior under tensile load (Figure 11b, position 1). In addition, a reference point was selected that should not be influenced by the conditions of the crossing point (Figure 11b, position 2).
The numerical results of the simulation process are shown in Figure 12, whereby the increment number indicates the progress of the simulation and the time elapsed during the tensile test simulation. The simulated shear stress of the composite at positions 1 and 2, i.e., inside and outside the crossing point, is shown as a function of the increment number. The maximum value of both curves indicates the “adhesion deactivation” value as shown in Figure 11, i.e., the point at which there is no longer any adhesion between the fiber and the matrix. It can be seen that the simulated delamination occurs at both positions at almost identical shear stress (position 1: 9.04 MPa; position 2: 9.06 MPa). In addition, these values are close to the practically determined characteristic values for the interlaminar shear strength in the short-beam shear test (10.03 MPa). However, the curve for position 1 is much steeper than that for position 2, “adhesion deactivation” already occurs at increment number 10, whereas it only occurs at increment number 29 for position 2. It can therefore be seen that the failure due to the tensile load occurs much earlier during testing at position 1, i.e., within the crossing point, then at position 2.
To verify these results graphically, the effective shear stress for the simulated WTC is shown in Figure 13. Increment 25 was selected for this purpose, which is located between increments 10 and 29 as described above. At the time of recording, the delamination has therefore already occurred at position 1, whereas there is still adhesion at position 2. The shear stresses responsible for the failure in the area of the crossing points are clearly recognizable by the yellow areas in the graphic.
5. Discussion
Due to their dimensions, the wooden strips used in WTCs can hardly be compared with the glass fibers (cross-sectional diameter, 3.5–24 μm) and carbon fibers (cross-sectional diameter, 5–10 μm) currently used as a standard [34] for fiber composite materials. Nevertheless, the results of the mechanical analyses shown for the tensile test as well as for the bending and compression test (Table 1) confirm the assumption that WTCs behave according to the principles of fiber composite theory.
First, WTCs meet the three conditions of classic fiber composites [35]: (1) The Young’s modulus of the fiber in the longitudinal direction is higher than the Young´s modulus of the matrix, which could be demonstrated in all three tests. (2) The elongation at break of the matrix material must be greater than the elongation at break of the fibers. This condition was also verified by the elongation at break values determined in the tensile test. (3) The strength of the fibers must be greater than the strength of the matrix material—this condition could also be verified, at least in the tensile and three-point-bending tests. An exception here is the compression test, in which the strength of the polypropylene is higher than both the strength of the willow and the strength of the material composite. The reason for this lies in the different structure of the materials used. Wood is naturally a porous material whose failure under compressive load is caused by lateral buckling of the fibers, which was also demonstrated in the test carried out here. In general, the compressive strength of wood transverse to the fiber direction is very low, and the compressive strength parallel to the fiber direction is about half the tensile strength. On the other hand, ductile materials such as polypropylene show plastic failure in the form of yielding [4,36,37,38]. Rule (3) is also only valid if the fiber is loaded in the main fiber direction. The mechanical properties of the wood are significantly reduced in the transverse direction and have lower characteristic values in the tensile, three-point bending, and compression tests in comparison with the matrix.
Another point that allows the composite to be classified as a classic fiber composite is the fact that the fiber is superior to the composite in terms of both tensile strength and Young´s modulus. This was also confirmed in the tensile and bending tests, with only the compression test showing a deviation for the reasons mentioned above. In the case of fiber reinforcement with wood fibers, both a size effect and reinforcement through orientation generally occur. In the present composite, the size effect is comparatively small, as it works best over long and very slender fibers. Although these are quasi-endless fibers, they are significantly oversized compared to glass fibers, even in the form of rovings. The effect of orientation, on the other hand, is natural, as wood has a natural grown anisotropy. In this case, the parallel arrangement of the molecular chains within the willow strips is not produced by the manufacturing process like in carbon fibers but has grown naturally. This can be used in a targeted manner to reinforce the material in the same way as aramid or carbon fibers [35,39].
Various studies by other authors were used to classify WTCs in comparison with other fabric-reinforced PP composites. As glass-fiber-fabric-reinforced PP composites are frequently used in industry in particular, studies on the properties in tensile and bending tests were consulted here. The same was performed with regard to jute-fabric-reinforced PP composites, as these are natural fiber composites comparable to the WTC investigated here. As expected, the comparison with E-glass-fiber-fabric-reinforced PP composites shows that their properties generally significantly exceed those of WTCs in both the tensile and bending tests, often by at least twice the value [40,41].
In contrast, the jute-fiber-reinforced PP composites tested (Table 2) show similar values, both in terms of tensile strength and modulus of elasticity. The values of the plain weave deviate slightly regarding Young´s modulus and elongation at break. The composite shows a lower stiffness with a simultaneously higher elongation at break. The WTC also showed slightly higher values in the bending test compared to the jute-fabric-reinforced PP composites. These characteristic values correspond to the knowledge gained from weaving technology, which states that fabrics with a high weave density, such as plain weave, have a significantly higher structural elongation than fabrics with a lower weave point density, such as satin weave. In addition, fabrics with a high weave point density such as plain weave have lower mechanical properties of the composite compared to fabrics with a low weave point density such as satin weave due to the high weave. Since the twill weave can be classified between plain weave and satin weave in terms of weave point density, these results also fit in this theory [22].
The FEA simulation showed that the shear stress components of a stress tensor in the area of the interfaces between the fiber and matrix are particularly responsible for delamination in the composite. It was also shown that the resistance to shear stress depends on the geometric conditions of the reinforcing fabric. Comparable effects have been observed in the literature. Patel et al. [43] describe that, in particular, the waviness of fabrics, for which the crossing points are responsible, leads to local stress peaks. These cause a strong strain concentration and can lead to detachment of the fibers and matrix, as well as cracks in the matrix, or local buckling of the fibers under pressure. In each case, the crack propagation was perpendicular to the applied force, indicating that the failure was mainly due to shear. It follows that the mechanical properties of a fabric, and therefore the entire composite, can be altered by varying the weave. Kidane et al. [44] also investigated the effect of high-strain-rate tests for the fiber and polymer matrix composites. Here, it is formulated that the orientation and configuration of the fabric produce different shear strength properties. In another study, it was shown that interlaminar shear strength is significantly dependent on load orientation and fabric orientation. It was described that interlaminar failure occurs in certain areas where shear stresses occur almost exclusively [45], which is consistent with the findings of the present simulation study.
6. Conclusions
Looking at the overall picture that emerges, i.e., the conditions of the fiber composite theory on the one hand and the classification of WTCs in comparison to other materials on the other, the following conclusion is reached: WTCs are proven to meet all the conditions necessary for classification as a fiber composite material. Compared to other natural-fiber-reinforced plastics, they have values at a similar level and can impress with their high tensile strength. This was confirmed by the FEA simulation, which showed that WTCs also exhibit comparable behavior to conventional fiber composites in terms of shear forces and the resulting delamination. The results can be used to adapt and optimize the geometric design of the composite materials depending on a later application.
Author Contributions
Conceptualization, methodology, software, investigation, and writing—original draft preparation, C.L.v.B. and D.O.; writing—review and editing, H.-P.H. and W.S. All authors have read and agreed to the published version of the manuscript.
Funding
This research was funded by “VOTO—Weidengewebeverstärkter Kunststoff mit variabler Gewebedichte für Fassadenelemente im textilen Holzbau“, grant number 21712 N, funded by the Federal Ministry for Economic Affairs and Climate Action based on a resolution of the German Bundestag.
Data Availability Statement
The data presented in this study are not publicly accessible, due to their large volume, but are available on request from the corresponding author.
Acknowledgments
Thanks go to the staff of the research platform BAU KUNST ERFINDEN at the Department of Architecture at the University of Kassel, for providing the willow wood fabrics.
Conflicts of Interest
The authors declare no conflicts of interest.
References
- Agrawal, Y.; Gupta, T.; Sharma, R.; Panwar, N.L.; Siddique, S. A Comprehensive Review on the Performance of Structural Lightweight Aggregate Concrete for Sustainable Construction. Constr. Mater. 2021, 1, 39–62. [Google Scholar] [CrossRef]
- Junaid, M.F.; ur Rehman, Z.; Kuruc, M.; Medved’, I.; Bačinskas, D.; Čurpek, J.; Čekon, M.; Ijaz, N.; Ansari, W.S. Lightweight concrete from a perspective of sustainable reuse of waste byproducts. Constr. Build. Mater. 2022, 319, 126061. [Google Scholar] [CrossRef]
- Zhang, W.; Xu, J. Advanced lightweight materials for Automobiles: A review. Mater. Des. 2022, 221, 110994. [Google Scholar] [CrossRef]
- Wagenführ, A.; Scholz, F. Taschenbuch der Holztechnik; Carl Hanser Verlag GmbH Co KG: Munich, Germany, 2012. [Google Scholar]
- Bundesministerium für Ernährung und Landwirtschaft (BMEL), “Waldstrategie2050: Nachaltige Waldbewirtschaftung - Herausforderungen und Chancen für Mensch, Natur und Klima,” September 2021. [Online]. Available online: https://www.bmel.de/SharedDocs/Downloads/DE/Broschueren/Waldstrategie2050.html (accessed on 7 May 2024).
- Kohl, D.; von Boyneburgk, C.; Feldmann, M.; Heim, H.-P.; Böhm, S. Characterization of wood-based multi-material systems under dynamic impact stress. Wood Mater. Sci. Eng. 2018, 56, 1–10. [Google Scholar] [CrossRef]
- Meyer, P.; Lindner, M.; Bauhus, J.; Müller, J.; Farwig, N.; Lang, F.; Dieter, M.; Endres, E.; Hafner, A.; Kätzel, F.; et al. Zum Umgang mit alten, naturnahen Laubwäldern in Deutschland im Spannungsfeld zwischen Biodiversitätsschutz, Klimaschutz und Anpassung an den Klimawandel: Stellungnahme des Wissenschaftlichen Beirates für Waldpolitik. Wissenschaftlicher Beirat für Waldpolitik (WBW) beim Bundesministerium für Ernährung und Landwirtschaft (BMEL), December 2023. Available online: https://www.bmel.de/SharedDocs/Downloads/DE/_Ministerium/Beiraete/waldpolitik/stellungnahme-wbw-laubwaelder.html (accessed on 7 May 2024).
- Lasch-Born, P.; SUCkOw, F.E.L.I.C.I.T.A.S.; Gutsch, M.; Reyer, C.; Hauf, Y.; Murawski, A.; PILz, T.O.B.I.A.S. Forests under climate change: Potential risks and opportunities. METZ 2015, 24, 157–172. [Google Scholar] [CrossRef]
- Messier, C.; Bauhus, J.; Sousa-Silva, R.; Auge, H.; Baeten, L.; Barsoum, N.; Bruelheide, H.; Caldwell, B.; Cavender-Bares, J.; Dhiedt, E.; et al. For the sake of resilience and multifunctionality, let’s diversify planted forests! Conserv. Lett. 2022, 15, e12829. [Google Scholar] [CrossRef]
- Hausmagazin.com, Weidenholz Als Baustoff—Interessante Informationen|Hausmagazin.com. Available online: https://www.hausmagazin.com/a/weidenholz# (accessed on 19 January 2024).
- Wagenführ, R. Holzatlas, 6th ed.; Fachbuchverlag Leipzig im Carl Hanser Verlag: München, Germany, 2007. [Google Scholar]
- Cornell Small Farms, Willow, A New Old Crop—Cornell Small Farms. Available online: https://smallfarms.cornell.edu/2013/06/willow-a-new-old-crop/ (accessed on 20 June 2022).
- von Boyneburgk, C.; Silbermann, S.; Schweiger, L.; Zarges, J.-C.; Klussmann, H.; Heim, H.-P. Holzdesign trifft Kunststofftechnik. Kunststoffe 2022, 6, 82–85. [Google Scholar]
- von Boyneburgk, C.L.; Zarges, J.-C.; Kuhl, D.; Heim, H.-P. Mechanical Characterization and Simulation of Wood Textile Composites (WTC) supported by Digital Image Correlation (DIC). Compos. Part C Open Access 2023, 11, 100370. [Google Scholar] [CrossRef]
- Alfano, G.; Crisfield, M.A. Finite element interface models for the delamination analysis of laminated composites: Mechanical and computational issues. Numer. Meth Eng. 2001, 50, 1701–1736. [Google Scholar] [CrossRef]
- Zhang, C.; Xu, X. Finite element analysis of 3D braided composites based on three unit-cells models. Compos. Struct. 2013, 98, 130–142. [Google Scholar] [CrossRef]
- Le Page, B.H.; Guild, F.J.; Ogin, S.L.; Smith, P.A. Finite element simulation of woven fabric composites. Compos. Part A Appl. Sci. Manuf. 2004, 35, 861–872. [Google Scholar] [CrossRef]
- Römelt, P.; Cunningham, P.R. A multi-scale finite element approach for modelling damage progression in woven composite structures. Compos. Struct. 2012, 94, 977–986. [Google Scholar] [CrossRef]
- Shalini, S.; Honnalli, S.; Pavan, G.S. Determining elastic properties of CSEB masonry using FEA-based homogenization technique. Mater. Today Proc. 2023. [Google Scholar] [CrossRef]
- Mitchell, C.J.; Dangora, L.M.; Sherwood, J.A. Investigation into a robust finite element model for composite materials. Finite Elem. Anal. Des. 2016, 115, 1–8. [Google Scholar] [CrossRef]
- Silbermann, S.; Heise, J.; Kohl, D.; Böhm, S.; Akbar, Z.; Eversmann, P.; Klussmann, H. Textile Architecture for Wood Construction. In Research Culture in Architecture: Cross-Disciplinary Collaboration; Leopold, C., Robeller, C., Weber, U., Eds.; Birkhäuser: Basel, Switzerland, 2020; pp. 113–122. [Google Scholar]
- Cherif, C. Textile Werkstoffe für den Leichtbau; Springer Berlin Heidelberg: Berlin/Heidelberg, Germany, 2011. [Google Scholar]
- DIN EN ISO 291; Kunststoffe—Normalklimate für Konditionierung und Prüfung. Deutsches Institut für Normung: Berlin, Germany, 2008.
- DIN EN ISO 527-4; Kunststoffe—Bestimmung der Zugeigenschaften—Teil 4: Prüfbedingungen für Isotrop und Anisotrop Faserverstärkte Kunststoffverbundwerkstoffe. Deutsches Institut für Normung: Berlin, Germany, 1997.
- DIN EN ISO 527-1; Kunststoffe—Bestimmung der Zugeigenschaften—Teil 1: Allgemeine Grundsätze. Deutsches Institut für Normung: Berlin, Germany, 2012.
- DIN EN ISO 178; Kunststoffe—Bestimmung der Biegeeigenschaften. Deutsches Institut für Normung: Berlin, Germany, 2013.
- DIN EN ISO 604; Kunststoffe: Bestimmung von Druckeigenschaften. Deutsches Institut für Normung: Berlin, Germany, 2002.
- DIN EN ISO 14130; Faserverstärkte Kunststoffe—Bestimmung der Scheinbaren Interlaminaren Scherfestigkeit nach dem Dreipunktverfahren mit Kurzem Balken. Deutsches Institut für Normung: Berlin, Germany, 1998.
- D 2344/D 2344M—00; Standard Test Method for Short-Beam Strength of Polymer Matrix Composite Materials and their Laminates. American Society for Testing and Materials: West Conshohocken, PA, USA, 2000.
- Kumar, M.; Gaur, K.K.; Shakher, C. Measurement of Material Constants (Young’s Modulus and Poissons´s Ratio) of Polypropylene usind Digital Speckle Pattern Interferometry (DSPI). J. JSEM 2015, 15, 87–91. [Google Scholar]
- Parenteau, T.; Ausias, G.; Grohens, Y.; Pilvin, P. Structure, mechanical properties and modelling of polypropylene for different degrees of crystallinity. Polymer 2012, 53, 5873–5884. [Google Scholar] [CrossRef]
- Dean, G.D.; Broughton, W. A model for non-linear creep in polypropylene. Polym. Test. 2007, 26, 1068–1081. [Google Scholar] [CrossRef]
- Zarges, J.-C.; Minkley, D.; Feldmann, M.; Heim, H.-P. Fracture toughness of injection molded, man-made cellulose fiber reinforced polypropylene. Compos. Part A Appl. Sci. Manuf. 2017, 98, 147–158. [Google Scholar] [CrossRef]
- Cherif, C. (Ed.) Textile Materials for Lightweight Constructions: Technologies—Methods—Materials—Properties; Springer: Berlin/Heidelberg, Germany, 2016; Available online: http://ebooks.ciando.com/ook/index.cfm/bok_id/1898532 (accessed on 2 May 2024).
- Ehrenstein, G.W. Faserverbund-Kunststoffe: Werkstoffe—Verarbeitung—Eigenschaften, 2nd ed.; Carl Hanser Verlag: München, Germany, 2006. [Google Scholar]
- Lohmann, U. Holzlexikon, 4th ed.; DRW-Verlag: Leinfelden-Echterdingen, Germany, 2003. [Google Scholar]
- Grellmann, W.; Seidler, S. Kunststoffprüfung, 3rd ed.; Hanser, Carl: München, Germany, 2015. [Google Scholar]
- Reiterer, A.; Stanzl-Tschegg, S.E. Compressive behaviour of softwood under uniaxial loading at different orientations to the grain. Mech. Mater. 2001, 33, 705–715. [Google Scholar] [CrossRef]
- Fengel, D.; Wegener, G. Wood: Chemistry, Ultrastructure, Reactions; Kessel Verlag: Remagen, Germany, 2003. [Google Scholar]
- Khan, R.A.; Khan, M.A.; Zaman, H.U.; Pervin, S.; Khan, N.; Sultana, S.; Saha, M.; Mustafa, A.I. Comparative Studies of Mechanical and Interfacial Properties Between Jute and E-glass Fiber-reinforced Polypropylene Composites. J. Reinf. Plast. Compos. 2010, 29, 1078–1088. [Google Scholar] [CrossRef]
- Russo, P.; Acierno, D.; Simeoli, G.; Iannace, S.; Sorrentino, L. Flexural and impact response of woven glass fiber fabric/polypropylene composites. Compos. Part B Eng. 2013, 54, 415–421. [Google Scholar] [CrossRef]
- Arju, S.N.; Afsar, A.M.; Khan, M.A.; Das, D.K. Effects of jute fabric structures on the performance of jute-reinforced polypropylene composites. J. Reinf. Plast. Compos. 2015, 34, 1306–1314. [Google Scholar] [CrossRef]
- Patel, J.S.; Boddu, V.M.; Brenner, M.W.; Kumar, A. Effect of fabric structure and polymer matrix on flexural strength, interlaminar shear stress, and energy dissipation of glass fiber-reinforced polymer composites. Text. Res. J. 2016, 86, 127–137. [Google Scholar] [CrossRef]
- Kidane, A.; Gowtham, H.L.; Naik, N.K. Strain Rate Effects in Polymer Matrix Composites Under Shear Loading: A Critical Review. J. Dyn. Behav. Mater. 2017, 3, 110–132. [Google Scholar] [CrossRef]
- Naik, N.K.; Asmelash, A.; Kavala, V.R.; Ch, V. Interlaminar shear properties of polymer matrix composites: Strain rate effect. Mech. Mater. 2007, 39, 1043–1052. [Google Scholar] [CrossRef]
Figure 1.
Wood Textile Composites (WTCs) including close-up of the cross-section.
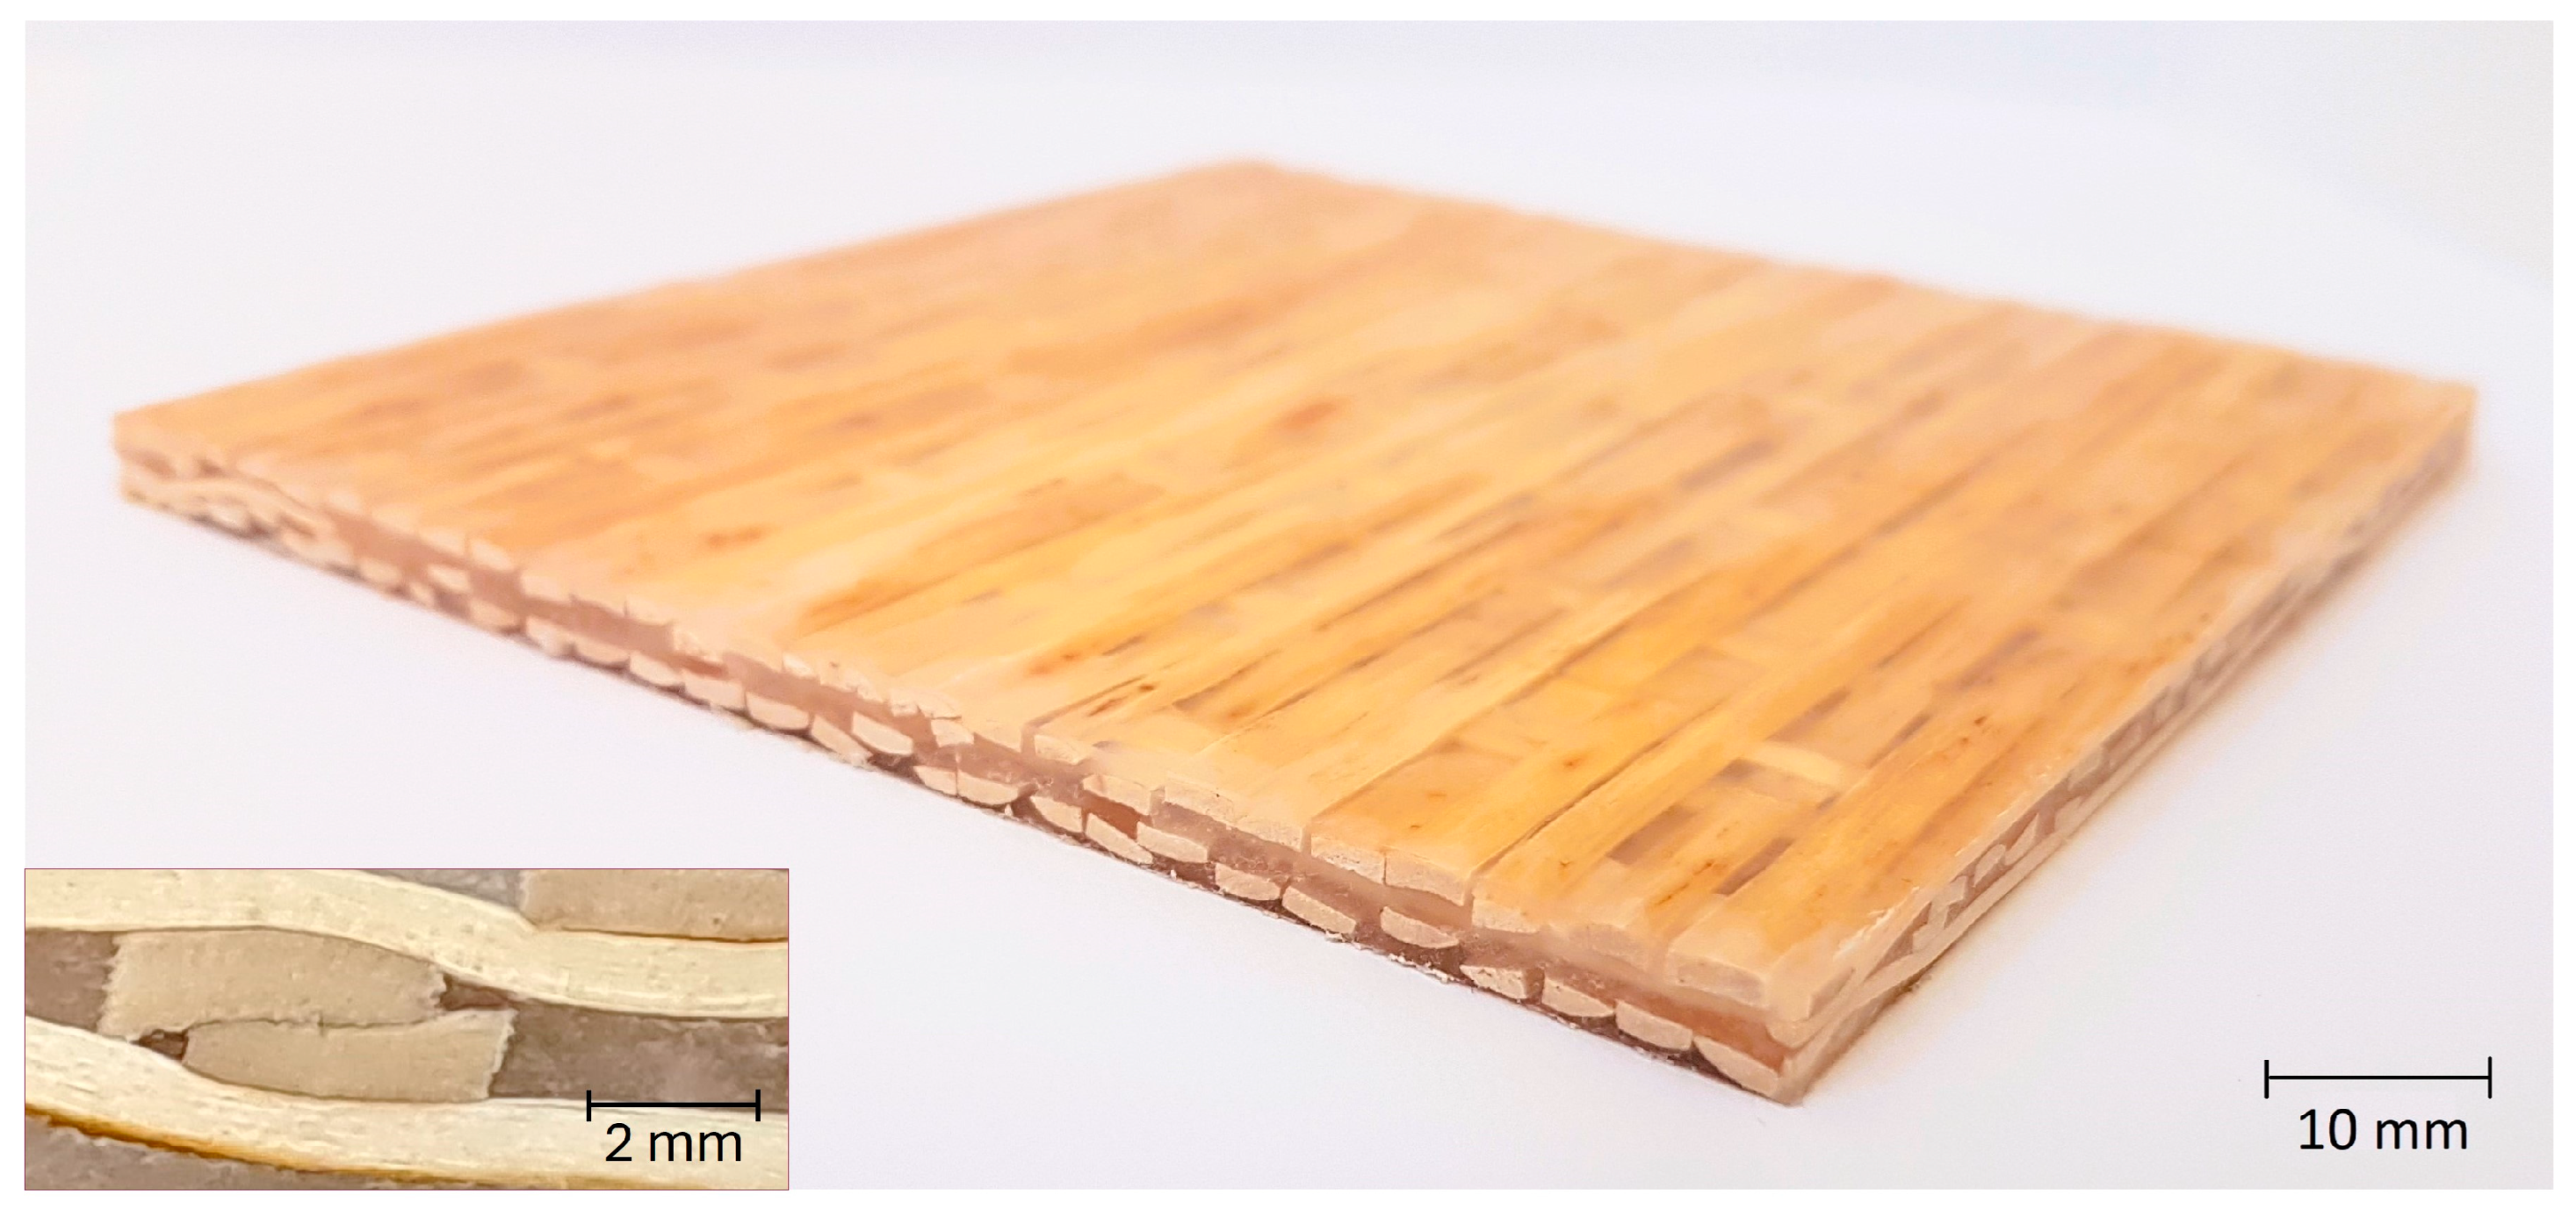
Figure 2.
Set-up of the compression test.

Figure 3.
Set-up of the short-beam shear test.

Figure 4.
Illustration of a unit cell of the WTC using the simulation software Marc-Mentat. (Version 2021.1).
Figure 4.
Illustration of a unit cell of the WTC using the simulation software Marc-Mentat. (Version 2021.1).

Figure 5.
(a) Results of the tensile test: tensile strength and Young’s modulus of WTC 0°, WTC 90°, polypropylene, willow strips 0°, and solid willow 90°; (b) results of the tensile test: stress–strain diagrams of WTC 0°, WTC 90°, polypropylene, willow strips 0°, and solid willow 90.
Figure 5.
(a) Results of the tensile test: tensile strength and Young’s modulus of WTC 0°, WTC 90°, polypropylene, willow strips 0°, and solid willow 90°; (b) results of the tensile test: stress–strain diagrams of WTC 0°, WTC 90°, polypropylene, willow strips 0°, and solid willow 90.

Figure 6.
(a) SEM image of the fracture surface of the tensile test specimen (0°), 23× magnification; (b) SEM image of the fracture surface of the tensile test specimen (90°), 25× magnification.
Figure 6.
(a) SEM image of the fracture surface of the tensile test specimen (0°), 23× magnification; (b) SEM image of the fracture surface of the tensile test specimen (90°), 25× magnification.

Figure 7.
(a) Results of the three-point-bending test: three-point-bending strength and flexural modulus of WTC 0° and WTC 90°, polypropylene, and solid willow 0° and 90°; (b) results of the three-point-bending test: stress–strain diagrams of WTC 0° and WTC 90°, polypropylene, and solid willow 0° and 90°.

Figure 8.
(a) Results of the compression test: compressive strength and compressive modulus of WTC 0° and WTC 90°, polypropylene, and willow 0° and 90°; (b) results of the compression test: stress–strain diagrams WTC 0° and WTC 90°, polypropylene, and willow 0° and 90°.
Figure 8.
(a) Results of the compression test: compressive strength and compressive modulus of WTC 0° and WTC 90°, polypropylene, and willow 0° and 90°; (b) results of the compression test: stress–strain diagrams WTC 0° and WTC 90°, polypropylene, and willow 0° and 90°.

Figure 9.
(a) SEM image of a WTC test specimen after compression test in the main fiber direction (0°), 29× magnification; (b) SEM image of a WTC test specimen after the compression test in the main fiber direction (0°), 500× magnification.
Figure 9.
(a) SEM image of a WTC test specimen after compression test in the main fiber direction (0°), 29× magnification; (b) SEM image of a WTC test specimen after the compression test in the main fiber direction (0°), 500× magnification.

Figure 10.
(a) Overview image of a test specimen after short-beam shear test according to DIN EN ISO 14130, 20× magnification; (b) detailed image of the same test specimen, 50× magnification; (c) detailed image of a test specimen after short-beam shear test according to ASTM D2344, 80× magnification.

Figure 11.
(a) Visualization of delamination by “Adhesion deactivation” in Marc-Mentat; (b) selected positions for detailed examination of delamination.
Figure 11.
(a) Visualization of delamination by “Adhesion deactivation” in Marc-Mentat; (b) selected positions for detailed examination of delamination.

Figure 12.
Simulated shear stress as a function of the increment number.

Figure 13.
Visualization of the simulated shear stress in Marc-Mentat at increment 25.


Table 1.
Summary of all data obtained from the tensile test, the three-point bending test, and the compression test.
Table 1.
Summary of all data obtained from the tensile test, the three-point bending test, and the compression test.
| Material | Tensile Strength (MPa) | Young´s Modulus (MPa) | Elongation at Break (%) | Flexural Strength (MPa) | Flexural Modulus (MPa) | Compressive Strength (MPa) | Compressive Modulus (MPa) |
|---|---|---|---|---|---|---|---|
| PP | 31.75 ± 0.22 | 1480.61 ± 15.89 | 6.50 ± 0.41 | 54.67 ± 2.33 | 1371.09 ± 81.12 | 53.09 ± 4.52 | 946.75 ± 95.53 |
| Willow (0°) | 91.99 ± 12.98 * | 7840.91 ± 1854.94 * | 1.25 ± 0.28 * | 76.12 ± 14.20 | 8116.78 ± 750.25 | 35.15 ± 2.44 | 1914.57 ± 111.54 |
| Willow (90°) | 4.59 ± 0.19 | 280.17 + 40.99 | 2.32 ± 0.33 | 10.14 ± 2.41 | 564.78 ± 284.14 | 4.97 ± 0.15 | 162.85 ± 15.75 |
| WTC (0°) | 49.00 ± 3.89 | 4901.91 ± 977.12 | 1.34 ± 0.12 | 75.97 ± 11.07 | 5428.28 ± 834.01 | 37.95 ± 2.88 | 1543.02 ± 270.68 |
| WTC (90°) | 18.65 ± 4.62 | 2148.90 ± 265.86 | 1.14 ± 0.04 | 23.31 ± 3.66 | 1387.03 ± 65.75 | 28.61 ± 1.88 | 969.11 ± 165.17 |
* Determined on willow strip, not on solid wood (see Section 2.3).
Table 2.
Comparison of the properties of WTC with woven-fiber-reinforced PP composites in the tensile and three-point bending test according to [40,42].
| Material | Tensile Strength (MPa) | Young’s Modulus (MPa) | Elongation at Break (%) | Flexural Strength (MPa) | Flexural Modulus (MPa) |
|---|---|---|---|---|---|
| WTC, satin weave | 49.00 ± 3.89 | 4901.91 ± 977.12 | 1.34 ±0.12 | 75.97 ± 11.07 | 5428.28 ± 834.01 |
| Jute-fiber-reinforced PP (50% by weight), plain weave [40] | 48.00 ± 2.40 | 2500.00 ± 0.20 | 12.00 ± 3.00 | 56.00 ± 2.60 | 4500.00 ± 0.14 |
| Jute-fiber-reinforced PP, twill weave [42] | 47.55 ± 3.42 | 4350.00 ± 0.34 | 2.53 ± 0.18 | 54.00 ± 0 | 4760.00 ± 0 |
Disclaimer/Publisher’s Note: The statements, opinions and data contained in all publications are solely those of the individual author(s) and contributor(s) and not of MDPI and/or the editor(s). MDPI and/or the editor(s) disclaim responsibility for any injury to people or property resulting from any ideas, methods, instructions or products referred to in the content. |
© 2024 by the authors. Licensee MDPI, Basel, Switzerland. This article is an open access article distributed under the terms and conditions of the Creative Commons Attribution (CC BY) license (https://creativecommons.org/licenses/by/4.0/).
Share and Cite
MDPI and ACS Style
von Boyneburgk, C.L.; Oikonomou, D.; Seim, W.; Heim, H.-P. Mechanical Analysis and Simulation of Wood Textile Composites. J. Compos. Sci. 2024, 8, 190. https://doi.org/10.3390/jcs8050190
AMA Style
von Boyneburgk CL, Oikonomou D, Seim W, Heim H-P. Mechanical Analysis and Simulation of Wood Textile Composites. Journal of Composites Science. 2024; 8(5):190. https://doi.org/10.3390/jcs8050190
Chicago/Turabian Stylevon Boyneburgk, Claudia L., Dimitri Oikonomou, Werner Seim, and Hans-Peter Heim. 2024. "Mechanical Analysis and Simulation of Wood Textile Composites" Journal of Composites Science 8, no. 5: 190. https://doi.org/10.3390/jcs8050190