

Offshore Wind Power Potential in Brazil: Complementarity and Synergies


Energy Planning Program, COPPE, Universidade Federal do Rio de Janeiro (PPE/COPPE-UFRJ), Rio de Janeiro 21941-914, Brazil
*
Authors to whom correspondence should be addressed.
Energies 2023, 16(16), 5912; https://doi.org/10.3390/en16165912
Submission received: 22 June 2023
/
Revised: 13 July 2023
/
Accepted: 26 July 2023
/
Published: 10 August 2023
(This article belongs to the Special Issue Optimal Planning and Operation in RES-Rich Power Systems under Electricity and Carbon Emission Market Environment)
Abstract
:Renewable sources stand out in energy planning due to their contribution to greenhouse gas emission reduction when displacing fossil fuels and the enhancement of energy security through the diversification of the energy matrix. Understanding and optimizing the complementary operative synergy between different energy sources over time and space leads to efficient policies. This article uses an hourly Pearson’s correlation coefficient to explore the complementarity between offshore wind and other power generation sources in the Brazilian matrix. An analysis of offshore wind power feasibility in the Brazilian power system will be conducted, considering environmental implications, synergies with the oil industry, costs, and complementarities with other energy sources. The methodology uses an optimization model to minimize costs and optimize the production mix while considering the time series of renewable energy, subject to demand constraints, renewable resource availability, reservoir storage, capacity limitations, and thermal generation. The study concludes that the northeast and southeast electrical subsystems must start offshore wind installation in Brazil due to their complementarity with hydropower production, synergy with the oil and gas industry, and proximity to the largest consumption spots.
1. Introduction
The importance of renewable sources to energy planning can be attributed to their contribution to reducing greenhouse gas emissions (GHG) as well as maintaining energy security by diversifying the matrix. Energy systems scenario cases from several countries indicate that there are good prospects for the transition toward sustainable energy systems due to significant advances in the development of renewable energy technology, resource assessment, and systems design [1,2]. It is possible to exploit good resources of wind, wave, and solar power in areas that have largely remained untapped [1], such as those in Latin America [3]. Brazil is a continental country with an extensive coastline and an abundance of natural resources, including oil and natural gas. Despite this, there are several opportunities, such as offshore wind power. This work focuses on evaluating the opportunities to use offshore wind resources in Brazil for electricity generation by analyzing the complementarity between offshore wind and the main energy sources. Establishing the most suitable locations for wind offshore power plant installation and contributing to the National Interconnected System’s (SIN, in Portuguese) energy security are the desired outputs of this analysis.
Several authors emphasize the benefits of offshore wind, such as job creation, reduced use of fossil resources, improved national energy security, rapid technological improvements, and reduced GHG emissions [4,5]. These authors point out that the main advantage is the quality and resource availability, and the main disadvantage is the high cost of installations in offshore environments. However, technological progress has already enabled a 20% drop in the cost of energy between 2010 and 2018 [6].
In addition, Brazil has great offshore wind potential [7,8,9,10,11,12,13]. Silva (2015) estimated the offshore wind potential for the Brazilian exclusive economic zone at 8688 GW and highlighted that the highest values of turbine production are between depths of 0 and 35 m in the northeast region [7]. Further, Silva (2019) analyzed the offshore wind potential in Brazil from different perspectives: theoretical (1687.6 GW), technical (1064.2 GW), and environmental and social (330.5 GW) [8]. The environmental and social potential of offshore wind in Brazil is the most restricted; however, it corresponds to twice the total power capacity currently installed in Brazil and more than 20 times the installed capacity of onshore wind energy [8]. Azevedo et al. (2020) calculated an annual average total power generation of 14,800 TWh based on a Brazilian aerogenerator installable capacity of 3 TW [9].
The Brazilian Wind Potential Atlas [10] provides maps of the annual average wind speed that illustrate what Ortiz and Kampel (2011) state: that winds with greater magnitude in the maritime environment are located on the coast of states that also have a high degree of onshore wind energy use [11]. Pimenta, Kempton, and Garvine (2008) estimated the total potential for offshore wind energy generation in the south and southeast regions of Brazil in shallower waters (up to 50 m) at 102 GW, and they concluded that Brazil has a promising offshore wind resource and it is economically attractive [12]. Vinhoza et al. (2023) also state that Brazil offers a great deal of untapped potential for offshore wind energy, and its costs are competitive internationally [13].
Furthermore, Brazil also has experience using onshore wind resources and offshore oil exploration structures [14,15,16]. Offshore wind power can be complementary to other energy sources, and when installed near large consumer spots, it reduces the loss in energy transport (transmission and distribution) [7].
In synergy with the oil industry, there is the possibility of extending the useful life of oil and gas fields and reusing data, structures, knowledge, and experience [14] in the wind offshore industry. Moreover, fixed oil platforms in the decommissioning process can be reused for offshore wind power generation [15,17], or floating wind turbines can generate energy for oil platforms as an alternative system. In northeastern Brazil, a region known for its great wind potential, all platforms are nearing their end or have already exceeded their useful lives, presenting low oil productivity [16]. In the next few years, there is no projection for power production from offshore wind in Brazil; however, the reuse of platforms may be the gateway to offshore wind exploration in the country [16].
The aim of this article is to analyze the impact of large-scale offshore wind generation’s introduction in the Brazilian electricity system, addressing environmental issues, synergy with the oil industry, costs, and complementarity with other sources of generation. Complementarity was analyzed using Pearson’s correlation coefficient between offshore wind resources and power generation of other sources in the Brazilian electrical matrix. Power generation expansion scenarios were built with an optimization model, simulating the generation of offshore wind power in Brazil from reanalysis data and comparing it with other energy sources to analyze its complementarities. These results lead to the identification of the potential costs and benefits of integrating offshore wind sources into the grid. The main outcome is providing information to decision-makers regarding the best measures by achieving a balance between electricity demand, climate change goals, and environmental integrity.
Extensive research has explored the complementarity of multi-energy sources, such as wind, solar, and hydropower [18,19,20,21,22,23,24]. Beluco et al. (2003) and Kougias et al. (2016) conducted research on the complementarity between hydropower and solar energy based on different methodologies. The former study proposed dimensionless mathematical indices to evaluate varying degrees of complementarity [18], and the latter one aimed to develop a methodology utilizing an optimization algorithm to assess the complementarity between small hydropower and solar photovoltaic (PV) systems [19]. Peron (2017) analyzed the potential of complementarity between the different sources of power generation based on a statistical approach involving Pearson correlation analysis between the resources and evaluation of combinations and optimization of the generation plots to minimize the energy deficit in the northeast region of Brazil [20]. Silva et al. (2016) identified areas with the possibility of high complementarity between offshore winds and hydrological regimes in Brazil. They used Pearson’s correlation coefficient, coherence, and cluster analyses to assess the wind variability and monthly precipitation in Brazil on seasonal and interannual timescales [23]. Naeem et al. (2019) used Pearson’s correlation and an optimization model to analyze the spatial and temporal complementary characteristics of solar and wind in order to achieve reliable operation of a grid-connected microgrid in Ireland [21]. Rosa et al. (2017) used the Pearson’s correlation coefficient and linear programming to optimize the hydro, photovoltaic, and onshore wind power mix in Rio de Janeiro (Brazil) with a monthly resolution time series [22]. The utilization of Pearson’s correlation metric remains prevalent in research papers focused on measuring complementarity among multi-energy sources [24]. However, no study has explored hydro/wind/PV/thermoelectric and specifically wind offshore power output hourly complementarity in Brazil. This article explores the complementarity of already established resources (hydro, onshore wind, and solar PV) with a new energy source in Brazil (offshore wind) using an hourly optimization model and Pearson’s correlation coefficient.
Jurasz et al. (2020) reviewed studies that investigated complementarity between renewable energy sources around the world. According to the findings of the study, complementarity assessments should be extended to provide the user with additional information on how these metrics can be applied in practice, as well as the statistical relationship between these energy sources [24]. As part of this article, an analysis of offshore wind power complementarity with other energy sources is provided, enabling the establishment of the most suitable locations for wind farms to be built in the Brazilian electrical system.
2. Offshore Wind and Complementarity with Other Resources
The offshore wind installed capacity worldwide was 64.3 GW in 2022, and the global offshore wind market grew 29% per year between 2013 and 2022, benefiting from rapid technological improvements [25]. The enormous potential of offshore wind makes it a key player in the global future energy mix, highlighting the significance of developing offshore wind in emerging markets. Moreover, largely unexploited areas with good offshore wind resources still exist around the world [3,26,27,28,29]. GWEC (2023), for instance, identifies Brazil and India as offshore wind markets that are worth watching [25,29]. Rusu (2019, 2020) points to the Black Sea [26,27] and Baltic Sea [28] as unexploited areas. Although Brazil currently lacks the installed capacity for offshore wind, this renewable energy source holds the potential to serve as a sustainable complement to the country’s energy portfolio.
In Brazil, marine wind energy production projects are initiating the environmental licensing process. However, these projects have a short-term, small chance of being installed due to the current economic unviability and the lack of a detailed [30] regulatory framework. As a result, critical factors such as environmental licensing, implementation, or a detailed concession framework remain unsolved, and they are fundamental for the advancement of this new source [31].
Electrical matrix diversification adds resilience to the system to deal with climatic phenomena, supply fuel shocks, or drought. Energy complementarity is the capability of one or more sources to present complementary energy availability and work in a complementary way, that is, to not be positively correlated in time, space, or jointly in both domains [18,24], and this becomes possible when energy resources are combined in extensive regions and over time.
The research exploring the complementarity of renewable resources, including wind, solar, and hydropower [18,19,20,21,22,23,24], employs datasets of measured climatic data, or in cases where the weather stations are insufficient, utilizes statistical models to estimate resource availability across various locations over time. In the literature, energy complementarity is usually estimated from the correlation between different regional energy resources, normally using Pearson’s correlation coefficient.
Complementarity can be useful for solving wind energy challenges because projects in different locations or wind projects combined with other energy sources in different locations are virtually managed as a complementary solution. Complementarity is an operation strategy that provides better quality of available supplies, a shorter service failure time, and less irregularity in the system generation curve.
In addition to the energy complementarity in time and space, the complementarity of the characteristics and benefits of different energy sources can also be mentioned. No single source has all the necessary features for optimal electrical system operation or is self-sufficient. The best option is complementarity between generation sources, which must operate together, creating a resource mix with different attributes. The aim is to assess the feasibility of offshore wind power integration in the Brazilian electrical system, considering environmental factors, synergy with the oil industry, cost considerations, and complementarity with other energy sources. This analysis will enable the identification of appropriate locations for deploying wind farms.
The Brazilian electricity production and transmission system is a large hydro/thermo/wind system, with a predominance of hydropower plants. The different regions of the SIN have different hydrological, wind, and solar irradiation regimes that may present seasonal complementarity with each other, so the transmission line interconnection is extremely important. The complementarity between different regions influences reliability improvement. Positive synergy between the sources provides an increase in the percentage guaranteed power index of the integrated generation system [32]. Power demand is concentrated in the southern and eastern regions, and major electricity generation assets (primarily hydropower) are in the northern and western regions. Intermittent resource incorporation in the electrical matrix is based on the interconnection of transmission lines, reserve capacity, and complementarity, increasing capacity for supply, distributing the generation weight between resources, ensuring safety among resources, and ensuring greater safety through decreased variability [33].
The existing methods used to handle fluctuations in electricity demand and manage reserves (including storage, contingency, and response reserves) result in additional expenses or partial loss of energy production. Therefore, it is crucial to explore alternatives [19]. One option is to optimize complementarity between different intermittent sources, specifically addressing the balance between total energy production and its temporal stability.
Offshore wind farms are currently absent in the Brazilian power sector, primarily due to the substantial investment costs involved. Therefore, multiple scenarios were built to analyze the potential competitive conditions for offshore wind power, considering complementarity with other energy sources.
3. Materials and Methods
In Brazil, the Electric System National Operator (ONS) is responsible for coordinating SIN operations and deciding the optimal power generation of each power plant. The medium-term electrical planning is performed using NEWAVE, a dynamic stochastic optimization model, which is a monthly operation planning model with a 5-year horizon up to four Brazilian subsystems. NEWAVE monthly data are disaggregated by other models, such as DECOMP and DESSEM, for weekly and time dispatch [34]. The objective function of NEWAVE, DECOMP, and DESSEM is to minimize operating costs.
In this work, the Climate-based Optimization of Renewable Power Allocation (COPA) model was used [35,36,37] to optimize the power generation mix, minimize costs, and account for the time series of renewable power production—photovoltaic solar, wind, and hydropower—subject to demand constraints—availability of renewable resources, water storage in reservoirs, capacity restrictions, and thermal generation [38]. It is a linear, deterministic model, with hourly resolution and five regions of discretization. COPA model input data were parametrized according to scenarios provided by the Brazilian Energy Planning Company. For instance, energy exchange constraints and installed capacity of power plants were based on Ten-Year Energy Expansion Plan 2029 [39].
SIN operation models are complex and do not allow various scenario executions or long simulation periods. COPA is a long-term electricity generation model of systems with high renewable source participation. In addition, the COPA model has the advantage of allowing intermittent sources to compete simultaneously with others, aiming to account for the unpredictability of wind and solar photovoltaic production and, thus, create time series considering water flows, wind speeds, and solar radiation [35].
The four SIN subsystems were specified in COPA (north, south, northeast, and southeast/midwest). There is a 5th region for transmission purposes only, where there is no load and no power generation; it is a fictitious node. The model is designed for the Brazilian energy system but can be adapted to other regions if necessary. The scenarios developed involve the introduction of offshore wind as an expansion option to satisfy the future energy load in each of these subsystems. The deployment of additional renewables is limited by the electricity demand that is not satisfied by existing hydropower projects. The system has been optimized for one-year duration.
Electrical system total costs consider the investment, operation, and maintenance costs of all power plants that are necessary to meet demand. Power plants receive cost data individually, according to their technology. There are two categories of power plants: existing, which have zero investment costs and are already installed, and available for expansion, which considers the investment costs and potential in each subsystem. Intermittent renewables have investment costs and a maximum potential that can be invested. For thermal plants, the fuel variable costs are contemplated as well. When the power plant already exists, the investment cost is zero; for example, hydropower plants have no costs in the model because any scenario considers new hydropower plant construction. The objective function is to minimize the system’s total costs, which is a simple sum of production costs throughout the period [36].
Since COPA is a deterministic model, there are no hydrological, load, or planning uncertainties. It has perfect resource foresight. This limitation may result in underestimating the costs of integrating uncertain resources. The model chooses between the different renewable energy capacities in different regions and optimizes the production mix represented by the hourly time series of wind, solar, and water production for each plant (existing or new) in each subsystem, depending on its capacity factor. The model also manages hydropower reservoirs and thermal backup dispatch using energy hourly series. The results indicate optimal regions to expand the system through powerplant installation, which in this study’s case is an offshore wind farm settlement.
3.1. Correlation Analyses
Resource and energy production complementarity in Brazil was investigated using Pearson’s correlation coefficient (). The coefficient r indicates the intensity and association direction between two variables, given by the following:
here represents the observed value of the series (, …, ), represents the average, and is the standard deviation. The same logic can be applied to . This coefficient was calculated by comparing resource and power generation over time (hourly series in one year) and space (regions of Brazil). Pearson’s correlation coefficient, which ranges from −1 to +1, provides information on the relationship between variables. A positive signal indicates that the variables vary in the same direction and have similar behavior, while negative signal suggests that one variable decreases when the other increases. Furthermore, the magnitude of the coefficient reflects the strength between the variables [23]. Thus, if it is closer to −1, the more complementary the resources are; that is, when one tends to increase, the other tends to decrease. When the value approaches 1, the series are more similar, and the features are more correlated.
As these extreme values (0 or |1|) are hardly found in practice, this article considers values of r (+ or −), ranging from 0.10 to 0.29 indicating weak correlation, from 0.30 to 0.49 moderate correlation, and values exceeding 0.50 representing -strong correlation. The complementarity was investigated using Pearson’s correlation coefficient between power production obtained from COPA over time and space.
3.2. Input Data
The model expansion capacity relies on hourly time series data of renewable energy production obtained from reanalysis data. These data are employed to establish the optimal combination of capacity generation, assuming perfect forecasting, in addition to simulating the power plant’s hourly dispatch.
Climate input variables used in this study are derived from the MERRA-2 global reanalysis data set. The reanalysis data combine historical observational data into a numerical weather forecast model to reconstruct the climate, generating a complete set of data in space–time [40]. For this analysis, data were retrieved from the Renewables Ninja website [41], a calibrated model that simulates the MERRA-2 hourly power produced by wind farms located anywhere in the world and has been validated in 23 European countries [40]. MERRA-2 reanalysis data were selected due to their convenient accessibility, high spatial and temporal resolution, and consistent stability across different time scales.
Meteorological parameters change significantly from year to year, which is essential for the interannual complementarity study.
It is important to note that climate change affects the climatic conditions that are crucial to renewable resources. Due to climate change, renewable energies in Brazil are vulnerable [42,43]. In Brazil’s poorest regions, climate change may negatively affect electricity generation (particularly hydropower) and biofuel production [43]. Brazil’s energy matrix is sensitive to climate variations due to hydroelectricity and wind power [44].
However, to represent a long period of data, one must choose a year with the typical characteristics of the site. The typical meteorological year allows us to apply the knowledge of local climatology to the procedures for evaluation, design, planning, and operation of generation plants from renewable sources [44]. Since 2014, Brazil has been going through a water crisis scenario that is still being regularized, so 2013 was chosen to be the typical meteorological year. The most important input data for the operational model are power capacity factors from onshore and offshore wind, photovoltaic solar energy, and hydropower power production (Table 1).
The offshore wind capacity factors obtained from the Renewables Ninja website are from 2013, with a 7 MW turbine model at a height of 140 m. This turbine model was chosen because it represents the average nominal power of 6.8 MW in 2018 worldwide [29].
A limitation of the study in using only MERRA-2 reanalysis data without a calibration specifically for Brazil is that data from numerical simulation models add uncertainty to energy resource assessment estimates. The use of experimental offshore wind measurement data through measurement campaigns and offshore weather stations is necessary; however, there is a high cost in obtaining these types of data.
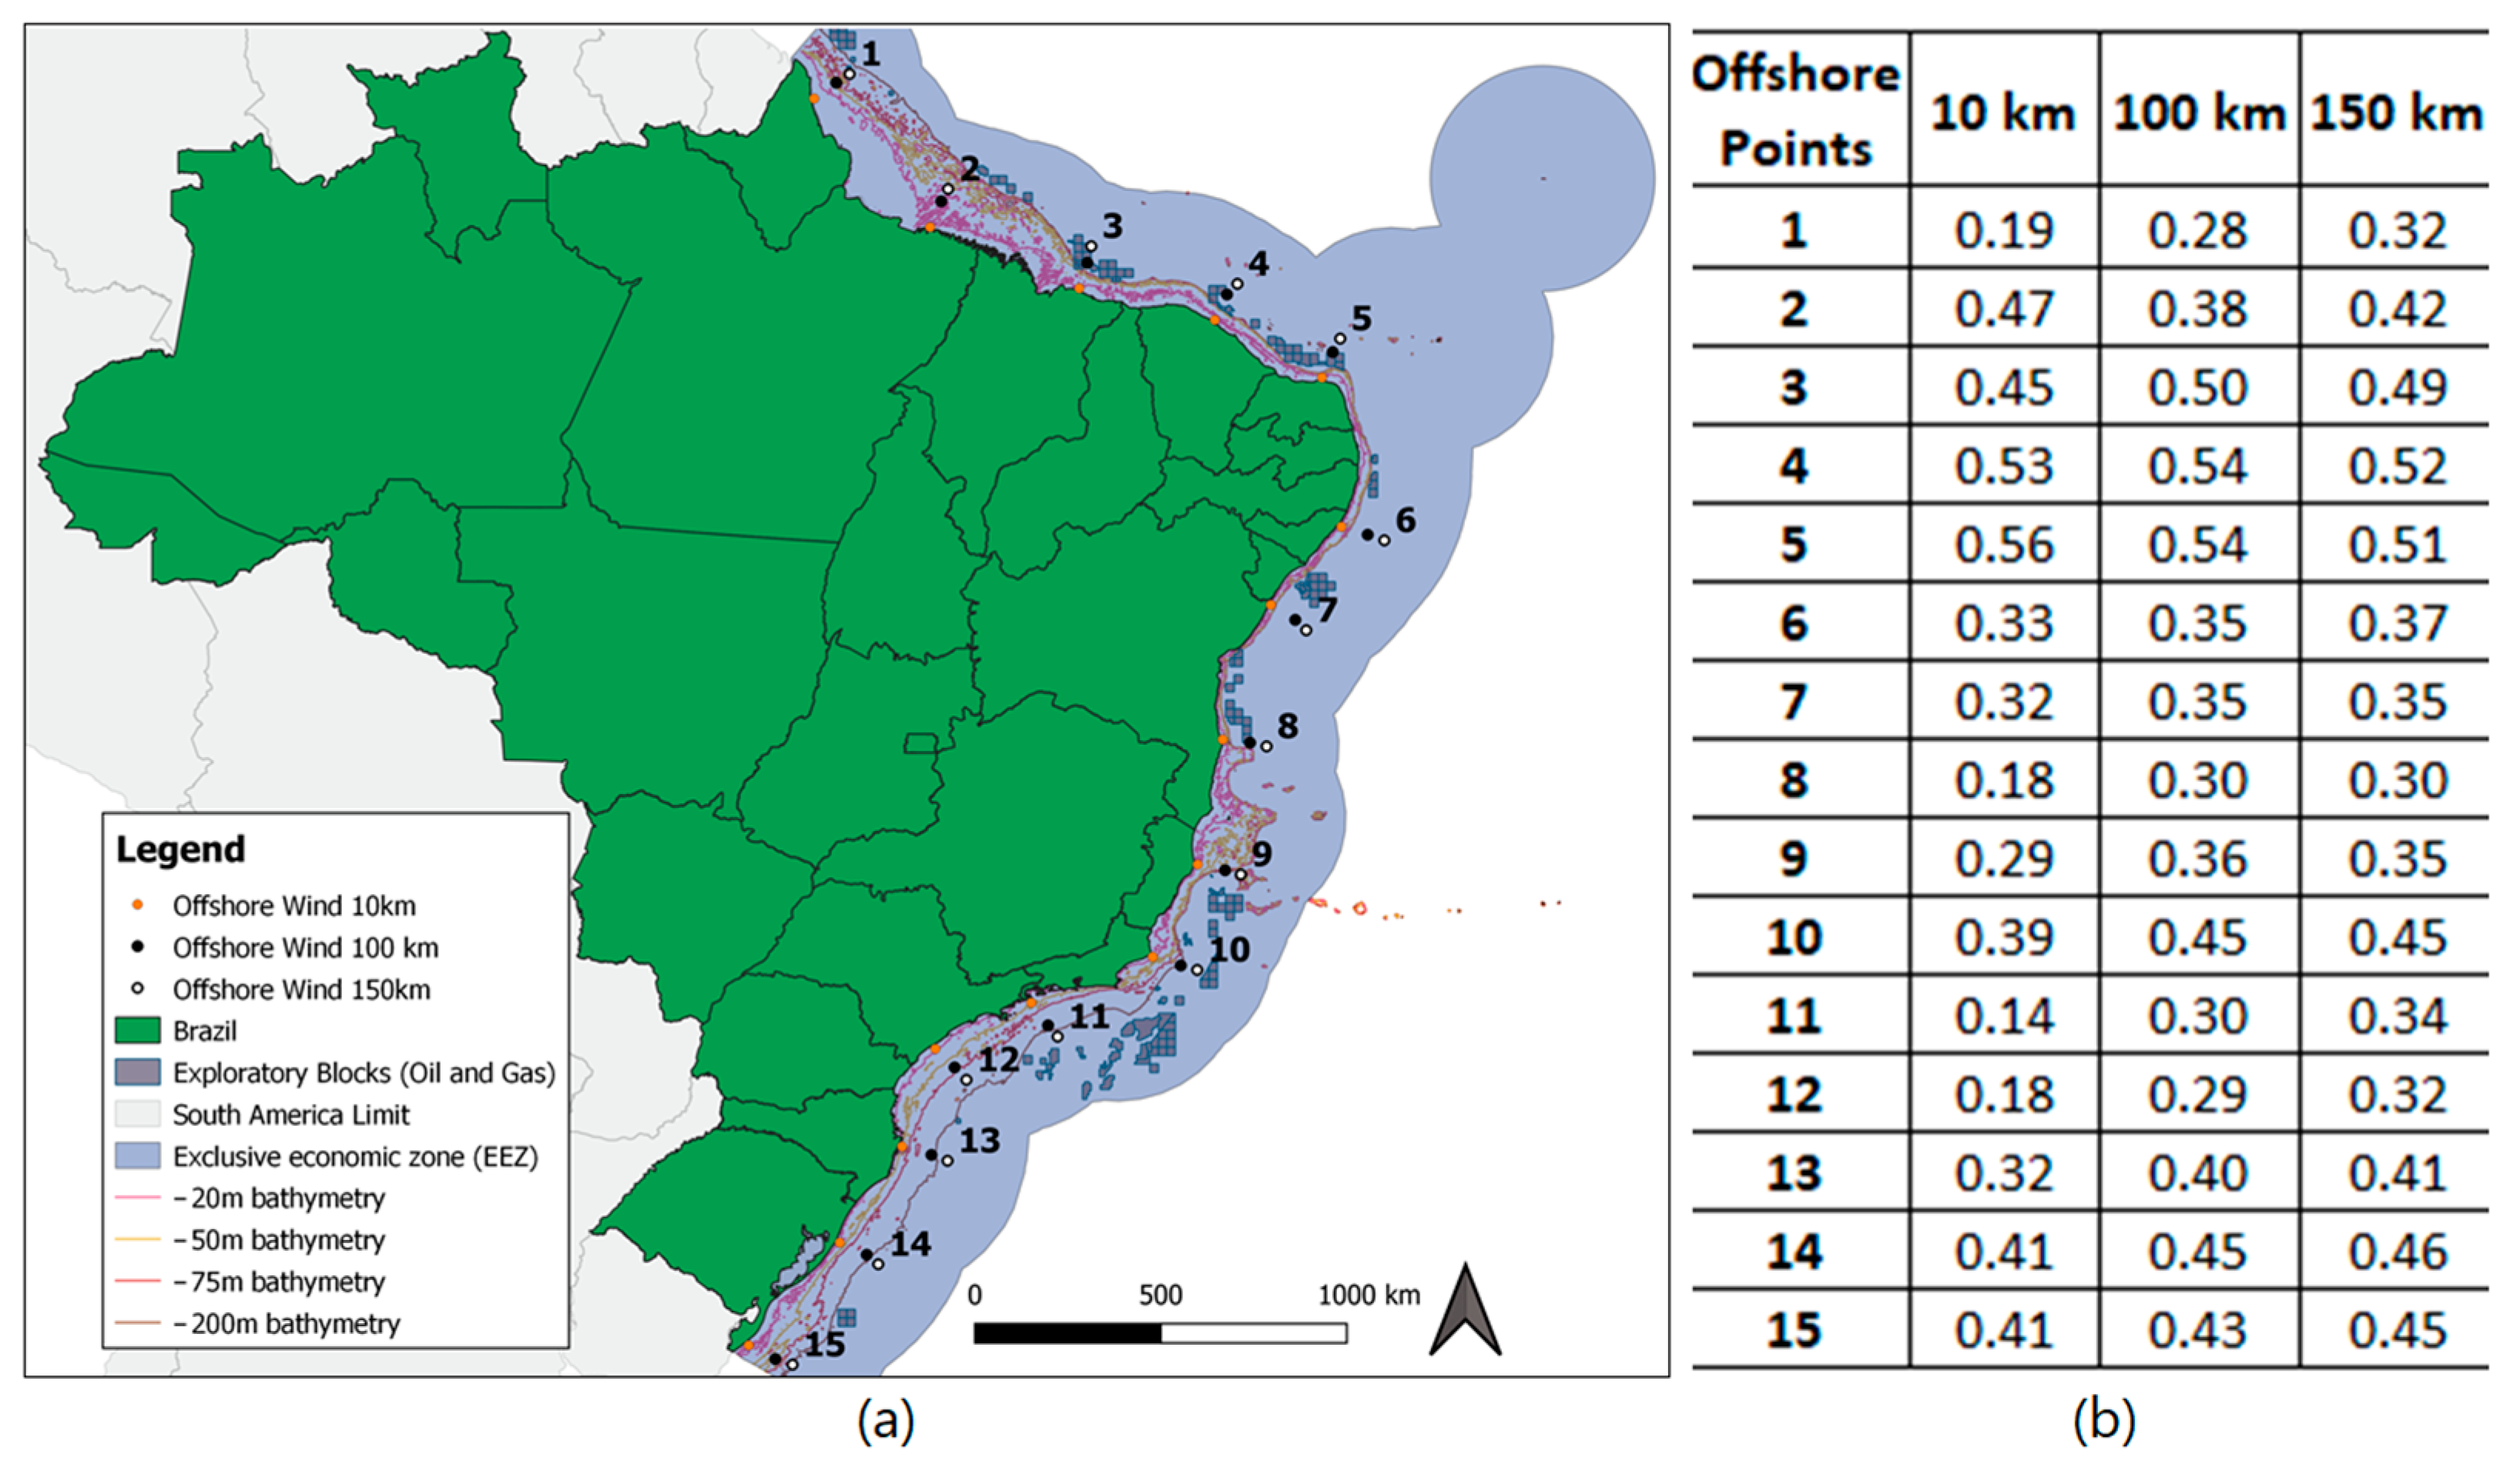
Offshore wind power production is generated using hourly data from the capacity factor of 45 points in Brazil, 10 km, 100 km, and 150 km (15 points each) far from coast, distributed across the north, northeast, southeast, and south regions (Figure 1). The hourly capacity factor of each subsystem was calculated by averaging the hourly capacity factors of the points in each subsystem.
Points 4 and 5 (on the coast of Ceará and Rio Grande do Norte) show the best locations for wind generation in Brazil, contemplating only capacity factors and depth. These points have the highest average capacity factors at all distances from the coast, where hourly peaks can be found with up to 96% capacity factor. In addition, the ocean depth in the northeast subsystem is slight, especially in Ceará and Rio Grande do Norte, where it is possible to find maximum depths from 50 m up to 70 km from the coast [52].
The 10 km distance was used to represent the wind farms with a fixed foundation near the coast, as they do not interfere so much in touristic regions and economic activities along the coast. In addition, all 15 points chosen 10 km from the coast have depths less than 50 m, which makes the installation of a fixed foundation viable. The location of offshore wind farms has a minimum distance from the coast between 2 and 15 km [8]. A minimum distance of approximately 10 km from the coast produces a 48% reduction in the public rejection rate, as the turbines would have no effect on recreational use of the beach [53]. UK and Germany currently have the farthest wind farms from shore, at over 100 km each [29]. The 100 km distance was chosen to represent the farthest from shore, and in the case of Brazil, floating wind farms, because the average depth at that distance is greater than 60 m. The 150 km distance is an analysis of future floating wind farms further from the coast.
3.3. Scenarios
To assess offshore wind complementarity with other energy sources, we have developed 10 scenarios to simulate offshore wind generation and determine impacts of this energy type in different subsystems, installed capacities, and system performance. In each scenario, we defined an offshore wind capacity specified by subsystem at a distance of 10 km from the Brazilian shore, because when offshore wind enters the market, it will likely have a fixed foundation.
Scenarios were created with the installed capacities of 400 MW and 800 MW offshore wind in different regions. Nowadays, Brazil has at least 800 MW of offshore wind in environmental licensing process in the northeast, with a single park of 400 MW [31]. In addition, the average size of wind farms in 2018 was 561 MW worldwide.
The reference scenario does not have offshore power plants. In this scenario, offshore wind was an option for expansion; however, the model was not chosen due to the high installation cost. In the other 9 scenarios, we defined an offshore wind development to analyze the SIN behavior—zero investment costs. The location and combination of regions in the scenarios were chosen based on data of greater resource complementarity, proximity to demand spots, and synergy with the oil and gas sector.
4. Results
We analyzed the changes in the Brazilian power mix incorporating a range of offshore wind expansion capacities and verifying the fact that the complementarity between hydro reservoirs and offshore wind plants is able to replace thermal power plants in some cases. The hourly Pearson’s correlation coefficients indicated a low complementarity between solar and offshore wind production in the north, south, and southeast/midwest. In different subsystems, offshore wind plants are correlated. The same occurs with onshore and offshore winds; they are correlated. Coastal areas in the northeast and southeast have more positive points for the deployment of offshore wind farms. There is a greater complementarity between offshore wind generation in the northeast and southeast and hydropower in the southeast/midwest, northeast, and north regions. In addition, there is synergy with the oil industry in those two regions. The southeast is the nearest region with the highest energy consumption. With those results, it is possible to minimize decision-makers’ uncertainties in investment allocations. Brazil’s offshore winds can diversify the electricity matrix, stabilize water fluctuations, and reduce thermal plant use, which increases the cost of production and the emissions of polluting gases.
4.1. Complementarity Analysis of Resources in Brazil
The hourly resource time series in Brazil covering 2013 was used to calculate the Pearson’s correlation coefficient. The results are divided between different subsystems and energy resources, indicating the cross-correlations between resources. There is a significant complement between marine wind resources and water sources (Table 2), mainly in the southeast/midwest, and north regions, with offshore winds from the northeast and southeast (lowest grade). The results here are similar to those found by Silva (2015) and Borba (2023). There is a moderate seasonal complementarity between the flow in the southeast/midwest, and northeast, 10 km from shore winds ( = −0.48).
Regarding solar onshore and wind offshore resources, there is low complementarity. This relationship is slightly more significant when comparing the offshore wind resources in the southeast with solar radiation in the southeast/midwest, and northeast. Nascimento et al. (2022) examined offshore wind and offshore solar energy sources, and their findings also indicated an annual and hourly complementarity between these two sources. The offshore solar complements offshore wind up to 40% in the northeast region within a water depth of up to 50 m [54]. Additionally, offshore wind plants at varying distances from the shoreline are correlated, primarily within the subsystem. The same occurs when comparing winds at sea and on land, as the resources are more correlated than complementary.
Offshore wind behavior varies in comparison to onshore winds depending on the Brazilian geographic region, and there is a significant variability of winds along the coast during the seasons. The southeast has the lowest average offshore capacity factor in Brazil, and in the autumn and winter, it is slightly lower than in the spring and summer. The onshore and offshore values are to some degree correlated, and the marine capacity factor varies less than the land resource.
The northeast subsystem offshore capacity factor value is more constant than the great variation that exists onshore. These values are moderately correlated. This subsystem has the largest average capacity factor in Brazil, and its highest values occur in the winter and spring.
In the north subsystem, offshore wind capacity factors are slightly higher during the summer and autumn, while in the winter and spring, these values are lower. These results are similar to those found by Silva (2015). In this subsystem, the onshore capacity factor is negligible, and the offshore suffers great variations throughout the year.
The south subsystem has the second-largest average capacity factor in Brazil. Offshore wind is highly correlated with onshore wind. In addition, the subsystem has the highest rate of oscillations throughout the year, with the most significant values in the winter and spring.
4.2. Results of Offshore Wind Power Integration into the Brazilian Electrical System (COPA)
The first scenario considers the current installation cost of offshore wind power plants, resulting in no offshore wind generation in Brazil. This technology was not competitive compared to other available options for expansion. For this reason, scenarios were created to simulate offshore wind generation, considering already-installed power plants (zero installation cost) to evaluate their complementarity with other sources. The share of each source in the Brazilian electrical matrix indicates that offshore wind power shifts thermoelectric generation into the electricity mix (Table 3).
The hourly time series resulting from COPA covering 2013 was used to calculate the Pearson’s correlation coefficient. These coefficients between offshore wind generation in different regions and energy production from different sources (Table 4) in all scenarios presented a similar correlation coefficient; that is, the power generation behavior is the same when the offshore wind is installed in a certain subsystem, varying only in the amount of energy produced.
4.2.1. Wind Offshore and Hydropower
Hydropower energy represented 64.9% of the country’s electricity generation in 2019 [55], and grid stabilization in the medium and long term is necessary. In order to provide more stable and reliable electrical generation, the complementarity of these sources also allows for a gain in water storage during critical periods of drought where hydraulic generation is compromised.
With the increase in wind energy penetration, the aim is to bring benefits to the SIN taking advantage of the water storage (energy) in hydropower plants, the opportunity to use the existing water and transmission resources more efficiently, and the potential to improve hydrological operations, as well as to develop a more diversified, robust, and clean general energy supply portfolio [56].
Northeast Subsystem
Offshore wind generation has a strong seasonality in the northeast. Although the annual behavior of the accumulated hourly generation of hydropower dams and offshore wind power in the northeast subsystem is complementary, there is no correlation between the electricity production values ( = −0.03). However, when offshore wind generation in the northeast is compared to hydropower in the north, there is a moderate complementarity ( = −0.38), which benefits the system. In the north subsystem, hydropower plants have no reservoir due to environmental issues and are run-of-the-river hydroelectric powerplant (without seasonal or multiannual regularization). In other words, the hydropower plant’s potential is only reached during the wet period because, in the dry period, the generation is much lower. Therefore, the complementary generation of energy by offshore wind in the northeast is beneficial for the system, and the seasonality of the winds (greatest generation between June and November) is inverse to the seasonality of the rain regime (greatest generation between December and May).
Southern Subsystem
There is a moderate ( = −0.4) complementarity between hydropower in the southern subsystem and offshore wind generation in the same subsystem. Although the resources are not complementary (Table 2), the hourly series of hydropower energy production is strongly influenced by storage in the reservoirs.
The complementarity between offshore wind power in the south subsystem and water generation in the southeast/midwest subsystem, although weak ( = −0.26), can bring benefits to the system, as the southeast subsystem has the largest hydro storage capacity and also has the higher energy demand of the SIN. In other words, the south subsystem exports energy to the southeast to meet its demand. Additionally, the south subsystem contributes to reduce the depletion of reservoirs in the southeast.
Southeast/Midwest Subsystem
The hourly correlation between hydropower and offshore wind generation in the southeast is insignificant ( = −0.06); however, the seasonal complementarity between these two sources in the subsystem can be highlighted. Offshore wind generation is greatest between June and November, when the dry season occurs.
North Subsystem
Offshore wind production in the northern subsystem presents a weak complementarity ( = −0.21) in relation to hydro generation in the same subsystem. When comparing this new energy production with the generation in hydropower plants in other regions, there is no correlation between the sources.
Electrical system operation planning expects natural source complementarity, so that the secondary source (offshore wind) complements the main source (hydraulic) in periods of low hydro availability. One of the benefits of complementarity is that offshore wind meets the modulation and seasonality demanded by hydropower plants. The hydro/wind complementarity identified in some regions can optimize the use of hydropower energy reservoirs in the country.
In Brazil, wind generation has played a fundamental role in times of low hydro generation [57]. There is a great generation synergy between hydropower and wind sources, with wind energy production being generally stronger during the dry season (from May to October).
Brazil
Offshore wind and hydro generation have greater seasonal complementarity in the northeast and southeast (lowest grade) when assessing the energy production from these sources along Brazil (Figure 2). When offshore wind farms are implemented in the northeast and southeast regions, the largest offshore wind production occurs in the second half of the year, while for hydro, it occurs in the first. Thus, there is complementarity in these subsystems between offshore and hydropower wind sources. That is, during the dry period, when the levels of the reservoirs and the energy production of the hydropower plants are reduced, it occurs precisely when the offshore wind farms have their greatest generation. Consequently, the results show a lower marginal operating cost and less need for thermoelectric drive. In addition, Borba et al. (2023) also demonstrated that as the wind power capacity increases, dynamic dispatch is shifted, and natural gas becomes less important during the dry seasons. Using existing reservoirs, offshore wind farms can be integrated into highly renewable scenarios, but they are not sufficient in a complete phaseout of fossil fuels, which requires other storage sources [58].
4.2.2. Wind Offshore and PV
Offshore wind power plants installed in the south, southeast, and north are negatively (weak) hourly correlated with photovoltaic farms (Table 2). When analyzing the correlation between sources on a typical day (correlation between the average generation of each source at one hour of the day), the magnitude of this complementarity increases (Table 5).
The northeast subsystem has a strong correlation between solar generation and offshore wind power. Meanwhile, the most negative correlation occurs between offshore wind in the south and photovoltaic in the northeast ( = −0.88), indicating that greater offshore wind generations are observed at night, when there is no photovoltaic generation.
During the year, there is a weak correlation between wind offshore and solar PV. While offshore wind generation is greater during the second half of the year, photovoltaic generation does not change sharply over the year (Figure 3). However, in terms of the correlation between the average generation in daily hours, there is a strong complementation between these two sources since wind offshore plants are installed in the south and southeast (Table 5). In addition, there is a benefit of these two sources’ integration complementarity: the combined generation curve has a more subtle variation than the one with only PV production (Figure 3). That is, the integration of offshore wind and solar resources can contribute to minimize the intermittent resource’s electricity variability.
4.2.3. Wind Offshore and Thermal Plants
Thermopower generation in the electric matrix is a strategic factor for the Brazilian electricity sector, as it can meet the base load, complement renewable sources, or meeting cutting-edge demands. With major hydropower generation of electricity in Brazil, the thermoelectric plants have acted significantly in periods of hydrological scarcity. However, they emit GHG during energy production.
Offshore wind generation in Brazil displaces a certain share of the thermal generation of the electrical mix (Table 3), making it even more based on renewable resources. Although small, thermoelectric generation in the northeast subsystem decreases with the highest offshore wind generation share entering the matrix (Figure 4). As a first exercise, offshore wind penetration in the matrix in each scenario is modest, but there is a trend that the greater the entry of offshore wind in the matrix, the smaller the use of thermal generation, which can be replaced by hydro/wind complementary.
4.2.4. Offshore Wind Farm’s Location
Each subsystem in Brazil has favorable and unfavorable points for offshore wind farm installation. However, the regions with the most favorable points are the coastal areas of the northeast and southeast.
In the north subsystem, the average capacity factor is higher than in the southeast. However, there is no resource complementarity, no synergy with oil, and it is far from the energy demand spot in Brazil, requiring large investment in the transmission lines. The south subsystem has one of the largest capacity factors in Brazil, but the complementarity of wind and water resources is less than in the northeast and southeast subsystems, and there is no synergy with the oil industry.
In the southeast, the wind offshore capacity factor is the lowest one, but this resource is somewhat complementary with the water source. However, an offshore wind farm installed in this subsystem is located close to the largest demand spot in Brazil, which would reduce the energy transport loss and investments in new transmission line construction. In addition, there is synergy with the oil industry, as there are several active fields that offshore wind energy can be used to supply the platform itself or deployed on decommissioned fixed platforms.
In the northeast, there are several favorable characteristics that could make this subsystem the main gateway to this new source of wind energy in Brazil. The biggest capacity factors are present in this subsystem, and these wind resources are quite complementary with the water source. There is synergy with the oil industry and decommissioning of platforms, as in the southeast. In addition, the depth of the ocean in the region is relatively slight.
Because of their favorable points, the northeast and southeast regions were chosen for the installation of offshore wind energy and representation of the Brazilian electric mix projected for 2030 through the scenario “northeast offshore wind (800 MW) and southeast (400 MW)” (Figure 5).
To represent the beginning of offshore wind power production in Brazil, we selected the scenario “Offshore Wind southeast (400 MW) and northeast (800 MW)” due to the benefits already mentioned in each subsystem and the system’s reliability index increment with two distinct regions. The resource complementarity between different regions influences the improvements to the system’s reliability [32]. These complementarities, whether separately or combined, provide flexibility and constancy for SIN energy production.
From the annual behavior of electricity generation by source and consumption of electricity (load curve) in Brazil (Figure 5), it is observed that the consumption of electricity and photovoltaic generation remain practically constant; they do not vary much during the year, while hydropower generation reduces due to rain reduction in the dry period (from May to November). However, onshore and offshore wind generation increases, especially in the second half of the year, when the reservoirs water levels are low. The highest wind intensity months are those with the lowest rainfall intensity and vice versa.
5. Discussion and Conclusions
Brazil has a significantly growing energy demand, and energy planning should focus on defining an electrical matrix with fewer environmental and social impacts without preventing the expansion of installed capacity in an economically viable way.
The COPA model encompasses historical offshore wind availability profiles per region using a typical meteorological year. Future work can include the effect of climate change on wind availability to address the complementarity between offshore wind power plants and the other sources of electricity conversion.
Brazil has a great offshore wind power potential (330.5 GW—more restrictive potential considering social and environmental aspects [8]), diversified in time and space, and complementary with hydropower and solar resources. The Brazilian electric matrix is based on hydropower generation and medium- and long-term grid energy stabilization is necessary. Commonly, hydropower is complemented by conventional sources, such as thermoelectric. However, offshore wind energy can assist hydropower generation storing water for future power generation or other uses. In addition, the operational system cost is reduced since with greater offshore wind penetration, there is a reduction in thermoelectric use, which has the most expensive operation costs due to fuel use.
In addition, there is the complementarity of the characteristics and benefits of hydropower and wind energy. Hydropower reservoir flexibility will help in wind energy integration through storage [56,58]. At the same time, wind resources will help hydropower reservoirs in the long term, as their seasonal variability and drought impacts are expected to decrease [23,58]. Brazilian coast offshore winds can diversify the electrical matrix, stabilize water fluctuations, avoid rationing and blackouts, and reduce thermal plant use, which increases production costs and pollutes gas emissions [7].
The offshore wind source has important advantages in Brazil: the greatest potential is the possibility of installation close to load spots, synergy with oil, and the possibility of complementarity with water and solar sources. Coastal areas in the northeast and southeast have more favorable points for the deployment of offshore wind farms. There is a greater complementarity between offshore wind generation in the northeast and southeast and hydropower in the southeast/midwest, northeast, and north regions. In addition, there is synergy with the oil and gas industry in those two regions, and the southeast is the nearest region with the highest energy consumption. Although the south subsystem has a greater offshore wind capacity factor than the southeast, it does not have these last two factors that are positive to the location of the offshore wind.
With those results, it is possible to minimize decision-makers’ uncertainties in investment allocations. Brazil’s offshore winds can diversify the electricity matrix, stabilize water fluctuations, and reduce thermal plant use, which increases electricity production costs and the emission of polluting gases.
Since the complementarity between wind offshore resources and further sources of electricity conversion has been proven in this paper, future works should encompass the development of power regulation to accommodate hydrogen production from offshore wind and its environmental impacts.
Author Contributions
Conceptualization, E.C.N. and A.O.P.J.; methodology, E.C.N., A.O.P.J. and R.C.M.; software, E.C.N. and R.C.M.; validation, E.C.N., A.O.P.J. and R.C.M.; formal analysis, E.C.N. and R.C.M.; investigation, E.C.N. and R.C.M.; resources, E.C.N.; data curation, E.C.N.; writing—original draft preparation, E.C.N.; writing—review and editing, A.O.P.J. and R.C.M.; visualization, E.C.N., A.O.P.J. and R.C.M.; supervision, A.O.P.J. All authors have read and agreed to the published version of the manuscript.
Funding
This work was supported by the National Council for Scientific and Technological Development (CNPq) through scholarships awarded to Erika Nogueira (Grant number 141198/2020-6) and Amaro Pereira (303432/2022-5).
Data Availability Statement
Not applicable.
Conflicts of Interest
The authors declare no conflict of interest.
Abbreviations
| GHG | greenhouse gas |
| SIN | National Interconnected System (in Portuguese) |
| PV | photovoltaic solar energy |
| GWEC | Global Wind Energy Council |
| ONS | Electric System National Operator (in Portuguese) |
| NEWAVE | Long- and Medium-Term Interconnected Hydro-Thermo-Wind Systems Operation Planning Model (Modelo de Planejamento da Operação de Sistemas Hidro-termo-eólicos Interligados de Longo e Médio Prazo in Portuguese) |
| DECOMP | Short-term planning model for the operation of interconnected hydrothermal systems (Modelo de Planejamento de Curto Prazo da Operação de Sistemas Hidrotérmicos Interligados in Portuguese) |
| DESSEM | Short-Term Hydrothermal Dispatch Model (Modelo de Despacho Hidrotérmico de Curto Prazo in Portuguese) |
| COPA | Climate-based Optimization of Renewable Power Allocation |
| S | south |
| SE/MW | southeast/midwest |
| NE | northeast |
| N | north |
References
- Østergaard, P.A.; Duic, N.; Noorollahi, Y.; Mikulcic, H.; Kalogirou, S. Sustainable Development Using Renewable Energy Technology. Renew. Energy 2020, 146, 2430–2437. [Google Scholar] [CrossRef]
- Østergaard, P.A.; Duic, N.; Noorollahi, Y.; Kalogirou, S. Latest Progress in Sustainable Development Using Renewable Energy Technology. Renew. Energy 2020, 162, 1554–1562. [Google Scholar] [CrossRef]
- Rusu, E.; Onea, F. A Parallel Evaluation of the Wind and Wave Energy Resources along the Latin American and European Coastal Environments. Renew. Energy 2019, 143, 1594–1607. [Google Scholar] [CrossRef]
- IEA. Offshore Wind Outlook 2019; IEA: Paris, France, 2019. [Google Scholar]
- Esteban, M.D.; Diez, J.J.; López, J.S.; Negro, V. Why Offshore Wind Energy? Renew. Energy 2011, 36, 444–450. [Google Scholar] [CrossRef] [Green Version]
- IRENA. Renewable Power Generation Costs in 2018; IRENA: Abu Dhabi, United Arab Emirates, 2019. [Google Scholar]
- Silva, A.R. Energia Eólica em Alto Mar: Distribuição dos Recursos e Complementaridade Hídrica. Ph.D. Thesis, Universidade Federal do Rio Grande do Norte, Natal, Brazil, 2015. [Google Scholar]
- De Carvalho Silva, A.J.V. Potencial Eólico Offshore No Brasil: Localização de Áreas Nobres Através de Análise Multicritério; Universidade Federal do Rio de Janeiro: Rio de Janeiro, Brazil, 2019. [Google Scholar]
- De Azevedo, S.S.P.; Pereira, A.O.; da Silva, N.F.; de Araújo, R.S.B.; Júnior, A.A.C. Assessment of O Shore Wind Power Potential along the Brazilian Coast. Energies 2020, 13, 2557. [Google Scholar] [CrossRef]
- CEPEL. Atlas Do Potencial Eólico Brasileiro: Simulações 2013; CEPEL: Rio de Janeiro, Brazil, 2017. [Google Scholar]
- Ortiz, G.P.; Kampel, M. Potencial de Energia Eólica Offshore na Margem do Brasil; V Simpósio Brasileiro de Oceanografia: Santos, Brazil, 2011. [Google Scholar]
- Pimenta, F.; Kempton, W.; Garvine, R. Combining Meteorological Stations and Satellite Data to Evaluate the Offshore Wind Power Resource of Southeastern Brazil. Renew. Energy 2008, 33, 2375–2387. [Google Scholar] [CrossRef]
- Vinhoza, A.; Lucena, A.F.P.; Rochedo, P.R.R.; Schaeffer, R. Brazil’s Offshore Wind Cost Potential and Supply Curve. Sustain. Energy Technol. Assess. 2023, 57, 103151. [Google Scholar] [CrossRef]
- De Carvalho, L.P. A Potencial Sinergia Entre a Exploração e Produção de Petróleo e Gás Natural e a Geração de Energia Eólica Offshore: O Caso Do Brasil; Universidade Federal do Rio de Janeiro: Rio de Janeiro, Brazil, 2019. [Google Scholar]
- Da Costa, K.M. Reutilização de Plataformas Fixas Para Geração de Energia Eólica Offshore; UFRJ: Rio de Janeiro, Brazil, 2018; Volume 53. [Google Scholar]
- Barros, J.C.; Fernandes, G.C.; Silva, M.M.; Da Silva, R.P.; Santos, B. Fixed Platforms at Ageing Oil Fields—Feasibility Study for Reuse to Wind Farms. In Proceedings of the Annual Offshore Technology Conference; Offshore Technology Conference, Houston, TX, USA, 1–4 May 2017; Volume 6, pp. 4564–4581. [Google Scholar]
- Braga, J.; Santos, T.; Shadman, M.; Silva, C.; Assis Tavares, L.F.; Estefen, S. Converting Offshore Oil and Gas Infrastructures into Renewable Energy Generation Plants: An Economic and Technical Analysis of the Decommissioning Delay in the Brazilian Case. Sustainability 2022, 14, 13783. [Google Scholar] [CrossRef]
- Beluco, A.; Krenzinger, A.; Souzza, P. A Complementariedade No Tempo Entre as Energias Hidrelétrica e Fotovoltaica. Rev. Bras. Recur. Hídricos 2003, 8, 99–109. [Google Scholar] [CrossRef]
- Kougias, I.; Szabó, S.; Monforti-Ferrario, F.; Huld, T.; Bódis, K. A Methodology for Optimization of the Complementarity between Small-Hydropower Plants and Solar PV Systems. Renew. Energy 2016, 87, 1023–1030. [Google Scholar] [CrossRef]
- Peron, A. Análise da Complementaridade das Gerações Intermitentes No Planejamento da Operação Eletro-Energética da Região Nordeste Brasileira. Master’s Thesis, Unicamp, Campinas, Brazil, 2017. [Google Scholar]
- Naeem, A.; Hassan, N.U.; Yuen, C.; Muyeen, S.M. Maximizing the Economic Benefits of a Grid-Tied Microgrid Using Solar-Wind Complementarity. Energies 2019, 12, 395. [Google Scholar] [CrossRef] [Green Version]
- Rosa, C.; Costa, K.A.; Christo, E.; Bertahone, P.B. Complementarity of Hydro, Photovoltaic, and Wind Power in Rio de Janeiro State. Sustainability 2017, 9, 1130. [Google Scholar] [CrossRef] [Green Version]
- Silva, A.R.; Pimenta, F.M.; Assireu, A.T.; Spyrides, M.H.C. Complementarity of Brazils Hydro and Offshore Wind Power. Renew. Sustain. Energy Rev. 2016, 56, 413–427. [Google Scholar] [CrossRef]
- Jurasz, J.; Canales, F.A.; Kies, A.; Guezgouz, M.; Beluco, A. A Review on the Complementarity of Renewable Energy Sources: Concept, Metrics, Application and Future Research Directions. Sol. Energy 2020, 195, 703–724. [Google Scholar] [CrossRef]
- GWEC. Global Wind Report 2023| GWEC; GWEC: Brussels, Belgium, 2023. [Google Scholar]
- Rusu, L. The Wave and Wind Power Potential in the Western Black Sea. Renew. Energy 2019, 139, 1146–1158. [Google Scholar] [CrossRef]
- Rusu, E. A 30-Year Projection of the Future Wind Energy Resources in the Coastal Environment of the Black Sea. Renew. Energy 2019, 139, 228–234. [Google Scholar] [CrossRef]
- Rusu, E. An Evaluation of the Wind Energy Dynamics in the Baltic Sea, Past and Future Projections. Renew. Energy 2020, 160, 350–362. [Google Scholar] [CrossRef]
- GWEC. Global Offshore Wind Report 2020; GWEC: Brussels, Belgium, 2020. [Google Scholar]
- González, M.O.A.; Santiso, A.M.; de Melo, D.C.; de Vasconcelos, R.M. Regulation for Offshore Wind Power Development in Brazil. Energy Policy 2020, 145, 111756. [Google Scholar] [CrossRef]
- EPE. Roadmap Eólica Offshore Brasil; EPE: Brasilia, Brazil, 2020; Volume 141. [Google Scholar]
- Haydt, G.; Guerreiro, A.; Rosa, F.; Lopes, L.; Cunha, S. Avaliação da Confiabilidade de Parques Eólicos na Região Nordeste do Brasil. In Proceedings of the XVI ERIAC-16° Encuentro Regional Iberoamericano de Cigré; XVI Eriac Decimosexto Encuentro Regional Iberoamericano de Cigré, Iguazú Port, Argentina, 17–21 May 2015; pp. 4–12. [Google Scholar]
- Pimenta, F.M.; Assireu, A.T. Simulating Reservoir Storage for a Wind-Hydro Hydrid System. Renew. Energy 2015, 76, 757–767. [Google Scholar] [CrossRef]
- CEPEL. Energy Operation Planning. Available online: http://www.cepel.br/pt_br/produtos/programas-computacionais-por-categoria/planejamento-da-operacao-energetica.htm (accessed on 2 January 2021).
- Schmidt, J.; Cancella, R.; Pereira, A.O. The Role of Wind Power and Solar PV in Reducing Risks in the Brazilian Hydro-Thermal Power System. Energy 2016, 115, 1748–1757. [Google Scholar] [CrossRef]
- Schmidt, J.; Cancella, R.; Pereira, A.O. An Optimal Mix of Solar PV, Wind and Hydro Power for a Low-Carbon Electricity Supply in Brazil. Renew. Energy 2016, 85, 137–147. [Google Scholar] [CrossRef]
- Schmidt, J.; Cancella, R.; Junior, A.O.P. The Effect of Windpower on Long-Term Variability of Combined Hydro-Wind Resources: The Case of Brazil. Renew. Sustain. Energy Rev. 2016, 55, 131–141. [Google Scholar] [CrossRef]
- Schmidt, J. COPA Model. Available online: https://homepage.boku.ac.at/jschmidt/COPA/index.html (accessed on 18 August 2020).
- MME/EPE. PDE 2029—Ten-Year Energy Expansion Plan- Executive Plan; MME/EPEL: Brasília, Brasil, 2019. [Google Scholar]
- Staffell, I.; Pfenninger, S. Using Bias-Corrected Reanalysis to Simulate Current and Future Wind Power Output. Energy 2016, 114, 1224–1239. [Google Scholar] [CrossRef] [Green Version]
- Staffell, S.; Pfenninger, I. Renewables Ninja Downloads. Available online: https://www.renewables.ninja (accessed on 19 June 2019).
- Lucena, A.F.P.; Szklo, A.S.; Schaeffer, R.; de Souza, R.R.; Borba, B.S.M.C.; da Costa, I.V.L.; Júnior, A.O.P.; da Cunha, S.H.F. The Vulnerability of Renewable Energy to Climate Change in Brazil. Energy Policy 2009, 37, 879–889. [Google Scholar] [CrossRef]
- Ruffato-Ferreira, V.; da Costa Barreto, R.; Oscar Júnior, A.; Silva, W.L.; de Berrêdo Viana, D.; do Nascimento, J.A.S.; Freitas, M.A.V. A Foundation for the Strategic Long-Term Planning of the Renewable Energy Sector in Brazil: Hydroelectricity and Wind Energy in the Face of Climate Change Scenarios. Renew. Sustain. Energy Rev. 2017, 72, 1124–1137. [Google Scholar] [CrossRef]
- Machado, R.D.; Bravo, G.; Starke, A.; Lemos, L.; Colle, S. Generation of 441 Typical Meteorological Year from INMET Stations—Brazil. In Proceedings of the ISES Solar World Congress 2019 and IEA SHC International Conference on Solar Heating and Cooling for Buildings and Industry 2019, Santiago, Chile, 4–7 November 2019; pp. 2189–2200. [Google Scholar]
- ONS. Dados Hidrológicos-Vazões. Operador Nacional do Sistema Elétrico. Available online: http://www.ons.org.br/Paginas/resultados-da-operacao/historico-da-operacao/dados_hidrologicos_vazoes.aspx (accessed on 15 September 2019).
- ONS. Energia Armazenada. Operador Nacional do Sistema. Available online: http://www.ons.org.br/Paginas/resultados-da-operacao/historico-da-operacao/energia_armazenada.aspx (accessed on 15 September 2019).
- Gruber, K.; Klöckl, C.; Regner, P.; Baumgartner, J.; Schmidt, J. Assessing the Global Wind Atlas and Local Measurements for Bias Correction of Wind Power Generation Simulated from MERRA-2 in Brazil. Energy 2019, 189, 116212. [Google Scholar] [CrossRef] [Green Version]
- ANEEL. Sistema de Informações de Geração da Agência Nacional de Energia Elétrica—SIG. Available online: https://www.aneel.gov.br/siga (accessed on 21 June 2023).
- CCEE. Todos os Dados Resultantes do Processamento do Modelo. Available online: https://www.ccee.org.br (accessed on 21 June 2023).
- La Rovere, E.L.; Wills, W.; Pereira, A.O., Jr.; Dubeux, C.B.S.; Cunha, S.H.F.; Oliveira, B.C.P.; Moreira, M.M.R.; Watanabe, S.; Loureiro, S.; Moreira, L.S.S.C.; et al. Economic and Social Implications of GHG Mitigation Scenarios in Brazil until 2030; International Economics: Rio de Janeiro, Brazil, 2016. [Google Scholar]
- EPE. Estudos Para Expansão da Geração. Custo Marginal de Expansão Do SetorElétrico Brasileiro Metodologia e Cálculo—2019; EPE: Rio de Janeiro, Brazil, 2019. [Google Scholar]
- Pimentel, J.; Andrade, F. Brazilian Wind Generation Guidebook; BTG Pactual S.A Bank- BTG Pactual Affiliate Research: São Paulo, Brazil, 2019; p. 30. [Google Scholar]
- Parsons, G.R.; Firestone, J. Atlantic Offshore Wind Energy Development: Values and Implications for Recreation and Tourism; BOEM: Sterling, VA, USA, 2018. [Google Scholar]
- de Souza Nascimento, M.M.; Shadman, M.; Silva, C.; de Freitas Assad, L.P.; Estefen, S.F.; Landau, L. Offshore Wind and Solar Complementarity in Brazil: A Theoretical and Technical Potential Assessment. Energy Convers. Manag. 2022, 270, 116194. [Google Scholar] [CrossRef]
- EPE. Balanço Energético Naciona 2020; EPE: Rio de Janeiro, Brazil, 2020. [Google Scholar]
- Acker, T. IEA Wind Task 24 Final Report: Issues, Impacts, and Economics of Wind and Hydropower Integration; IEA: Paris, France, 2011; Volume 1. [Google Scholar]
- Oliveira, C.; Zulanas, C.; Kashiwagi, D. A Long-Term Solution to Overcome the Problems Caused by Droughts in the Brazilian Power Systems. Procedia Eng. 2016, 145, 948–955. [Google Scholar] [CrossRef] [Green Version]
- Borba, P.C.S.; Sousa, W.C.; Shadman, M.; Pfenninger, S. Enhancing Drought Resilience and Energy Security through Complementing Hydro by Offshore Wind Power—The Case of Brazil. Energy Convers. Manag. 2023, 277, 116616. [Google Scholar] [CrossRef]
Figure 1.
Data location, bathymetry lines, and exploratory blocks (oil and gas) map: (a) Brazil map; (b) offshore wind hourly capacity factor 10 km, 100 km, and 150 km far from coast points.
Figure 1.
Data location, bathymetry lines, and exploratory blocks (oil and gas) map: (a) Brazil map; (b) offshore wind hourly capacity factor 10 km, 100 km, and 150 km far from coast points.

Figure 2.
Hydro generation throughout Brazil compared to offshore wind generation in each subsystem: (a) northeast offshore wind—scenario with 800 MW; (b) Ssutheast offshore wind—scenario with 400 MW; (c) south offshore wind—scenario with 400 MW; (d) north offshore wind—scenario with 400 MW.
Figure 2.
Hydro generation throughout Brazil compared to offshore wind generation in each subsystem: (a) northeast offshore wind—scenario with 800 MW; (b) Ssutheast offshore wind—scenario with 400 MW; (c) south offshore wind—scenario with 400 MW; (d) north offshore wind—scenario with 400 MW.

Figure 3.
Sum of offshore wind generation and standardized photovoltaics, in the “southeast (400 MW) and northeast (800 MW) offshore wind” scenario; (a) hourly average generation on a typical day normalized to their maximum value; and (b) weekly generation throughout the year normalized to their maximum value.

Figure 4.
Thermoelectric generation in the northeast with several percentages of insertion of offshore wind in different scenarios. Source: Authors.
Figure 4.
Thermoelectric generation in the northeast with several percentages of insertion of offshore wind in different scenarios. Source: Authors.

Figure 5.
Brazil annual performance of electric generation by source and consumption of electricity (the load curve) in the scenario “Offshore wind power southeast (400 MW) and northeast (800 MW)”. Monthly variation of the parameters normalized to their max value.
Figure 5.
Brazil annual performance of electric generation by source and consumption of electricity (the load curve) in the scenario “Offshore wind power southeast (400 MW) and northeast (800 MW)”. Monthly variation of the parameters normalized to their max value.


Table 1.
Summary of data sources.
| Data | Reference |
|---|---|
| Offshore wind resource | [41] |
| Flow | [45] |
| Maximum capacity and the initial and final levels of the reservoir | [46] |
| Solar radiation | [41] |
| Onshore wind resource | [47] |
| Onshore wind and solar installed capacity | [48] |
| Maximum onshore wind power capacity | [10] |
| Maximum offshore wind capacity | [31] |
| Capacity of transmission lines and power exchange; installed capacity of thermal power plants | [49] |
| Brazilian energy demand in 2030 | [50] |
| Offshore wind energy investment cost | [51] |
| Investment costs of other sources | [51] |
Source: Authors.
Table 2.
Correlation coefficient between different regions and energy resources: south (S), southeast/midwest (SE/MW), northeast (NE), and north (N) subsystems and the normalized values of solar radiation, flow, and the offshore wind speed at 10, 100, and 150 km far from shore and onshore winds. Green colors are more complementary and reds more correlated and bold numbers are moderate/strong correlation.

| Offshore Wind (10 km) | Offshore Wind (100 km) | Offshore Wind (150 km) | |||||||||||
|---|---|---|---|---|---|---|---|---|---|---|---|---|---|
| S | SE/MW | NE | N | S | SE/MW | NE | N | S | SE/MW | NE | N | ||
| Offshore wind (10 km) | S | 1.00 | |||||||||||
| SE/MW | 0.34 | 1.00 | |||||||||||
| NE | 0.04 | 0.21 | 1.00 | ||||||||||
| N | 0.10 | 0.17 | 0.30 | 1.00 | |||||||||
| Offshore wind (100 km) | S | 0.94 | 0.32 | 0.05 | 0.06 | 1.00 | |||||||
| SE/MW | 0.40 | 0.90 | 0.25 | 0.17 | 0.42 | 1.00 | |||||||
| NE | 0.06 | 0.19 | 0.93 | 0.24 | 0.06 | 0.27 | 1.00 | ||||||
| N | 0.09 | 0.08 | 0.07 | 0.65 | 0.05 | 0.11 | 0.10 | 1.00 | |||||
| Offshore wind (150 km) | S | 0.89 | 0.30 | 0.04 | 0.05 | 0.99 | 0.41 | 0.05 | 0.03 | 1.00 | |||
| SE/MW | 0.40 | 0.84 | 0.28 | 0.17 | 0.44 | 0.98 | 0.30 | 0.11 | 0.44 | 1.00 | |||
| NE | 0.05 | 0.18 | 0.91 | 0.24 | 0.06 | 0.27 | 0.99 | 0.10 | 0.05 | 0.30 | 1.00 | ||
| N | 0.05 | 0.04 | 0.10 | 0.86 | 0.01 | 0.07 | 0.09 | 0.76 | −0.01 | 0.07 | 0.09 | 1.00 | |
| Onshore wind | S | 0.86 | 0.22 | 0.06 | 0.13 | 0.76 | 0.26 | 0.13 | 0.12 | 0.72 | 0.26 | 0.12 | 0.09 |
| SE/MW | 0.14 | 0.27 | 0.06 | 0.14 | 0.13 | 0.34 | 0.22 | 0.23 | 0.12 | 0.34 | 0.22 | 0.17 | |
| NE | 0.15 | 0.12 | 0.45 | 0.21 | 0.12 | 0.22 | 0.59 | 0.19 | 0.11 | 0.23 | 0.56 | 0.14 | |
| N | 0.11 | 0.19 | 0.18 | 0.45 | 0.11 | 0.21 | 0.15 | 0.24 | 0.10 | 0.20 | 0.14 | 0.29 | |
| Solar | S | −0.16 | −0.13 | −0.02 | −0.07 | −0.10 | −0.17 | −0.23 | −0.18 | −0.08 | −0.15 | −0.20 | −0.10 |
| SE/MW | −0.15 | −0.21 | 0.00 | −0.13 | −0.08 | −0.21 | −0.18 | −0.20 | −0.06 | −0.19 | −0.15 | −0.15 | |
| NE | −0.14 | −0.22 | 0.01 | −0.09 | −0.06 | −0.20 | −0.17 | −0.15 | −0.05 | −0.17 | −0.14 | −0.09 | |
| N | −0.13 | −0.10 | 0.02 | −0.11 | −0.07 | −0.16 | −0.20 | −0.25 | −0.06 | −0.14 | −0.18 | −0.18 | |
| Hydro generation | S | 0.08 | 0.15 | 0.02 | −0.14 | 0.13 | 0.17 | 0.03 | −0.14 | 0.15 | 0.17 | 0.03 | −0.25 |
| SE/MW | −0.11 | −0.16 | −0.48 | 0.02 | −0.16 | −0.18 | −0.49 | 0.20 | −0.17 | −0.20 | −0.49 | 0.25 | |
| NE | −0.12 | −0.16 | −0.27 | 0.02 | −0.17 | −0.18 | −0.30 | 0.14 | −0.19 | −0.19 | −0.31 | 0.24 | |
| N | −0.09 | −0.24 | −0.54 | −0.03 | −0.12 | −0.26 | −0.56 | 0.14 | −0.13 | −0.27 | −0.57 | 0.25 | |
Table 3.
Brazilian electric matrix scenarios with the insertion of offshore wind (OW) source (% in energy).
Table 3.
Brazilian electric matrix scenarios with the insertion of offshore wind (OW) source (% in energy).
| Scenarios | Offshore Wind (%) | Onshore Wind (%) | Total Wind (%) | PV (%) | Hydro (%) | Thermo (%) |
|---|---|---|---|---|---|---|
| Without OW | 0.00 | 26.68 | 26.68 | 1.99 | 58.95 | 12.38 |
| OW northeast (800 MW) | 0.37 | 26.43 | 26.80 | 1.99 | 58.96 | 12.25 |
| OW southeast (800 MW) | 0.24 | 26.56 | 26.81 | 1.99 | 58.96 | 12.25 |
| OW southeast (400 MW) | 0.12 | 26.37 | 26.50 | 1.99 | 59.16 | 12.35 |
| OW south (400 MW) | 0.18 | 26.60 | 26.79 | 1.99 | 58.95 | 12.28 |
| OW north (400 MW) | 0.15 | 26.64 | 26.79 | 1.99 | 58.92 | 12.30 |
| OW southeast (400 MW) and northeast (800 MW) | 0.50 | 26.28 | 26.78 | 1.99 | 58.99 | 12.25 |
| OW southeast and northeast (800 MW each) | 0.61 | 26.31 | 26.92 | 1.99 | 58.95 | 12.14 |
| OW south and northeast (800 MW each) | 0.73 | 26.24 | 26.98 | 1.99 | 58.96 | 12.08 |
| OW south, southeast, and northeast (800 MW each) | 0.98 | 26.10 | 27.07 | 1.99 | 58.93 | 12.01 |
Table 4.
Summary correlation coefficient between different regions and energy production by different sources in relation to offshore wind power. Green colors are more complementary and reds more correlated.
Table 4.
Summary correlation coefficient between different regions and energy production by different sources in relation to offshore wind power. Green colors are more complementary and reds more correlated.
| COPA | |||||
|---|---|---|---|---|---|
| Offshore Wind Power Generation | |||||
| South | Southeast/Midwest | Northeast | North | ||
| Offshore wind power generation | South | 1.00 | |||
| Southeast/midwest | 0.30 | 1.00 | |||
| Northeast | 0.01 | 0.16 | 1.00 | ||
| North | - | - | - | - | |
| Onshore wind power generation | South | 0.84 | 0.20 | −0.01 | 0.10 |
| Southeast/midwest | 0.13 | 0.29 | −0.08 | 0.05 | |
| Northeast | 0.15 | 0.11 | 0.24 | 0.21 | |
| North | - | - | - | - | |
| Photovoltaic | South | −0.15 | −0.10 | 0.07 | −0.02 |
| Southeast/midwest | −0.13 | −0.16 | 0.10 | −0.07 | |
| Northeast | −0.12 | −0.18 | 0.11 | −0.05 | |
| North | −0.12 | −0.06 | 0.11 | 0.02 | |
| Hydropower | South | −0.40 | −0.06 | 0.17 | 0.07 |
| Southeast/midwest | −0.26 | −0.06 | 0.01 | 0.02 | |
| Northeast | −0.11 | 0.10 | −0.01 | 0.04 | |
| North | −0.08 | −0.16 | −0.38 | −0.21 | |
| Thermal | South | −0.21 | −0.11 | 0.05 | 0.00 |
| Southeast/midwest | −0.16 | −0.09 | 0.07 | 0.01 | |
| Northeast | −0.08 | 0.00 | 0.05 | −0.03 | |
| North | 0.05 | 0.18 | 0.46 | 0.19 | |
Table 5.
Correlation coefficient between solar PV and offshore wind generation in one day. Green colors are more complementary and reds more correlated.
Table 5.
Correlation coefficient between solar PV and offshore wind generation in one day. Green colors are more complementary and reds more correlated.
| Offshore Wind Power Generation | |||||
|---|---|---|---|---|---|
| South | Southeast/midwest | Northeast | North | ||
| Photovoltaic Power | South | −0.80 | −0.48 | 0.56 | −0.20 |
| Southeast/Midwest | −0.86 | −0.54 | 0.59 | −0.21 | |
| Northeast | −0.88 | −0.68 | 0.66 | −0.24 | |
| North | −0.80 | −0.34 | 0.49 | −0.20 | |
Disclaimer/Publisher’s Note: The statements, opinions and data contained in all publications are solely those of the individual author(s) and contributor(s) and not of MDPI and/or the editor(s). MDPI and/or the editor(s) disclaim responsibility for any injury to people or property resulting from any ideas, methods, instructions or products referred to in the content. |
© 2023 by the authors. Licensee MDPI, Basel, Switzerland. This article is an open access article distributed under the terms and conditions of the Creative Commons Attribution (CC BY) license (https://creativecommons.org/licenses/by/4.0/).
Share and Cite
MDPI and ACS Style
Nogueira, E.C.; Morais, R.C.; Pereira, A.O., Jr. Offshore Wind Power Potential in Brazil: Complementarity and Synergies. Energies 2023, 16, 5912. https://doi.org/10.3390/en16165912
AMA Style
Nogueira EC, Morais RC, Pereira AO Jr. Offshore Wind Power Potential in Brazil: Complementarity and Synergies. Energies. 2023; 16(16):5912. https://doi.org/10.3390/en16165912
Chicago/Turabian StyleNogueira, Erika Carvalho, Rafael Cancella Morais, and Amaro Olimpio Pereira, Jr. 2023. "Offshore Wind Power Potential in Brazil: Complementarity and Synergies" Energies 16, no. 16: 5912. https://doi.org/10.3390/en16165912
Note that from the first issue of 2016, this journal uses article numbers instead of page numbers. See further details here.