Development of a Homogenized Finite Element Model for Pouch Lithium-Ion Battery Cells Considering Porosity and Pressure Sensitivity

Department of Mechanical Engineering, Sogang University, Baekbeom-ro 35, Mapo-gu, Seoul 04107, Republic of Korea
*
Author to whom correspondence should be addressed.
Energies 2024, 17(5), 1162; https://doi.org/10.3390/en17051162
Submission received: 15 January 2024
/
Revised: 23 February 2024
/
Accepted: 28 February 2024
/
Published: 29 February 2024
(This article belongs to the Section D2: Electrochem: Batteries, Fuel Cells, Capacitors)
Abstract
:In light of the growing safety concerns associated with lithium-ion batteries integrated in electric automobiles, there is an escalating need to explore the mechanical behavior of lithium-ion batteries under diverse loading conditions using finite element simulations. In this paper, a homogenized finite element model was proposed to predict the material behavior of pouch lithium-ion cells using finite element simulations under various loading conditions. This homogenized model consisted of four layers of solid elements wrapped by shell elements, and it was made to consider especially the porosity and the pressure sensitivity of a pouch cell. The material properties of this homogenized model were calibrated based on the out-of-plane compression, in-plane confined compression, and 3-point bending test data for a single cell. The simulations using the model exhibited good agreement with the experimental load-displacement data not only for a single cell but also for two stacked cells. Additionally, the effects of the pouch and the vacuum on the mechanical behavior were examined.
1. Introduction
As the number of electric vehicles equipped with lithium-ion batteries (LIBs) continues to increase, there is a growing concern about their safety, particularly regarding the risk of fire or explosion during a crash. Finite element (FE) simulations have been widely employed in designing battery packages to mitigate severe damage in the event of a crash.
Among three different forms of LIBs—cylindrical, prismatic, and pouch—pouch LIBs are the most widely used in electric vehicles today. A pouch LIB battery pack consists of multiple battery modules, with each battery module housing tens of battery cells. For the FE simulations of a battery pack, adequately modeling the smallest unit, i.e., a cell, is crucial. A cell is a multi-layered structure, with each layer consisting of the anode, graphite particles around the anode, separator, cathode, and active particles around the cathode. A pouch wraps around the layered structure, securely holding the components.
There are two different types of FE models for the cell: the detailed model, and the homogenized model [1]. In a detailed model, anode and cathode foils are modeled as they are, requiring a substantial number of elements. This detailed model is suitable for analyzing separator breakage occurring prior to a fire or an explosion. However, for a crash simulation of a LIB pack, it demands an excessive number of elements, making it impractical to complete the simulation within an acceptable time. Conversely, in a homogenized model, a LIB cell is regarded as a homogeneous material and modeled accordingly. Since there is no need to accurately model metal foils and particles in a homogenized model, the number of nodes and elements can be reduced significantly, making it feasible to use a homogenized model for a crash simulation of a LIB pack.
LIBs have four key mechanical characteristics that must be modeled to accurately represent their mechanical behavior: pressure dependence, densification, anisotropy, and shear band formation [1]. Previous studies have employed five homogenized models—the crushable foam model, the honeycomb model, the Gurson model, a homogenized model using the Hill 48 yield function, and another homogenized model using the three-dimensional laminate theory—to model the mechanical behavior of LIBs. However, none of the five homogenized models accurately captures the aforementioned four mechanical characteristics of LIBs [1]. The crushable foam model, commonly used for metallic foams, has been utilized in various studies to model LIBs due to its effectiveness in characterizing the mechanical behaviors such as pressure dependence and tension cut-off [2,3,4]. However, since the crushable foam model is essentially isotropic, it cannot represent the anisotropy inherent in LIBs. Therefore, it would be difficult to accurately predict the mechanical behavior of LIBs under various loading conditions using only the crushable foam model. Sahraei et al. conducted five tests on pouch and bare LIB cells: out-of-plane compression, hemispherical punch indentation, in-plane confined compression in the length and width directions, in-plane unconfined compression in the length and width directions, and 3-point bending [4]. They also created three different FE models using solid elements of the crushable foam model, with or without the incorporation of shell elements of a linear-plastic material model. They then conducted simulations for the out-of-plane compression, the hemispherical punch indentation, and the in-plane unconfined and confined compression tests [4]. The simulation results showed reasonable agreement with the experimental load-displacement data. However, three different FE models were used to simulate the four different tests, and the FE models had too many elements to be used for a LIB pack.
The honeycomb model, available in the commercial FE software LS-DYNA, is used to model honeycomb-like materials [5]. Using the material keyword, stress-strain curves of the material can be input individually for all normal and shear stresses and strains, allowing the consideration of anisotropy and densification, which are two of the key characteristics of LIBs. Homogenized models created in previous studies using the honeycomb model predicted the mechanical behavior of a single cell under various loading conditions [6,7,8,9]. Beaumont et al. performed tests and simulations using the honeycomb model for out-of-plane compression, in-plane confined compression in the length and width directions, and 3-point bending around the length and width directions, not only for single cells but also for two stacked cells [6]. For single cells, the force-displacement curves from tests and simulations were almost identical, but for the case of two stacked cells under in-plane confined compression in the length direction, the force from the simulation was approximately 25% higher.
The Gurson model, commonly used for modeling porous metals, has also been applied to model the active and graphite particles of LIBs, as it considers the pressure dependence due to voids. Ali et al. applied the Gurson model to account for the porosity of the particles around the electrodes and in the separators, and they applied the Mises material model to the cover sheets in a Representative Volume Element (RVE) model for a cell [10]. Subsequently, they conducted FE simulations for in-plane confined compression tests, demonstrating buckling and shear band formation observed in the tests. Nevertheless, it is crucial to acknowledge that the Gurson model is a symmetric material model showing no distinction between tension behavior and compression behavior. Both the active and graphite particles, as well as the separator, show non-symmetric pressure dependency, indicating that the tension behavior differs from the compression behavior [1,11].
Wang et al. developed a homogenized model for pouch LIBs using an orthotropic elastic model, the Hill 48 yield function, and a bilinear plastic model [12]. The homogenized model had 18 parameters. Among them, 10 parameters were calibrated based on the force-displacement curve of the out-of-plane compression test, the in-plane compression test, and the 3-point bending test. The homogenized model resulted in good correlation with the out-of-plane compression and in-plane compression tests, but it was not validated for the 3-point bending test.
Gupta and Gudmundson developed a homogenization method using the three-dimensional laminate theory [13]. The method allowed them to predict the three-dimensional non-linear macroscopic behavior of a homogenized material by considering that each macroscopic integration point is a material point represented by a representative volume element consisting of active layers, current collectors, and separators, and it even facilitated the modeling of electrochemical and thermal phenomena. They implemented this method in a user subroutine at COMSOL where at each increment, with given strain increment, stress increment was updated after solving 12N + 6 equations (N; total number of layers). Based on the macroscopic solutions, layer-wise stresses and strains could then be back-calculated. They used the homogenized model for a layered cell under out-of-plane compression and showed good correlation of the homogenized model with the layered model. They also used the homogenized model (5000 elements) to simulate an irreversible swelling followed by a reversible swelling of a prismatic battery and showed good correlation with a detailed model (100,000 elements) in terms of the out-of-plane pressure field. They also simulated the swelling even for a module. However, they did not validate their results against test data.
Each of the homogenized models can approximately represent densification by using a hardening curve, but it still has certain limitations in modeling the other key mechanical characteristics of LIBs. The crushable foam model and the Gurson model, inherently isotropic, fail to account for anisotropy, while the honeycomb model lacks the incorporation of pressure dependence. Although the Gurson model addresses pressure sensitivity linked to porosity, it fails to account for the intrinsic pressure sensitivity found in the metal foils and the separator. Furthermore, some FE models, regardless of their material models, failed to induce shear band formation mainly because they did not have fine elements. In other words, to capture shear band formation, an FE model needs to have a significant number of fine elements, which prevents it from being used for a LIB pack. Thus, a homogenized model suitable for a LIB pack needs to have a comparatively small number of elements, which inherently prevents it from capturing shear band formation. However, since shear bands occur under large deformation conditions close to final failure, a homogenized model remains appropriate for predicting forces or stresses with reasonable accuracy in a crash simulation even without capturing the shear band formation. The corresponding author of this paper developed a yield function for porous solids with pressure-sensitive matrices, which is an integration of the Drucker–Prager model and the Gurson model [11]. The material model based on this combined yield function is named the Jeong model in this paper.
A review of previous studies underscores the need to develop a homogenized model that can represent the anisotropy of pouch LIB cells and the material behavior of multiple stacked cells under various loading conditions and to validate it against test data. Additionally, it is essential to examine the effects of the pouch and the vacuum conditions. This paper introduces a homogenize model, named the J & M model in this paper, where two inner layers of solid elements are modeled by the Jeong model, two outer layers of solid elements are modeled by the Mises material, and the four layers of solid elements are wrapped around by shell elements. The Jeong model in the J & M model captures pressure dependency not only due to porosity but also due to the pressure sensitivity of the matrix. A hardening curve used in the J & M model, along with its plastic potential function, realizes densification. Moreover, the two different material models, i.e., the Jeong model and the Mises model, show anisotropy in the out-of-plane direction. This paper also presents a systematic procedure to determine the material properties of the J & M model based on the force-displacement curves obtained from the out-of-plane compression test, the in-plane confined compression test, and the 3-point bending test for single cells. The J & M model was validated across the three loading conditions not only for single cells but also for two stacked cells. In addition, FE simulations were conducted with and without the pouch or the vacuum conditions, revealing the significant effects of the pouch and the vacuum conditions on the force-displacement curves of pouch LIB cells.
2. Material Models
The yielding of materials, especially that of metals, has been modeled mostly by the Mises yield function, where yielding is assumed to be independent of the hydrostatic stress. However, the yielding of steels or polymers actually depends on the hydrostatic stress, and thus it has been modeled by the Drucker–Prager yield function. In this function, yielding is assumed to be dependent on the linear combination of hydrostatic stress and effective stress, i.e., Mises stress as shown in Equation (1).
Here, represents the effective stress, and denotes the pressure sensitivity factor. It is important to note that does not represent the tensile flow stress but represents the sum of the tensile flow stress and multiplied by one third of the tensile flow stress. The Drucker–Prager yield function is a smooth functional form of the Mohr–Coulomb yield function, which describes shear failure of granules such as soils and rubbles. In the Mohr–Coulomb yield function, and are replaced with the shear strength τ and minus of the pressure-p, respectively. The parameters and (usually denoted by c) are considered as the friction coefficient and cohesion, respectively. This effect of hydrostatic stress is referred to as the pressure sensitivity of the matrix, and the pressure sensitivity factor in this paper is equal to in the previous paper of the corresponding author of this paper [11]. The pressure sensitivity factor ranges from 0.02 to 0.11 for steels [14,15] and from 0.17 to 0.43 for polymers [16]. It is noteworthy that this pressure sensitivity comes from the matrix and results in non-symmetric pressure sensitivity, meaning that the tension behavior is different from the compression behavior.
Yielding of porous materials also depends on the hydrostatic stress due to voids inside the matrix, even when the yielding of the matrix is not dependent on the hydrostatic stress. This effect of the hydrostatic stress is referred to as the pressure sensitivity of porosity, in contrast to the pressure sensitivity of the matrix modeled by the Drucker–Prager yield function. Gurson developed a yield function for porous materials with the Mises matrices by utilizing the upper bound approach for a spherical shell, as shown in Equation (2) [17,18].
Here, and represent the Cauchy stress, effective stress, and hydrostatic stress exerted on the porous material, respectively, and is the void volume fraction of the porous material. In contrast to the Drucker–Prager yield function, the Gurson yield function is symmetrically pressure-sensitive, meaning that the tension behavior is the same as the compression behavior.
For porous pressure-sensitive materials like porous polymers, both the pressure sensitivity of the matrix and that of the porosity should be taken into account. The corresponding author of this paper developed a yield function for porous materials with pressure-sensitive matrices, which is named the Jeong yield function in this paper. The detailed derivations can be found in [11]. Since using the upper bound approach for a spherical shell with the pressure-sensitive matrix is not feasible, Jeong derived the hydrostatic yield stress for a spherical shell and modified it to derive a yield function satisfying the following requirements: the yield function should become the Drucker–Prager yield function when becomes zero, and it should become the Gurson yield function when becomes zero. In this manner, Jeong successfully developed a new yield function for porous solids with pressure-sensitive matrices as in Equation (3) [11].
For non-normal plastic flow, the plastic potential function was defined to be the same as the Jeong yield function except for the pressure sensitivity factor , which is replaced with the dilatancy factor Pressure-sensitive materials such as polymers and steels show less volume change during plastic deformation than in normal plastic flow [14,15,19], which implies that the dilatancy factor is less than the pressure sensitivity factor . When is equal to zero, the plastic potential function becomes the Gurson yield function. Since the plastic strain increment tensor is proportional to the partial derivative of the plastic potential function with respect to the stress tensor, the plastic deformation of the porous material with pressure-sensitive matrices under negative hydrostatic stresses causes its volume to decrease, and consequently, the porous material becomes densified.
Gurson assumed a porous material to be a collection of spherical shells, which does not accurately represent a porous material due to the space between spherical shells [17,18]. This means that the interaction between voids was not taken into account. Tvergaard added three parameters q1 = 1.5, q2 = 1.0, and q3 = 2.25 into the Gurson yield function to enhance the prediction of plastic localization in FE simulations as follows [20].
Jeong assumed a porous material to be a collection of voided cubes and estimated the yield stress of a voided cube from FE simulations to consider the interaction between voids. Based on the yield stresses of a voided cube for several void volume fractions and pressure sensitivity factors of the matrix, he also added three parameters = 1.35, = 0.95, and = 1.35 into his yield function as follows [11].
Jeong implemented the yield function, the plastic potential function, a strain rate sensitivity equation, and a hardening-softening-hardening equation in an ABAQUS user material subroutine to simulate the crack-tip behavior of a rubber-toughened epoxy and showed that the simulation results were in good agreement with the test results [11].
The Gurson model, as well as Jeong model, did not take into account the location and size randomness of voids. Fei et al. conducted finite element simulations using the Gurson model for the tin in a copper-tin-copper joint bar under uniaxial tension, employing three different initial void volume fraction distributions for the elements in the tin with the same average initial volume fraction of 0.8%: an identical initial void volume fraction of 0.8% at every element, a uniform distribution from 0.3% to 1.3%, and a normal distribution with the mean of 0.8% and a standard deviation of 0.02% [21]. The initial void volume fractions, whether 0.8% or either the uniform or normal distribution, were randomly allocated to the tin’s elements, maintaining the same overall average initial volume fraction. The location and size randomness of voids were considered when either the uniform distribution or the normal distribution was used. Size randomness was implicitly implemented at some elements with higher initial void volume fractions. Different distributions resulted in different local deformation features such as different crack paths and different maximum forces, but they resulted in similar macroscopic stress-strain behavior. Thus, even if the location and size randomness of voids were considered in the FE simulations in this study, the macroscopic force-deflection curve would remain almost the same.
3. Finite Element Models and Simulations
3.1. Homogenized J & M Model
When a battery is modeled using an isotropic model such as the Drucker–Prager model, the Gurson model, or the Jeong model, anisotropy cannot be properly represented. The metal foils and separator show different material behaviors when subjected to loads in any direction on the plane and in the out-of-plane direction [1]. However, since a cell is a layered structure, the material behavior in the out-of-plane direction differs significantly from that in any plane direction. Thus, in this study a cell was assumed to be isotropic in any plane direction, but anisotropic only in the out-of-plane direction, i.e., transversely isotropic. To address the distinct material characteristics of the cell in the out-of-plane direction, an alternative approach of stacking the Mises model onto the Jeong model and wrapping them with the pouch model was proposed in this study. The Jeong model takes into consideration both the pressure sensitivity due to porosity around active and graphite particles and in the polymer separator, as well as the pressure sensitivity of the metal foils and the separator. In addition, the Mises model incorporates the non-pressure-sensitive material behavior of the cell.
As shown in Figure 1, the two inner layers and the two outer layers of solid elements (C3D8R in ABAQUS/Implicit) were modeled by the Jeong model and by the Mises model, respectively. Shell elements (S4R in ABAQUS/Implicit) representing the pouch were defined outside the outer layers. Any two adjacent layers shared common nodes, preventing slip, while contact was defined between the shell elements and the surface of the outer layers, allowing the shell elements to slip. In addition, a pressure of 0.1 MPa was applied to the surface of the shell elements to account for vacuum conditions. This homogenized model is named the J & M model, and it was used to model three different batteries in this study. The number of elements and contact definitions were smaller than those of other homogenized models because the J & M model was developed to be used in a crash simulation of a LIB pack within an acceptable computation time. In the manufacturing process of LIBs, the interior of the pouch is typically vacuum-sealed [22]. Choi et al. mentioned that the vacuum conditions restrict the formation of empty spaces inside the pouch cell, and used a tie option between shell elements and solids elements in their FE model instead of applying pressure on the shell elements [23].
A similar approach was proposed by Lian et al., who used the Mises model to represent the metal foils and the Deshpande–Fleck foam model to represent the remaining components, mainly active and graphite particles, in ABAQUS/Explicit [24]. Their FE model for a single cell had 1, 3, 5, 7, or 15 layers of the Mises model and 2, 4, 6, 8, or 16 layers of the Deshpande–Fleck foam model, positioned next to each layer of the Mises model with frictionless contact between layers. In addition, the element size for the foam model was 0.5 mm × 0.5 mm × 0.5 mm, and it was 0.5 mm × 0.5 mm × 0.5 mm or thinner for the Mises model. The FE model was used to simulate an in-plane confined compression test. Notably, using the FE model with a total of 11 (i.e., five layers of the Mises model and six layers of the Deshpande–Fleck foam model) or more layers resulted in shear band formation consistent with the observed behavior in the test. For the in-plane confined compression simulation, they had to significantly lower the hardening curve for the Deshpande–Fleck foam model, originally obtained from an out-of-plane compression test, to match the force-displacement curve from the simulation with that measured from the test. This suggests that they used two different hardening curves for the in-plane confined compression simulation and for the out-of-plane compression simulation. However, in a crash simulation, it is required to use only one hardening curve, whether it is under in-plane compression or out-of-plane compression, because some cells are subjected to loading inclined to the surface of the cell.
In the present study, the applicability of the J & M model was examined for three different pouch LIB cells. The first battery was tested and simulated by Sahraei et al., and the second battery was only tested by the same authors [4]. The first battery (referred to as a small pouch cell in [4]) had a length of 59.5 mm, width of 34 mm, thickness of 5.35 mm, mass of 19 g, and capacity of 740 mAh. The second battery (referred to as a medium pouch cell in [4]) had a length of 129.5 mm, width of 43.5 mm, thickness of 8.2 mm, mass of 85 g, and capacity of 3200 mAh. The third battery (Dow Kokam SLPB 681106100) was tested and simulated by Beaumont et al. [6], and it had a length of 106 mm, width of 102 mm, thickness of 7.0 mm, mass of 156 g, and capacity of 8000 mAh. The three batteries were selected because they had undergone testing in out-of-plane compression, in-plane compression, and/or 3-point bending, and had also been simulated by some homogenized models. In addition, the second battery was tested in 3-point bending with or without the pouch, while the third battery was tested not only for a single cell but also for two stacked cells.
The J & M model for the first battery cell consisted of 1860 nodes and 880 solid elements, with each element approximately 1.488 mm × 1.545 mm × 1.338 mm in size, along with 564 shell elements sized around 1.488 mm × 1.545 mm. The J & M model for the second battery cell comprised 2904 nodes and 1408 solid elements sized about 2.023 mm × 1.977 mm × 2.05 mm, accompanied by 876 shell elements in size of about 2.023 mm × 1.977 mm. Finally, the J & M model for the third battery cell had 8775 nodes and 4620 solid elements in size of about 1.51 mm × 1.51 mm × 1.719 mm, and 2582 shell elements approximately 1.545 mm × 1.514 mm.
Figure 2, Figure 3 and Figure 4 show the out-of-plane compression, in-plane confined compression, and the 3-point bending FE model along with their respective boundary conditions. The first battery, which underwent the out-of-plane compression simulation, and the second battery, which underwent the 3-point bending simulation, were both modeled using only a quarter of the original battery size in the FE model. Given that it is a quarter model, plane symmetry conditions were applied to the boundary surfaces. For the 3-point bending simulation, the diameter of the roller support and cylindrical punch were 15 mm and 8 mm, respectively, using S4R shell elements and rigid body assumptions. The setup positioned the support roller’s center 47.5 mm from the cylindrical punch’s center. A displacement boundary condition of 20 mm was applied to the loading cylindrical punch, and a fixed condition was applied to the roller support.
For the third battery, the out-of-plane compression and 3-point bending simulations also used quarter models, consistent with the procedures for the first and second batteries. A distinction was made for the out-of-plane compression simulation in the displacement boundary conditions: 0.25 mm for single cells and 0.5 mm for two stacked cells. In the third battery’s 3-point bending simulation, both the roller support and loading cylindrical punch were set to a 10 mm diameter, meshed with S4R shell elements and modeled as rigid bodies. The rollers were spaced 39.75 mm and 38.25 mm apart in the length and width directions, respectively. A 20 mm displacement boundary condition was applied to the cylindrical punch, and the roller support was fixed.
For the in-plane confined compression simulation, unlike previous simulations, it was configured as a half model. The confining side plates, fixed bottom plate, and loading plate all utilized shell elements (S4R) and were also subjected to rigid body conditions. Fixed conditions were applied to the confining side plates and fixed bottom plate, and a displacement boundary condition of 12 mm was applied to the loading plate.
In all simulations, ABAQUS’s surface-to-surface contact was used, setting the master surface as either the rigid body or the shell element. Hard contact was used for normal behavior, preventing penetration in the normal direction, and applied a frictional coefficient of 0.1. Although Beaumont et al. employed a frictional coefficient of 0.3 [6], using this value in the J & M model led to unreasonably high forces and convergence issues, prompting the use of 0.1. Contact convergence was assessed post-simulation, identifying iterations that stalled due to convergence issues. Findings indicated that there were minimal convergence-related problems, suggesting effective simulation stability.
Sahraei et al. developed three different homogenized models only for a small pouch cell, utilizing the crushable foam solid elements (Material 63) in LS-DYNA or the crushable foam solid elements combined with shell elements. The first homogenized model featured 10 layers of the crushable foam solid elements; the second homogenized model had eight layers of the crushable foam solid elements, with every four layers sandwiched by two layers of shell elements; and the third homogenized model included 24 layers of the crushable foam solid elements, with each layer sandwiched by two layers of shell elements. They used the first model to simulate the out-of-plane compression test, used the first and second models with a tensile cut-off value to simulate the hemispherical punch indentation test, and used the third model to simulate the in-plane confined compression test and the in-plane unconfined compression test. All simulations except for the in-plane unconfined compression simulation resulted in a force-displacement curve resembling the corresponding force-displacement curve measured at each test. Although the in-plane unconfined compression simulation adequately predicted the peak load, it did not show a similar pre-buckling force-displacement curve. In addition, the in-plane confined compression simulation using the third homogenized model resulted in multiple buckles, and the in-plane unconfined compression simulation showed shear buckling and delamination of the layers. However, Sahraei et al. used three different models to simulate four different tests, and their models had solid elements sized 1 mm × 1 mm × 0.48 mm or 0.24 mm and shell elements sized 1 mm × 1 mm. The third model had 30,000 solid elements and 31,500 shell elements, requiring 22 h with six CPUs to simulate the in-plane confined compression test [4]. In other words, Sahraei et al. failed to develop a homogenized FE model that could accurately represent the material behaviors of pouch LIB cells under various loading conditions, and the third model had more elements than the J & M model.
Beaumont et al. created a homogenized model using the honeycomb model in LS-DYNA, specifying different material properties for normal and shear deformations [6]. In the honeycomb model, a total of 30 variables and scale factors were used, with a parameter sensitivity study identifying 16 key parameters, including the viscosity coefficient, scale factors, and uncompressed elastic moduli for different directions. Among the 16 key parameters, the scale factors were found to be the most influential parameter. Then, the key parameters were calibrated to match the simulation results with the out-of-plane compression test, in-plane confined compression test in the length and width directions, and the 3-point bending test around the length and width directions [6]. While Beaumont et al.’s model demonstrated high accuracy for single cells, it significantly overestimated the loads when applied to two stacked cells under in-plane confined compression in the length and width directions, and 3-point bending around the length and width directions.
For the present study, the material properties of the J & M model were determined sequentially using the test data obtained from the out-of-plane compression test, the in-plane confined compression test, and the 3-point bending test. Since the J & M model is transversely isotropic, only the test data obtained from the out-of-plane compression, the in-plane confined compression test along the width direction, and the 3-point bending test around the width direction were used to calibrate the material properties of the J & M model. The J & M model underwent validation across several tests: the out-of-plane compression test, the 3-point bending test, and the in-plane confined compression test. The scope of this validation varied depending on the availability of test data, encompassing either just the width direction alone or both the length and width directions.
Given that Sahraei et al. did not perform the 3-point bending test on the first battery, nor the out-of-plane compression test and the in-plane confined compression test on the second battery, this study assumes that the first and second batteries share similar material characteristics. The test data obtained from the first and second batteries were used to calibrate the material properties of the J & M model. That is, the material properties of the J & M model were calibrated using the force-displacement curves measured from the out-of-plane compression test and in-plane confined test for the first battery cell, and the 3-point bending test for the second battery cell. Since Beaumont et al. conducted the out-of-plane compression test, the in-plane confined compression test, and 3-point bending test for the third battery, the material properties of the J & M model were calibrated using the force-displacement curves measured from the three tests. Then, simulations using the J & M model were conducted for the three tests, and the force-displacement curves obtained from the simulations were compared to those measured from the tests. In addition, the J & M model was used to simulate the 3-point bending test without the pouch and without the vacuum conditions for the second battery, as well as to simulate the three tests for two stacked cells. The simulation results were in good agreement with the test data not only for single cells but also for two stacked cells highlighting the significant effects of the pouch and the vacuum conditions.
3.2. Determination of Material Properties of the J & M Model
The material properties of the Jeong model, the Mises model, and the pouch model in the J & M model were sequentially determined using the load-displacement or stress-strain curves obtained from the out-of-plane compression test, the in-plane confined compression test in the width direction, and the 3-point bending test around the width direction. In a similar sequence, Beaumont et al. calibrated the material properties of the honeycomb model, with the exception that they used the curves obtained from the in-plane confined compression tests in the length direction and the 3-point bending test around the length direction as well [6].
3.2.1. First Battery and Second Battery Tested by Sahraei et al.
Figure 5 outlines the method for deriving the material properties: the J model’s material properties were obtained through the out-of-plane compression test, the M model’s properties were calculated with ROM from the in-plane compression test in the length direction, and the material properties of the pouch were determined from the 3-point bending test conducted around the length direction. These findings were then validated through the previously detailed tests.
As the active and graphite particles are much softer than the metal foils and the separator, most of the deformation occurs in the particles when compressed in the out-of-plane direction. Thus, the material properties for the Jeong model, which primarily takes into account the porosity around the particles and inside the separator, were calibrated to match the load-displacement curve obtained from the out-of-plane compression test for a single cell with or without the pouch. The key inputs for the Jeong model include the stress-strain curve, pressure sensitivity, and the volume fraction. As shown in Figure 6, the load-displacement curve measured from the test looks like a parabolic function which shows a significant amount of permanent deformation and hardening due to particle densification. This implies that the most important material property of the Jeong material is its plastic stress-strain curve, which should look like a parabolic function. Unlike in the simulation for a rubber-toughened epoxy where the Jeong model was applied with a hardening-softening-hardening equation, a piecewise linear stress-strain curve shown in Figure 7 was employed with a small elastic modulus of 23.53 MPa and yield stress of 0.59 MPa. Given the dominance of plastic deformation, the precise values of the elastic modulus and yield stress are less critical. In addition, since metals and polymers have a pressure sensitivity factor ranging from 0.02 to 0.43, the pressure sensitivity factor was assumed to be 0.1. Based on the experimental observations of non-normal flow in plastics, the dilatancy factor was assumed to be 0. According to Zhu et al. [1], the porosity inside a pouch LIB cell ranges from 30% to 40%. In addition, from the thickness data of LIB components measured by Sahraei et al. [4], the volume fraction of the active and graphite particles was calculated to be 85%, with the remaining components comprising 15%. However, since the Jeong model and the Mises model each occupy 50% of the total thickness in the J & M model, scaling factors of 85/50 and 15/50 were to be multiplied to the material properties including the void volume fraction of the Jeong model and the Mises model, respectively, to account for the volume fraction discrepancies between the actual cell and the J & M model. Thus, the void volume fraction for the Jeong model was assumed to be 0.3 × 85/50 = 0.51.
The material properties of the Mises model and the pouch model, as well as the determination process, are explained below. It is noteworthy that the material properties of the Mises model and the pouch model have minimal impact on the load-displacement curve of the out-of-plane compression, like the elastic modulus and yield stress of the Jeong model. After tuning the stress-strain pairs, the J & M model was used to simulate the out-of-plane compression test without the pouch, and the resulting load-displacement curve demonstrated good agreement with that obtained from the test, as illustrated in Figure 6.
The material properties of the Mises model were determined based on the stress-strain curve, as shown in Figure 13 in [4], measured from the in-plane confined compression test in the width direction for a single cell conducted by Sahraei et al. along with the application of the rule of mixture. In the rule of mixture equations, Equations (6) and (7), and , and , and and represent the elastic modulus and yield stress of a single cell, the Jeong model, and the Mises model, respectively. In addition, and are the volume fraction of the Jeong model and the Mises model, respectively. First, was determined to be 300 MPa from the slope of the stress-strain curve from the strain range of 0 to 0.017, and was determined to be 8.65 MPa at the strain of 0.031 using the 0.2% offset method. Then scaling factors of 85/50 and 15/50 were multiplied to the material properties of the Jeong model and the Mises model, respectively, to account for the volume fraction discrepancies between the actual cell and the J & M model. By applying the scaling factors and plugging the elastic modulus and the yield stress of the Jeong material, which were previously determined, into Equations (6) and (7), the elastic modulus and yield stress of the Mises model were found to be 500 MPa and 0.9 MPa, respectively.
The Mises model was assumed to be elastic and to exhibit linear strain hardening with a constant tangent modulus in this study. Since the elastic modulus and yield stress of the Mises material were already determined, only the tangent modulus needed to be determined. The tangent modulus was calibrated to match the load-displacement curve of the simulation using the J & M model without the pouch with that of the 3-point bending test for a single cell without the pouch conducted by Sahraei et al. [4]. In this process, the tangent modulus was found to be 3.95 MPa. The load-displacement curve obtained from the simulation, shown at the bottom of Figure 8, demonstrates good agreement with that measured from the test.
Finally, the material properties of the pouch in the J & M model were determined based on the test data obtained from the 3-point bending test for a single cell with the pouch conducted by Sahraei et al. [4]. The pouch was modeled by using shell elements and was assumed to be elastic, linear strain hardening, and perfectly plastic. Since the pouch has tight contact with the outer layers of the cell due to the vacuum conditions, it was assumed to show some load-carrying capacity even under compression.
The tentative elastic modulus of 3190 MPa, yield stress of 17.04 MPa, tangent modulus of 66 MPa, and the stress of perfect plasticity were initially determined from the tensile test data of the pouch [23]. However, these values were calibrated to match the simulation result for the 3-point bending test with the pouch to the corresponding test data. Subsequently, the adjusted material properties, including the elastic modulus, yield stress, tangent modulus, and the stress of perfect plasticity were found to be 4000 MPa, 58 MPa, 15 MPa, and 61 MPa, respectively. In addition, a contact with a friction coefficient of 0.1 was defined between the pouch and the outside of the Mises material. At the top of Figure 8, the load-displacement curve obtained from the simulation is compared to that obtained from the test. The simulation using the J & M model successfully captured the 3-point bending load characteristics of a single cell with or without the pouch, highlighting that the pouch significantly helped increase the load by over four times at displacement of 20 mm. Sahraei et al. also emphasized the significant effect of the pouch on the load-carrying capacity of the cell under the 3-point bending test [4]. The J & M model was also used to simulate the 3-point bending test without the vacuum conditions, revealing that the absence of vacuum conditions reduced the load by about 23% at displacement of 20 mm.
The simulation for the 3-point bending test with the pouch, under both vacuum and non-vacuum conditions, resulted in a force surge followed by a force drop around a displacement of 2 mm or 5 mm. However, the energy required to cause a displacement over the point of the force surge and drop was similar between the simulation result and the test data. Excluding the point of force surge and drop, the force-displacement curves predicted from the simulations aligned well with those measured from the tests, regardless of whether the pouch was present or not.
As shown in Figure 9, applying pressure on the surface of the shell elements in the bending simulation concentrated the buckling of the pouch in its central region. Without applying pressure, the pouch wrinkled up to a quarter of its longitudinal length, illustrating how the vacuum enhanced friction and contributed to supporting the cell through the pouch. Therefore, it is evident that both the pouch and the vacuum conditions play a significant role in the load-carrying capacity of pouch LIB cells. Failing to account for vacuum conditions would result in an inadequate determination of the material properties of the Jeong model and the Mises model in the J & M model, leading to inaccurate simulation results.
Since all the material properties of the J & M model were determined, the J & M model could be used to simulate the out-of-plane compression test with the pouch conducted by Sahraei et al. Figure 10 shows the load-displacement curve of the out-of-plane compression test with the pouch along with that of the simulation for the test, and an additional curve of the simulation for the test without the vacuum conditions. Figure 10 also shows the load-displacement curve of the out-of-compression test without the pouch and that of the simulation for the test, which are shown in Figure 6 already, for the sake of comparison. As expected, the load-displacement curve of the test or the simulation with the pouch was almost the same as that of the test or the simulation without the pouch. This reinforces the idea that active and graphite particles modeled by the Jeong material play a major role in the material behavior under out-of-plane compression, with the pouch having minimal impact on the material behavior. A simulation for the out-of-plane compression test without vacuum conditions was also conducted to assess the effect of vacuum, revealing a stiffer behavior and underscoring the importance of considering the vacuum conditions as in the 3-point bending scenario.
To assess the accuracy of the J & M model, the error was calculated from Equation (8) and listed in Table 1 for each simulation. The error was defined as the ratio of the maximum difference between the predicted force and the measured force to the force measured at the end of the test.
3.2.2. Third Battery Tested by Beaumont et al.
The material properties of the J & M model for the third battery tested by Beaumont et al. were obtained by using the same approach described in the previous section. As shown in Figure 11, the material properties of the J model were sourced from the out-of-plane compression test, those of the M model were deduced using ROM from the in-plane compression test along the length direction, and the pouch’s material properties were derived from the 3-point bending test around the length direction. Subsequently, validation was conducted with the previously mentioned three tests, as well as with the in-plane compression test in the width direction and the 3-point bending test around the width direction. An elastic modulus of 23.53 MPa, yield stress of 0.59 MPa, and stress-strain pairs shown in Figure 12 for the Jeong model were determined to match the out-of-plane compression test of a single cell with the pouch. In addition, the same pressure sensitivity factor of 0.1, dilatancy factor of 0, and void volume fraction of 0.51 were used for the third battery as well. The elastic modulus of 743.52 MPa for the Mises model was determined from the slope of the load-displacement curve of the in-plane confined compression test for a single cell from displacement of 0.34 mm to 0.758 mm, and the yield stress was determined from the same curve at displacement of 1.19 mm using the 0.2% offset method. Using Equations (6) and (7) and applying the scaling factors of 50/85 to the Jeong model and 50/15 to the Mises model, the elastic modulus and yield stress of the Mises model were calculated to be 464.7 MPa and 0.8 MPa, respectively. The tangent modulus of the Mises model and the material properties of the pouch model were calibrated to have good correlation with the 3-point bending test data for a single cell. The tangent modulus of the Mises model was determined to be 7.34 MPa, and the elastic modulus, yield stress, tangent modulus, and stress of the perfect plasticity of the pouch model were determined to be 4800 MPa, 50 MPa, 25 MPa, and 55 MPa, respectively.
Although all the material properties of the J & M model were determined using the test data for a single cell, the J & M model was used to simulate the out-of-plane compression tests not only for a single cell but also for two stacked cells. Needless to say, the material properties of the J & M model for two stacked cells were exactly the same as those of the J & M model for a single cell. The load-displacement curves obtained from the simulations for the out-of-plane compression are shown in Figure 13 along with those obtained from the tests and simulations conducted by Beaumont et al. Beaumont et al. created a homogenized model using the honeycomb model provided in LS-DYNA with different material properties for normal and shear deformations. In the honeycomb model, 16 key parameters were calibrated to match the simulation results with the out-of-plane compression test, in-plane confined compression test, and the 3-point bending test [6]. All the curves obtained from the simulations using the J & M model and from the simulations using the honeycomb model were in good agreement with those measured from the tests both for a single cell and for two stacked cells under the out-of-plane compression.
Then, the J & M model was used to simulate in-plane confined compression in the length direction (in the x-axis in Beaumont et al.’s paper). Although the tested cell exhibited several folds as shown in Figure 14a, the simulated cell did not show any fold at all, and an abnormally high force was observed. This unrealistic unfolded cell and overestimated load are not uncommon in FE simulations where all the elements have the same deformation gradient. For example, an FE simulation of a tensile bar with the same cross-section never shows necking. To resolve the issue, either material inhomogeneity or geometric inhomogeneity needs to be incorporated in the model. Lian et al. introduced geometric inhomogeneity into their FE model for the in-plane confined compression test by deleting an element at the location where a fold was observed in the experiment [24]. However, in this study, a series of nodes along the width direction (in the y-axis in Beaumont et al.’s paper) on the surface of the J & M model was translated inwards by 0.1 mm, and a series of nodes was selected at about every 12 mm along the length direction. With geometric inhomogeneity, the simulation resulted in buckling as shown in Figure 14b, which is a half of a single cell. In addition, Figure 15 shows the load-displacement curves obtained from the simulation for the in-plane confined compression in the length direction with or without the geometric inhomogeneity. While the load remained almost the same up to a displacement of 0.40 mm, the force obtained from the simulation with the geometric inhomogeneity started to become lower than that without the geometric inhomogeneity, especially after a displacement of 0.74 mm where buckling started.
In addition to the simulation for the in-plane confined compression test for a single cell, two cells were stacked and used to simulate the in-plane confined compression test conducted by Beaumont et al. Figure 16 shows the load-displacement curves obtained from simulations using the J & M model, along with those of the tests and simulations presented by Beaumont et al. both for a single cell and for two stacked cells under in-plane confined compression in the length direction. While Beaumont et al.’s approach, which employed a honeycomb model that accounts for different material properties in each direction, displayed relatively accurate mechanical behavior for a single cell, it showed significantly stiffer mechanical behavior for two stacked cells. In contrast, the J & M model displayed slightly stiffer or softer mechanical behavior in the initial deformation stage but showed quite similar mechanical behavior not only for a single cell but also for two stacked cells.
Figure 17 shows the load-displacement curves obtained from simulations for in-plane confined compression in the width direction using the J & M model along with those of the tests and simulations presented by Beaumont et al. As in the case of the in-plane confined compression tests in the length direction, the honeycomb model showed good correlation for a single cell, but it showed stiffer behavior for two stacked cells. However, while the J & M model displayed slightly different behavior in the initial stage of deformation, it showed good correlation in the later stage of displacement not only for a single cell but also for two stacked cells. It is noteworthy that the simulations using the J & M model, which is transversely isotropic, resulted in good correlation with the in-plane compression test both in the length and width directions. This suggests that the material behavior of the third battery (Dow Kokam SLPB 681106100) in the length direction was similar to that in the width direction, indicating a transversely isotropic nature.
The J & M model was used to simulate the 3-point bending test with and without geometric inhomogeneity, and the load-displacement curves obtained from simulations are shown in Figure 18. The geometric inhomogeneity resulted in a slightly lower load in the first stage of deformation but a slightly higher load later. Unlike in the case of in-plane confined compression, the geometric inhomogeneity did not significantly affect the load-displacement curve as expected because the deformation gradient in the FE model was not uniform under 3-point bending. Consequently, implementing geometric inhomogeneity is deemed unnecessary for any FE model used in crash simulations, given the non-uniform nature of the deformation gradient in such scenarios.
The J & M model was used again to simulate the 3-point bending tests around the length direction and around the width direction, not only for a single cell but also for two stacked cells. The load-displacement curves obtained using the J & M model along with those measured from the tests and those obtained by Beaumont et al. using the honeycomb model are shown in Figure 19 and Figure 20. For a single cell, both the J & M model and the honeycomb model resulted in good correlation with the test data. However, for two stacked cells, the honeycomb model again resulted in stiffer behavior, while the J & M model also showed increased load but to a lesser extent than the honeycomb model. Additionally, as in the case of the in-plane compression, the J & M model demonstrated comparable correlation with the test results of the 3-point bending around the length direction and around the width direction. This is another piece of evidence that the material behavior of the pouch LIB batteries is almost transversely isotropic.
The simulation results and the experimental load-displacement data for the two stacked cells under 3-point bending did not align well. As Beaumont et al. noted, the experimental data seemed anomalous, with two stacked cells exhibiting a lower force-displacement curve in the early stage of deformation than a single cell. Beaumont et al. tried to resolve this issue by applying a preload to a punch and to the test fixture to eliminate a gap, especially between cells, before conducting a test. While a rigid plate was present beneath a single cell or two stacked cells in the out-of-plane compression test, and a pair of rigid plates sandwiched a single cell or two stacked cells in the in-plane confined compression test, the 3-point bending test had only a pair of round supports beneath two stacked cells, providing partial support only to the contacting areas of the two stacked cells. Thus, it was speculated that the gap between two stacked cells was not completely removed even when a preload was applied.
To examine whether this speculation was correct, another FE model for two stacked cells with a gap of 1 mm between the two cells using the J & M model was created to simulate the 3-point bending test around the width direction. The force-displacement curve obtained from the simulation is shown in Figure 21. As expected, this curve closely resembled the force-displacement curve that was obtained from the simulation without a gap, translated to the right by 1 mm. Thus, the force-displacement curve obtained by Beamont et al. was translated to the right by 1 mm, which is shown in Figure 21 as well. In this case, using Equation (8), Beaumont et al.’s model shows an error of 14.13%, while the J & M model exhibits an error of 5.62%. Furthermore, another FE model for two stacked cells using the J & M model with a gap of 0.5 mm between the two single cells was created to simulate the 3-point bending test around the length direction, and its force-displacement curve is shown in Figure 22 along with the curve obtained by Beaumont et al., translated to the right by 0.5 mm. The simulation results from the J & M model were slightly closer to the test results than those from the honeycomb model, although there was not a significant difference between them. Using Equation (8), Beaumont et al.’s simulation results show an error of 8.64%, while the results of the J & M model exhibit an error of 5.15%.
Table 2 presents the errors computed via Equation (8). For a single cell, Beaumont et al.’s model exhibited lower error than those of the J & M model. Yet, in the case of two stacked cells, across all tests aside from the out-of-plane compression, the errors of the J & M model were found to be less than those exhibited by Beaumont et al.’s model.
The objective of this study was to develop a homogenized model with a reduced number of nodes and elements that could be used in an FE model for a LIB pack. Thus, the mesh of the original FE model was intentionally coarsened to have only 2430 nodes and 1224 solid elements with dimensions of about 2.996 mm × 2.941 mm × 1.719 mm. Additionally, 682 shell elements, sized around 3 mm × 2.944 mm, were included for the third battery under the 3-point bending simulation around the length direction. The load-displacement curves obtained from the original model and the coarse model are shown along with those measured from the test in Figure 23. It is noteworthy that there is no significant difference between the two simulation results, validating the possibility of developing an FE model with a smaller number of nodes and elements to accurately model pouch LIB cells.
Table 3 compares the number of elements in the FE models used in the study with those by Sahraei et al. and Beaumont et al. There is no information available for the FE model used by Sahraei et al. for the second battery, thus no comparison was made. The J & M model features significantly fewer elements for the first battery—34 times fewer solid elements and 56 times fewer shell elements compared to Sahraei et al.’s detailed model. This efficiency is evident even when comparing full models instead of quarter models. For the third battery, while Beaumont et al.’s honeycomb model, using a singular property set for the cell, has fewer elements than the J & M model, it showed relatively lower accuracy in the case of two stacked cells.
While increasing mesh size significantly reduced the number of elements, further reductions proved difficult. Thus, the previously used coarse model was reduced from four to three layers for potential further reduction of the number of elements. To preserve symmetry akin to the original four-layer model, the M model was applied to the first and third layers, while the J model was applied to the second layer. Two different three-layer configurations were assessed: the first divided the battery cell thickness equally among all layers, whereas the second adjusted the volume fractions to mirror the four-layer model, allocating a quarter of the thickness to the first and third layers and half to the second layer. The simulation results of changing from a four-layer to a three-layer FE model are shown in Figure 24, Figure 25, Figure 26, Figure 27 and Figure 28. For out-of-plane compression and in-plane confined compression, the results were similar to those of the original four-layer model. However, for 3-point bending around the width direction, the three-layer model shows a 92.4% difference at 8 mm displacement compared to experimental values, and the three-layer model with a thicker J model shows an 81.3% difference. Similarly, for 3-point bending around the length direction, they show differences of 39.3% and 6.6%, respectively. This indicates that changing to three layers increases the influence of the M model, making it difficult to match the 3-point bending results with the same approach used for out-of-plane compression and in-plane confined compression in the four-layer model. This underscores the necessity for at least four layers in the thickness direction to maintain accuracy, highlighting the limitations in reducing element count beyond a certain threshold.
4. Conclusions
In this paper, the J & M model, which is a homogenized FE model, was developed to account for the porosity and pressure sensitivity of pouch LIB cells. A systematic procedure was proposed to determine the material properties of the J & M model based on data from the out-of-plane compression test, in-plane confined compression test, and 3-point bending test. Then, the J & M model was successfully employed to simulate the material behaviors of the pouch LIB cells under the three test modes not only for a single cell but also for two stacked cells. In addition, the J & M model demonstrated the significant effect of the pouch and vacuum conditions on the material behaviors of the pouch cells. Distinguished by its efficiency with a modest number of nodes and elements, the J & M model presents the potential of the development of an FE model suitable for intricate scenarios, such as crash simulations of a pouch LIB pack. However, before its application in crash simulations for pouch LIB packs, the model requires validation across configurations with three or more stacked cells and the integration of an appropriate strain-rate-sensitive model and a failure criterion.
Kister et al. conducted a dynamic punch indentation test on pouch LIBs and showed that the peak load decreased as the indentation speed increased [25]. At high speeds, metal foils and separators exhibit strain hardening, a phenomenon further promoted by the presence of liquid electrolyte. In contrast, the ductility of the metal foils and separator reduces at high speeds. In their dynamic indentation test on pouch LIBs, the peak load decreased as the speed increased due to the reduction in ductility exceeding the effects of strain hardening. Ratner et al. conducted a dynamic out-of-plane compression test on pouch LIBs, showing a higher concave downward force-displacement curve as opposed to a concave upward force-displacement curve observed in a static out-of-plane compression test [26]. Not only the force-displacement or stress-strain responses but also failure strains under dynamic tests are to be incorporated in a homogenized model to successfully model pouch LIBs under crash simulations. Kisters et al. used a constant failure strain for modeling the dynamic mechanical responses of pouch LIBs [27], but Li and Zhu proposed a scaling strategy on the failure strain because the failure strain and stiffness are dependent on the impact speed, form factor, size, and chemistry of the cells [28]. Since there are significant variations in the mechanical responses and failure strains of pouch LIBs, more dynamic tests are to be conducted, and their mechanical responses and failure strains need to be analyzed and incorporated adequately in any homogenized model including the J & M model.
Author Contributions
Conceptualization, H.-Y.J.; methodology, H.-Y.J.; validation, H.-Y.J. and J.P.; writing—original draft preparation, H.-Y.J.; writing—review and editing, H.-Y.J.; visualization, J.P.; supervision, H.-Y.J. All authors have read and agreed to the published version of the manuscript.
Funding
This research received no external funding.
Institutional Review Board Statement
Not applicable.
Informed Consent Statement
Not applicable.
Data Availability Statement
All data is shown in this article.
Conflicts of Interest
The authors declare no conflicts of interest.
References
- Zhu, J.; Wierzbicki, T.; Li, W. A Review of Safety-Focused Mechanical Modeling of Commercial Lithium-Ion Batteries. J. Power Sources 2018, 378, 153–168. [Google Scholar] [CrossRef]
- ABAQUS 2020 Documentation; Dassault Systemes: France, Paris, 2020.
- Wang, W.; Yang, S.; Lin, C.; Li, Y. State of Charge Dependent Constitutive Model of the Jellyroll of Cylindrical Lithium-Ion Cells. IEEE Access 2018, 6, 26358–26366. [Google Scholar] [CrossRef]
- Sahraei, E.; Hill, R.; Wierzbicki, T. Calibration and Finite Element Simulation of Pouch Lithium-Ion Batteries for Mechanical Integrity. J. Power Sources 2012, 201, 307–321. [Google Scholar] [CrossRef]
- Livermore Software Technology Corporation (LSTC). LS-DYNA Keyword User’s Manual Volume II Material Models LS-DYNA, 11th ed.; LSTC: Livermore, CA, USA, 2018. [Google Scholar]
- Beaumont, R.; Masters, I.; Das, A.; Lucas, S.; Thanikachalam, A.; Williams, D. Methodology for Developing a Macro Finite Element Model of Lithium-Ion Pouch Cells for Predicting Mechanical Behaviour under Multiple Loading Conditions. Energies 2021, 14, 1921. [Google Scholar] [CrossRef]
- Song, Y.; Gilaki, M.; Keshavarzi, M.M.; Sahraei, E. A Universal Anisotropic Model for a Lithium-ion Cylindrical Cell Validated under Axial, Lateral, and Bending Loads. Energy Sci. Eng. 2022, 10, 1431–1448. [Google Scholar] [CrossRef]
- Keshavarzi, M.M.; Gilaki, M.; Sahraei, E. Characterization of In-Situ Material Properties of Pouch Lithium-Ion Batteries in Tension from Three-Point Bending Tests. Int. J. Mech. Sci. 2022, 219, 107090. [Google Scholar] [CrossRef]
- Kermani, G.; Keshavarzi, M.M.; Sahraei, E. Deformation of Lithium-Ion Batteries under Axial Loading: Analytical Model and Representative Volume Element. Energy Rep. 2021, 7, 2849–2861. [Google Scholar] [CrossRef]
- Ali, M.Y.; Lai, W.-J.; Pan, J. Computational Models for Simulations of Lithium-Ion Battery Cells under Constrained Compression Tests. J. Power Sources 2013, 242, 325–340. [Google Scholar] [CrossRef]
- Jeong, H.-Y. A New Yield Function and a Hydrostatic Stress-Controlled Void Nucleation Model for Porous Solids with Pressure-Sensitive Matrices. Int. J. Solids Struct. 2002, 39, 1385–1403. [Google Scholar] [CrossRef]
- Wang, H.; Duan, X.; Liu, B. The Anisotropic Homogenized Model for Pouch Type Lithium-Ion Battery Under Various Abuse Loadings. J. Electrochem. Energy Convers. Storage 2021, 18, 021015. [Google Scholar] [CrossRef]
- Gupta, P.; Gudmundson, P. Modeling of Local Electrode Stresses and Pressures in Lithium-Ion Battery Packs Using Three-Dimensional Homogenization. J. Power Sources 2023, 582, 233514. [Google Scholar] [CrossRef]
- Spitzig, W.A.; Sober, R.J.; Richmond, O. Pressure Dependence of Yielding and Associated Volume Expansion in Tempered Martensite. Acta Metall. 1975, 23, 885–893. [Google Scholar] [CrossRef]
- Spitzig, W.A.; Sober, R.J.; Richmond, O. The Effect of Hydrostatic Pressure on the Deformation Behavior of Maraging and HY-80 Steels and Its Implications for Plasticity Theory. Metall. Trans. A 1976, 7, 1703–1710. [Google Scholar] [CrossRef]
- Kinloch, A.J.; Young, R.J. Fracture Behaviour of Polymers; Springer: Dordrecht, The Netherlands, 2013; ISBN 978-94-017-1594-2. [Google Scholar]
- Gurson, A.L. Plastic Flow and Fracture Behavior of Ductile Materials Incorporating Void Nucleation, Growth and Interaction. Ph.D. Thesis, Brown University, Providence, RI, USA, 1975. [Google Scholar]
- Gurson, A.L. Continuum Theory of Ductile Rupture by Void Nucleation and Growth: Part I—Yield Criteria and Flow Rules for Porous Ductile Media. J. Eng. Mater. Technol. 1977, 99, 2–15. [Google Scholar] [CrossRef]
- Spitzig, W.A.; Richmond, O. Effect of Hydrostatic Pressure on the Deformation Behavior of Polyethylene and Polycarbonate in Tension and in Compression. Polym. Eng. Sci 1979, 19, 1129–1139. [Google Scholar] [CrossRef]
- Tvergaard, V.; Needleman, A. Analysis of the Cup-Cone Fracture in a Round Tensile Bar. Acta Metall. 1984, 32, 157–169. [Google Scholar] [CrossRef]
- Fei, H.; Yazzie, K.; Chawla, N.; Jiang, H. The Effect of Random Voids in the Modified Gurson Model. J. Electron. Mater. 2012, 41, 177–183. [Google Scholar] [CrossRef]
- Ellis, L.D.; Allen, J.P.; Thompson, L.M.; Harlow, J.E.; Stone, W.J.; Hill, I.G.; Dahn, J.R. Quantifying, Understanding and Evaluating the Effects of Gas Consumption in Lithium-Ion Cells. J. Electrochem. Soc. 2017, 164, A3518–A3528. [Google Scholar] [CrossRef]
- Choi, H.Y.; Lee, I.; Lee, J.S.; Kim, Y.M.; Kim, H. A study on mechanical characteristics of lithium-polymer pouch cell battery for electric vehicle. In Proceedings of the 23rd International Technical Conference on the Enhanced Safety of Vehicles (ESV), Seoul, Republic of Korea, 27–30 May 2013. [Google Scholar]
- Lian, J.; Koch, M.; Li, W.; Wierzbicki, T.; Zhu, J. Mechanical Deformation of Lithium-Ion Pouch Cells under in-Plane Loads—Part II: Computational Modeling. J. Electrochem. Soc. 2020, 167, 090556. [Google Scholar] [CrossRef]
- Kisters, T.; Sahraei, E.; Wierzbicki, T. Dynamic Impact Tests on Lithium-Ion Cells. Int. J. Impact Eng. 2017, 108, 205–216. [Google Scholar] [CrossRef]
- Ratner, A.; Beaumont, R.; Masters, I. Dynamic Mechanical Compression Impulse of Lithium-Ion Pouch Cells. Energies 2020, 13, 2105. [Google Scholar] [CrossRef]
- Kisters, T.; Gilaki, M.; Nau, S.; Sahraei, E. Modeling of Dynamic Mechanical Response of Li-Ion Cells with Homogenized Electrolyte-Solid Interactions. J. Energy Storage 2022, 49, 104069. [Google Scholar] [CrossRef]
- Li, W.; Zhu, J. A Large Deformation and Fracture Model of Lithium-Ion Battery Cells Treated as a Homogenized Medium. J. Electrochem. Soc. 2020, 167, 120504. [Google Scholar] [CrossRef]
Figure 1.
LIB cell modeled by the J & M model (half model).

Figure 2.
Out-of-plane compression FE model (quarter model).
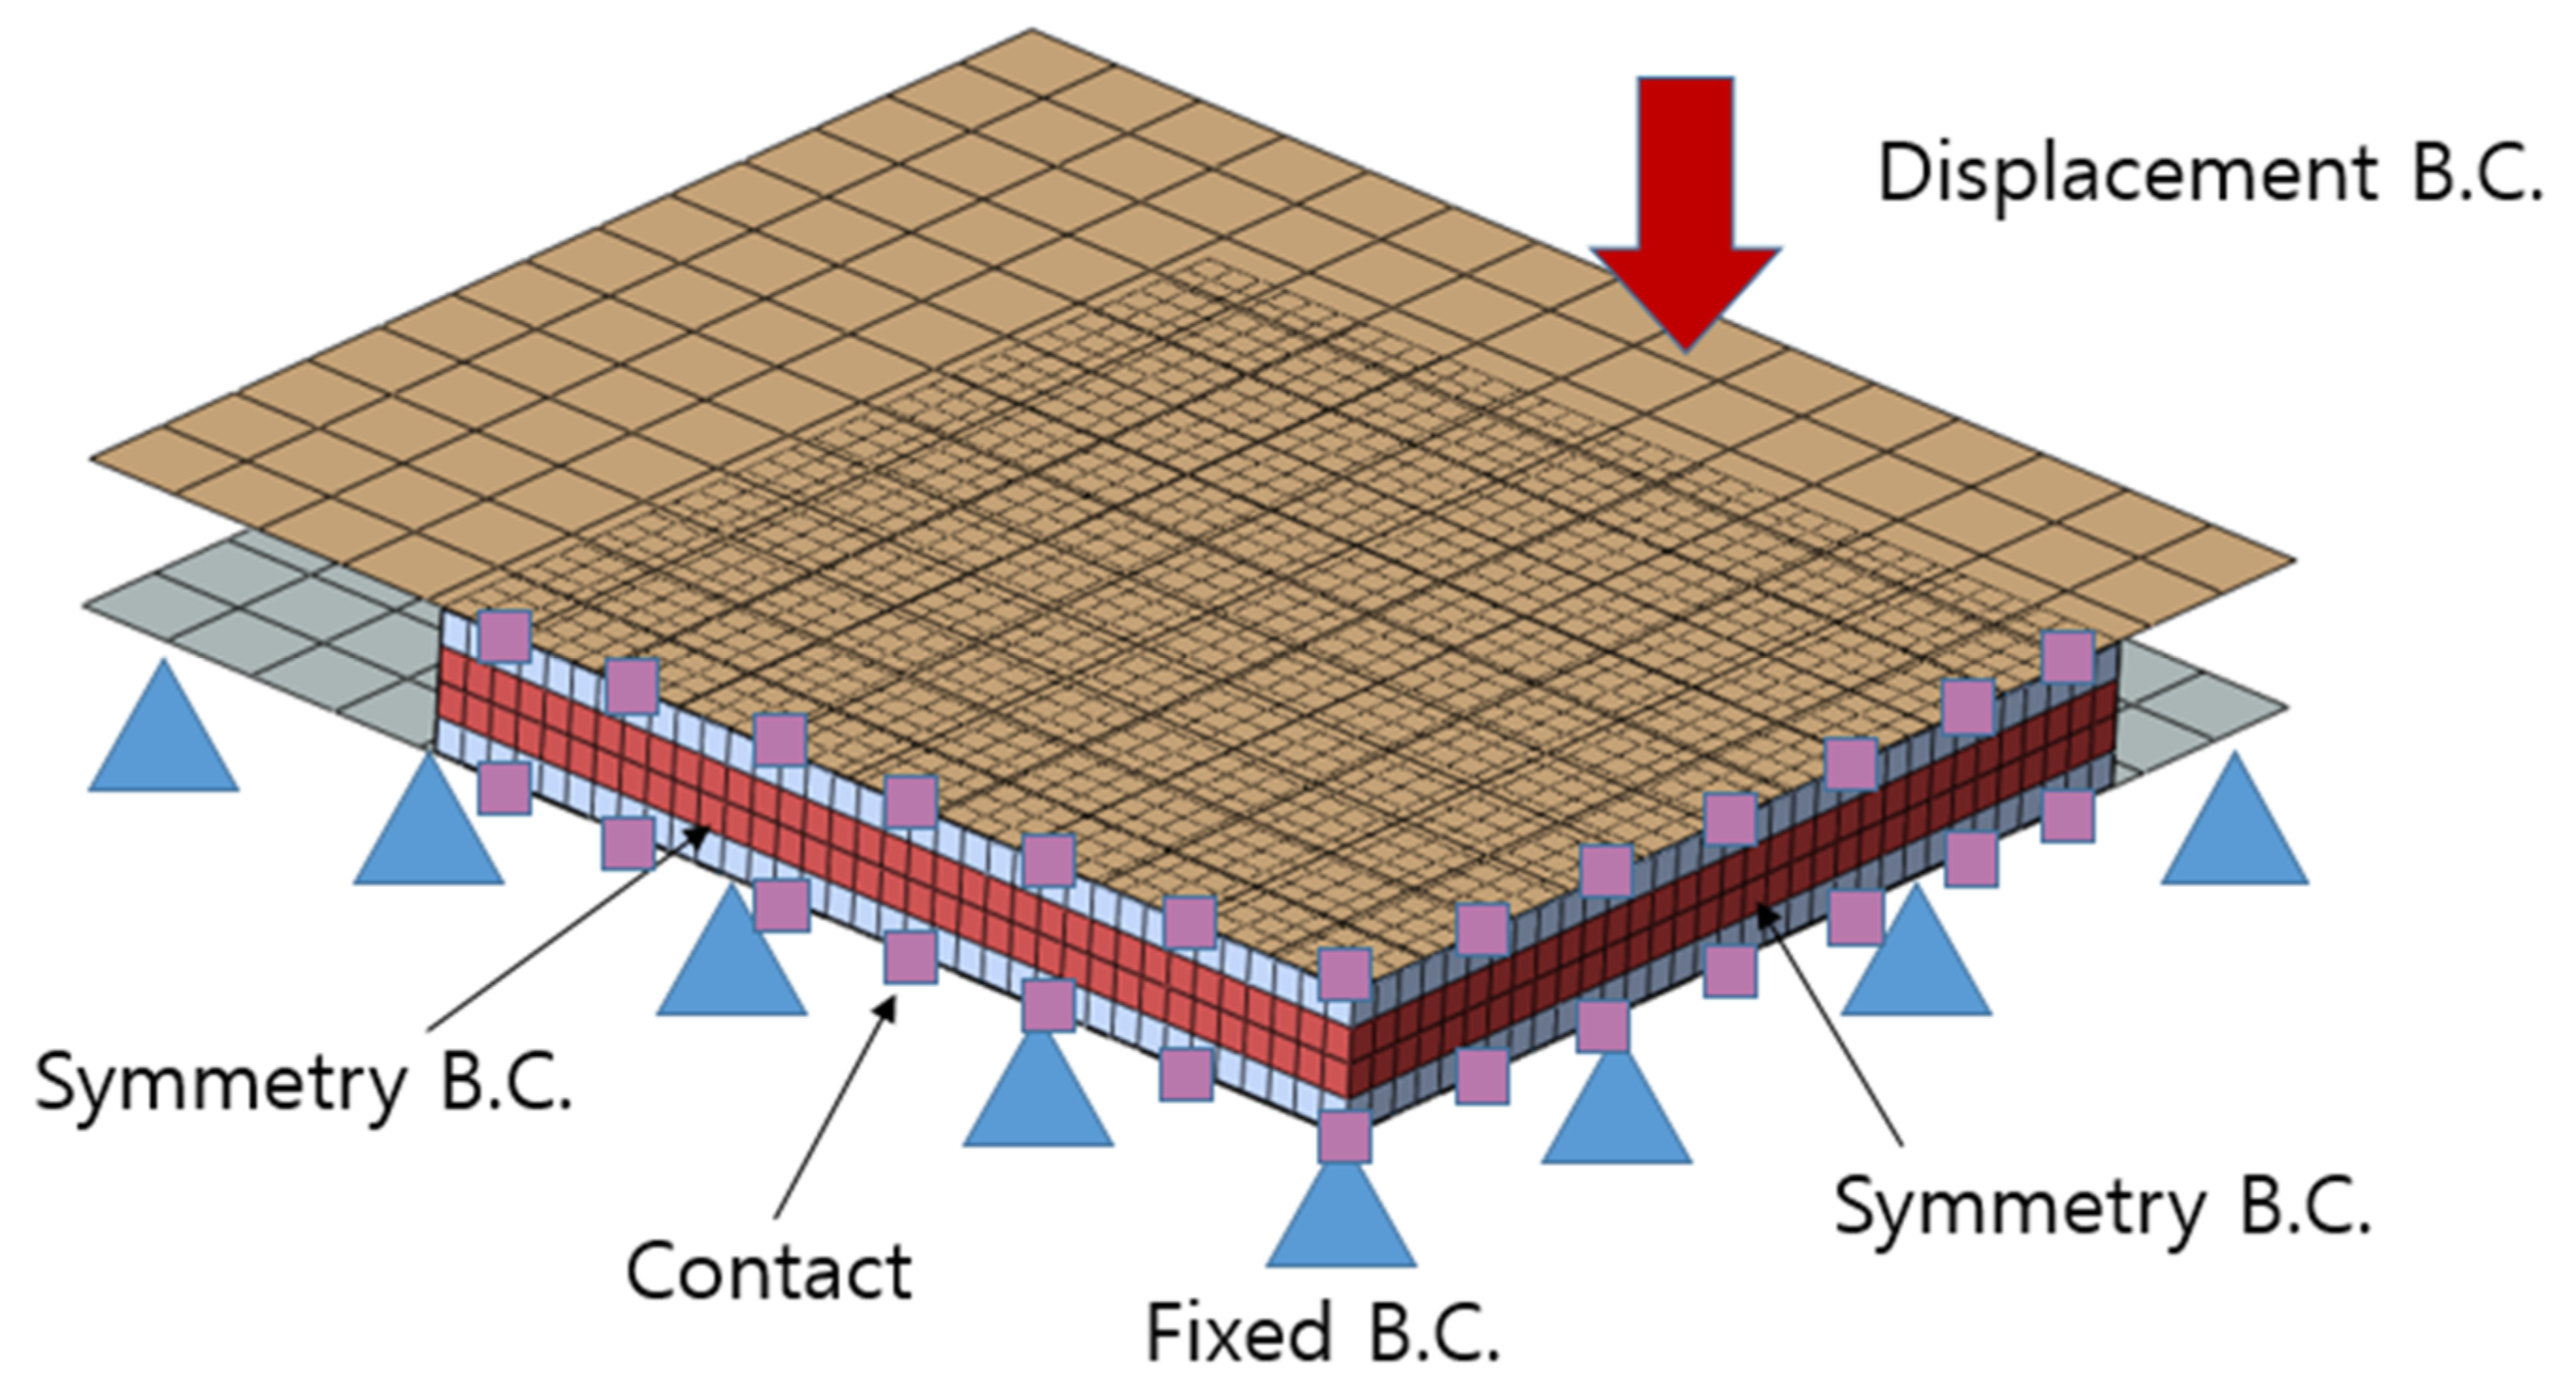
Figure 3.
In-plane confined compression FE model (half model).

Figure 4.
The 3-point bending FE model (quarter model).

Figure 5.
J & M model material properties calibration flowchart for the first and second batteries.

Figure 6.
Load-displacement curves of a single cell without the pouch under out-of-plane compression obtained from test and simulation.
Figure 6.
Load-displacement curves of a single cell without the pouch under out-of-plane compression obtained from test and simulation.

Figure 7.
Piecewise linear stress-strain curve of the Jeong model for the first battery.

Figure 8.
Load-displacement curves from the 3-point bending test and the simulation for the second battery cell.
Figure 8.
Load-displacement curves from the 3-point bending test and the simulation for the second battery cell.

Figure 9.
Buckling of the shell elements (a) with vacuum conditions (b) without vacuum conditions.
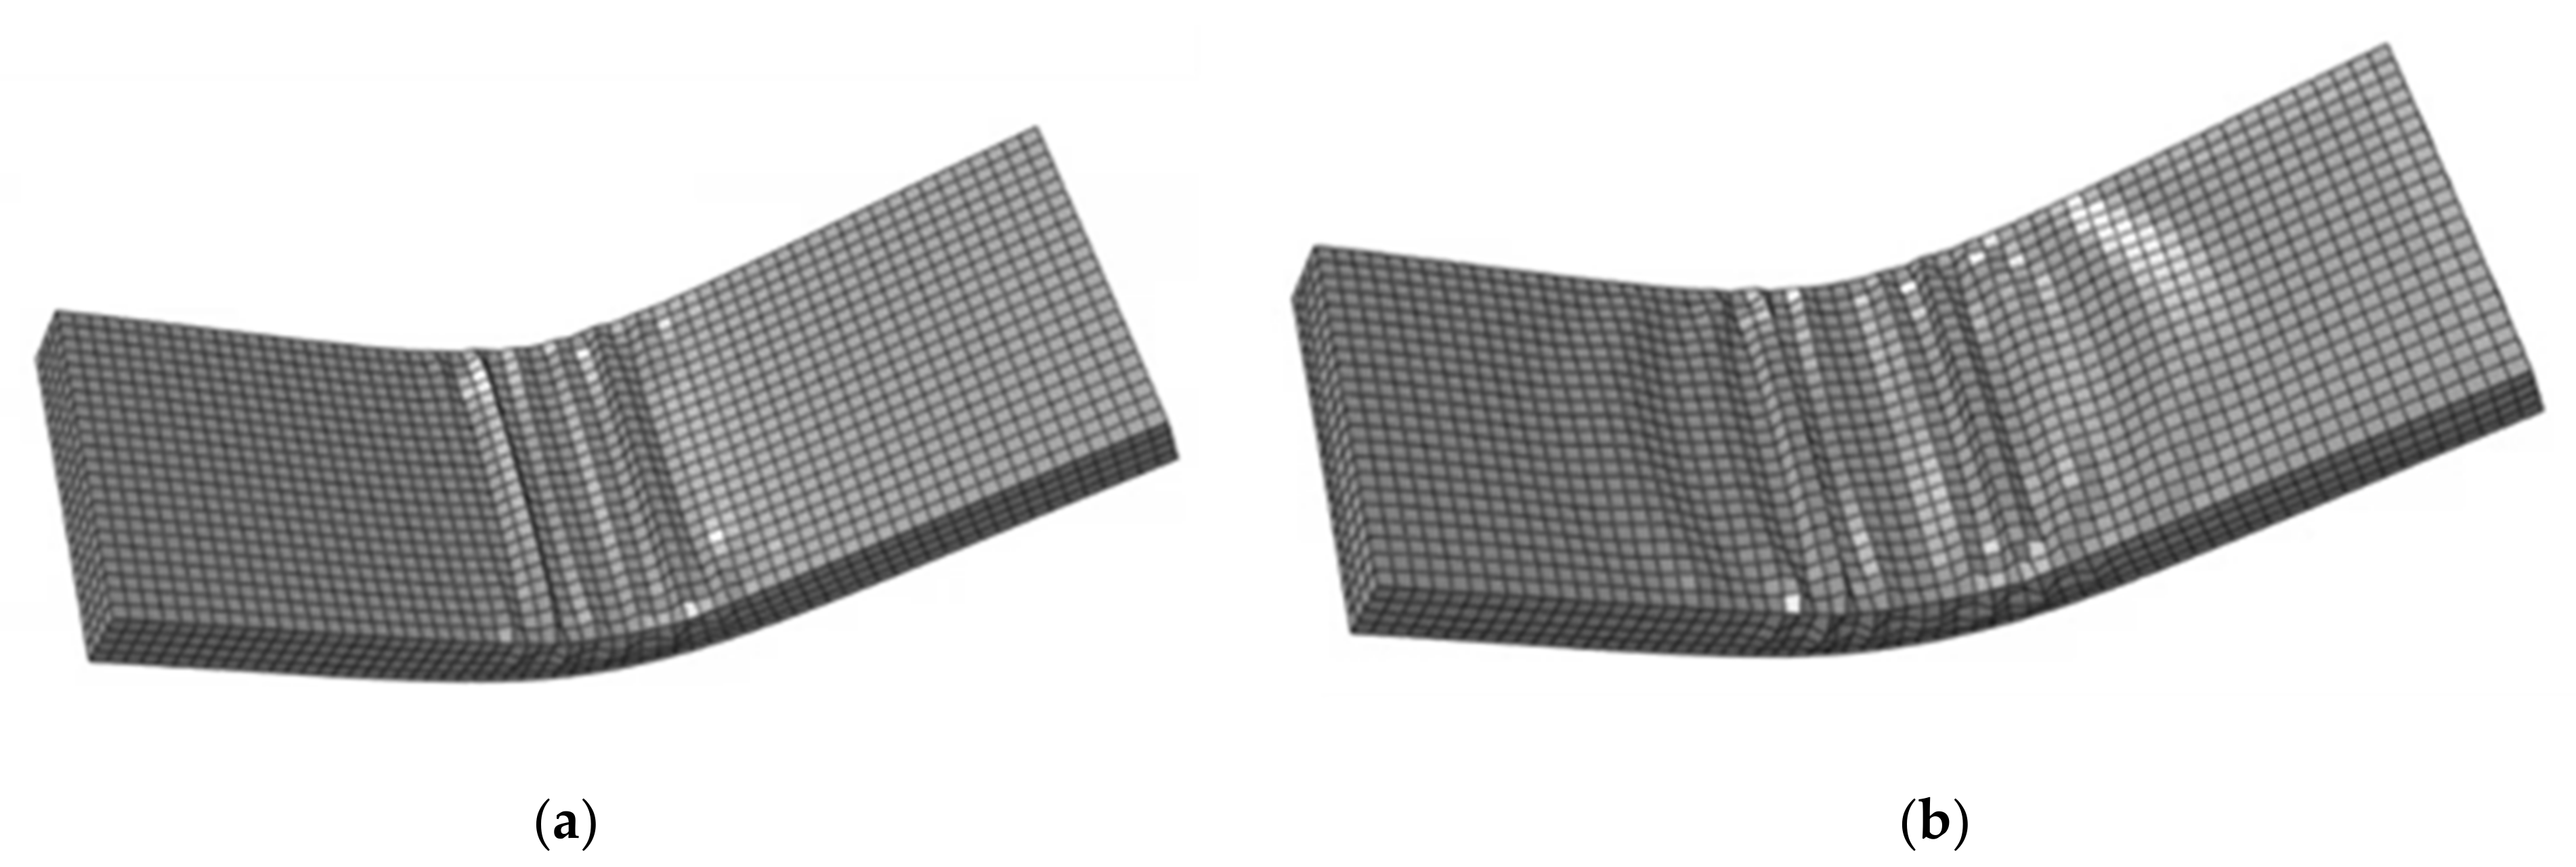
Figure 10.
Load-displacement curves of a single cell under out-of-plane compression.

Figure 11.
J & M model material properties calibration flowchart for the third battery.

Figure 12.
Stress-strain pairs for the Jeong model of the third battery.
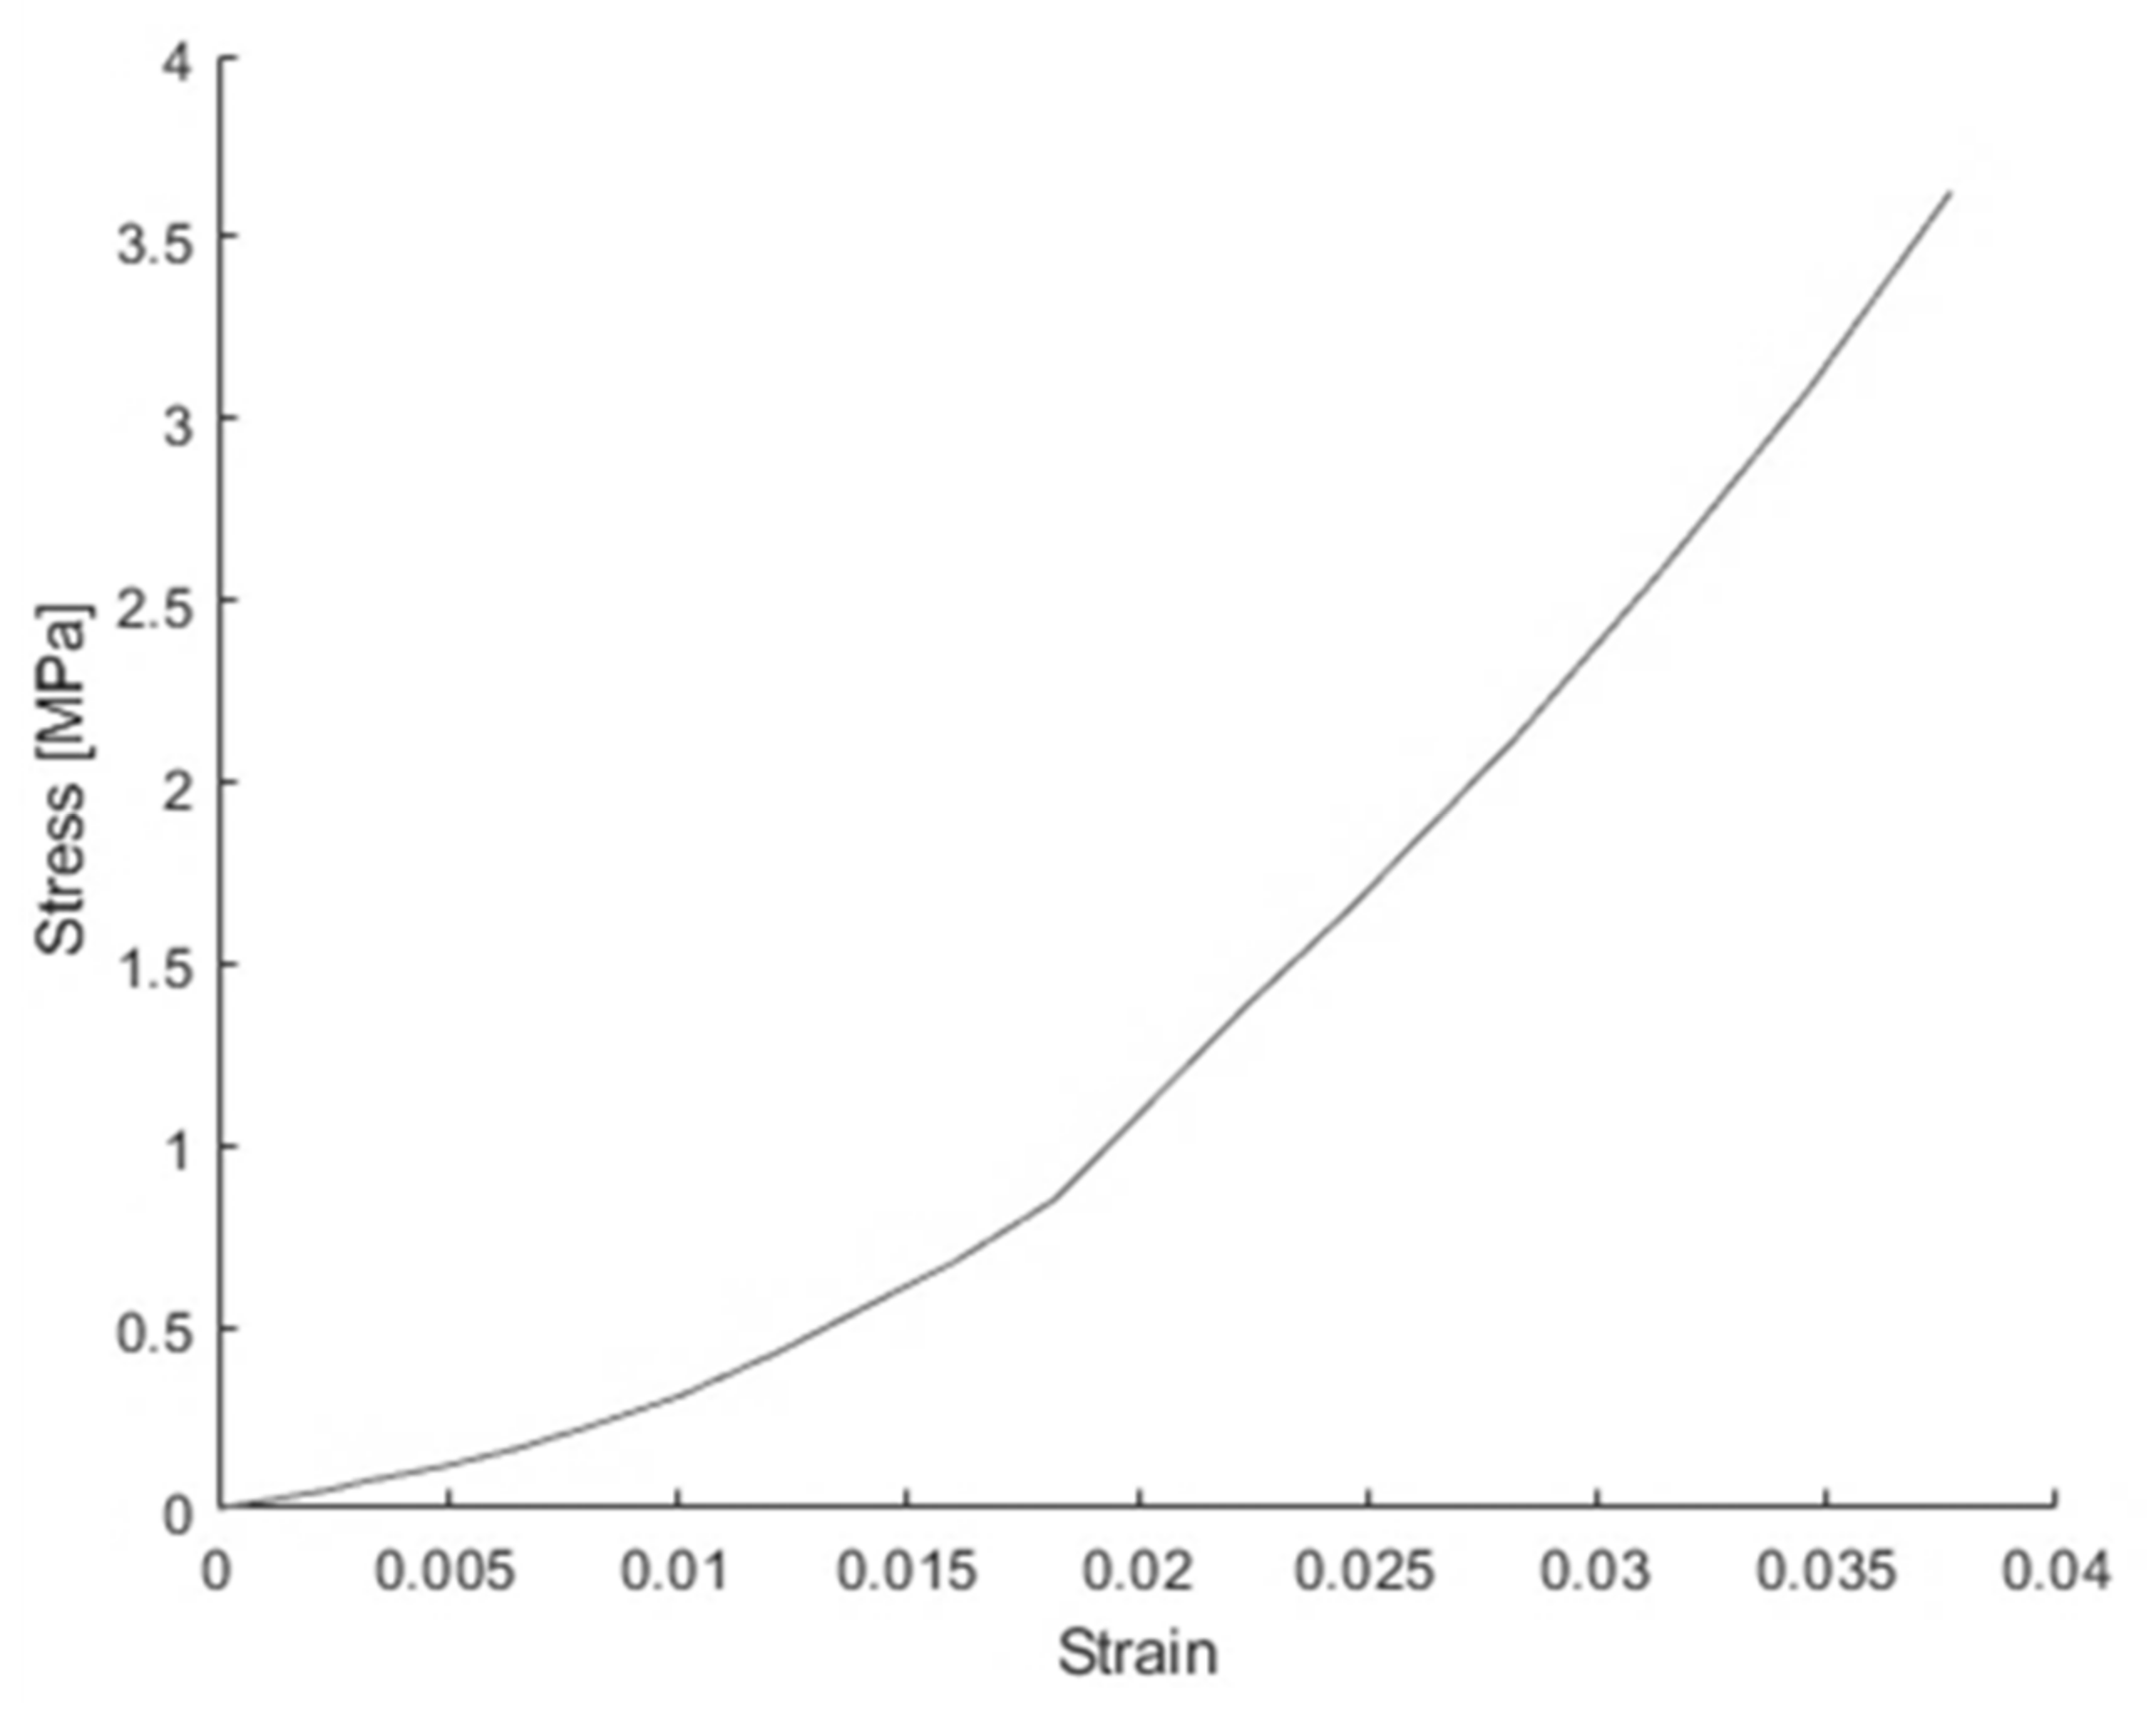
Figure 13.
Force-displacement curves from out-of-plane compression tests and simulations [6].
Figure 13.
Force-displacement curves from out-of-plane compression tests and simulations [6].

Figure 14.
(a) Single cell under in-plane confined compression in the width direction tested by Beaumont et al. [6] (b) Single cell simulated with geometric inhomogeneity.
Figure 14.
(a) Single cell under in-plane confined compression in the width direction tested by Beaumont et al. [6] (b) Single cell simulated with geometric inhomogeneity.

Figure 15.
Force-displacement curves from simulations with and without geometric inhomogeneity for the in-plane compression test.
Figure 15.
Force-displacement curves from simulations with and without geometric inhomogeneity for the in-plane compression test.

Figure 16.
Load-displacement curves for in-plane confined compression in the length direction [6].
Figure 16.
Load-displacement curves for in-plane confined compression in the length direction [6].

Figure 17.
Load-displacement curves for in-plane confined compression in the width direction [6].
Figure 17.
Load-displacement curves for in-plane confined compression in the width direction [6].

Figure 18.
The 3-point bending simulation results with and without geometric inhomogeneity.

Figure 19.
The 3-point bending test and simulation results around the width direction [6].
Figure 19.
The 3-point bending test and simulation results around the width direction [6].

Figure 20.
The 3-point bending test and simulation results around the length direction [6].
Figure 20.
The 3-point bending test and simulation results around the length direction [6].

Figure 21.
The 3-point bending test and simulation results around the width direction with a gap of 1 mm [6].
Figure 21.
The 3-point bending test and simulation results around the width direction with a gap of 1 mm [6].
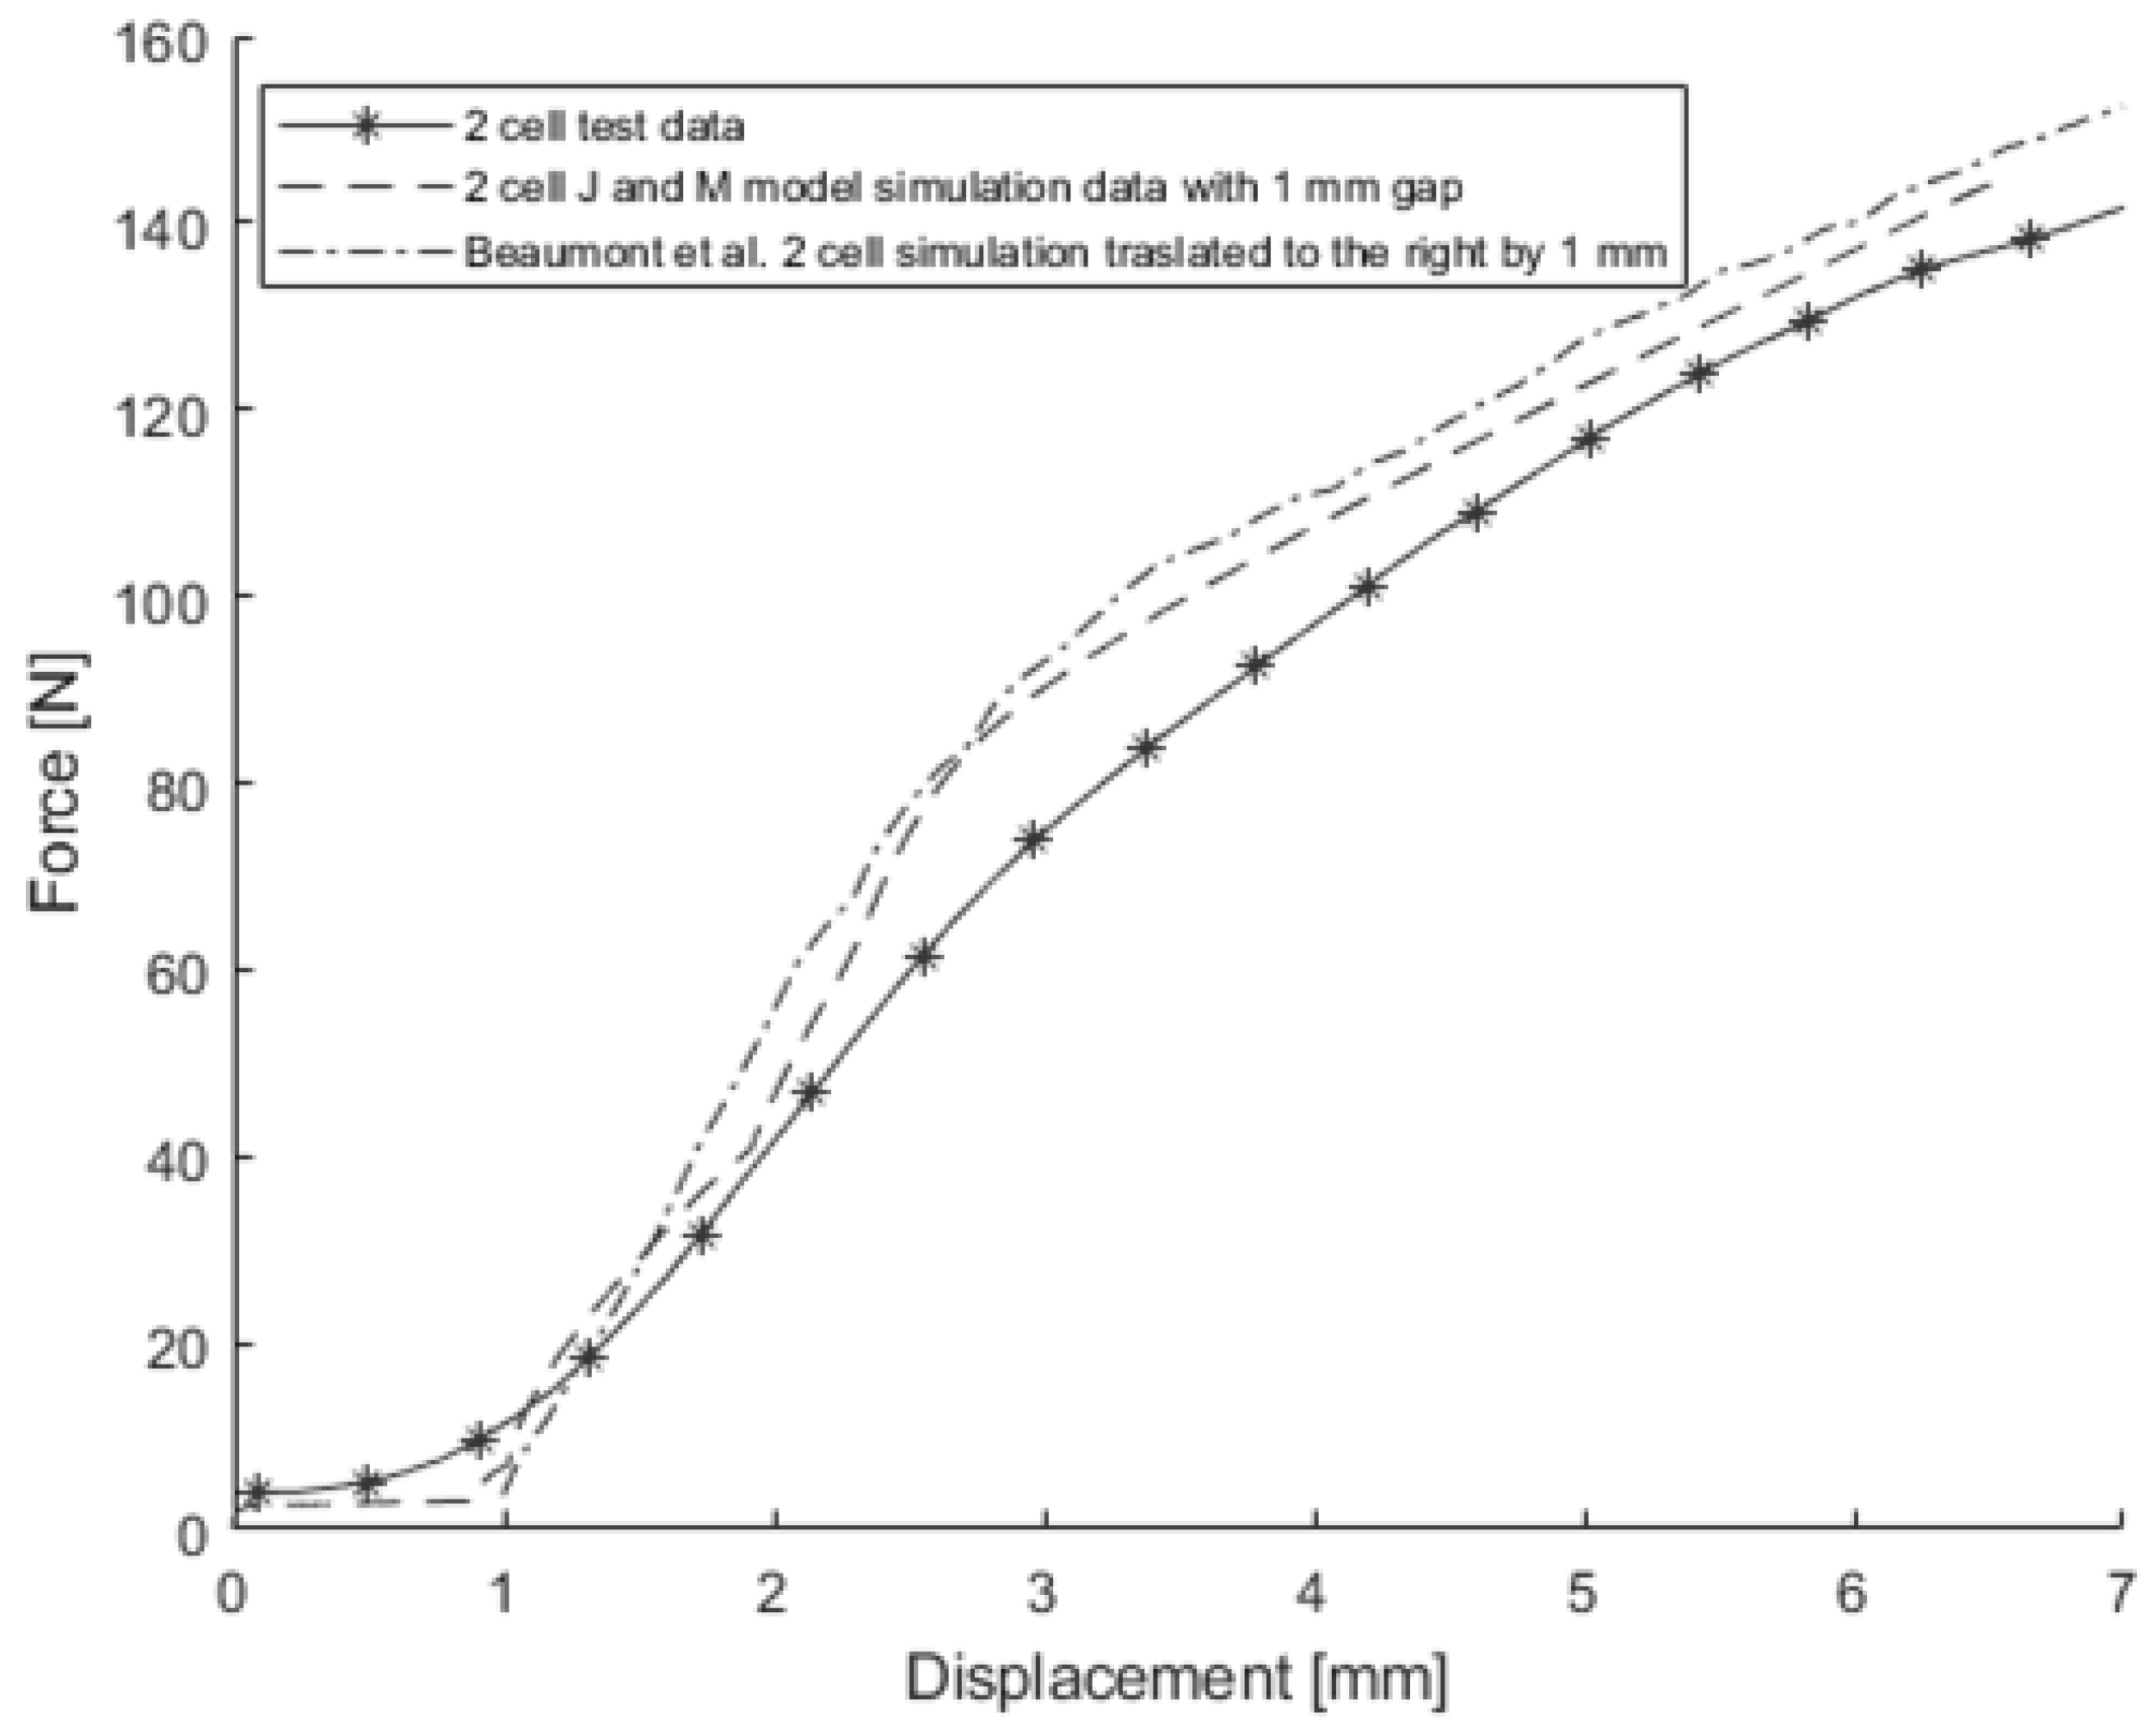
Figure 22.
The 3-point bending test and simulation results around the length direction with a gap of 0.5 mm [6].
Figure 22.
The 3-point bending test and simulation results around the length direction with a gap of 0.5 mm [6].

Figure 23.
The 3-point bending test around the length direction and simulation results obtained from the original model and the coarse model.
Figure 23.
The 3-point bending test around the length direction and simulation results obtained from the original model and the coarse model.

Figure 24.
Out-of-plane compression test and simulation results obtained from original model, 3-layer model, and 3-layer model with thicker J model.
Figure 24.
Out-of-plane compression test and simulation results obtained from original model, 3-layer model, and 3-layer model with thicker J model.

Figure 25.
In-plane confined compression test in the length direction and simulation results obtained from original model, 3-layer model, and 3-layer model with thicker J model.
Figure 25.
In-plane confined compression test in the length direction and simulation results obtained from original model, 3-layer model, and 3-layer model with thicker J model.

Figure 26.
In-plane confined compression test in the width direction and simulation results obtained from original model, 3-layer model, and 3-layer model with thicker J model.
Figure 26.
In-plane confined compression test in the width direction and simulation results obtained from original model, 3-layer model, and 3-layer model with thicker J model.
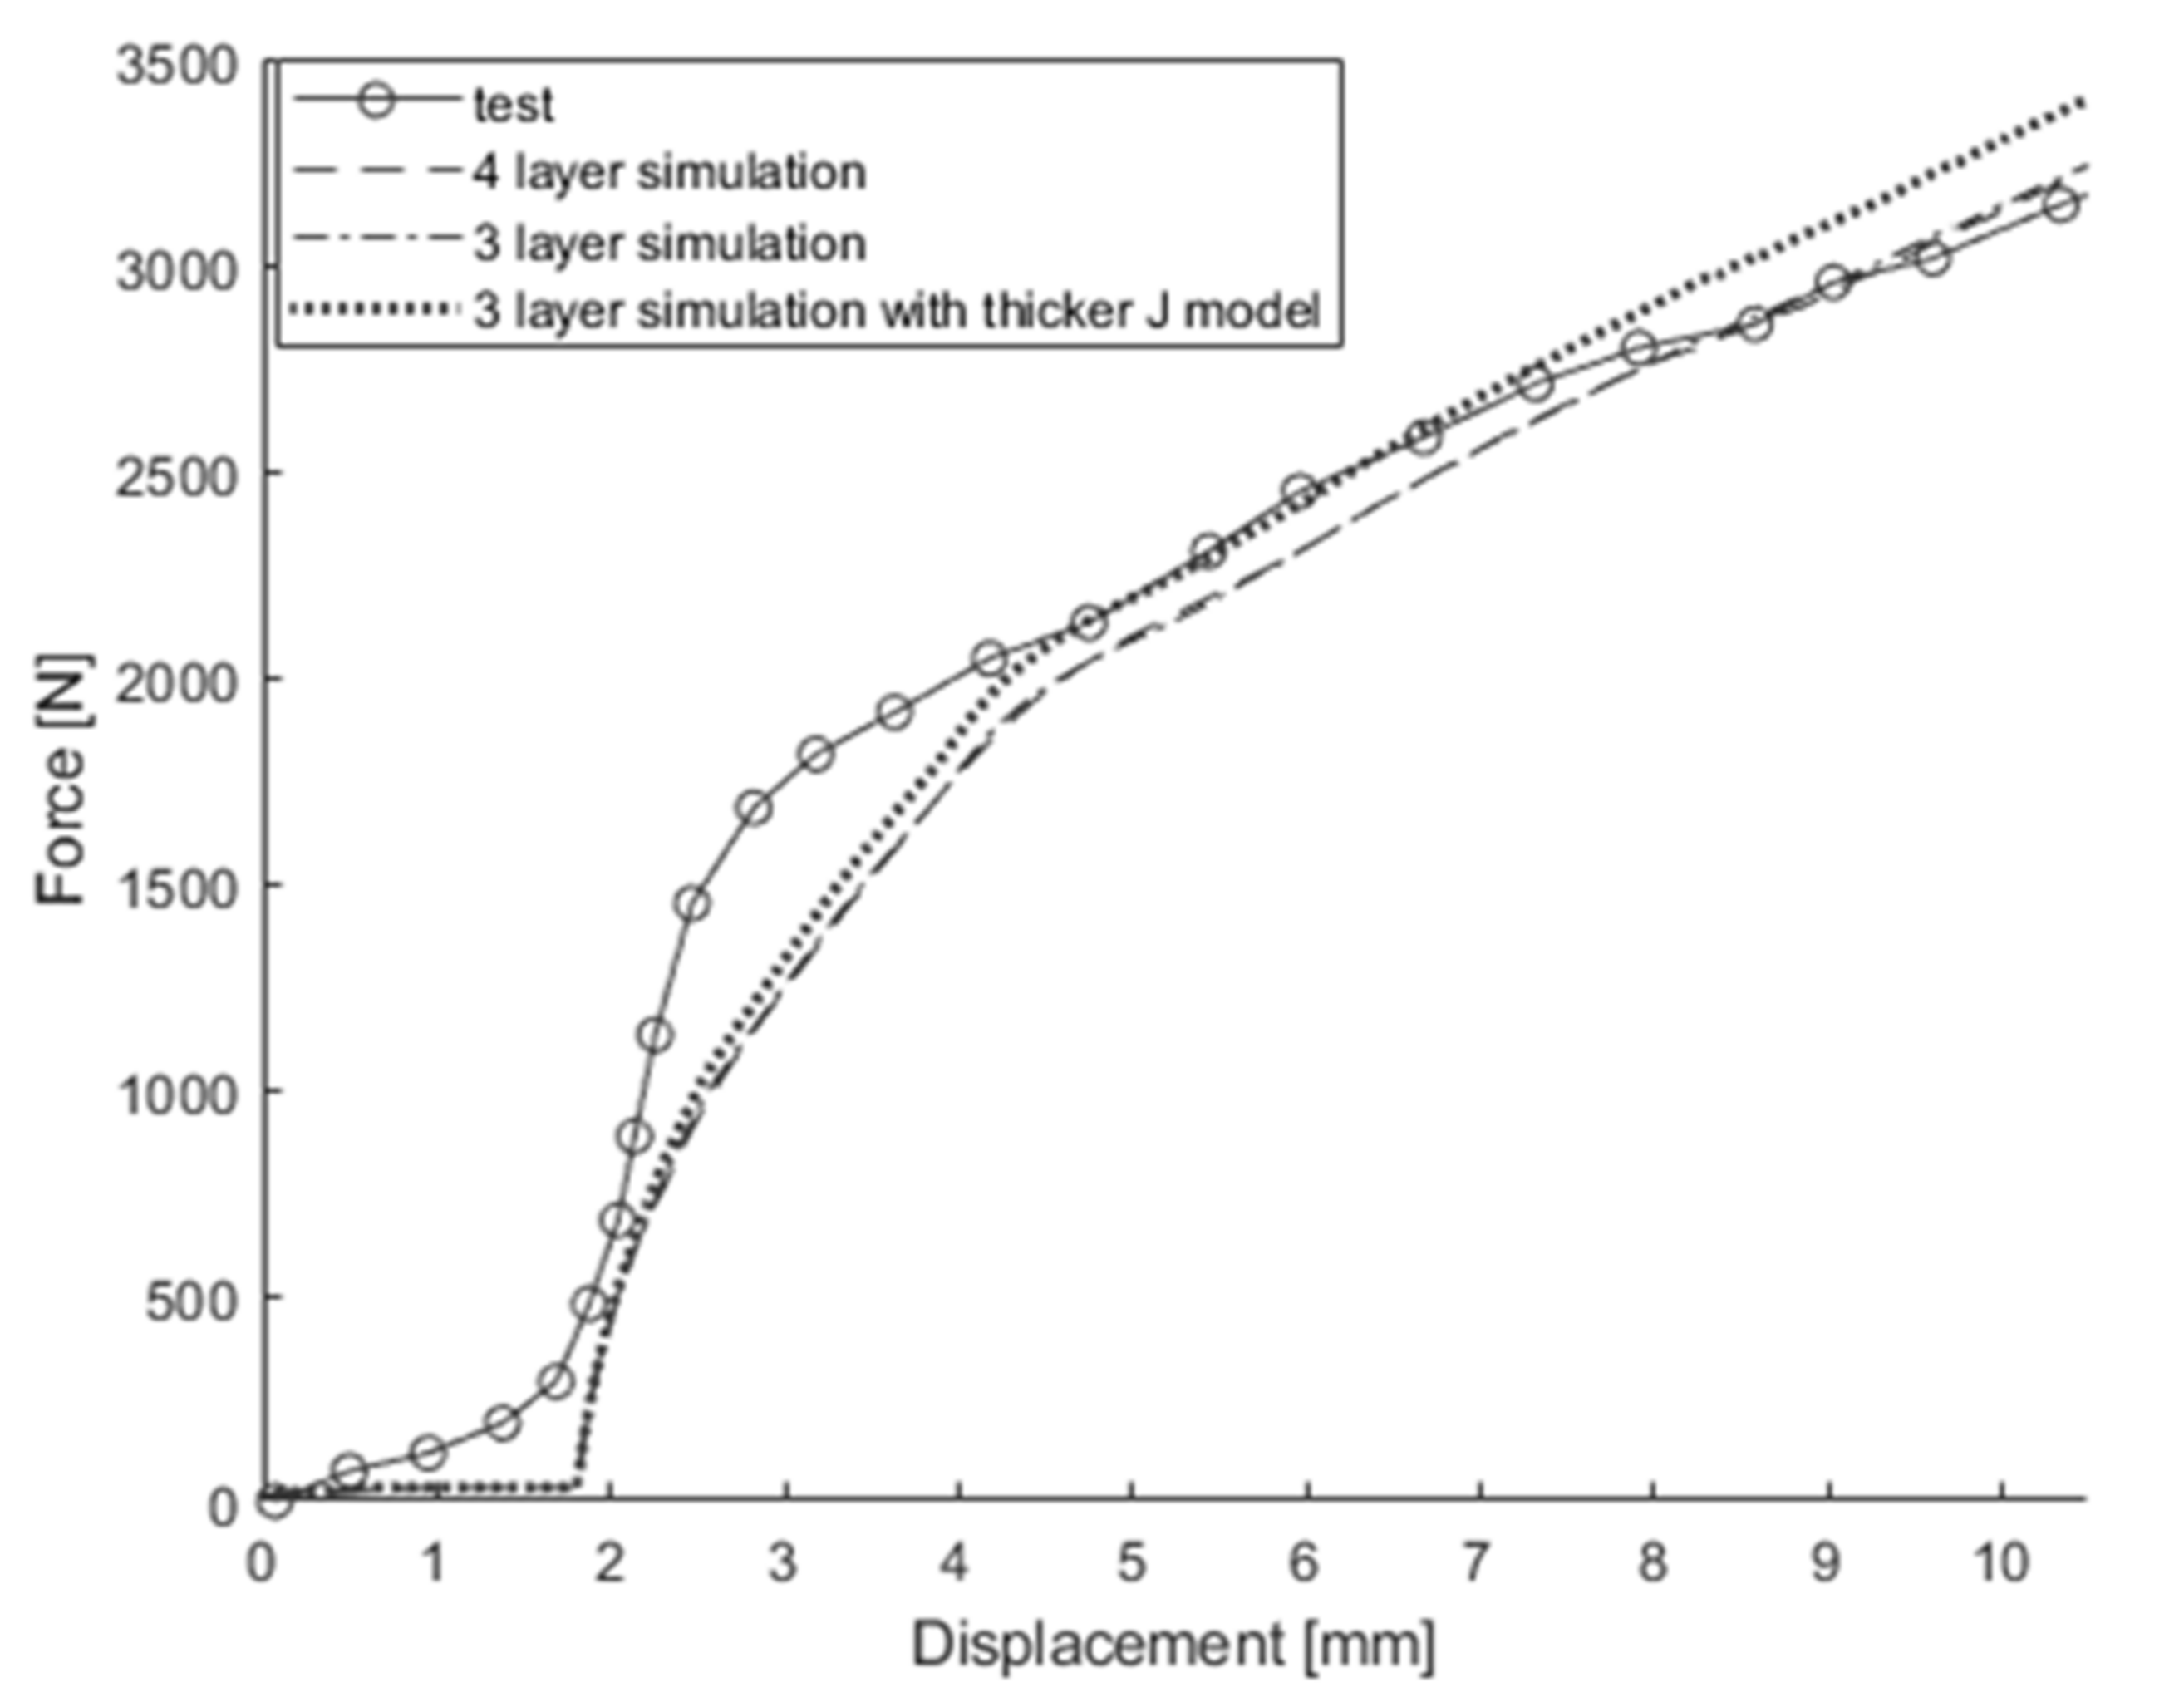
Figure 27.
The 3-point bending test around the length direction and simulation results obtained from original model, 3-layer model, and 3-layer model with thicker J model.
Figure 27.
The 3-point bending test around the length direction and simulation results obtained from original model, 3-layer model, and 3-layer model with thicker J model.

Figure 28.
The 3-point bending test around the width direction and simulation results obtained from original model, 3-layer model, and 3-layer model with thicker J model.
Figure 28.
The 3-point bending test around the width direction and simulation results obtained from original model, 3-layer model, and 3-layer model with thicker J model.


Table 1.
Error between tests and simulation results for the first and second battery.
| First and Second Battery | |
|---|---|
| Test Case | J & M Simulation Error [%] |
| Out-of-plane compression | 11.69 |
| Out-of-plane compression w/o vacuum | 16.00 |
| Out-of-plane compression w/o the pouch | 0.23 |
| 3-point bending around the length direction w/o the pouch | 28.95 |
| 3-point bending around the length direction with the pouch | 13.93 |
| 3-point bending around the length direction w/o vacuum | 19.86 |
Table 2.
Error between tests and simulation results for the third battery.
| Third Battery | |||
|---|---|---|---|
| Test Case | Number of Cells | Beaumont et al.’s Simul. Error [%] | J & M Simulation Error [%] |
| Out-of-plane compression | Single cell | 0 | 4.42 |
| Two stacked cells | 6.04 | 12.55 | |
| Confined in-plane compression in the length direction | Single cell | 6.30 | 16.97 |
| Two stacked cells | 27.00 | 8.40 | |
| Confined in-plane compression in the width direction | Single cell | 3.12 | 19.04 |
| Two stacked cells | 29.97 | 2.17 | |
| 3-point bending around the length direction | Single cell | 3.48 | 14.96 |
| Two stacked cells | 20.41 | 15.86 | |
| 3-point bending around the width direction | Single cell | 3.07 | 16.06 |
| Two stacked cells | 35.05 | 31.96 | |
Table 3.
Number of elements for the first, second, and third batteries.
| Battery | Battery Model | Test | Model Type | Number of Elements | |
|---|---|---|---|---|---|
| Solid | Shell | ||||
| First battery | Sahraei’s detailed model | Out-of-plane compression | Full model | 30,000 | 31,500 |
| J & M model | Quarter model | 880 | 564 | ||
| Second battery | J & M model | 3-point bending | Quarter model | 1408 | 876 |
| Third battery | Beaumont et al.’s homogenized model | 3-point bending, out-of-plane compression | Full model | 3060 | 2424 |
| J & M model with fine elements | Quarter model | 4620 | 2582 | ||
| J & M model with coarse elements | Quarter model | 1224 | 682 | ||
Disclaimer/Publisher’s Note: The statements, opinions and data contained in all publications are solely those of the individual author(s) and contributor(s) and not of MDPI and/or the editor(s). MDPI and/or the editor(s) disclaim responsibility for any injury to people or property resulting from any ideas, methods, instructions or products referred to in the content. |
© 2024 by the authors. Licensee MDPI, Basel, Switzerland. This article is an open access article distributed under the terms and conditions of the Creative Commons Attribution (CC BY) license (https://creativecommons.org/licenses/by/4.0/).
Share and Cite
MDPI and ACS Style
Jeong, H.-Y.; Park, J. Development of a Homogenized Finite Element Model for Pouch Lithium-Ion Battery Cells Considering Porosity and Pressure Sensitivity. Energies 2024, 17, 1162. https://doi.org/10.3390/en17051162
AMA Style
Jeong H-Y, Park J. Development of a Homogenized Finite Element Model for Pouch Lithium-Ion Battery Cells Considering Porosity and Pressure Sensitivity. Energies. 2024; 17(5):1162. https://doi.org/10.3390/en17051162
Chicago/Turabian StyleJeong, Hyun-Yong, and Jinwoo Park. 2024. "Development of a Homogenized Finite Element Model for Pouch Lithium-Ion Battery Cells Considering Porosity and Pressure Sensitivity" Energies 17, no. 5: 1162. https://doi.org/10.3390/en17051162
Note that from the first issue of 2016, this journal uses article numbers instead of page numbers. See further details here.