
Pre-Treatment of Spent Coffee Grounds Using Hydrodynamic Cavitation
by
 , , , , and
Aleksandra Szaja
1,*,
Agnieszka Montusiewicz
1,
Sylwia Pasieczna-Patkowska
2,
Elżbieta Grządka
2,
Jerzy Montusiewicz
3 and
Magdalena Lebiocka
1 1
Faculty of Environmental Engineering, Lublin University of Technology, Nadbystrzycka 40B, 20-618 Lublin, Poland
2
Faculty of Chemistry, Institute of Chemical Sciences, Maria Curie-Skłodowska University, Maria Curie-Skłodowska Sq. 3, 20-031 Lublin, Poland
3
Faculty of Electrical Engineering and Computer Science, Lublin University of Technology, Nadbystrzycka 38A, 20-618 Lublin, Poland
*
Author to whom correspondence should be addressed.
Energies 2024, 17(9), 2229; https://doi.org/10.3390/en17092229
Submission received: 27 March 2024
/
Revised: 26 April 2024
/
Accepted: 30 April 2024
/
Published: 6 May 2024
(This article belongs to the Special Issue Anaerobic Digestion of Wastewater for Renewable Energy Production)
Abstract
:Spent coffee grounds (SCGs) constitute the main solid residue of the coffee brewing process. SCGs are generated in significant amounts daily, worldwide. The effective management of this waste through biological processes is still an unresolved problem. In this study, the application of hydrodynamic cavitation (HC) as a pre-treatment method for improving the biodegradability of SCGs suspended in municipal wastewater was proposed. An orifice plate with a conical concentric hole having inlet/outlet diameter of 3/10 mm was applied as the cavitation inducer. Three inlet pressures were chosen: 3, 5 and 7 bar. The effects in time intervals of 0, 5, 10, 20, 30 and 45 min were evaluated. The application of HC led to enhanced biodegradability for each case. The results of multi-criteria decision indicated that the most efficient combination in terms of biodegradability and energy usage was obtained at the pressure of 5 bar and duration of 20 or 30 min, depending on the adopted weights. The improvements of DOC/TOC (dissolved organic carbon/total organic carbon) ratio were 57% and 71%, as compared to the untreated samples. The release of caffeine was found at pressures of 5 and 7 bar. However, at 5 bar, this effect was noticed for the longest times, 30 and 45 min, respectively.
1. Introduction
Currently, coffee is recognized as one of the most popular beverages, consumed all around the world in large amounts. It is estimated that the global daily consumption reaches as much as 3 billion cups, of which over 30% occurs in Europe [1,2]. Thus, it contributes to the generation of a significant amount of waste. The main solid residue of the coffee brewing process is known as spent coffee grounds (SCGs) [3]. It is assessed that about 60 million kg of this by-product is produced daily, worldwide [4]. A significant amount of SCGs are deposited in landfills or incinerated, leading to increased greenhouse gas emissions [5]. Moreover, SCGs contain various organic compounds, e.g., caffeine, polysaccharides, cellulose and tannins, that potentially can be transformed into toxic substances, causing environmental pollution [3,6].
Recently, global attention has been focused on the potential for transformation into a valuable resource for various commercial applications [5]. It has been applied in the food, pharmaceutical and cosmetic industries [3]. Other applications are related to its adsorption capabilities; it has been used for bioremediation or production of adsorbents [7,8]. However, in addition to these commercial uses, there may be benefits to using SCGs to produce energy. Among various available technologies, anaerobic digestion (AD) offers several environmental and economic advantages in this process. AD allows for conversion of organic wastes into energy and nutrient-rich digestate. It also enables the effective management of many types of organic residues [9].
AD has been used with various feedstocks; however, anaerobic bioconversion of some of them is still a technological challenge [9,10]. SCGs belong to this group. This fact is mainly due to SCGs’ complex structure and the presence of potential AD inhibitors, e.g., polyphenols, tannins, caffeine and terpenes, as well as terpenoids [11]. Previous studies have indicated that mono-digestion of SCGs has a limitation related to maintaining process stability. Another approach allowing for an application of SCGs in the AD process is utilisation of the pre-treatment strategy. Recent studies indicated that pre-treatment might result in increased methane production, in particular in the case of lignocellulosic biomass [12]. Among various pre-treatment methods, hydrodynamic cavitation (HC) is recognised as cost-effective and easy to carry out and to scale up as well as being a sustainable solution. The recent studies in the field of application of this technique for pre-treatment of lignocellulose biomass confirmed a high effectiveness in disrupting lignocellulosic fibres, increasing accessible surface area and promoting the subsequent hydrolysis, with formation of a small amount of AD inhibitors [13]. Moreover, HC does not require reagent dosing, which can lead to corrosion and neutralisation before AD [14].
In this study, the application of HC as a pre-treatment method for improving the biodegradability of SCGs are studied. The effectiveness of HC was evaluated on the basis of changes in physicochemical composition of pre-treated SCG material and possible inhibitors formation in the material. To assess the changes occurring with HC, we employed a Fourier transform infrared spectroscopy with attenuated total reflectance accessory (FT-IR/ATR) and also performed particle size, zeta potential, conductivity and surface tension analyses.
Additionally, multi-criteria decision-making analysis was undertaken, leading to an optimal decision. As a result, optimal HC parameters such as inlet pressure and time circulating the cavitated medium via the system were indicated. Thus far, such multifaceted studies in the field of application of HC for this waste have not been conducted. The proposed technology might allow for the beneficial, sustainable use of SCGs in biological processes with energy recovery.
2. Materials and Methods
2.1. Substrates
The SCGs used in this study were obtained from commercial espresso coffee machines located at the campus of Lublin University of Technology (Poland). For HC experiments, they were used as a fresh sample without any pre-treatment. Before each HC experiment, a new sample of SCGs were collected. Prior to the performance of HC, SCGs were suspended in the mechanically pre-treated wastewater (MW) obtained from the local wastewater treatment plant (WWTP) (Lublin, Poland). The high total solids (TSs) content of SGCs does not permit us to perform HC without prior dilution. Our previous studies indicated that application of such a medium is suitable for performance HC and does not contribute to the generation of toxic intermediate products during HC [15]. For each HC experiment, a new MW sample was taken in the amount of 35 L. The physicochemical characteristics of the applied substrates are summarised in Table 1.
2.2. HC Experiments and Operational Set-Up
The operational set-up of the HC experiments is shown in the Figure 1. The experiments were conducted using specially designed laboratory equipment consisting of a cavitation reactor, a circulation reservoir with an active volume of 30 L, a pump and an inverter, as well as measurement equipment, e.g., an electromagnetic flow meter and three piezoelectric pressure gauges. All elements were connected with pipelines. Moreover, the HC device was equipped with control valves. The data were monitored and saved using a PC with appropriate software. In this HC system, the applied medium circulates in a closed loop, repeatedly passing through the cavitation reactor. An orifice plate with a single conical concentric hole of 3/10 mm (inlet/outlet diameter) was chosen as the cavitation inducer due to the solid content of cavitated medium. The detailed description and scheme of the applied HC device is presented in the study conducted by Montusiewicz et al. [16].
To perform HC experiments, SCGs were suspended in wastewater and 950 g of SCGs was added to 30 L of MW, which constituted 1% of total solids (TS) content in the pre-treated mixture. The proportion of SCGs were related to the technical limitation of applied HC device. Three inlet pressures were chosen: 3, 5 and 7 bar. The corresponding cavitation numbers for those pressures were 0.113, 0.067 and 0.049, respectively. The samples for analyses were taken at the following time intervals: 0, 5, 10, 20, 30 and 45 min. The number of passes of the medium through the cavitation zone is presented in Table 2. The energy usage (kWh) was recorded from the pump inverter controlling its operation during the HC experiments.
2.3. Analytical Methods
2.3.1. The Physicochemical Analyses
In the collected materials, the following parameters were controlled: chemical oxygen demand (COD), TSs, volatile solids (VSs), total organic carbon (TOC), phenols, caffeine and pH level. In turn, in the soluble fraction obtained by filtering through a membrane with a 0.45 µm pore-size filter, the soluble chemical oxygen demand (sCOD) and dissolved organic carbon (DOC) were analysed.
sCOD, COD and phenols were measured using spectrophotometer DR 3900 (Hach Lange) and dedicated cuvette tests. Both VSs and TSs were established according to the procedure presented in APHA 2012 [17]. The TOC content was controlled using the RC 612 LECO equipment. The concentration of DOC in samples was measured by the means of a TOC-L Shimadzu analyser.
To evaluate the caffeine content, a gas chromatograph coupled with an Agilent 8890/5977B mass spectrometer (Waldbron, Deutschland) was applied. An analytical column HP-5 ms (30 m × 0.25 mm I.D., film thickness of 0.25 μm) was adopted. Helium with a purity of 99.99% and flow of 1.0 mL/min was used as a carrier gas. The temperature of the MS detector was maintained at 200 °C. In turn, the temperature program for the column was as follows: 75 °C for 1 min, a linear ramp to 300 °C at 7.5 °C/min.
The pH analysis was performed with a calibrated pH meter Elmetrin CX-401 (Elmetron, Zabrze, Poland) by immersing an electrode (EPS-1 electrode) directly in the tested system. Each tested system was analysed three times and the average values were reported.
The conductivity analysis was performed using a calibrated conductivity meter Elmetrin CX-401 (Elmetron, Zabrze, Poland) by directly immersing an electrode (EC-60 electrodes) in the tested system. The measurements were performed at 25 °C and repeated three times, and the average values were reported.
2.3.2. Zeta Potential and Particle Size Analysis
The zeta potential analysis was performed using a NanoZS Zetasizer (Malvern Instruments Ltd., Malvern, UK) with a universal dip cell. Measurements were performed at 25 °C in 12 mm glass cell cuvettes (PCS1115). The software converted the electrophoretic mobility of the sample to the zeta potential using the Smoluchowski equation. Each measurement was repeated six times, and the average values were reported.
The particle sizes of the investigated samples were presented as hydrodynamic diameters, which were derived from the time correlation function of the particle number density. The mean hydrodynamic diameters of the measured samples were determined by dynamic light scattering (DLS) using a NanoZS zetasizer (Malvern Instruments Ltd., Malvern, UK). Measurements were performed at 25 °C in 12 mm square polystyrene cuvettes (DTS0012). Each sample was repeated at least six times, and the average values were reported.
2.3.3. FT-IR/ATR
Attenuated total reflectance ATR (FT-IR/ATR) spectra were recorded in the 3800–600 cm−1 range, resolution 4 cm−1 using a Meridian Diamond ATR accessory (Harrick) and Ni-colet 6700 spectrometer. Freeze-dried samples were directly applied to the diamond crystal, and close contact was made with the surface by a pressure tower. Interferograms consisted of 512 scans. All spectra were corrected for carbon dioxide and water vapour, and ATR correction was applied. No smoothing functions were used. All spectral measurements were performed at least in triplicate.
2.3.4. Multi-Criteria Decision Making
The results of the experiments were analysed using multi-criteria decision in relation to 18 distinguished variants (Table 3). Five criteria were defined, the maximization of two variables: sCOD/COD and DOC/TOC and minimization of three variables: concentration of caffeine and phenols as well as energy usage. The decision variables for individual variants were the inlet pressure and time intervals. The assessment was carried out in a five-dimensional criterion space. In the first step (S1), non-dominated solutions (Pareto optimal) were determined. In the next one (S2), a compromise solution was generated using the Chebyshev metric. Depending on the situation, maximum or minimum values established separately for each considered criterion were used as reference values. These quantities form an ideal vector whose use resulted in a transition from nominal values to dimensionless quantities, enabling comparison. The result of this step was to obtain one compromise solution. It was also possible to reflect the relative significance of the criteria by introducing weights, with their sum being 1. Two kinds of analysis were conducted, i.e., min–max analysis with the equal weights for the distinguished criteria (wi, where i is a number of the respective criterion, for 5 criteria each wi = 0.2) and min–max analysis with differentiated weights. A detailed description of the method is presented in study conducted by Surdacki and Montusiewicz [18].
3. Results and Discussion
3.1. Influence of HD on the Physicochemical Properties of Pre-Treated Mixture
To evaluate the impact of HC on the properties of SGC and MW mixture properties, the contents of COD, sCOD, TOC, DOC, VSs and TSs were analysed. In determining the impact of HC on biodegradability the sCOD/COD and DOC/TOC ratios were selected as the key indicators. Those results are presented in Table 3 and Figure 2.
As a result of HC, destruction of complex organic compounds expressed as COD, TOC and TS was found. Regarding the first parameter, as the testing time increased, a decrease in the COD content was observed (Figure 2c). Importantly, at 5 bar, major decreases of COD content that varied between 15–35% were found. A minor effect was achieved at pressures of 3 and 7 bar, respectively. At the lowest pressure, COD was reduced by 14–21% as compared to the untreated sample. In turn, at the highest pressure, decreases of COD content reached 11–24%.
A similar finding was found in the study conducted by Dhanke [19]. Within HC using an orifice plate of wastewater generated in fish processing plants, the COD reduction varied between 23–51%; however, the highest values were achieved with a longer time, of 160 min. Less favourable results were obtained in the case of tannery waste effluent; therein, maximum COD reduction of 14.5% was found with optimum pressure of 5 bar and time of 120 min [20].
Regarding TOC content, major declines were achieved at pressures of 3 and 7 bar (Table 3). The greatest decreases of TOC, amounting to 19.9% and 13.9%, were achieved at the longest time of 45 min, for 3 and 7 bar, respectively. The results obtained in this study are comparable to those presented by other researchers. Saxena et al. [20] reported that the highest TOC reduction of 12.60% was found at a pressure of 5 bar and a time of 120 min. In turn, the application of HC with an inlet pressure of 5 bar for distillery wastewater treatment resulted in COD and TOC reduction of 32% and 31%, respectively [21]. It is worth noting that the abovementioned investigations are related to single-component mixtures, i.e., wastewaters. Nonetheless, in the present study, SCGs were suspended in MW. In the literature, studies of multi-component mixtures are not common. In authors’ previous studies, the application of HC to brewery spent grain suspended in MW also allowed for efficient decomposition of complex organic compounds. Therein, the application of the same HC inductor and the pressure of 7 bar resulted in decreasing the COD and TOC contents by approx. 16% [16].
The mechanisms of organic matter destruction within HC might occur through several paths. However, two of them are recognized as dominant [22]. The first is related to the influence of free radicals generated within collapsing bubbles that react with refractory organics. The second mechanism occurs when HC is combined with pyrolysis, i.e., the thermal effects that occur inside or near cavitation bubbles [23]. Moreover, in certain cases, the shockwaves generated by the collapsing cavity might also damage the molecular bonds. This effect is particularly observable in the case of high molecular weight compounds or multi-component mixtures [24]. The main factors determining which mechanism is decisive are the properties of the compound, the intensity of cavitation and the construction of the HC reactor [25]. In this study, an orifice plate with one concentric hole was employed. Previous investigations confirmed that such construction of the inductor ensures higher cavitation intensity as compared to other HC reactors, e.g., Venturi [26,27]. Additionally, the effectiveness of organic matter destruction is influenced by several factors including inlet pressure, temperature, pH, geometry and type of the device, as well as initial content of pollutant.
Generally, the application of higher pressure results in the enhanced reduction in COD and TOC contents. The higher pressure favours increased generation of cavities and consequently increased production of free radicals with oxidizing capability level [28]. However, it should be emphasized that after exceeding a certain pressure, super-cavitation might be generated, leading to vapour cloud formation and cessation of cavitation bubbles collapse [29]. Frequently, further increases in pressure above optimum do not result in the improvement of oxidation or mineralization effectiveness. This observation was confirmed by Saharan et al. [30]. In this investigation, the use of the highest pressures of 13 and 10 bar resulted in COD and TOC reduction comparable to using only 5 bar. Moreover, it should be pointed out that application of high pressures is related to significant operational costs and thus might be difficult to implement in large scale operations.
Within the destruction of complex organic compounds, the discharge of easily biodegradable organic matter was observed. This finding has been confirmed in previous studies related to the application of HC for various types of wastewaters, e.g., municipal [31], mature landfill leachate [32] and industrial effluents [33]. This achievement is particularly important in the context of further use of pre-treated mixture in an anaerobic digestion process. The released soluble fraction can be easily metabolized by AD microbes and hence may improve subsequent methane production [13]. In this regard, the solubilization of organic matter is recognized as the main indicator assessing the effectiveness of the pre-treatment method [24].
Regarding sCOD, as is shown in Figure 2d, a higher release of this parameter was achieved with increasing pressure, lowering the frequency of cavitation and extending the time. At a pressure of 7 bar, the release percentage varied between 25.4% to 82.2%, while the major enhancement as compared to initial sample was found at the longest time of 45 min. In turn, the release percentage varied between 15–44.2% and 25.7–67.4% for 3 and 5 bar, respectively.
A trend similar to that of sCOD was noted for DOC. In all analysed pressures, as test duration extended, greater releases of its content were achieved, and the greatest enhancement was observed at pressure of 7 bar (Table 3). Therein, the most beneficial results were observed for the longest times. As compared to the untreated sample, 1.9- and 2.1-fold increases in its content were found for 30 and 45 min, respectively. Only minor growth in DOC concentrations was observed for other two pressure levels. The release percentage was determined to be 32–50.6% and 38–77.6% for 3 and 5 bar, respectively. A different tendency was found for VS content; in this case, a decrease in its content was noted during the HC experiment. The highest VS loss was obtained at the highest pressure of 7 bar (Figure 2b).
In order to assess the share of easily biodegradable fraction, for each sample, the biodegradability index (BI) was evaluated on the basis of DOC/TOC ratio (Table 3). Evaluation of the influence of pre-treatment on this indicator is particularly important, because it determines the possibility of and susceptibility to degradation of organic compounds in biochemical reactions by microorganisms [24]. Importantly, in this study at the highest pressure even after only 5 min, this indicator increased almost two-fold. The previous investigations confirmed that the application of HC results in the significant improvement of BI index. In the case of wastewaters such as distillery and tannery effluents, even two-fold increases were achieved [24]. A minor effect was found in case of multi-component mixtures of brewery spent grain (BSG) and MW, therein the BI was enhanced by 22% [16].
Regarding sCOD/COD value at all pressures, an improvement of this ratio occurred within HC (Table 3). As in the case of the other indicators, the highest pressure and the longest duration of time resulted in its greatest increase. Favourable results were also observed for a pressure of 5 bar and a time of 20, 30 and 45 min. Therein, over 100% enhancements were found as compared to the untreated sample. Taking into consideration the further application of pre-treated substrate in the AD process, the improved biodegradability and effective destruction of complex organic matter within HC is particularly important. The previous studies indicated that the HC of BSG suspended in MW allowed for its effective utilization with energy surplus in anaerobic co-digestion [15]. It should be noted that the use of each waste and the selection of the appropriate carrier must be considered individually, mainly due to the possible generation of toxic by-products that may lead to the inhibition of AD. Therefore an in-depth analysis and a holistic approach are required. Additionally, for each type of waste, the optimization of operating parameters should be performed.
In this study, the influence of HC on caffeine content was also evaluated (Table 3). Its impact on AD microbes is multifaceted. At high concentrations, this compound is recognized as a possible AD process inhibitor, mainly due to its antibacterial properties. On the other hand, at low doses, caffeine is recognized as a stimulant that accelerates biochemical reactions. Moreover, under anaerobic conditions, it indicates fast absorption by AD microbes [34,35]. Previous studies have indicated that at concentration of 100 mg/L, enhanced biogas production from food waste was achieved. Additionally, a fast initiation of biogas production was also observed [36]. Therefore, it is important to analyse whether the use of particular pre-method results in a significant release of this compound. As is presented in Table 3, applying the highest pressure of 7 bar resulted in the release of caffeine, to the greatest extent at time of 30 min. It should be noticed that at pressure of 5 bar, the release of this compound occurred only at a test duration of 30 and 45 min, while significant release was recorded at pressure of 3 bar.
Regarding phenols, their release was also observed within HC. These compounds also have an inhibitory effect on AD microbiota; their negative influence is related to damaging of microbe cytomembrane, hence affecting the permeability of the cell wall [37]. Prolongation of test time resulted in increased phenol content. However, the major release of phenols was found at the highest pressure of 7 bar. Minor growth was observed in the case of pressure of 5 and 3 bar.
The phenomenon of the release of bioactive compounds within HC is well recognized [38,39]. This mechanism has been used for natural product extraction from various biological resources [40], e.g., protein from soy slurry [41], pectin from orange peels [42], lipids from microalgae [43] and flavonoids from Equisetum palustre L or pigeon pea leaves [44]. Moreover, previous studies have indicated that use of HC for cocoa bean shell waste led to extraction of hydrophilic fraction rich in flavanols, caffeine and theobromine from cocoa bean shell [45]. Extraction occurs because of the collapse and implosion of the cavitation bubbles, generating hot spots and shockwaves. Such conditions allow for the breaking of cell membranes and enhancement of mass transfer, increasing water access to the disrupted cells and extraction of water-soluble compounds in the aqueous phase [40,46].
Another tendency that might be observed includes increases of temperature and pH-value within HC. As the test duration and pressure increased, the values of these parameters were enhanced. It is generally understood that the thermal effect is one of the most visible changes of HC, particularly in the case of the applied device not equipped with a cooling system. In turn, the growth of pH value is attributed to the formation of free radicals [28].
3.2. Changes of Zeta Potential and Particle Sizes within HC
Analysis of the changes in physicochemical properties of the medium in investigated variants (Table 3) may facilitate the interpretation of the HC results. Figure 3 presents the influence of inlet pressure and time of HC on the properties of the SCG and MW mixture, including conductivity, surface tension, zeta potential and particle size. The results in Figure 3a show that the conductivity of the samples increases slightly along with time, which means that some ionic compounds are released during HC. These substances are probably mainly anionic in nature, as the pH of the systems also increases with time (Table 3). As far as the inlet pressure is analysed, the observed differences are relatively small. However, when the system is set at an inlet pressure of 5 bar, the conductivity values appear to be the highest. Figure 3b presents the influence of the inlet pressure and the HC time on the surface tension of the analysed variants. According to the literature, coffee beans contain coffee oil, which has surface active properties [47]. Biochemical analysis of this compound confirmed the presence of polar groups (chlorogenic acid, an ester of caffeic acid and quinic acid—hydrophilic head) and non-polar groups (hydrocarbon chain—hydrophobic tail), which confer surface activity on coffee oil. It appears that this oil is released during the cavitation processes under all inlet pressures studied, but the release is the greatest under 5 bar and the smallest under 3 bar. As can be seen, the zeta potential of the investigated samples changes insignificantly with the time of HC for the system under 3 bar of pressure (Figure 3c). This potential occurs in the double layer at the surface of the dispersed particles. It is determined at the slipping plane, in relation to the potential deep within the continuous phase. In other words, it is the potential between the dispersant and the fluid layer attached to the particle surface. This parameter is very important in determining the stability of the system and indicating what types of instabilities may occur for a given solid–liquid system. Some small changes in the zeta potential can be seen at 7 bar and the largest for the system under 5 bar. In the latter two systems, a small increase in the zeta potential can be observed, but the values are still negative, which means that this type of charge dominates in the slipping plane [48]. Moreover, the values of the measured zeta potentials allow us to conclude that the HC process causes a slight decrease in the stability of the tested systems (with time the values are closer to zero). On the basis of the changes in particle size (Figure 3d), which are associated with the changes in inlet pressure and time, it can be seen that the higher the inlet pressure and the longer the treatment time, the smaller the particles. The HC process breaks down the solid particles present in the system into smaller ones. The higher the pressure accompanying the HC process, the smaller the particles obtained which is in agreement with the literature [49].
3.3. FT-IR/ATR
FT-IR/ATR was used to estimate changes in the composition of organic matter that could result from the use of hydrodynamic cavitation as an SCG pretreatment method. Figure 4 presents the FT-IR/ATR spectra of untreated SCGs and SCGs subjected to hydrodynamic cavitation.
As mentioned earlier, SCGs have a complex structure containing polysaccharides, lipids (also coffee oil), polyphenols, proteins, tannins, caffeine, terpenes and terpenoids. Most of the bands in all FT-IR/ATR spectra of SCGs are characteristic of polysaccharides and lipids. SCGs may also contain acids (i.a. chlorogenic, quinic) and caffeine. SCGs contain less oil, acid and caffeine than the original beans, but one can expect that some amounts will still be present in SCGs. The bands at 1375, 1243, 1147, 1111 and 1053 cm−1 may be attributed to chlorogenic acids and esters formed by quinic acid as well as some trans-cinnamic acids. In the 1085–1050 cm−1 range, C-O deformation of the chlorogenic, caffeic and coumarinic acids may also be visible [50]. The IR bands of acids and caffeine may also partially overlap with those of other SCGs components. The most intense bands in the pure caffeine spectrum are the band at 3111 cm−1 (=C-H stretching), 2953 cm−1 (C-H asymmetric stretching of CH3 groups), 1693 cm−1 (C=O stretching), 1645 and 1545 cm−1 (C=N stretching), 1234 cm−1 (C-N stretching) and 742 cm−1 (out-of-plane aromatic ring bending) [51]. Therefore, apart from the band at 3111 cm−1, not detected in any recorded IR spectra (Figure 4), all other bands overlap with the bands of the previously mentioned compounds.
Thus, due to the complex composition of SCGs, determining the impact of cavitation on changes in organic matter by interpreting IR spectra is difficult. However, IR analysis of even very complex mixtures can provide very useful information about changes in the chemical structure of the tested materials and thus estimate the degree of decomposition of individual functional groups. This, in turn, allows to determine whether hydrodynamic cavitation contributes to the decomposition of these groups and, consequently, to increasing biodegradability of SCGs. The smallest differences in spectra can be observed for SCGs cavitated at a pressure of 3 bar (Figure 4a). Small changes are visible at 1741 cm−1, i.e., in the range of ester or acidic C=O groups vibrations. However, a decrease in the intensity of this band is noticeable only in the spectrum of the sample cavitated for 45 min. The band at 1642 cm−1, which may be responsible for both C=O (ketones, quinones, amide II) and C=C vibrations (lipids) [52], also slightly decreases. The vibrations of the latter are also visible at 3011 cm−1, but their intensity practically does not change, which may suggest that the decrease in the intensity of the band at 1642 cm−1 is the result of the decomposition of C=O rather than C=C groups. The decrease in the intensity of the band of acidic and ester groups at 1741 cm−1 is much more visible after SCG cavitation at a pressure of 5 bar (Figure 4b). After 45 min of cavitation, the disintegration of these groups is significant. Moreover, a band at 1545 cm−1 (C=N stretching) appears in the spectrum of the sample after 45 min of cavitation, which may indicate the release of caffeine. This is the only strong band that can be considered a caffeine indicator, because the other caffeine bands overlap with the protein, polysaccharide and lipid bands. In the spectra of samples after cavitation at a pressure of 7 bar, this band appears after 5 min of the process (Figure 4c) and is visible in each subsequent spectrum, up to 45 min. The decrease in 1741 cm−1 band intensity is also visible, similarly when a pressure of 5 bar was applied. These results are consistent with the physicochemical data (Table 3). Additionally, in the spectra of samples cavitated at pressures of 5 bar (Figure 4b) and 7 bar (Figure 4c), a decrease in the intensity of bands indicating polysaccharides (bands in the range of 1200–900 cm−1) can be observed. This band intensity reduction is much lower for the samples cavitated at 3 bar (Figure 4a).
3.4. The Results of the Muli-Criteria Analysis Making
It was not possible to indicate the best solution among the tested variants of HC without constructing and conducting a multi-criteria analysis. Table 4 presents the assumptions made for this analysis, as well as the results, thus yielding allowing for a multi-criteria an optimized result.
When all criteria were assumed to be equally significant, the optimal solution turned out to be variant 10 (v10) representing cavitation at inlet pressure of 5 bar and circulating the cavitated medium in the system for 20 min. However, considering the aim of the study, DOC/TOC and energy usage should be regarded as the criteria of special significance, with the former to be maximized and the latter minimized. Their weights (w2 and w5) were enhanced in S2B and S2C, respectively, compared to S2A. Not only DOC/TOC, but also sCOD/COD indicated the improved biodegradability of cavitated medium. In S2B, the weights of both of these were increased (w1 and w2), whereas in S2C, only the first one was regarded as a key factor for the subsequent AD (w2 = 0.5). Caffeine concentration was treated differently in S2B and S2C, since its negligible influence on the AD performance was assumed for the latter. Various optimal solutions were obtained in S2B and S2C. In the first case, the same variant (v10) as in S2A turned out to be optimal, despite the enhanced weights of most criteria. Decreasing the weight of caffeine criterion together with increasing those for DOC/TOC and for energy usage gave the optimal solution represented by variant 11, i.e., cavitation at inlet pressure of 5 bar with duration of 30 min. Due to the low concentration of caffeine after HC, the optimal solution seems to be the last one. As previously mentioned, the low concentration of caffeine may indicate the stimulating effect on the microorganisms of the AD process. This fact may result in increased production of biogas from this waste.
4. Conclusions
The results obtained from the above study confirm that hydrodynamic cavitation is a promising technique that might be applied as a pre-treatment method prior to subsequent anaerobic digestion. At each tested pressure with the prolongation of time, an enhanced destruction of complex organic compounds was achieved. Simultaneously, the solubilization of organic matter occurred. The release of caffeine was noticed at pressures of 5 and 7 bar. Nevertheless, at 5 bar this effect was observed only for the longest times 30 and 45 min. The degradation of refractory compounds and release of caffeine were also confirmed by the results of the FT-IR/ATR analysis. Moreover, the changes of zeta potential, particle sizes and conductivity also confirmed those effects.
To select the most advantageous conditions of HC, the multi-criteria analysis was used. The improvement of biodegradability and energy usage were chosen as the main criteria of this evaluation. The results of multi-criteria decision showed that the most beneficial variants involved the pressure of 5 bar and duration of 20 or 30 min, depending on the adopted weights. Therein, the improvements of DOC/TOC ratio were 57% and 71%, respectively, as compared to the untreated samples. It should be noticed that at time of 30 min the release of caffeine were observed; however, due to its low content, this variant seems to be considered as the most favourable. Nevertheless, to evaluate the overall effect of HC, further studies of the AD of pre-treated mixtures should be conducted.
Author Contributions
Conceptualization, A.S. and A.M.; methodology, A.S., M.L., S.P.-P., E.G. and J.M.; formal analysis, A.S. and A.M.; investigation, A.S., M.L., S.P.-P., E.G. and J.M.; writing—original draft preparation, A.S., A.M., S.P.-P., E.G. and J.M.; writing—review and editing, A.S., A.M., S.P.-P. and E.G.; visualization, A.S., S.P.-P., E.G. and M.L.; supervision, A.M.; project administration, A.S. and M.L.; funding acquisition A.S. All authors have read and agreed to the published version of the manuscript.
Funding
The grant was financed in the framework of the pro-quality program “Grants for grants” (Grant nr: 2/GnG/2022).
Data Availability Statement
The original contributions presented in the study are included in the article, further inquiries can be directed to the corresponding author.
Conflicts of Interest
The authors declare no conflicts of interest.
References
- Yusufoğlu, B.; Kezer, G.; Wang, Y.; Ziora, Z.M.; Esatbeyoglu, T. Bio-recycling of spent coffee grounds: Recent advances and potential applications. Curr. Opin. Food Sci. 2023, 55, 101111. [Google Scholar] [CrossRef]
- Santos, V.P.; Ribeiro, P.C.C.; Rodrigues, L.B. Sustainability assessment of coffee production in Brazil. Environ. Sci. Pollut. Res. 2023, 30, 11099. [Google Scholar] [CrossRef] [PubMed]
- Zhao, N.; Liu, Z.; Yu, T.; Yan, F. Spent coffee grounds: Present and future of an environmentally friendly applications on industries—A review. Trends Food Sci. Technol. 2024, 143, 104312. [Google Scholar] [CrossRef]
- Cavanagh, Q.; Brooks, M.S.; Rupasinghe, H.V. Innovative technologies used to convert spent coffee grounds into new food ingredients: Opportunities, challenges, and prospects. Future Foods 2023, 8, 100255. [Google Scholar] [CrossRef]
- Roychand, R.; Kilmartin-Lynch, S.; Saberian, M.; Li, J.; Zhang, G.; Li, C.Q. Transforming spent coffee grounds into a valuable resource for the enhancement of concrete strength. J. Clean. 2023, 419, 138205. [Google Scholar] [CrossRef]
- Dafouz, R.; Caceres, N.; Rodríguez-Gil, J.L.; Mastroianni, N.; Lopez De Alda, M.; Barcelo, D. Does the presence of caffeine in the marine environment represent an environmental risk? A regional and global study. Sci. Total Environ. 2018, 615, 632–642. [Google Scholar] [CrossRef] [PubMed]
- Li, H.; Zhang, J.; Li, F.; Luo, S.; Li, Q.; Zhou, S. Preparation of waste coffee grounds carbon and study on phenol adsorption ability. J. Wuhan Univ. Technol. 2022, 37, 38–46. [Google Scholar] [CrossRef]
- Qisse, N.; Fattah, G.; Elouardi, M.; Mabrouki, J.; El Azzouzi, L.; Ennouari, A. Competitive adsorption of Zn in wastewater effluents by NaOH-activated raw coffee grounds derivative and coffee grounds. Deswater 2022, 258, 123–132. [Google Scholar] [CrossRef]
- Rabii, A.; Aldin, S.; Dahman, Y.; Elbeshbishy, E. A Review on Anaerobic Co-Digestion with a Focus on the Microbial Populations and the Effect of Multi-Stage Digester Configuration. Energies 2019, 12, 1106. [Google Scholar] [CrossRef]
- Masłoń, A.; Czarnota, J.; Szczyrba, P.; Szaja, A.; Szulżyk-Cieplak, J.; Łagód, G. Assessment of Energy Self-Sufficiency of Wastewater Treatment Plants—A Case Study from Poland. Energies 2024, 17, 1164. [Google Scholar] [CrossRef]
- Jomnonkhaow, U.; Plangklang, P.; Reungsang, A.; Peng, C.Y.; Chu, C.Y. Valorization of spent coffee grounds through integrated bioprocess of fermentable sugars, volatile fatty acids, yeast-based single-cell protein and biofuels production. Bioresour. Technol. 2024, 393, 130107. [Google Scholar] [CrossRef] [PubMed]
- Atelge, M.R.; Atabani, A.; Abut, S.; Kaya, M.O.; Eskicioglu, C.; Semaan, G.; Lee, C.; Yıldız, Y.Ş.; Unalan, S.; Mohanasundaram, R.; et al. Anaerobic co-digestion of oil-extracted spent coffee grounds with various wastes: Experimental and kinetic modeling studies. Bioresour. Technol. 2020, 322, 124470. [Google Scholar] [CrossRef] [PubMed]
- Zhen, G.; Lu, X.; Kato, H.S.; Zhao, Y.; Li, Y. Overview of pretreatment strategies for enhancing sewage sludge disintegration and subsequent anaerobic digestion: Current advances, full-scale application and future perspectives. Renew. Sust. Energ. Rev. 2017, 69, 559–577. [Google Scholar] [CrossRef]
- Prado, C.A.; Antunes, F.A.; Rocha, T.M.; Sánchez-Muñoz, S.; Barbosa, F.G.; Terán-Hilares, R.; Cruz-Santos, M.M.; Arruda, G.L.; da Silva, S.S.; Santos, J. A review on recent developments in hydrodynamic cavitation and advanced oxidative processes for pretreatment of lignocellulosic materials. Bioresour. Technol. 2021, 345, 126458. [Google Scholar] [CrossRef] [PubMed]
- Szaja, A.; Montusiewicz, A.; Lebiocka, M.; Bis, M. A combined anaerobic digestion system for energetic brewery spent grain application in co-digestion with a sewage sludge. Waste Manag. 2021, 135, 448–456. [Google Scholar] [CrossRef]
- Montusiewicz, A.; Pasieczna-Patkowska, S.; Lebiocka, M.; Szaja, A.; Szymańska-Chargot, M. Hydrodynamic cavitation of brewery spent grain diluted by wastewater. Chem. Eng. J. 2017, 313, 946–956. [Google Scholar] [CrossRef]
- American Public Health Association (APHA). Standard Methods for the Examination of Water and Wastewater, 22nd ed.; APHA: Washington, DC, USA, 2012. [Google Scholar]
- Surdacki, P.; Montusiewicz, J. Approach to multicriterion optimization of quench performance of superconducting winding. IEEE Trans. Magn. 1996, 32, 1266–1269. [Google Scholar] [CrossRef]
- Dhanke, P.; Sameer Wagh, S.; Patil, A. Treatment of fish processing industry wastewater using hydrodynamic cavitational reactor with biodegradability improvement. Water Sci. Technol. 2019, 80, 2310–2319. [Google Scholar] [CrossRef]
- Saxena, S.; Saharan, V.K.; George, S. Enhanced synergistic degradation efficiency using hybrid hydrodynamic cavitation for treatment of tannery waste effluent. J. Clean. 2018, 198, 1406–1421. [Google Scholar] [CrossRef]
- Padoley, K.V.; Saharan, V.K.; Mudliar, S.N.; Pandey, R.A.; Pandit, A.B. Cavitationally induced biodegradability enhancement of a distillery wastewater. J. Hazard. 2012, 219–220, 69–74. [Google Scholar] [CrossRef]
- Gogate, P.R.; Pandit, A.B. A review of imperative technologies for wastewater treatment I: Oxidation technologies at ambient conditions. Adv. Environ. Res. 2004, 8, 501–551. [Google Scholar] [CrossRef]
- Mahamuni, N.N.; Adewuyi, Y.G. Advanced oxidation processes (AOPs) involving ultrasound for waste water treatment: A review with emphasis on cost estimation. Ultrason. Sonochem. 2010, 17, 990–1003. [Google Scholar] [CrossRef] [PubMed]
- Bhat, A.P.; Gogate, P.R. Cavitation-based pre-treatment of wastewater and waste sludge for improvement in the performance of biological processes: A review. J. Environ. Chem. Eng. 2021, 9, 104743. [Google Scholar] [CrossRef]
- Mohod, A.V.; Teixeira, A.C.; Bagal, M.V.; Gogate, P.R.; Giudici, R. Degradation of Organic Pollutants from Wastewater using Hydrodynamic Cavitation: A review. J. Environ. Chem. Eng. 2023, 11, 109773. [Google Scholar] [CrossRef]
- Wang, B.; Su, H.; Zhang, B. Hydrodynamic cavitation as a promising route for wastewater treatment—A review. Chem. Eng. J. 2021, 412, 128685. [Google Scholar] [CrossRef]
- Zheng, H.; Zheng, Y.; Zhu, J. Recent Developments in Hydrodynamic Cavitation Reactors: Cavitation Mechanism, Reactor Design, and Applications. Engineering 2022, 19, 180–198. [Google Scholar] [CrossRef]
- Gogate, P.R. Cavitation: An auxiliary technique in wastewater treatment schemes. Adv. Environ. Res. 2002, 6, 335–358. [Google Scholar] [CrossRef]
- Omelyanyuk, M.; Ukolov, A.; Pakhlyan, I.; Bukharin, N.; El Hassan, M. Experimental and Numerical Study of Cavitation Number Limitations for Hydrodynamic Cavitation Inception Prediction. Fluids 2022, 7, 198. [Google Scholar] [CrossRef]
- Saharan, V.K.; Badve, M.P.; Pandit, A.B. Degradation of Reactive Red 120 dye using hydrodynamic cavitation. Chem. Eng. J. 2011, 178, 100–107. [Google Scholar] [CrossRef]
- Lebiocka, M. Application of Hydrodynamic Cavitation to Improve the Biodegradability of Municipal Wastewater. J. Ecol. Eng. 2020, 21, 155–160. [Google Scholar] [CrossRef]
- Bis, M.; Montusiewicz, A.; Ozonek, J.; Pasieczna-Patkowska, S. Application of hydrodynamic cavitation to improve the biodegradability of mature landfill leachate. Ultrason. Sonochem. 2015, 26, 378–387. [Google Scholar] [CrossRef] [PubMed]
- Gągol, M.; Przyjazny, A.; Boczkaj, G. Effective method of treatment of industrial effluents under basic pH conditions using acoustic cavitation–A comprehensive comparison with hydrodynamic cavitation processes. Chem. Eng. Process. 2018, 128, 103–113. [Google Scholar] [CrossRef]
- Neves, L.; Ribeiro, R.; Oliveira, R.; Alves, M.M. Anaerobic digestion of coffee waste. Waste Manag. 2006, 26, 176–181. [Google Scholar] [CrossRef] [PubMed]
- Chen, R.; Jiang, H.; Li, Y. Caffeine degradation by methanogenesis: Efficiency in anaerobic membrane bioreactor and analysis of kinetic behavior. Chem. Eng. J. 2018, 334, 444–452. [Google Scholar] [CrossRef]
- Prabhudessai, V.; Ganguly, A.; Mutnuri, S. Effect of caffeine and saponin on anaerobic digestion of food waste. Ann. Microbiol. 2009, 59, 643–648. [Google Scholar] [CrossRef]
- He, J.; Luo, T.; Shi, Z.; Angelidaki, I.; Zhang, S.; Luo, G. Microbial shifts in anaerobic digestion towards phenol inhibition with and without hydrochar as revealed by metagenomic binning. J. Hazard. Mater. 2022, 440, 129718. [Google Scholar] [CrossRef]
- Wu, Z.; Ferreira, D.F.; Crudo, D.; Bosco, V.; Stevanato, L.; Costale, A.; Cravotto, G. Plant and Biomass Extraction and Valorisation under Hydrodynamic Cavitation. Processes 2019, 7, 965. [Google Scholar] [CrossRef]
- Panda, D.; Manickam, S. Cavitation Technology—The Future of Greener Extraction Method: A Review on the Extraction of Natural Products and Process Intensification Mechanism and Perspectives. Appl. Sci. 2019, 9, 766. [Google Scholar] [CrossRef]
- Ciriminna, R.; Scurria, A.; Pagliaro, M. Natural product extraction via hydrodynamic cavitation. Sustain. Chem. Pharm. 2023, 33, 101083. [Google Scholar] [CrossRef]
- Preece, K.E.; Hooshyar, N.; Krijgsman, A.J.; Fryer, P.J.; Zuidam, N.J. Intensification of protein extraction from soybean processing materials using hydrodynamic cavitation. Innov. Food Sci. Emerg. Technol. 2017, 41, 47–55. [Google Scholar] [CrossRef]
- Meneguzzo, F.; Brunetti, C.; Fidalgo, A.; Ciriminna, R.; Delisi, R.; Albanese, L.; Zabini, F.; Gori, A.; dos Santos Nascimento, L.B.; De Carlo, A.; et al. Real-scale integral valorization of waste orange peel via hydrodynamic cavitation. Processes 2019, 7, 581. [Google Scholar] [CrossRef]
- Lee, I.; Han, J. Simultaneous treatment (cell disruption and lipid extraction) of wet microalgae using hydrodynamic cavitation for enhancing the lipid yield. Bioresour. Technol. 2015, 186, 246–251. [Google Scholar] [CrossRef] [PubMed]
- Patil, P.B.; Bhandari, V.M.; Ranade, V.V. Wastewater treatment and process intensification for degradation of solvents using hydrodynamic cavitation. Chem. Eng. Process.-Process Intensif. 2021, 166, 108485. [Google Scholar] [CrossRef]
- Grillo, G.; Boffa, L.; Binello, A.; Mantegna, S.; Cravotto, G.; Chemat, F.; Telysheva, G. Cocoa bean shell waste valorisation; extraction from lab to pilot-scale cavitational reactors. Food Res. Int. 2019, 115, 200–208. [Google Scholar] [CrossRef] [PubMed]
- Arya, S.S.; More, P.R.; Ladole, M.R.; Pegu, K.; Pandit, A.B. Non-thermal, energy efficient hydrodynamic cavitation for food processing, process intensification and extraction of natural bioactives: A review. Ultrason. Sonochem. 2023, 98, 106504. [Google Scholar] [CrossRef] [PubMed]
- Deotale, S.M.; Dutta, S.; Moses, J.A.; Anandharamakrishnan, C. Coffee oil as a natural surfactant. Food Chem. 2019, 295, 180–188. [Google Scholar] [CrossRef] [PubMed]
- Xu, R. Progress in nanoparticles characterization: Sizing and zeta potential measurement. Particuology 2008, 6, 112–115. [Google Scholar] [CrossRef]
- Tiwari, V.; Walker, V.; Ranade, V.V. Particle breakage using wet mill, ultrasonic, and hydrodynamic cavitation. Cryst. Growth Des. 2023, 23, 8620–8636. [Google Scholar] [CrossRef]
- Rosson, E.; Sgarbossa, P.; Mozzon, M.; Venturino, F.; Bogialli, S.; Glisenti, A.; Talon, A.; Moretti, E.; Carturan, S.M.; Tamburini, S.; et al. Novel Correlations between Spectroscopic and Morphological Properties of Activated Carbons from Waste Coffee Grounds. Processes 2021, 9, 1637. [Google Scholar] [CrossRef]
- Marcelo, M.C.A.; Mariotti, K.C.; Ferrão, M.F.; Ortiz, R.S. Profiling cocaine by ATR–FTIR. Forensic Sci. Int. 2015, 246, 65–71. [Google Scholar] [CrossRef]
- Socrates, G. Infrared and Raman Characteristic Group Frequencies. Tables and Charts, 3rd ed.; John Wiley & Sons, Ltd.: Chichester, UK, 2004. [Google Scholar]
Figure 1.
The assumptions and operating conditions of the experiment.

Figure 2.
Changes in VS (a), TS (b), COD (c) and SCOD (d) contents during HC (average values and standard deviations are given).
Figure 2.
Changes in VS (a), TS (b), COD (c) and SCOD (d) contents during HC (average values and standard deviations are given).
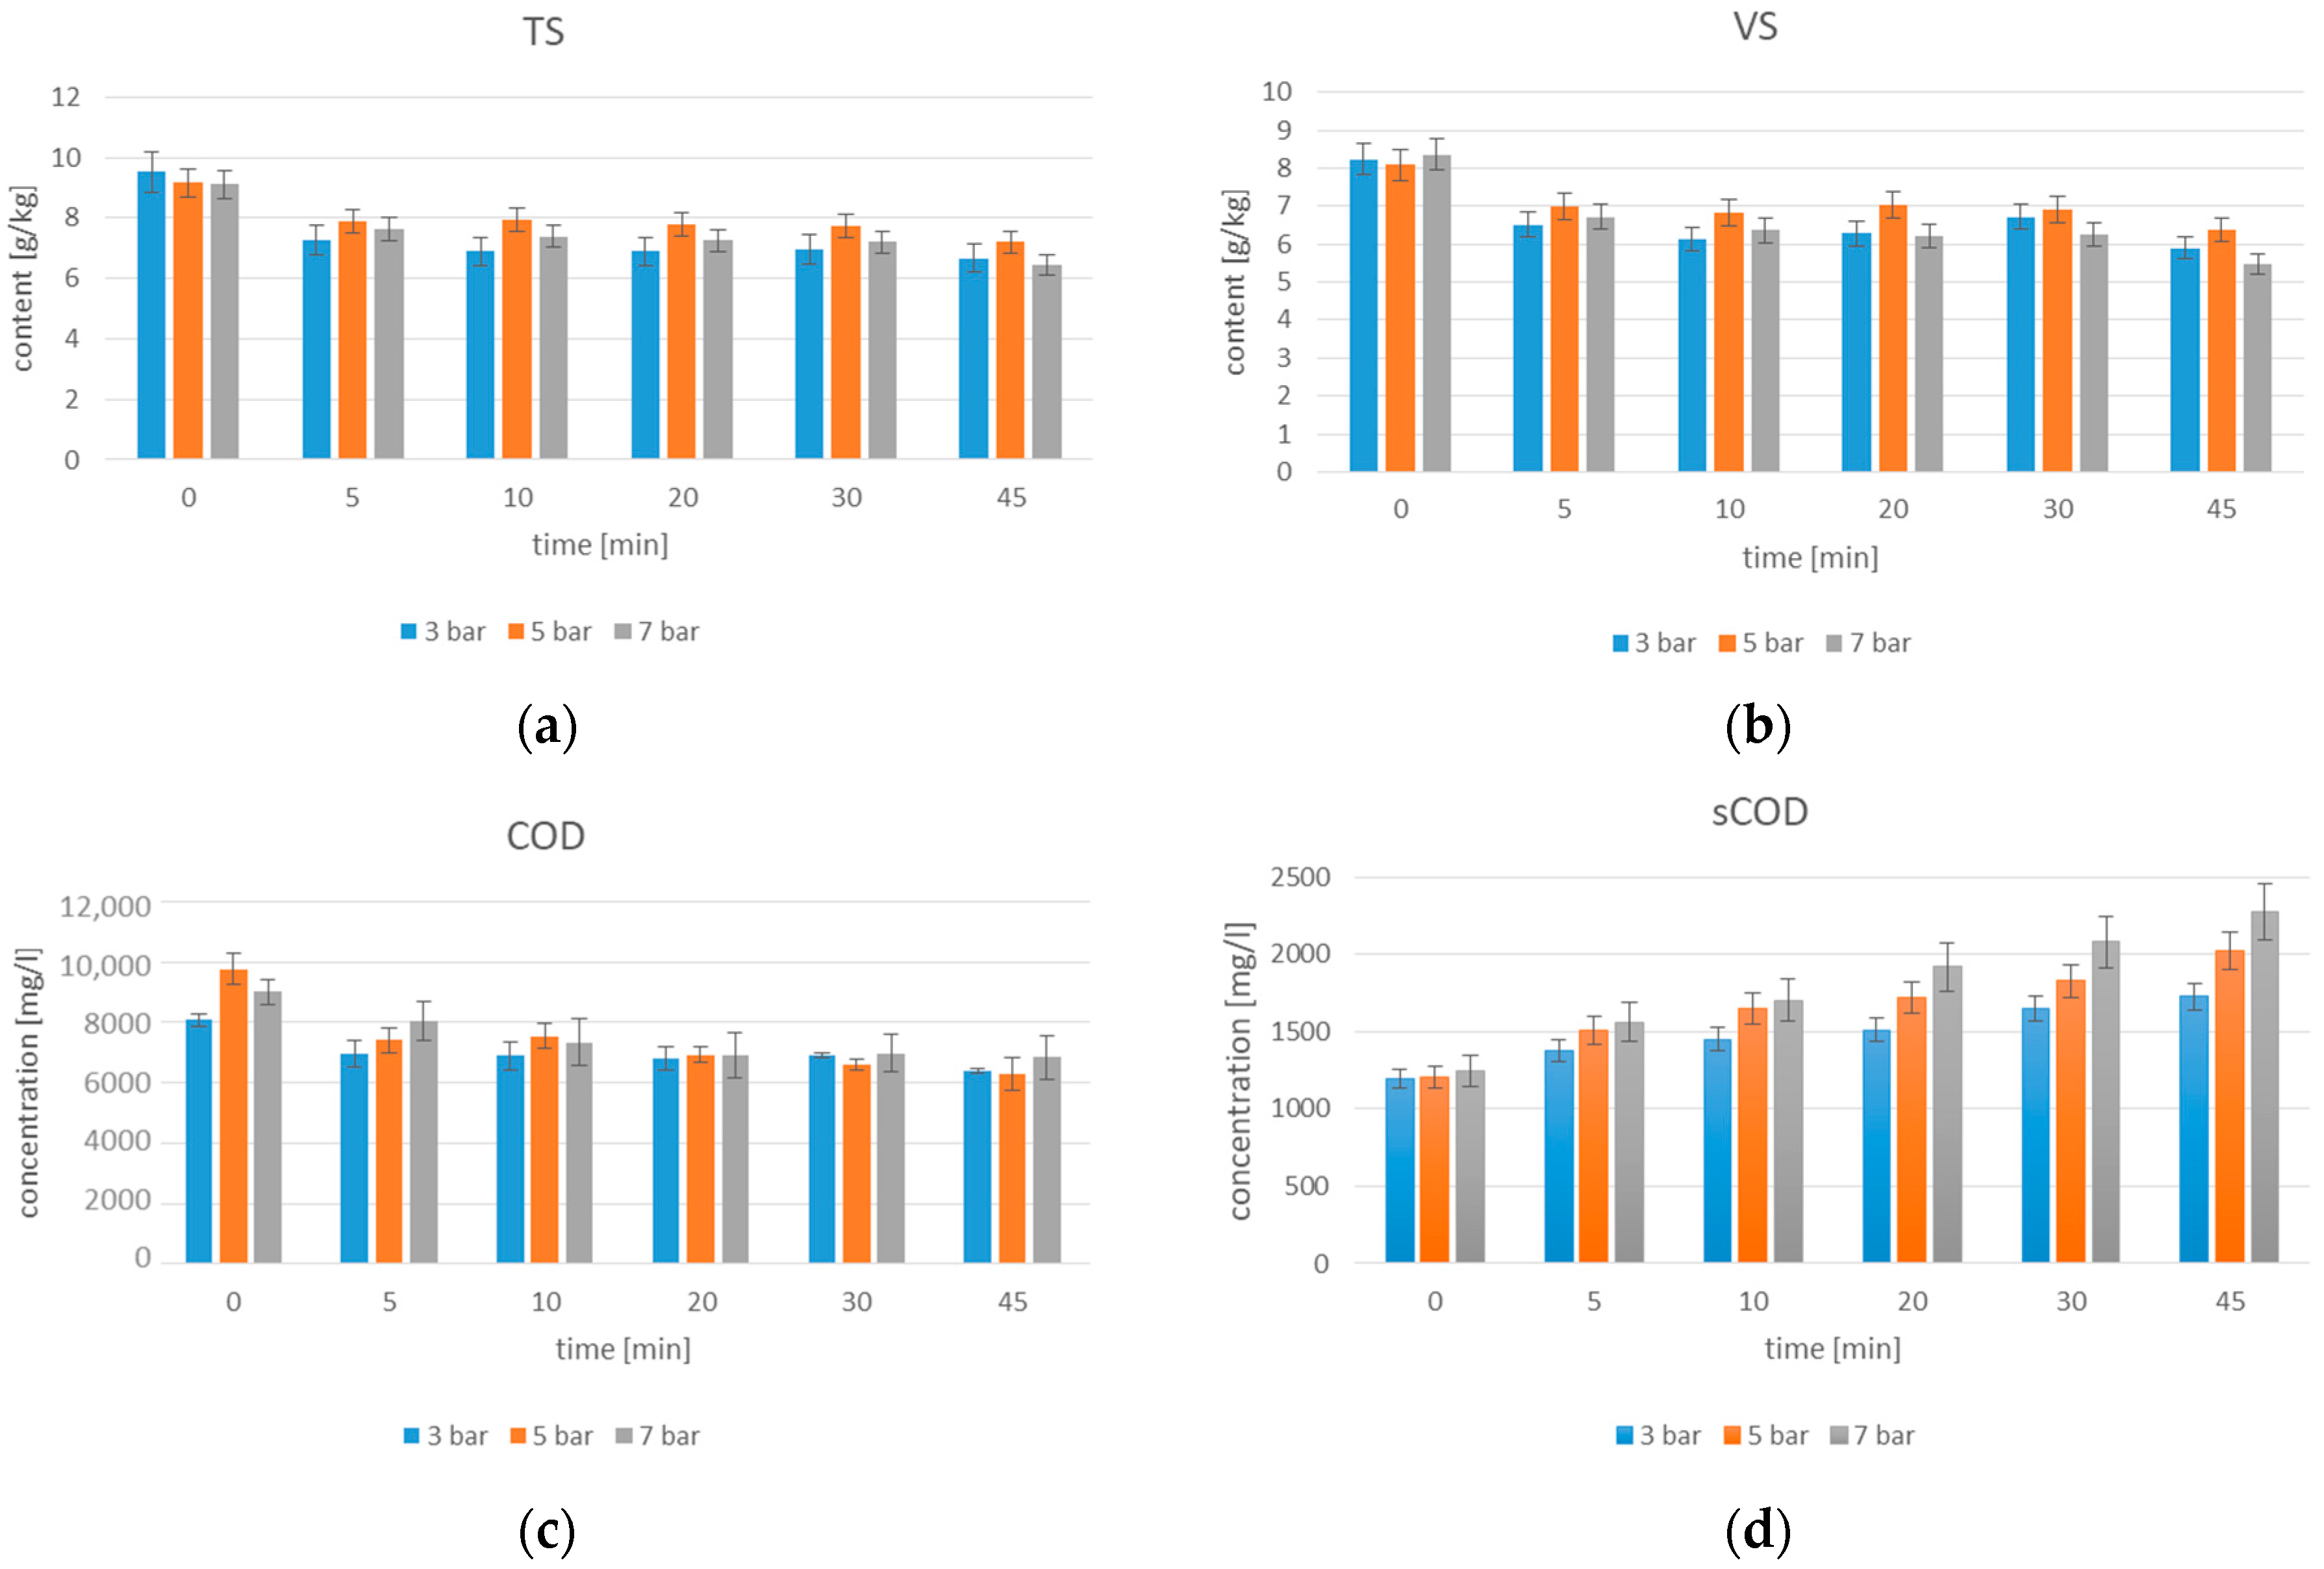
Figure 3.
The influence of inlet pressure and HC time on the properties of medium in the respective HC variants: (a) conductivity; (b) surface tension; (c) zeta potential; (d) particle size.
Figure 3.
The influence of inlet pressure and HC time on the properties of medium in the respective HC variants: (a) conductivity; (b) surface tension; (c) zeta potential; (d) particle size.
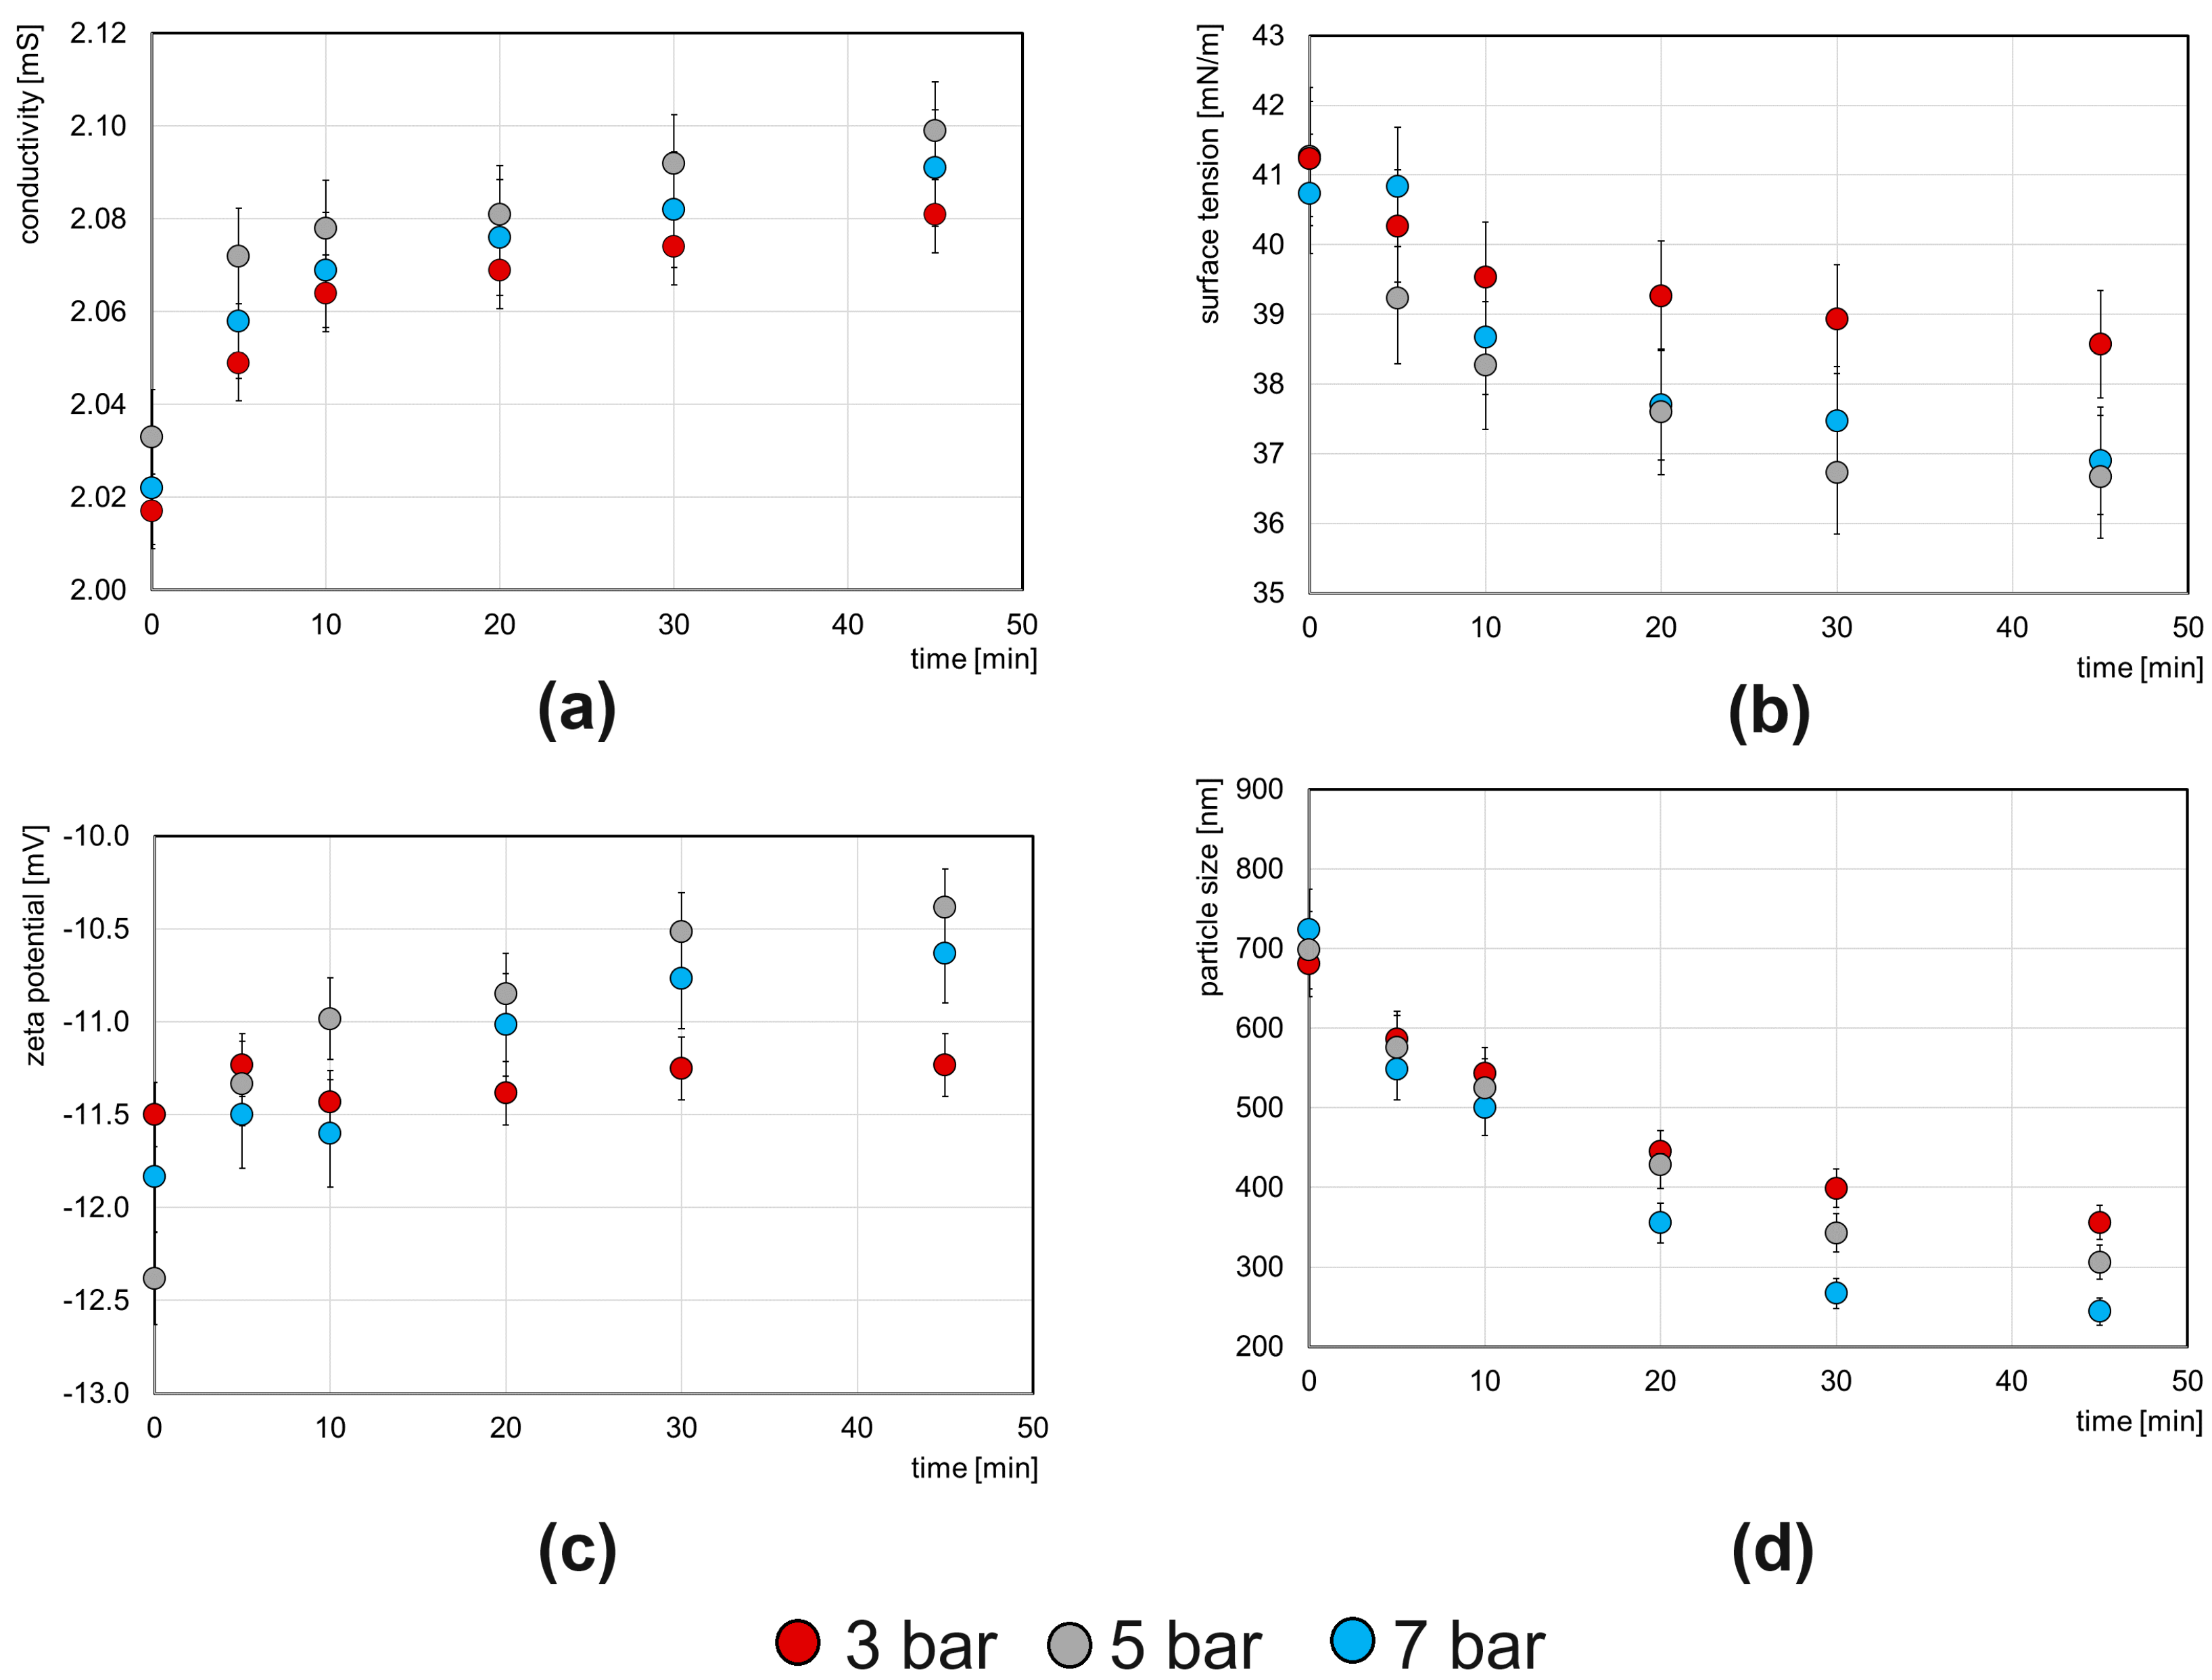
Figure 4.
FT-IR/ATR spectra of initial SCGs and SCGs subjected to hydrodynamic cavitation under three pressures: (a) 3 bar, (b) 5 bar, (c) 7 bar, collected after 0, 5, 10, 20, 30 and 45 min. Spectra were displaced vertically in order to avoid overlap.
Figure 4.
FT-IR/ATR spectra of initial SCGs and SCGs subjected to hydrodynamic cavitation under three pressures: (a) 3 bar, (b) 5 bar, (c) 7 bar, collected after 0, 5, 10, 20, 30 and 45 min. Spectra were displaced vertically in order to avoid overlap.


Table 1.
The physicochemical characteristics of the applied substrates in the experiments (average values and standard deviation are given).
Table 1.
The physicochemical characteristics of the applied substrates in the experiments (average values and standard deviation are given).
| Parameter | Unit | SCGs | MW |
|---|---|---|---|
| TS | g/kg | 315.78 ± 3.4 | 1.07 ± 0.05 |
| VS | g/kg | 310.28 ± 5.1 | 0.37 ± 0.06 |
| COD | mg/L | 15,750 ± 25.3 | 583 ± 14.7 |
| TOC | g/kg | 520 ± 4.7 | 74.10 ± 3.7 |
| pH | - | 5.27 ± 0.1 | 7.59 ± 0.2 |
Table 2.
The number of passes of pre-treated medium through the cavitation zone.
| Time [min] | 3 bar | 5 bar | 7 bar |
|---|---|---|---|
| 5 | 2.9 | 3.6 | 4.3 |
| 10 | 5.7 | 7.3 | 8.5 |
| 20 | 11.5 | 14.6 | 17.1 |
| 30 | 17.2 | 21.9 | 25.6 |
| 45 | 25.8 | 32.8 | 38.4 |
Table 3.
Changes in physicochemical indicators during HC as well as energy usage at various pressures (average values and standard deviation are given) together with specification of variants for multi-criteria decision.
Table 3.
Changes in physicochemical indicators during HC as well as energy usage at various pressures (average values and standard deviation are given) together with specification of variants for multi-criteria decision.
| Time | TOC | DOC | sCOD/COD | DOC/TOC | VS/TS | Caffeine | pH | Phenols | T | Energy Usage | Variant Number |
|---|---|---|---|---|---|---|---|---|---|---|---|
| min | g/kg | mg/L | - | - | ppm | mg/L | °C | kWh | |||
| 3 bar | |||||||||||
| 0 | 585 ± 8.24 | 332 ± 14.38 | 0.15 | 0.0006 | 0.86 | 7.23 ± 0.15 | 20.8 ± 2.40 | 9.05 ± 0.35 | - | v1 | |
| 5 | 528 ± 19.90 | 438 ± 19.13 | 0.20 | 0.0008 | 0.90 | 7.29 ± 0.12 | 22.3 ± 7.92 | 10.65 ± 0.07 | 0.039 | v2 | |
| 10 | 512 ± 13.29 | 453 ± 11.90 | 0.21 | 0.0009 | 0.89 | 7.32 ± 0.12 | 21.5 ± 7.99 | 11.95 ± 0.64 | 0.077 | v3 | |
| 20 | 499 ± 11.11 | 474 ± 19.64 | 0.22 | 0.0009 | 0.90 | 7.36 ± 0.1 | 22.8 ± 8.06 | 13.0 ± 0.14 | 0.154 | v4 | |
| 30 | 478 ± 8.61 | 491 ± 17.08 | 0.24 | 0.0010 | 0.91 | 7.39 ± 0.11 | 24.5 ± 7.71 | 14.85 ± 0.21 | 0.232 | v5 | |
| 45 | 468 ± 13.36 | 499 ± 14.09 | 0.27 | 0.0011 | 0.89 | nd | 7.53 ± 0.01 | 25.4 ± 7.92 | 17.35 ± 0.07 | 0.347 | v6 |
| 5 bar | |||||||||||
| 0 | 498 ± 61.3 | 329.3 ± 26.5 | 0.12 | 0.0007 | 0.88 | nd | 7.32 ± 0.25 | 18.5 ± 7.14 | 8.03 ± 1.68 | - | v7 |
| 5 | 461 ± 47.4 | 453.9 ± 52.9 | 0.20 | 0.0010 | 0.88 | nd | 7.43 ± 0.24 | 21.3 ± 7.54 | 10.90 ± 1.32 | 0.057 | v8 |
| 10 | 464 ± 30.0 | 471.5 ± 55.9 | 0.22 | 0.0010 | 0.87 | nd | 7.46 ± 0.20 | 22.8 ± 7.71 | 11.83 ± 1.53 | 0.114 | v9 |
| 20 | 461 ± 23.9 | 515.5 ± 66.6 | 0.25 | 0.0011 | 0.90 | nd | 7.57 ± 0.17 | 23.9 ± 6.82 | 14.27 ± 1.80 | 0.227 | v10 |
| 30 | 463 ± 12.4 | 545.0 ± 74.6 | 0.28 | 0.0012 | 0.89 | 4.8 ± 0.1 | 7.75 ± 0.12 | 26.1 ± 6.52 | 16.40 ± 1.93 | 0.343 | v11 |
| 45 | 453 ± 24.3 | 584.9 ± 84.9 | 0.32 | 0.0013 | 0.88 | 6.12 ± 0.12 | 7.83 ± 0.10 | 27.6 ± 5.95 | 19.67 ± 2.20 | 0.515 | v12 |
| 7 bar | |||||||||||
| 0 | 525 ± 6.8 | 249.1 ± 38.3 | 0.14 | 0.0005 | 0.92 | nd | 7.24 ± 0.11 | 19.8 ± 5.19 | 9.95 ± 1.49 | - | v13 |
| 5 | 478 ±7.3 | 413.9 ± 74.3 | 0.19 | 0.0009 | 0.88 | 9.64 ± 0.05 | 7.32 ± 0.04 | 22.5 ± 4.34 | 11.55 ± 0.35 | 0.077 | v14 |
| 10 | 472 ± 8.7 | 434.9 ± 77.4 | 0.24 | 0.0009 | 0.86 | 8.73 ± 0.07 | 7.38 ± 0.15 | 24.3 ± 4.53 | 13.55 ± 0.35 | 0.154 | v15 |
| 20 | 467 ± 14.4 | 467.9 ± 55.7 | 0.28 | 0.0010 | 0.86 | 5.50 ± 0.03 | 7.52 ± 0.27 | 26.9 ± 4.88 | 17.05 ± 0.636 | 0.308 | v16 |
| 30 | 465 ± 8.3 | 519.4 ± 50.9 | 0.30 | 0.0011 | 0.87 | 13.81 ± 0.2 | 7.64 ± 0.12 | 29.7 ± 5.44 | 20.25 ± 1.20 | 0.463 | v17 |
| 45 | 452 ± 23.9 | 570.0 ± 63.2 | 0.33 | 0.0013 | 0.86 | 7.55 ± 0.3 | 7.80 ± 0.14 | 33.8 ± 6.32 | 24.05 ± 0.64 | 0.694 | v18 |
Table 4.
Assumptions and results of multi-criteria analysis.
| Step of Multi-Criteria Analysis | Methods | Numbers of Variants | Comments |
|---|---|---|---|
| S1 | Determination of non-dominated variants | v1-v3, v6-v13, v15-v18 | elimination of variants v4, v5, v14, for which all criteria values were worse than for the others |
| S2A | Determination of min-max compromise variant w1 = w2 = w3 = w4 = w5 = 0.2 | v10 | determining the optimal variant in a multi-criteria sense |
| S2B | Determination of min-max compromise variant with weights: w1 = 0.2, w2 = 0.3, w3 = 0.1, w4 = 0.15, w5 = 0.25 | v10 | determining the optimal variant in a multi-criteria sense, taking into account the weights of the criteria significance |
| S2C | Determination of min-max compromise variant with weights: w1 = 0.1, w2 = 0.5, w3 = 0.05, w4 = 0.1, w5 = 0.25 | v11 | determining the optimal variant in a multi-criteria sense, taking into account the weights of the criteria significance |
Disclaimer/Publisher’s Note: The statements, opinions and data contained in all publications are solely those of the individual author(s) and contributor(s) and not of MDPI and/or the editor(s). MDPI and/or the editor(s) disclaim responsibility for any injury to people or property resulting from any ideas, methods, instructions or products referred to in the content. |
© 2024 by the authors. Licensee MDPI, Basel, Switzerland. This article is an open access article distributed under the terms and conditions of the Creative Commons Attribution (CC BY) license (https://creativecommons.org/licenses/by/4.0/).
Share and Cite
MDPI and ACS Style
Szaja, A.; Montusiewicz, A.; Pasieczna-Patkowska, S.; Grządka, E.; Montusiewicz, J.; Lebiocka, M. Pre-Treatment of Spent Coffee Grounds Using Hydrodynamic Cavitation. Energies 2024, 17, 2229. https://doi.org/10.3390/en17092229
AMA Style
Szaja A, Montusiewicz A, Pasieczna-Patkowska S, Grządka E, Montusiewicz J, Lebiocka M. Pre-Treatment of Spent Coffee Grounds Using Hydrodynamic Cavitation. Energies. 2024; 17(9):2229. https://doi.org/10.3390/en17092229
Chicago/Turabian StyleSzaja, Aleksandra, Agnieszka Montusiewicz, Sylwia Pasieczna-Patkowska, Elżbieta Grządka, Jerzy Montusiewicz, and Magdalena Lebiocka. 2024. "Pre-Treatment of Spent Coffee Grounds Using Hydrodynamic Cavitation" Energies 17, no. 9: 2229. https://doi.org/10.3390/en17092229
Note that from the first issue of 2016, this journal uses article numbers instead of page numbers. See further details here.