Article

Effects of Environment Change Scenarios on the Potential Geographical Distribution of Cunninghamia lanceolata (Lamb.) Hook. in China

State Key Laboratory of Tree Genetics and Breeding, College of Life Sciences, Nanjing Forestry University, Nanjing 210037, China
*
Author to whom correspondence should be addressed.
These authors contributed equally to this work.
Forests 2024, 15(5), 830; https://doi.org/10.3390/f15050830
Submission received: 13 March 2024 / Revised: 5 May 2024 / Accepted: 6 May 2024 / Published: 9 May 2024
(This article belongs to the Special Issue Modeling Forest Response to Climate Change)

Abstract

:
Changes in climate and environmental conditions have aggravated the severity and unpredictability of plant survival and growth. Cunninghamia lanceolata (Lamb.) Hook. is an economically important timber tree. Exploring its potential distribution and dynamic changes and identifying the leading environmental variables affecting it will help to adjust the planting range reasonably according to the habits and climate change, thus contributing to its survival and growth. Based on the MaxEnt model and ArcGIS tool, climate, soil, terrain, human activities, variable environment layers, and 395 C. lanceolata distribution points were used to simulate and analyze the geographical distribution characteristics of C. lanceolata in the current and future periods (the 2050s and 2070s) under RCP2.6, RCP4.5, RCP6.0, and RCP8.5. The results showed that C. lanceolata was suitable to grow in a subtropical monsoon climate with warm, humid, abundant rainfall and a relatively gentle topography. Additionally, using percent contribution, permutation importance, and the knife-cutting test, we noted that the annual precipitation (Bio12), human activities (Hfp), minimum temperature of the coldest month (Bio6), mean temperature of the coldest quarter (Bio11), precipitation of coldest quarter (Bio19), annual temperature range (Bio7), and elevation were the leading environmental factors affecting the geographical distribution of C. lanceolata. Among them, it should be noted that the impact of human activities was negatively correlated with suitable habitat areas of C. lanceolata and led to the degeneration of suitable habitats and fragmentized distribution. In addition, predictions have shown that the areas of habitats under other scenarios will be characterized by an increasing and then decreasing trend by the 2050s and 2070s, except for the RCP2.6 scenario, under which the suitable habitats area of C. lanceolata will increase continuously. The core distributional shifts showed that the suitable habitats of C. lanceolata will gradually shift and migrate to high-latitude areas due to global warming. This study focused on the characteristics of suitable habitats of C. lanceolata under different climatic scenarios using more environmental factors and scenarios than before, aiming to provide a theoretical basis and guidance for the management and utilization of forest resources, the planning of suitable planting areas, and germplasm protection.

1. Introduction

Cunninghamia lanceolata (Lamb.) Hook. belongs to Cupressaceae, and it is popular for its moderate intensity, lightweight, and easy processing characteristics, making it a commercially important tree that is useful for landscaping, etc. [1,2]. The origin of C. lanceolata is in the northeast and surroundingFF areas of north China and Inner Mongolia as early as the late Jurassic period, based on the early fossil records. In light of the mass extinction during the Quaternary Ice Age, only some remnant areas remained, which were gradually excavated, utilized, and cultivated by people. The cultivation history can be traced back to the end of the Warring States period [3]. According to 2010 statistics, the planting area of C. lanceolata in 10 provinces in southern China was approximately 11.26 million hectares [4], and the vegetation types are mainly cultivated vegetation, coniferous forest, shrub, broad-leaved forest, grass, coniferous, and broad-leaved mixed forest, accounting for about 25% of the plantations in the subtropical region of China [5] and providing up to 30% of the harvested logs in the Chinese timber industry [6]. At present, C. lanceolata has become the main timber tree species in China. Moreover, the utilization of C. lanceolata can be more diversified, in-depth, and efficient. For instance, Yao et al. developed and proved the melamine–formaldehyde-modified furfurylation to improve the dimensional stability and mechanical properties of C. lanceolata and to overcome the high costs of traditional reaction methods [7]; Yan and Chang also developed a waterborne thermochromic topcoat film with color-changing microcapsules, which exhibits different colors in different seasons, as well as enhanced stability and aging resistance, consequently increasing the availability of C. lanceolata raw materials [8]. Sun et al. demonstrated that the volatiles of C. lanceolata in the natural state contain a variety of terpenoid, aliphatic, and aromatic compounds [9]. In particular, the terpenoid possesses antibacterial, anti-inflammatory, expectorant, and antitussive effects.
The increase in industrialization, greenhouse gas (GHG) emissions, and other human activities has proportionally increased global warming and its effects. This is visible through extended frost-free seasons, seasonal droughts, heat waves, extreme precipitation, etc. [10,11], resulting in disordered phenology [12], crop productivity reductions [13], increased tree mortality [14,15], loss of species diversity, and even the extinction of cold-tolerant plants [16]. Reducing GHG emissions is a top priority to increase the resilience of natural systems [17]. Therefore, in light of global warming, there is a great need to investigate the environmental factors affecting the geographical distribution and to predict the geographical distribution characteristics of plants. It is of great significance for plant protection, introduction, and development, as well as resource distribution [18]. Species distribution models (SDMs) mainly use existing species distribution and environmental data to estimate the species niches using specific algorithms. In addition, the models reflect the species’ preference for habitat as a probability, which in turn predicts the range of suitable habitats for plant species well [18]. At present, the commonly used models for predicting the potential distribution of species include GARP, MaxEnt, CLIMEX, and BIOCLIM. Among them, MaxEnt is widely used due to its good prediction effect, stability, and simple and rapid operation [19]. Liu et al. analyzed the impact of human activities on the environment and the impact of climate change on the distribution of three Cypripedium species in northeast China using the MaxEnt model combined with ArcGIS technology [20]. Likewise, the MaxEnt model was also used by Garah and Bentouati to predict the potential geographical distribution of Aurasian Aleppo pine (Pinus halepensis Mill.) [21]; Wang et al. compared four niche models: GARP, BIOCLIM, DOMAIN, and MaxEnt., and concluded that the prediction result of MaxEnt was comparably the most accurate [22].
Previous research has mainly reported the impacts of climate factors on suitable habitats of C. lanceolata in China and found that annual average precipitation and minimum temperature of the coldest month were the main factors affecting the distribution of C. lanceolata [23,24]. Given the importance of human activities, soil, and topography on distributions of species populations, this research collected all of relevant information, such as the existing investigation and research data of C. lanceolata, specimen data, as well as digital network information of climate, ecological, and environmental factors, under different carbon emission scenarios to characterize the geographical distributions of C. lanceolata at present and in the future.
The objectives of this study were: (1) to identify the potential distribution of C. lanceolata in China under the current climatic conditions and the leading environmental factors affecting the potential distribution of C. lanceolata; (2) to analyze the response curves of environmental factors and predict the environmental characteristics of suitable habitats of C. lanceolata; and (3) to predict the potential distribution and dynamic change characteristics of C. lanceolata in China under future climate change scenarios. This study will provide a scientific theoretical basis for studying the distribution pattern of C. lanceolata and preventing the decrease in C. lanceolata resources.

2. Materials and Methods

2.1. Collection and Processing of Species Distribution Data and Environmental Factors

Distribution data: The geographical information data of C. lanceolata used in this paper were collected from National Specimen Information Infrastructure (http://www.nsii.org.cn/, accessed on 1 June 2022), National Plant Specimen Resource Center (https://www.cvh.ac.cn/index.php, accessed on 1 June 2022) and Global Biodiversity Information Facility (https://www.gbif.org/, accessed on 3 June 2022). All the specimen data since the 19th century were selected, and duplicate samples, fuzzy records, and artificial cultivation records were screened out and deleted, only keeping specimens of wild communities. The spatial resolution adopted in this paper was 2.5 arc-minutes (about 4.5 km), and the buffer diameter was set at 3 km; when two distribution points were in the same buffer, a single point was reserved [25]. A total of 389 C. lanceolata specimen records (Figure 1) were obtained, which were processed by EXCEL 2016 into CSV. Format files contained only species name, longitude, and latitude to make them convenient for the subsequent construction of the MaxEnt model.
Climate factors: 19 present and future bioclimatic factors were obtained from the World Climate Data (http://www.worldclim.org/, accessed on 15 June 2022). Future climate variables were based on the prediction of global future climate change, which was made in the fifth assessment report published by IPCC. The atmospheric circulation model and the BCC_CSM model developed by China National Climate Center were adopted, in which RCP2.6, RCP4.5, RCP6.0, and RCP8.5 represented various scenario assumptions about future climate under four different carbon emission scenarios, respectively. Additionally, the latter figures indicated that the radiation forcing level will be 2.6 W m−2 to 8.5 W m−2 by 2100. In total, there were 8 combinations of climate scenarios considered by this article: RCP2.6—2050s, RCP2.6—2070s, RCP4.5—2050s, RCP4.5—2070s, RCP6.0—2050s, RCP6.0—2070s, RCP8.5—2050s, and RCP8.5—2070s.
Terrain factor: elevation data were obtained from the Shuttle Radar Topography Mission (SRTM), which could be obtained from the world climate database (http://www.worldclim.org/, accessed on 20 June 2022). Global terrain slope and aspect data were obtained from the World Soil Database (https://www.fao.org/soils-portal/data-hub/soil-maps-and-databases/harmonized-world-soil-database-v12/en/, accessed on 20 June 2022).
Soil factors: 16 soil data points were obtained from the World Soil Database (https://www.fao.org/soils-portal/data-hub/soil-maps-and-databases/harmonized-world-soil-database-v12/en/, accessed on 20 June 2022).
Human activity factor: the human activity intensity data were obtained from the V2 (1995–2004) data set of the Global Human Footprint of Socioeconomic Data and Applications Center (https://sedac.ciesin.columbia.edu/data/set/wildareas-v2-human-footprint-geographic, accessed on 1 July 2022). See Table S1 for details of all environmental factors.

2.2. Preprocessing of Environmental Factor Data

Firstly, all the data were processed according to the vector map of the 1:1,000,000 administrative division of China and converted into ASC file format using “Toolbox/Conversion Tools/From Raster/Raster to ASCII” in ArcGIS. In addition, Chinese soil and the HWSD DATA files were imported into ArcGIS to establish a connection; then, 16 preliminarily selected raster layers of surface soil factors in the MU_GLOBAL layer were extracted and converted into ASC format files. Secondly, further processing of environmental factors was conducted. All environmental variables were extracted using the mask tool in ArcGIS10.6, “toolbox/spatial analyst tools/extraction/extract by mask”, and further resampled with “toolbox/data management tools/raster/raster processing/Resample”. Finally, the environmental variables of data grid image range and pixel size were completely consistent, with a unified resolution of 2.5 min and a geographic coordinate system GCS_WGS_1984. To avoid over-fitting among environmental variables and to ensure the accuracy of the model’s operation, 50 environmental variables and data of C. lanceolata distribution points were imported into MaxEnt 3.4.1 for pre-simulation, and the contribution rate of each environmental variable was preliminarily obtained. The “Multivariate” tool in ArcGIS 10.6 was used to conduct a multiple linear analysis of 50 environmental variables. In addition, when the correlation of two environmental variables was ≥0.8, the environmental variable with a larger contribution rate in the pre-simulation was retained, and then the subsequent secondary simulation was carried out [26].

2.3. Model Building and Accuracy Evaluation

Environmental variables and C. lanceolata distribution point data were imported into MaxEnt 3.4.1; then, “Basic” was set to 25% of the distribution data as a test set to verify the accuracy and 75% of the distribution data was used as a training set to drive the model. Then, “Random seed” was checked, followed by “Subsample” selection; for the repetition type, the operation was repeated 10 times, and output distribution values were set in “logistic” format. Afterwards, “create response curves” was selected to draw curves of how climate factors determine the predicted occurrence probability value, and “do jackknife” was selected to output the contribution rate of each climate factor. Other parameters were set as default, and the file was output as ASCII type.
The contribution rate of each environmental variable to the distribution of C. lanceolata habitats was calculated using the Jackknife method. The receiver operating characteristic curve (ROC curve) was drawn with specificity as the abscissa and sensitivity as the ordinate. The quality of the model was determined by the area under the ROC curve (AUC value). The numerical range of AUC was set at 0~1, and the larger the numerical value, the higher the accuracy of the model. Theoretically, when the AUC value was 0.5~0.6, the model had no prediction ability; at 0.6~0.7, the prediction ability was poor; at 0.7~0.8, the prediction ability was medium; at 0.8~0.9, the prediction ability was good; and the accuracy of the model was extremely high when the AUC value was >0.9 [27]. Furthermore, the prediction results were imported into ArcMap 10.6, and the classification tool was used to divide the layer into four grades using the natural breaks (Jenks) method [23]. Various suitable habitats were obtained based on p-value, as follows: unsuitable habitat (p < 0.07), low suitable habitat (0.07 < p < 0.2), moderate suitable habitat (0.2 < p < 0.5), and high suitable habitat (p > 0.5). Finally, the distribution maps of current and future suitable habitats of C. lanceolata were made.

2.4. Dynamic Changes in the Distribution of Suitable Habitats under Different Climatic Scenarios in the Future and Core Distributional Shifts under Different Climatic Scenarios

According to the calculation result of MaxEnt, the potential distribution map of species was obtained by loading the result and visualizing the suitable habitat grades in ArcGIS 10.6. The change in the area of potential distribution habitats and core distributional shifts of C. lanceolata in the future were analyzed using the SDM toolbox v2.5, written in Python language in ArcGIS 10.6 [28]. The statistics of the area mainly showed three types of changes: expansion, unchanged, and contraction. In this research, this tool was used to investigate the changes in the distribution of C. lanceolata habitats in different scenarios compared with current suitable habitats.
As mentioned above, the SDM toolbox (Tool of ArcGIS based on Python 2.7.14) was also used to treat the suitable habitats of C. lanceolata as a whole and to reduce them to a vector particle. Then, the changing trend of the suitable habitats and the distributional core position of suitable habitats in four scenarios in the present and future were calculated. The geometric core represents the overall spatial position of the suitable habitats of C. lanceolata, and the change reflects the overall spatial migration trend of suitable habitats [21].

3. Results

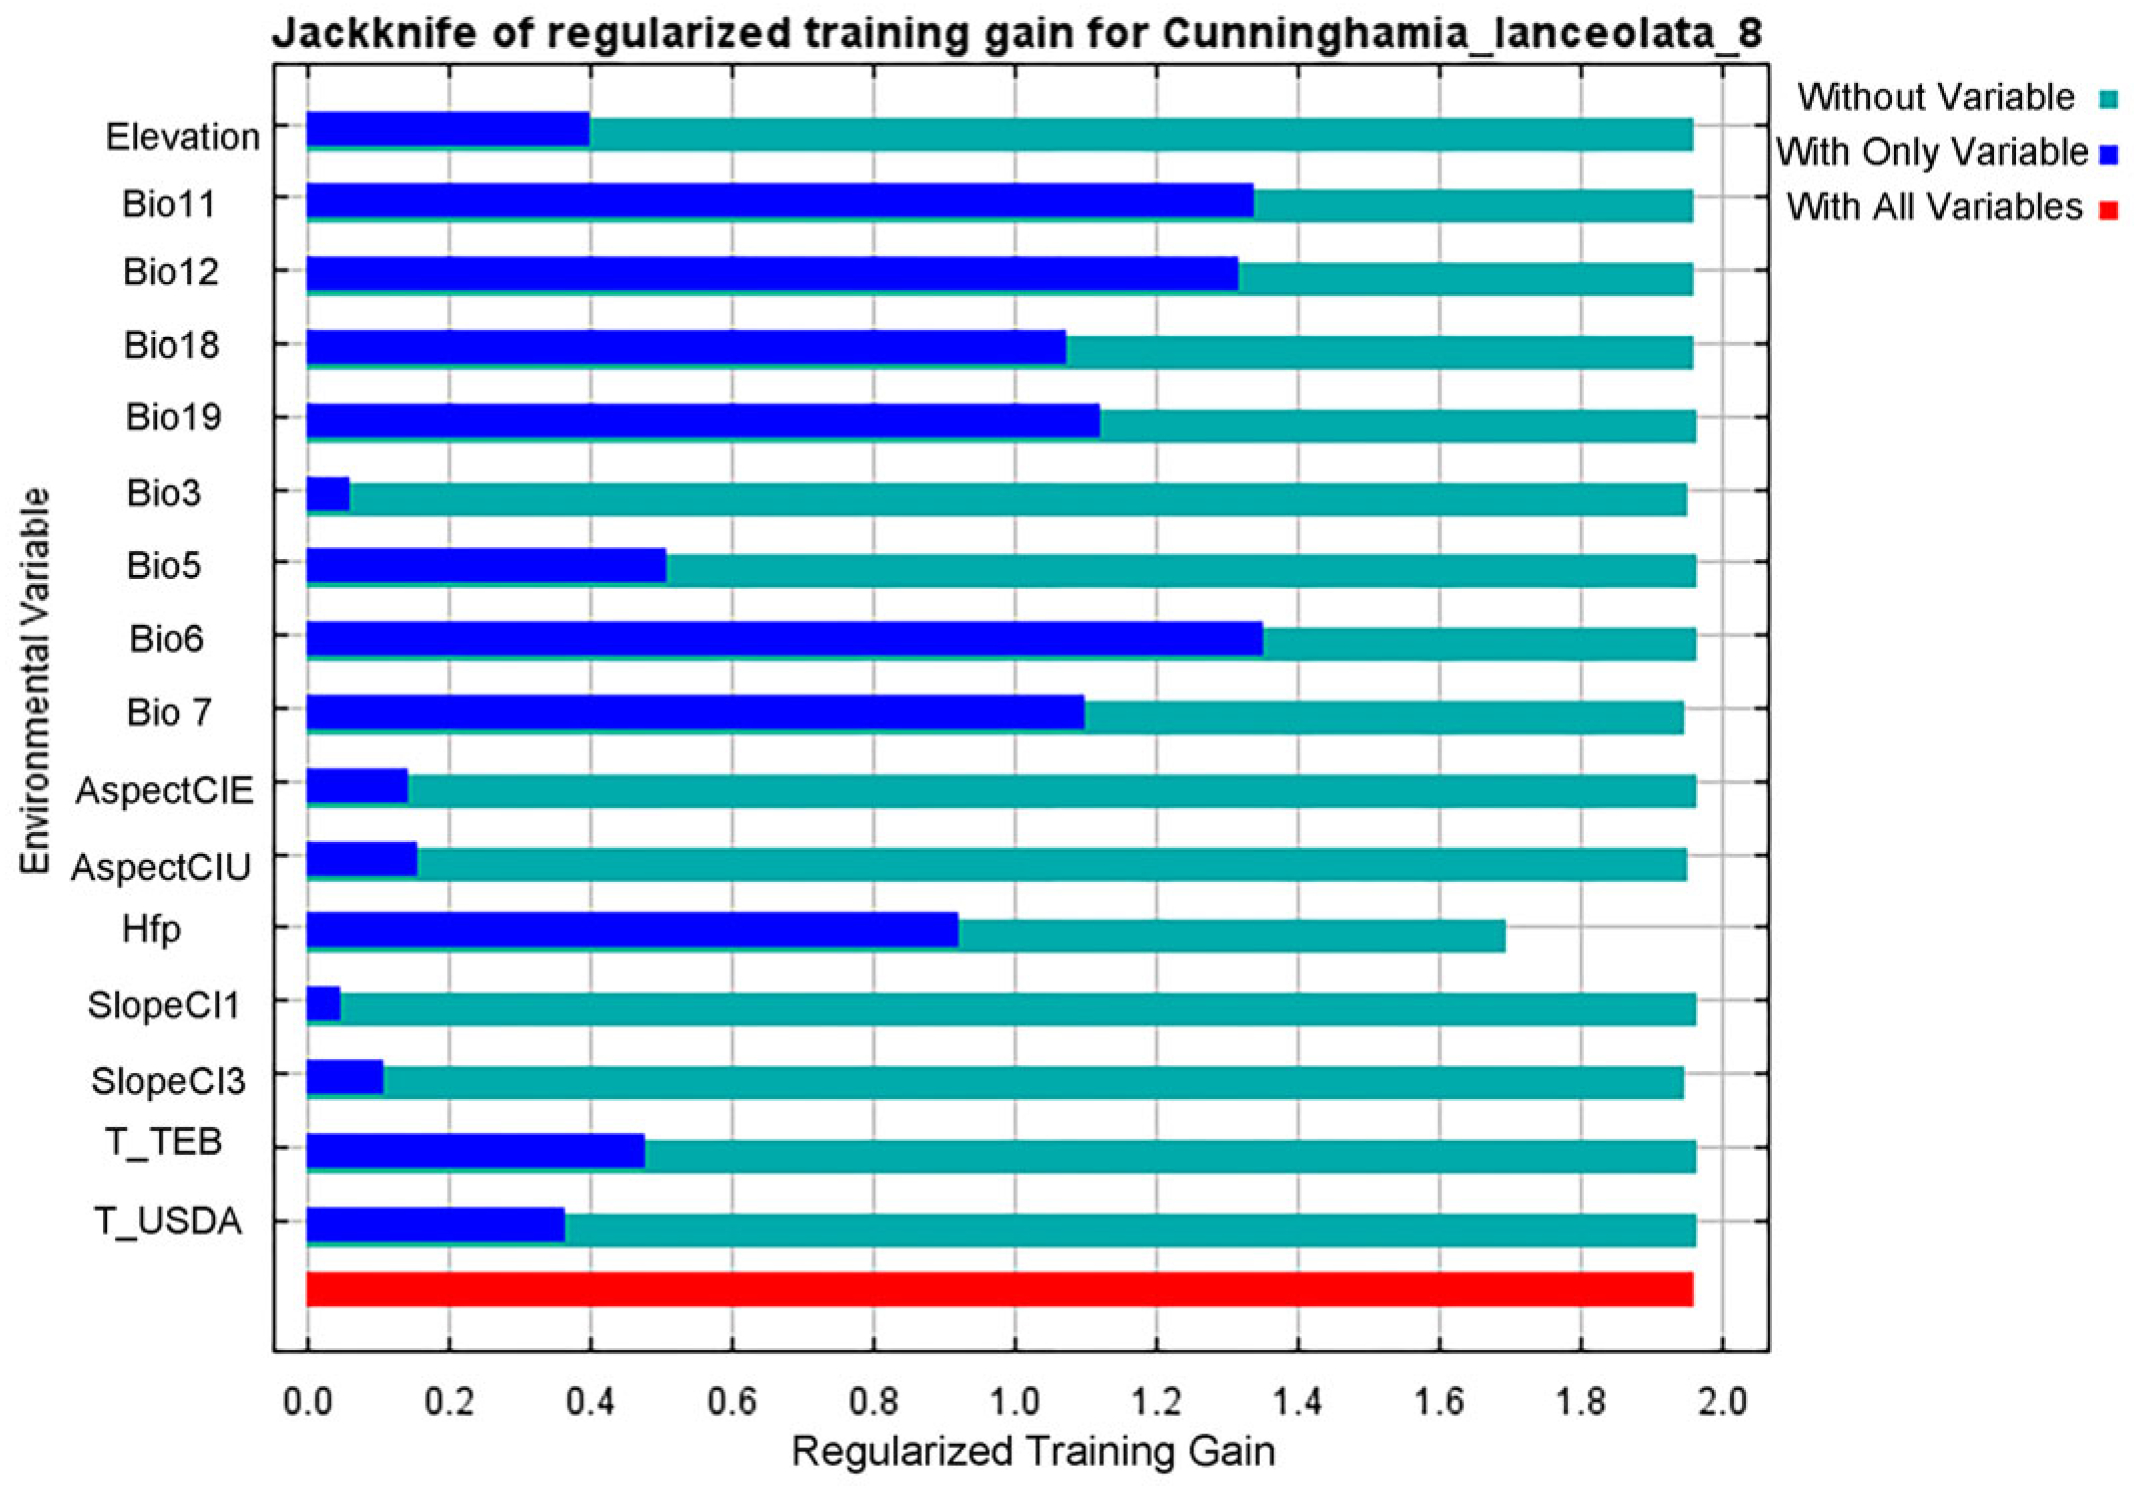
3.1. Accuracy Test of MaxEnt Model and the Leading Environmental Factors Affecting the Distribution of C. lanceolata

The AUC value of the area under the ROC curve was used to test the accuracy of the model. After 10 calculations, the mean test AUC was 0.947 (Figure 2), showing that the model could accurately predict suitable habitats.
According to the contribution percentage in the first simulation and the correlation among factors (Figure 3), 16 environmental factors were selected, including 8 climatic factors, 5 topographic factors, 2 soil factors, and human activities (Hfp). Then, the 16 factors were simulated for the second time, and the leading environmental variable factors that limited the potential geographical distribution of C. lanceolata in China were selected based on the percent contribution, permutation importance, and knife-cutting test. The percent contribution was used to indicate the contribution degree of the variable to the model. The permutation importance indicated the dependence of the model on this variable. The knife-cutting method was used to analyze the relationship between different environmental factors and the distribution of suitable habitats for C. lanceolata. Criteria: The blue band represents “With only variable”, and the longer the band, the higher the score, indicating that this variable has a strong predictive ability for species distribution. The cyan band represents the training score of “Without variable”, that is, the sum of the contributions of the remaining variables except for this variable. If the score of “Without variable” is low, it means that this variable contains some unique information, which is also important for species distribution. The red stripe represents the cumulative contribution rate of all environmental variables to the established model.
According to the contribution percent (Figure S1), the environmental factors that reached more than 10% were Bio12 (41.3%), Hfp (20%), Bio19 (13.1%), and Bio6 (11.1%). The cumulative contribution rate of these four factors reached 85.5%, and they were the leading variables affecting the distribution of C. lanceolata.
According to the permutation importance (Figure S2), the leading variables reaching more than 5% were Bio12 (40.1%), Hfp (19.2%), Bio7 (17.4%), Bio6 (6.5%), and Elevation (5.3%).
According to the analysis of the normalized training gain obtained by the knife-cutting test, under the condition of “With only variable”, the scores of Bio3, SlopeCl1, SlopeCl3, AspectCIU, and AspectCIE were lower than 0.2, suggesting little influence on the distribution of C. lanceolata. Interestingly, most terrain factors had little influence on the prediction results. However, the scores of Bio11, Bio12, and Bio6 were over 1.2, which showed that precipitation and temperature were the leading environmental factors. In addition, the “Without variable” score of human activities was low, indicating the importance of this variable to the geographical distribution of C. lanceolata, which should not be ignored (Figure 4). Therefore, Bio11, Bio12, Bio6, and human activity factors (Hfp) were determined to be the leading variables for the knife-cutting test.
Combined with the percent contribution, permutation importance, and knife-cutting test, Bio12, Hfp, Bio6, Bio11, Bio19, Bio7, and Elevation were eventually selected as the leading environmental factors.
The above content is the importance test of the influence of each factor on the distribution of C. lanceolata habitats at present, the results of eight future scenarios were roughly the same as those of current times. Bio12, Hfp, Bio6, and Bio19 still accounted for more than 80% of the contribution percent; Bio12, Hfp, and Bio7 still accounted for more than 80% of the permutation importance; and the results of knife-cutting were not different. (For details, see Table S2).
To further clarify the relationships between the distribution habitats of C. lanceolata and leading environmental factors, the response curves of the single environmental factor (Bio12, Hfp, Bio6, Bio11, Bio19, Bio7, and Elevation) were obtained based on the MaxEnt model (Figure 5). These curves show how the predicted probability of species distribution changed with each environmental variable.
As shown in Figure 5, the presence probability of C. lanceolata fluctuated greatly with the change in environmental variables. The presence probability response curve of C. lanceolata to seven leading environmental factors was divided by 0.5 as the dividing line, and the range with a presence probability greater than 0.5 was considered as the suitable environmental interval conducive for the growth of C. lanceolata, as shown in Figure 5. The thresholds for the leading environmental parameters were obtained at a presence probability of >0.5. Regarding elevation, its influence on the presence probability of C. lanceolata was stable and remained unchanged below 0 m. However, the increase in the presence probability of C. lanceolata was proportionally linked to the increase in elevation. In detail, the presence probability started to rapidly increase at −100 m, peaked at 100 m, and then plummeted. Regarding the minimum temperature of the coldest month (Bio6), when the temperature was below −10 °C, it was unfavorable for the growth of C. lanceolata. As the temperature gradually increased, the presence probability also rapidly increased and peaked when the temperature reached about 12 °C, and then decreased rapidly. The influence of the temperature annual range (Bio7) on the presence probability was stable at first, then increased when the temperature range rose from 13 °C, and reached its peak when the range was 16 °C. The presence probability was slightly decreased after that, then slightly increased when the temperature range increased to 22 °C, and finally dropped sharply.
As for the mean temperature of coldest quarter (Bio11), C. lanceolata showed no growth below −5 °C, suggesting that this is not suitable for its growth. In addition, its presence probability increased with the increase in the mean temperature of the coldest quarter until the temperature reached about 14 °C, and then the presence probability of C. lanceolata reached its peak and later had a steep decrease. Concerning the annual precipitation (Bio12), the presence probability gradually increased with its increase from 500 mm, then stabilized at 1100 mm~1800 mm and increased sharply after that. When the precipitation reached about 3250 mm, the presence probability reached a maximum value and then decreased, but remained above 0.5. Moreover, as for precipitation of coldest quarter (Bio19), the presence probability sharply increased when Bio19 was from 10 mm to 50 mm, and increased constantly later, peaking at about 0.9 when Bio19 stabilized at 450 mm. The presence probability of C. lanceolata increased layer by layer with the increase in the intensity of human activities. Generally speaking, the presence probability of C. lanceolata increased rapidly when human activity factors were between 10 and 50. After 50, the presence probability rose slowly and dropped to 70, then rose rapidly until about 91, and after that, the probability reached a maximum value. Wholly, the elevation ranged from 0 to 600 m, the minimum temperature of the coldest month (Bio6) ranged from 1 to 12 °C, the temperature annual range (Bio7) ranged from 14 to 30 °C, the mean temperature of coldest quarter (Bio11) ranged from 6 to 15 °C, the annual precipitation (Bio12) ranged from 1100 to 4700 mm, the precipitation of the coldest quarter (Bio19) ranged from 120 to 510 mm, and the human activity index ranged from 40 to 105 (Table 1).

3.2. Potential Geographical Distribution of Suitable Habitats in Different Periods

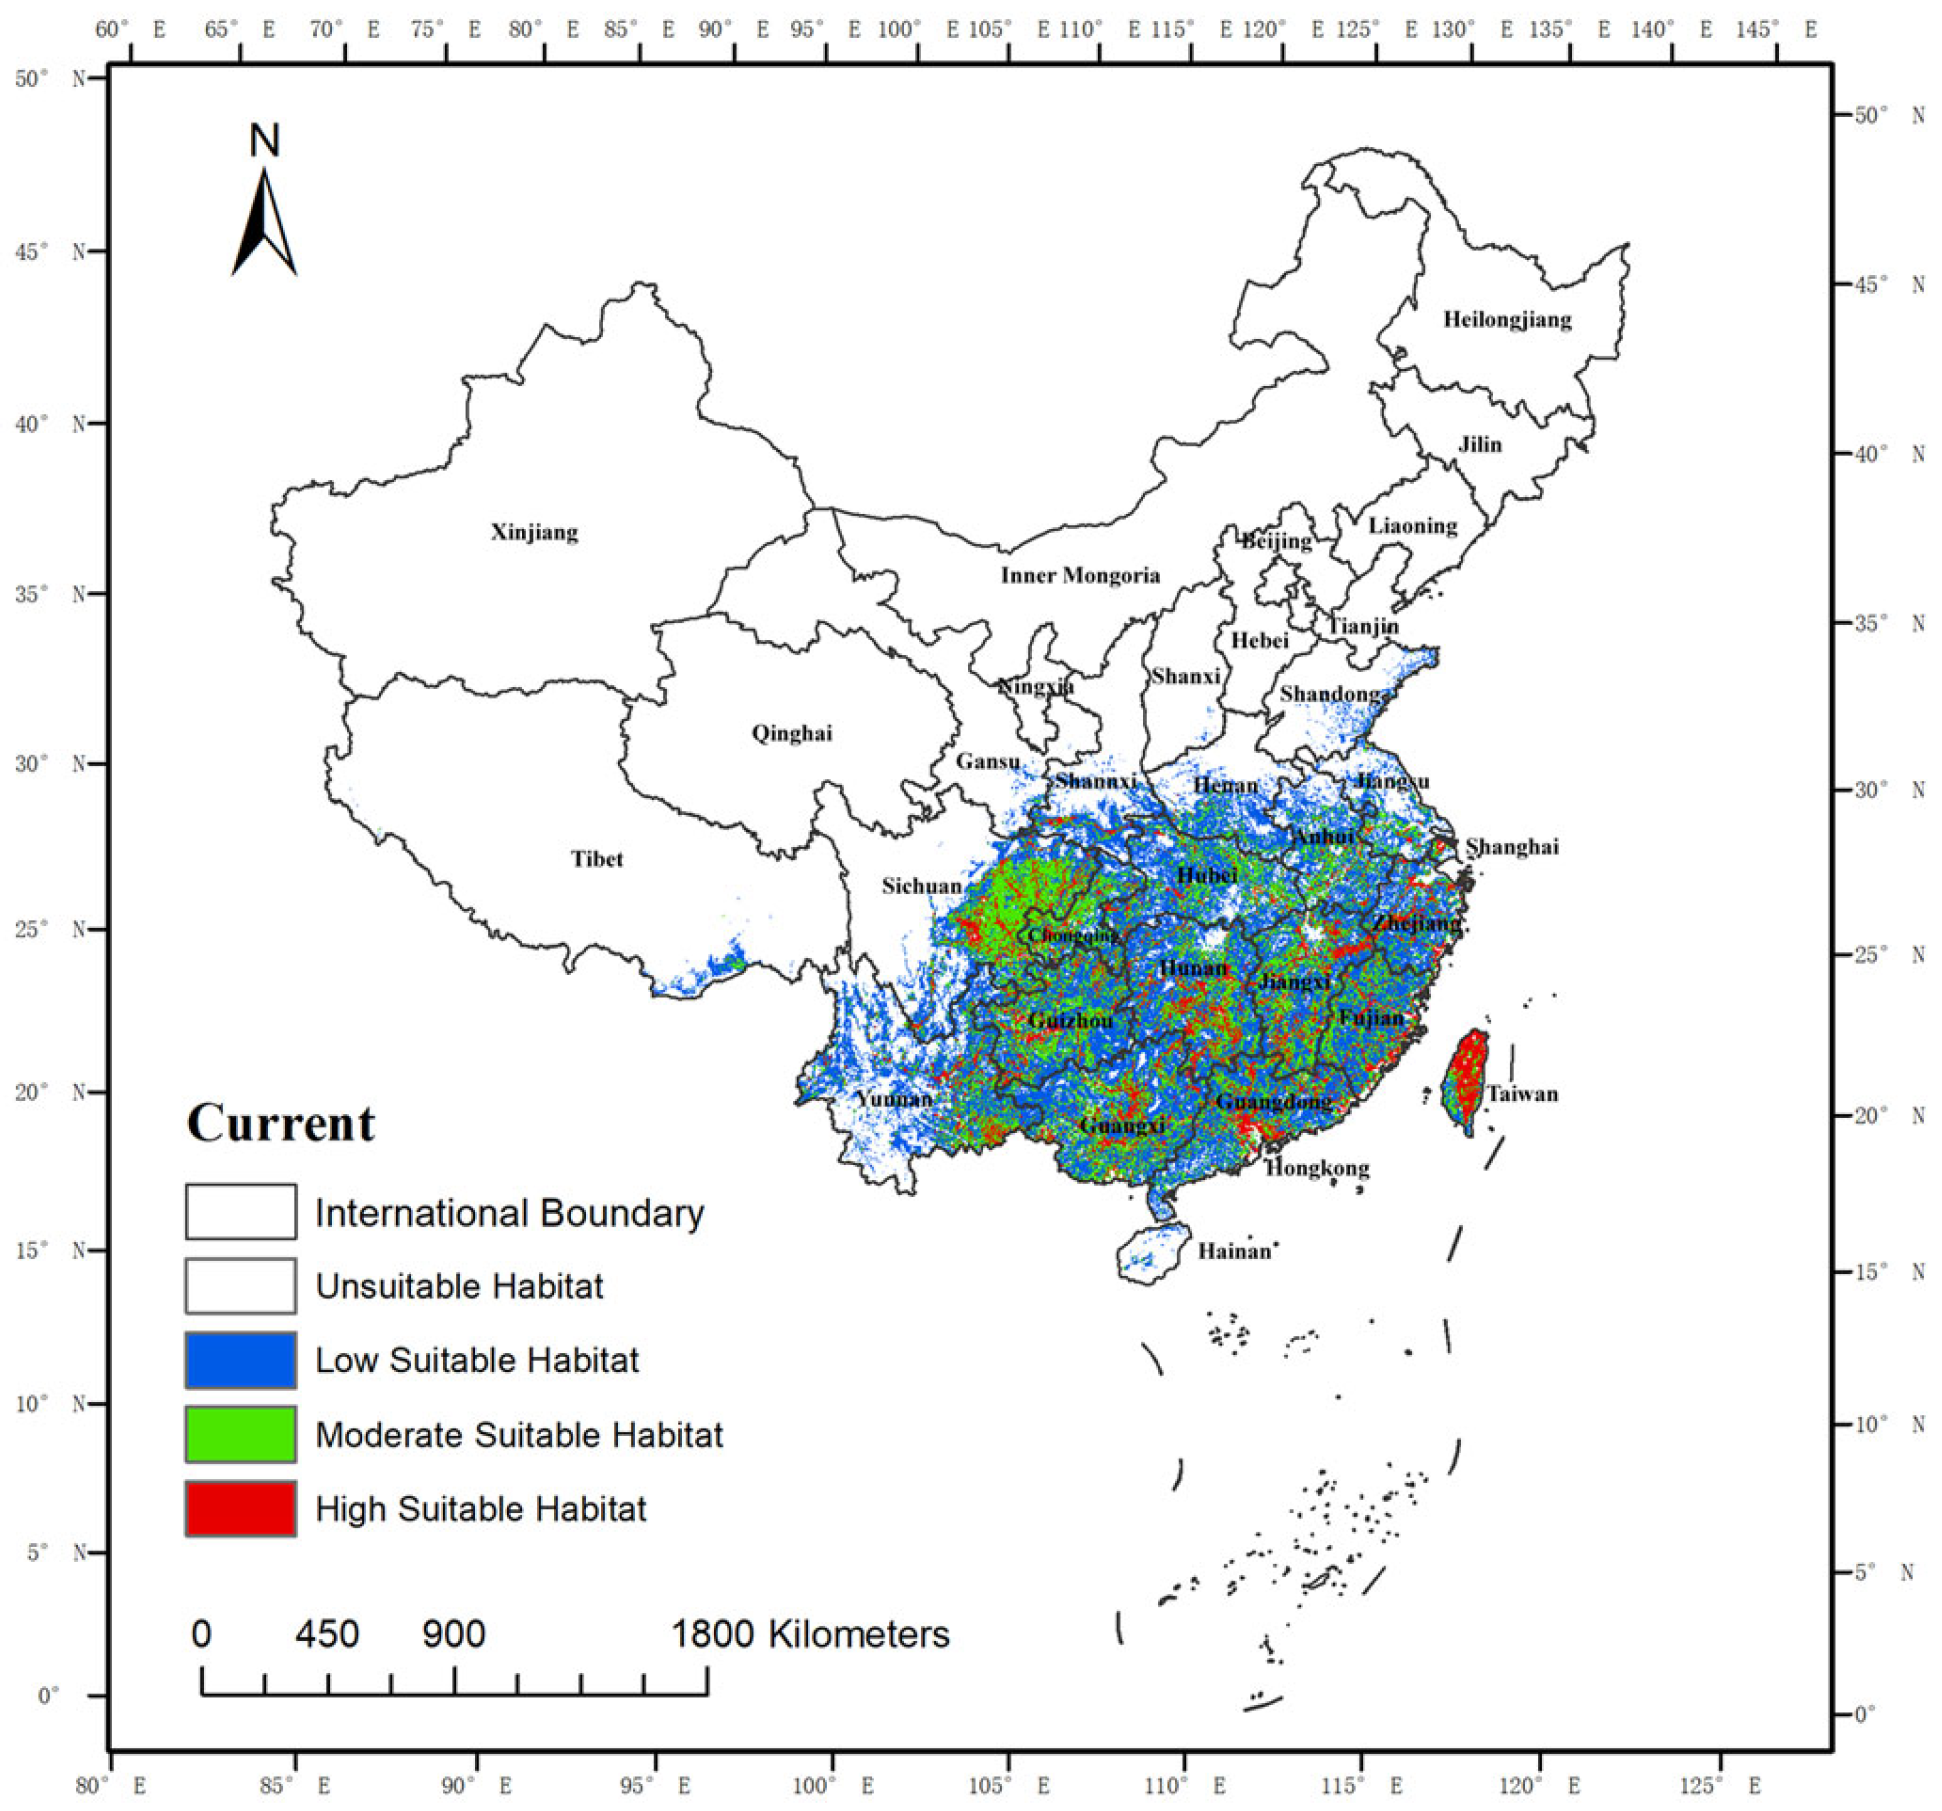
3.2.1. Current Geographical Distribution of Suitable Habitats

According to the division of natural breaks (Jenks) method, the currently suitable habitats of C. lanceolata were divided into four types: unsuitable habitat, low suitable habitat, moderate suitable habitat, and high suitable habitat.
As can be seen from Figure 6, suitable habitats were mainly distributed in the south of the Yangtze River, with the main distribution range between 97.59°~121.24° E and 20.303°~34.575° N. According to the area calculation, the total geographical distribution habitat area of C. lanceolata was 193.78 × 10⁴ km2, accounting for 20.19% of China’s land area, among which the high suitable habitat accounted for 2.62%, the moderate suitable habitat accounted for 6.10%, and the low suitable habitat accounted for 11.47%.
To explore the influence of human activities (high percent contribution) on the distribution of C. lanceolata, human activities were removed and the simulation was conducted again. It was found that the distribution of suitable habitats of C. lanceolata was concentrated and fragmented rather than scattered, characterized by an increase in the moderate and high suitable habitats (Figure 7).
Furthermore, the distribution area range did not change much, except in the expansion of Hainan Island. The distribution of suitable habitats without interference of human activities was upgraded to a low suitable habitat in the original unsuitable habitat, the low suitable habitat was upgraded to a moderate suitable habitat, and the moderate suitable habitat was upgraded to a high suitable habitat. In the area calculations without human activity factors, the total geographical distribution area of C. lanceolata was 218.65 × 10⁴ km2, accounting for 22.78% of China’s land area and being 2.60% higher than the original suitable habitat area. The high suitable habitat accounted for 4.93%, the moderate suitable area accounted for 8.67%, and the low suitable area accounted for 9.18% of the total suitable habitat area. Without the impact of human activities, high suitable habitats were mainly distributed in eastern Sichuan, western Chongqing, Guizhou, Taiwan, Guangxi, southern Guangdong, Hunan, and Jiangxi. Moderate suitable habitat was widely distributed in the south of the Yangtze River, inlaid with the high suitable habitat. Generally, subtropical monsoon climate areas and tropical monsoon climate areas in the south of the Yangtze River were more suitable for the growth of C. lanceolata. The precipitation conditions were relatively abundant and the temperature conditions were relatively appropriate. Not considering the influence of human activities, these two kinds of areas were mainly high and moderate suitable habitats for C. lanceolata.
Considering the influence of human activities, the distribution of C. lanceolata was fragmented, and we speculated that human activities interrupted the distribution of the original suitable habitats and led to its eastward and southward reduction. Hong et al. also showed that the natural distribution habitats of C. lanceolata were continuous at first, and then discontinuous later due to the influence of climate and human factors [29]. The influence of human activities on the distribution of other species was similar [20]. In terms of the total area, the suitable habitats area was reduced by 24.87 × 10⁴ km2 due to human activities, which indicated that there was a negative correlation between human activities and the distribution of C. lanceolata.

3.2.2. Potential Geographical Distribution of Suitable Habitats in the Future

In this paper, four RCP scenarios and two future periods were selected. Compared with the current times, the total suitable habitat area of C. lanceolata increased and migrated by different degrees in each period (Figure S3). Areas of potential distribution under different climate scenarios of C. lanceolata are shown in Table S3.
In the 2050s, the proportions of the total suitable habitat area of C. lanceolata in China’s land area under the RCP2.6, RCP4.5, RCP6.0, and RCP8.5 scenarios were predicted to be 21.49%, 21.60%, 22.34%, and 21.70%, respectively, which are higher than that in current times (20.18%), with the area under RCP6.0 being the largest. In contrast to the potential total suitable habitats in the 2050s (except for RCP2.6), the areas under other scenarios were greatly reduced. By the 2070s, their area proportions are predicted to account for 21.80%, 20.59%, 21.73%, and 20.80%, respectively; of these four scenarios, the area under RCP2.6 will be the largest.
In addition, the area of habitat under RCP8.5 will be the largest by the 2050s, and by the 2070s, the largest will be RCP2.6, not accounting for the influence of human activities. The proportions of the total suitable habitat area of C. lanceolata in China’s land area under the RCP2.6, RCP4.5, RCP6.0, and RCP8.5 scenarios will be 23.35%, 22.43%, 23.30%, and 23.63% in the 2050s, respectively. By the 2070s, the proportion of habitat area under four scenarios will be 23.82%, 23.56%, 23.42%, and 22.57%, respectively. This result once again shows that human activities have a considerable impact on the potential distribution of C. lanceolata, so this factor is additionally considered and analyzed below.
Considering different GHG emissions in the same period, the 2050s, the areas of low suitable habitat under different GHG emission scenarios were RCP8.5 > RCP6.0 > RCP4.5 > RCP2.6. In the moderate suitable habitats, the areas under different scenarios were RCP6.0 > RCP2.6 > RCP8.5 > RCP4.5, while the areas for high suitable habitats were RCP6.0 > RCP4.5 > RCP2.6 > RCP8.5. On the whole, RCP6.0 was the most ideal based on the area of each suitable habitat under different scenarios. Under this scenario, not only was total suitable habitat area was the largest, but the middle and high suitable habitat areas were also the largest. In the 2070s, the area of low suitable habitat of C. lanceolata under different GHG emission scenarios was ordered as RCP2.6 > RCP6.0 > RCP4.5 > RCP8.5. The area condition of the moderate suitable habitat under different GHG emission scenarios was RCP2.6 > RCP6.0 > RCP8.5 > RCP4.5. Finally, the high suitable habitat areas were ordered as RCP8.5 > RCP2.6 > RCP6.0 > RCP4.5. Noteworthily, the RCP2.6 scenario was the highest in this period based on the distribution areas of moderate and high suitable habitats.
Considering different periods and the same GHG emission scenarios under the four carbon emission scenarios, the low suitable habitat of C. lanceolata in the 2070s was reduced compared with the 2050s, and the largest contraction was 12.08 × 10⁴ km2 under RCP8.5, while the smallest was 0.34 × 10⁴ km2 under RCP2.6. Likewise, in the moderate suitable habitat, the area of the 2070s under RCP2.6 climate scenarios increased greatly compared with that of the 2050s. In addition, the situation in high suitable habitat was similar to that of the moderate suitable habitat. It should be noted that, under the RCP6.0 scenario, the area cover fluctuated greatly. Wholly, the general trend of suitable habitats was that the total habitat area increased continuously and reached the highest value of 209.27 × 10⁴ km2 under RCP2.6, but under RCP4.5, RCP6.0, and RCP8.5, it first increased in the 2050s and then decreased in the 2070s.

3.3. Dynamic Changes of Distribution Habitats under Different Climatic Scenarios in the Future

The distribution of C. lanceolata habitats in different scenarios in the future two periods is shown in Figure 8. Under RCP2.6—2050s, both expansion and contraction were predicted to be obvious. The expansion was mainly concentrated in Hainan province and the northern regions like Shaanxi, Henan, the west of Yunnan, and Sichuan. The reduction in the middle and lower reaches of the Yangtze River affected the performance of the overall suitable habitats, but in the 2070s, the contraction area was obviously reduced, and the expansion area was slightly increased. At this time, the total suitable area reached the maximum among all scenarios in the 2070s. Notably, the southern Tibet valley and the Ali area of the Tibet Autonomous Region were also expanded; other studies have shown that these two places may have acted as shelter escapes for plants in the ice age [30,31].
RCP4.5—2050s was similar to RCP2.6—2050s, but by the 2070s, the contraction was predicted to be 13.37 × 10⁴ km2 and to reach the maximum. However, the expansion was lower, and it was the least suitable area under this scenario of the 2070s. Compared to the 2050s, the areas of the three kinds of suitable habitats were all reduced, especially the low suitable habitat. The contraction area was mainly concentrated in Yunnan and the middle and lower reaches of the Yangtze River.
Under RCP6.0, the situations in the 2050s and that in the 2070s had few differences. In the 2050s, the maximum expansion of the suitable area reached 27.33 × 10⁴ km2, especially in the west and north, and reduction was at its minimum, being 4.15 × 10⁴ km2. The suitable habitat condition in the 2070s was slightly worse than that in the 2050s. Compared with the 2050s, the areas of the three suitable habitats decreased, especially the high suitable habitat.
RCP8.5—2050s had the most obvious change in Yunnan, in contrast to RCP6.0—2050s, which can be observed in Figure 8. Most of the original extended regions disappeared. By the 2070s, the expansion was the least, especially in the western region. Expanded areas (mainly low suitable habitat) retracted around the range of current suitable habitats such as northeast Sichuan and southwest Shaanxi. The contraction of suitable areas was mainly reflected in Yunnan, Hunan, Hubei, Zhejiang, Anhui, Henan, and the coastal areas of Shandong and Jiangsu. All the areas of expansion and contraction under different scenarios are shown in Table 2.

3.4. The Core Distributional Shifts under Different Climatic Scenarios

The centroid of the current habitats of C. lanceolata was located in Xinhua County, Loudi City, Hunan Province, China (27.71° N, 111.03° E). Under RCP2.6—2050s, the distribution centroid shifted to Xinxupu County, Huaihua City, Hunan Province (27.81° N, 110.56° E). Under RCP2.6—2070s and RCP4.5—2050s, the distribution centroids were the same as those of RCP2.6—2050s, while the coordinates were slightly different (27.82° N, 110.63° E and 27.84° N, 110.62° E). The centroid of RCP4.5—2070s shifted to Anhua County, Yiyang City, Hubei Province (28.03° N, 110.88° E). And that of RCP6.0—2050s was XinXupu County (27.81° N, 110.39° E), then shifted to Zhongfang County, Huaihua City, Hunan Province (27.64° N, 110.27° E) under RCP6.0—2070s. The distribution centroids under RCP8.5—2050s and RCP8.5—2070s were XinXupu County, Huaihua City, Hunan Province (27.80° N, 110.60° E) and Xinhua County, Loudi City, Hunan Province (27.81° N, 110.80° E), respectively.
In the 2050s, the centroid under RCP2.6 migrated 47.83 km to the northwest, 42.99 km to the northwest under RCP4.5, 64.49 km to the northwest under RCP6.0, and 43.59 km to the northwest under RCP8.5. In the 2070s, the centroid of RCP2.6 migrated 6.69 km northeast compared with that of 2050s, that of RCP4.5 moved 32.26 km northeast, that of RCP8.5 moved 20.22 km northeast and returned to the centroid in current times, that of RCP6.0 moved in a different direction from the others, the centroid moved 19.97 km southwest. However, the centroid under RCP6.0 kept going west and had a trend to the south by the 2070s, while the centroids under other scenarios all went northwest first and then northeast (Figure 9).

4. Discussion

4.1. Changes in Suitable Habitats of C. lanceolata in Different Periods

Based on the MaxEnt model, this study predicted the potential suitable habitats of C. lanceolata in China, using climatic factors, human activity, soil factors, and terrain factors. The results showed that the current potential suitable habitats of C. lanceolata are mainly concentrated in the areas south of Qinling-Huai River, such as the Sichuan Basin and its surrounding areas, Yunnan Plateau, the middle and lower reaches of the Yangtze River and South China. The contemporary predicted results were consistent with the actual distribution of C. lanceolata in China [32], and the mean AUC value of the ROC curve was 0.947, which indicated that the prediction result was credible. By simulating and predicting the distribution range of C. lanceolata in different periods, the future change trend was investigated.
This paper studied the distribution of C. lanceolata habitats in current and future times, and its historical origin was also valued by many scholars. According to the research [3], the origin time of C. lanceolata was in the late Jurassic, and its origin centers were in the northeast of China, north China and Inner Mongolia, and the southeast of Siberia, Russia. However, due to the harsh climate during the Quaternary glacial period, the cold climate zone migrated to the middle and low latitudes, which led to the widespread development of ice sheets or glaciers at high latitudes and on mountains and made C. lanceolata migrate to the south; most origins also became extinct one after another. According to the fossil record of sporopollenin, C. lanceolata was mainly distributed in Lantian, Shaanxi Province; Yuanmou, Yunnan Province; Jiujiang and Nanchang, Jiangxi Province; coastal areas of Jiangsu and Zhejiang Provinces; Lixian and Changde, Hunan Province; Taihu Lake, Jiangsu Province; Sanshui, Zhongshan, and Dongguan, Guangdong Province; Hui’an Fujian Province; the Mianning and Anning River basins in Sichuan Province; Anqing, Anhui Province; Hangzhou Bay, Yuyao Plain, and Ningfeng Plain in Zhejiang Province, etc. [33,34,35,36,37]. Before current times, it formed its distribution south of the Qinling Mountains-Huaihe River, and these areas were also considered as the remaining land of C. lanceolata. Additionally, it was cultivated artificially as early as the pre-Qin period and the Spring and Autumn Warring States period, and was introduced to the Yellow River Basin in the Qin and Han Dynasties. Historically, its cultivated areas were mainly concentrated in the middle and lower reaches of the Yangtze River, Nanling Mountain, Wuyi Mountain, Xuefeng Mountain, and Sichuan Basin. In addition, there are also records of its introduction in Taiwan Province [38,39,40]. Furthermore, SSR and cpDNA molecular markers have been used to prove that Cunninghamia konishii Hayata was introduced and cultivated artificially across the Taiwan Strait [41]. Although, currently, the distribution of C. lanceolata habitats is mostly a result of years of cultivation, Wu regarded the current distribution areas as natural habitats, and these areas are worth studying [42].
With the continuous increase in GHG emissions in the future, the greenhouse effect will gradually intensify, leading to different changes in climate such as precipitation and temperature, etc., and the distribution of suitable habitats of C. lanceolata will change in terms of area and spatial pattern correspondingly. The future trend predicted in this research is that the expansion in the northern region will be more stable than that in the western region, and the central and eastern habitats will shrink to varying degrees; moreover, northern Yunnan will contract more. In several provinces, the suitable habitats will expand to slightly higher altitude areas. This expansion was noticed in previous studies, and it was concluded that to adapt to climate change, the distribution of border species will have to shift to higher-altitude areas gradually [43].
When the scenario was different and the period was the same, the area of total suitable habitats in the 2050s first increased and then decreased with the augmentation of GHGs, and reached its maximum value under the RCP6.0 scenario. The area change in the total suitable habitats in the 2070s fluctuated in a wave shape, reaching its maximum value under the RCP2.6 scenario. The expansion areas increased with the increase in the radiation forcing level in the 2050s, showing a positive correlation. In the 2070s, there was a downward trend, with the radiation forcing level rising, while the contraction areas showed the opposite. However, when the scenario was the same but in different periods, the area change in the total suitable habitats with time showed that it increased at first and then decreased. Except for the RCP2.6 scenario, which showed an increasing trend all the time, the expanded areas increased and the contraction areas decreased. Under the RCP2.6 scenario, it was predicted that the change of energy utilization types in the global scope would reduce the greenhouse effect significantly, and this scenario would have the largest increase in crop areas in the world; it is almost a suitable environment for all existing plants. Compared with RCP4.5, RCP6.0 had a lower GHG concentration and radiation intensity before the 2050s, which may be the reason why RCP6.0 was more suitable for the 2050s [44]. To sum up, RCP2.6 and RCP6.0 were more suitable for the future growth of C. lanceolata.
Under different scenarios in the future, the movement of habitat centroids was also slightly different. The centroid of RCP6.0 kept shifting to the west and also to the south by the 2070s. The centroids of other scenarios, especially RCP4.5, went northwest first and then northeast. In most cases, with the increase in the GHG concentration and the passage of time, the living environment deteriorated, and the centroids of C. lanceolata habitats migrated to high latitudes. Similarly, Shugart et al. found that with global warming, plants migrated northward at the end of the last glacier [45]. According to the latest research by Parmesan and Yohe [46], more than 1700 plant species migrated to the polar regions at an average speed of 6.1 m/10 a.

4.2. Ecological Characteristics of the Distribution of C. lanceolata Habitats

The results of this study showed that, among the 16 selected environmental factors, temperature, precipitation, human activities, and elevation had certain influences on the geographical distribution of C. lanceolata. According to the three test methods, precipitation was the most important factor, followed by human activities and temperature. On the whole, the influence of precipitation was stronger than that of temperature. The leading environmental factors affecting the growth of C. lanceolata were annual precipitation (Bio12), human activities (Hfp), minimum temperature of the coldest month (Bio6), mean temperature of the coldest quarter (Bio11), precipitation of the coldest quarter (Bio19), annual temperature range (Bio7) and elevation. The suitable ranges were 1100 mm~4700 mm (Bio12), 40~105 (Hfp), 1~12 °C (Bio6), 6~15 °C (Bio11), 120 mm~510 mm (Bio19), 14~30 °C (Bio7), and 0~600 m (elevation), respectively. Therefore, we concluded that a suitable environment for the growth of C. lanceolata should be warm, humid, rich in precipitation, and with a relatively flat terrain. As mentioned above, there was a negative correlation between human activities and the area of the distribution habitat of C. lanceolata, that is, the greater the intensity of human activities, the less suitable it was for C. lanceolata. According to the area calculation, the total geographical distribution habitat area of C. lanceolata was 193.78 × 10⁴ km2, accounting for 20.19% of China’s land area. Without the influence of human activities, the proportion was about 22.78%; moreover, moderate and high suitable habitats increased significantly and the distribution of whole habitats was more continuous. Chen et al. pointed out that the high intensity of human activities led to the formation of acid rain and a decline in soil fertility, and large-scale logging also affected the nitrogen cycle in the ecological cycle, which is not conducive for plant growth [47]. The most suitable habitats of existing C. lanceolata were the subtropical monsoon climate, with ample rainfall and proper temperature conditions for growth, and mainly cultivated vegetation, coniferous forest, and shrubs. The high suitable habitat was predicted to be concentrated in the north and east of Taiwan Province; Taiwan’s population is mainly concentrated in the west [48]. There are mountains in the east of the middle part of the land, which are less affected by human activities. This area is a subtropical monsoon climate, with high temperatures and much rain in summer and mild temperatures and little rain in winter. In addition, the undulating terrain weakens the winter wind, so it is more suitable for C. lanceolata. Another province worth noting is Sichuan, compared with the eastern coastal areas such as Jiangsu; the annual precipitation (Bio12), minimum temperature of the coldest month (Bio6), mean temperature of the coldest quarter (Bio11), and annual temperature range (Bio7), especially the first three environmental factors, were more suitable for the growth habits of C. lanceolata. Our prediction showed that with the increase in GHG emission concentration in the future, the moderate suitable habitat in the Sichuan Basin would be partially upgraded to a high suitable habitat and form a high suitable habitat to surround the low suitable habitat, which may be due to the following reasons: with the intensification of the greenhouse effect, climate change in Sichuan Basin is mainly expressed by an increase in temperature, rainfall (mainly concentrated in June-September), and even extreme rainfall. Additionally, the soil in the basin is loamy clay with a rich nitrogen content, and the surface and groundwater are abundant, which is more suitable for the growth of C. lanceolata [49,50]. The last area noteworthy is Hainan Province. Hainan was not found to be suitable for C. lanceolata growth in the current prediction due to the fact that mean temperature of the coldest quarter (Bio11) was more than 17 °C, the precipitation in the coldest quarter (Bio19) was less than 94 mm, and the minimum temperature of the coldest month (Bio6) was more than 13 °C. However, the greenhouse effect will advance the spring phenology of tropical plants, prolong the growing season of plants, advance the exhibition period of leaves, advance the initial flowering period, and delay the senescence of leaves, which may lead to the emergence of a low suitable habitat in this area [51].
Other factors, such as soil, slope, and aspect, had little influence on the distribution of C. lanceolata, among which AspectCIU and SlopeCL1-4 had slightly greater contributions, representing the position with a slope of 2%~10%. These two coefficients indicated that C. lanceolata is suitable for growing in an environment with a gentle slope, such as a flat plain, central basin, piedmont, piedmont inclined plain, valley bottom, platform, foothills, basin surroundings, hills, etc. The steeper the slope, the more serious the water and soil loss and the poorer soil water and fertilizer conservation became [52]. Among the soil factors, the soil texture (T_USDA_TEX_ CLASS) contributed a little to C. lanceolata, which mainly describes the relative proportion of mineral particles with different sizes in the soil. According to the response curve, the soil texture suitable for C. lanceolata growth was silty clay, clay, silty clay loam, clay loam, silt, and silty loam. Research has shown that loose soil without excessive rock obstacles is more suitable for plant growth [1].
Although C. lanceolata has been widely planted in recent years, many problems need to be solved urgently. Firstly, the utilization efficiency is low. Due to the prosperity of new building materials such as metal and plastic, the applicable scope of C. lanceolata wood has been greatly reduced, and the unsalable stock is overstocked. It is urgent to use C. lanceolata with high added value. Secondly, there are some problems, such as unreasonable continuous planting. Tian et al. found that continuous rotation will lead to a decline in the C. lanceolata forest yield, and properly prolonging the rotation period of C. lanceolata forest in the same place will be beneficial for maintaining high-quality wood [53]. While efficiently utilizing and rationally planting C. lanceolata, we should pay attention to the impact of global warming and try to take protective measures in areas with reduction tendencies. In fact, in this study, we found that in the cultivated vegetation in eastern China, there will be many contractions in the future, so it is time to carry out resource investigation and dynamic monitoring activities actively and to improve the adaptability of C. lanceolata to climate change. Meanwhile, we should also make sustainable land use plans in places with stable expansion and suitable environments, and reduce the intensity and frequency of human activities on the edge of the newly increased habitats so as to increase the populations of C. lanceolata forest resources, improve the ecological service function, and realize both economic and ecological benefits.

5. Conclusions

In this study, 39 environment factors, including climate, soil, terrain and human activities, were used to predict the potential distribution habitats of C. lanceolata in China based on the MaxEnt model under different scenarios in current and future periods (the 2050s and 2070s). The results showed that the annual precipitation (Bio12), human activities (Hfp), minimum temperature of the coldest month (Bio6), mean temperature of the coldest quarter (Bio11), precipitation of the coldest quarter (Bio19), annual temperature range (Bio7), and elevation are predicted to be the leading environmental factors affecting distribution of C. lanceolata, and the suitable habitats are characterized by warmth, humidity, abundant rainfall, and relatively gentle topography. Human activities will cause the distribution of suitable habitats to degenerate and fragmentize. The areas of habitats under different scenarios were predicted to increase first and then decrease by the 2050s and 2070s, except for the RCP2.6 scenario, under which the suitable habitats area of C. lanceolata will increase continuously. Furthermore, the suitable habitats will gradually shift to high-latitude areas due to climate change.

Supplementary Materials

The following supporting information can be downloaded at: https://www.mdpi.com/article/10.3390/f15050830/s1, Table S1: Ecological factors used in simulation; Table S2: Contribution rate and permutation importance of environmental factors under current and other eight future scenarios; Table S3: Areas of potential distribution under different climate scenarios of Cunninghamia lanceolata (Lamb.) Hook.; Figure S1: Contribution rate of environmental factors; Figure S2: Permutation importance of environmental factors; Figure S3: Distribution of C. lanceolata habitats in the 2050s and 2070s in the future under different carbon emission concentration scenarios, (A) RCP2.6, (B) RCP4.5, (C) RCP6.0, (D) RCP8.5.

Author Contributions

L.Y. confirmed the topic and goals of this study; J.F. and Y.C. extracted and analyzed the data and wrote the manuscript; T.M., D.H. and J.C. reviewed and edited the manuscript; L.Y. sourced funding and supervised the progress of this manuscript. All authors have read and agreed to the published version of the manuscript.

Funding

This research was supported by the Research Start-up Fund for High-Level and High-Educated Talents of Nanjing Forestry University.

Data Availability Statement

The original data presented in the study are openly available in National Specimen Information Infrastructure (http://www.nsii.org.cn/, accessed on 1 June 2022), National Plant Specimen Resource Center (https://www.cvh.ac.cn/index.php, accessed on 1 June 2022), Global Biodiversity Information Facility (https://www.gbif.org/, accessed on 3 June 2022), World Climate Data (http://www.worldclim.org/, accessed on 20 June 2022), Food and Agriculture Organization of the United Nations (https://www.fao.org/soils-portal/data-hub/soil-maps-and-databases/harmonized-world-soil-database-v12/en/, accessed on 20 June 2022), and Global Human Footprint of Socioeconomic Data and Applications Center (https://sedac.ciesin.columbia.edu/data/set/wildareas-v2-human-footprint-geographic, accessed on 1 July 2022).

Conflicts of Interest

The authors declare no conflicts of interest.

References

  1. Yang, H.F. Characteristics of Cunninghamia lanceolata and afforestation techniques of improved varieties. Mod. Agric. Sci. Technol. 2022, 5, 97–98+101. (In Chinese) [Google Scholar]
  2. Shen, G.W.; Shen, G.H.; Fu, D. Cultivation techniques and application of urban roadside trees Cunninghamia lanceolata. Xiandai Nongcun Keji 2013, 17, 52. (In Chinese) [Google Scholar]
  3. Hou, B.X. The origin and development history of Chinese fir. Agric. Archaeol. 1996, 1, 161–171. (In Chinese) [Google Scholar]
  4. Xu, H.; Sun, Y.J.; Wang, X.J.; Wang, J.; Fu, Y. Linear mixed-effects models to describe individual tree crown width for China-fir in Fujian Province, southeast China. PLoS ONE 2015, 10, e0122257. [Google Scholar] [CrossRef]
  5. Duan, H.J.; Cao, S.; Zheng, H.Q.; Hu, D.H.; Lin, J.; Lin, H.Z.; Hu, R.Y.; Sun, Y.H.; Li, Y. Variation in the growth traits and wood properties of Chinese fir from six provinces of southern China. Forests 2016, 7, 192. [Google Scholar] [CrossRef]
  6. Li, M.; Chen, X.Z.; Huang, M.S.; Wu, P.F.; Ma, X.Q. Genetic diversity and relationships of ancient Chinese fir (Cunninghamia lanceolata) genotypes revealed by sequence-related amplified polymorphism markers. Genet. Resour. Crop Evol. 2017, 64, 1087–1099. [Google Scholar] [CrossRef]
  7. Yao, M.M.; Yang, Y.Q.; Song, J.L.; Yu, Y.; Jin, Y.C. Melamine formaldehyde modified furfurylation to improve Chinese fir’s dimensional stability and mechanical properties. BioResources 2017, 12, 3057–3066. [Google Scholar] [CrossRef]
  8. Yan, X.X.; Chang, Y.J. Investigation of waterborne thermochromic topcoat film with color-changing microcapsules on Chinese fir surface. Prog. Org. Coat. 2019, 136, 105262. [Google Scholar] [CrossRef]
  9. Sun, Q.X.; Peng, Z.H.; Zhang, Q.S. Volatiles of wood of Chinese fir in nature and its effect on human heaith. J. Anhui Agric. Univ. 2004, 2, 158–163. (In Chinese) [Google Scholar] [CrossRef]
  10. Kurpis, J.; Serrato-Cruz, M.A.; Feria Arroyo, T.P. Modeling the effects of climate change on the distribution of Tagetes lucida Cav. (Asteraceae). Glob. Ecol. Conserv. 2019, 20, e00747. [Google Scholar] [CrossRef]
  11. Gilani, H.; Arif Goheer, M.; Ahmad, H.; Hussain, K. Under predicted climate change: Distribution and ecological niche modelling of six native tree species in Gilgit-Baltistan, Pakistan. Ecol. Indic. 2020, 111, 106049. [Google Scholar] [CrossRef]
  12. Walther, G.R.; Post, E.; Convey, P.; Menzel, A.; Parmesan, C.; Beebee, T.J.; Fromentin, J.M.; Hoegh-Guldberg, O.; Bairlein, F. Ecological responses to recent climate change. Nature 2002, 416, 389–395. [Google Scholar] [CrossRef]
  13. Ulukan, H. Climate change and global warming effect(s) on wheat Landraces: A General Approach. In Wheat Landraces; Zencirci, N., Baloch, F.S., Habyarimana, E., Chung, G., Eds.; Springer International Publisher: Berlin, Germany, 2021; pp. 169–191. [Google Scholar] [CrossRef]
  14. Steel, E.J.; Fontaine, J.B.; Ruthrof, K.X.; Burgess, T.I.; Hardy, G.E.S.J. Changes in structure of over- and midstory tree species in a Mediterranean-type forest after an extreme drought-associated heatwave. Austral Ecol. 2019, 44, 1438–1450. [Google Scholar] [CrossRef]
  15. Matusick, G.; Ruthrof, K.X.; Brouwers, N.C.; Dell, B.; Hardy, G.S.J. Sudden forest canopy collapse corresponding with extreme drought and heat in a mediterranean-type eucalypt forest in southwestern Australia. Eur. J. For. Res. 2013, 132, 497–510. [Google Scholar] [CrossRef]
  16. Thomas, C.D.; Cameron, A.; Green, R.E.; Bakkenes, M.; Beaumont, L.J.; Collingham, Y.C.; Erasmus, B.F.N.; de Siqueira, M.F.; Grainger, A.; Hannah, L.; et al. Extinction risk from climate change. Nature 2004, 427, 145–148. [Google Scholar] [CrossRef] [PubMed]
  17. Moritz, C.; Agudo, R. The future of species under climate change: Resilience or decline? Science 2013, 341, 504–508. [Google Scholar] [CrossRef] [PubMed]
  18. Phillips, S.J.; Anderson, R.P.; Schapire, R.E. Maximum entropy modeling of species geographic distributions. Ecol. Model. 2006, 190, 231–259. [Google Scholar] [CrossRef]
  19. Phillips, S.J.; Dudík, M. Modeling of species distributions with Maxent: New extensions and a comprehensive evaluation. Ecography 2008, 31, 161–175. [Google Scholar] [CrossRef]
  20. Liu, H.C.; Jacquemyn, H.; He, X.Y.; Chen, W.; Huang, Y.Q.; Yu, S.; Lu, Y.P.; Zhang, Y. The Impact of human pressure and climate change on the habitat availability and protection of Cypripedium (Orchidaceae) in Northeast China. Plants 2021, 10, 84. [Google Scholar] [CrossRef]
  21. Garah, K.; Bentouati, A. Using the MaxEnt model for assessing the impact of climate change on the Aurasian Aleppo pine distribution in Algeria. Afr. J. Ecol. 2019, 57, 500–511. [Google Scholar] [CrossRef]
  22. Wang, G.Z.; Geng, Q.F.; Xiao, M.Y.; Zhang, M.Y.; Zhang, Y.Y.; Wang, Z.S. Predicting Pseudolarix amabilis potential habitat based on four Niche models. Sheng Tai Xue Bao 2020, 40, 6096–6104. (In Chinese) [Google Scholar] [CrossRef]
  23. Zhao, Y.; Deng, X.W.; Xiang, W.H.; Chen, L.; Ouyang, S. Predicting potential suitable habitats of Chinese fir under current and future climatic scenarios based on Maxent model. Ecol. Inform. 2021, 64, 101393. [Google Scholar] [CrossRef]
  24. Chen, Y.G.; Yue, X.G.; Chen, Y.H.; Cheng, W.X.; Du, J.G.; Zhong, Q.L.; Cheng, D.L. Identification of potential distribution area of Cunninghamia lanceolata in China under climate change based on the MaxEnt model. Ying Yong Sheng Tai Xue Bao 2022, 33, 1207–1214. [Google Scholar] [CrossRef]
  25. Wang, R.L.; Li, Q.; Feng, C.H.; Shi, Z.P. Predicting potential ecological distribution of Locusta migratoria tibetensis in China using MaxEnt ecological niche modeling. Sheng Tai Xue Bao 2017, 37, 8556–8566. [Google Scholar] [CrossRef]
  26. Guo, J.; Liu, X.P.; Zhang, Q.; Zhang, D.F.; Xie, C.X.; Liu, X. Prediction for the potential distribution area of Codonopsis pilosula at global scale based on Maxent model. Ying Yong Sheng Tai Xue Bao 2017, 28, 992–1000. [Google Scholar] [CrossRef]
  27. Zhang, S.; Liu, X.G.; Li, R.M.; Wang, X.L.; Cheng, J.H.; Yang, Q.L.; Kong, H. AHP-GIS and MaxEnt for delineation of potential distribution of Arabica coffee plantation under future climate in Yunnan, China. Ecol. Indic. 2021, 132, 108339. [Google Scholar] [CrossRef]
  28. Etherington, T.R. Python based GIS tools for landscape genetics: Visualising genetic relatedness and measuring landscape connectivity. Methods Ecol. Evol. 2011, 2, 52–55. [Google Scholar] [CrossRef]
  29. Hong, G.X.; Lv, S.Y.; Peng, J.Y.; Jiang, Z.Y. Genetic geography and conservation of Cunninghamia lanceolata and Cunnighamia konishii. Nat. Conserv. Q. 2000, 31, 33–36. (In Chinese) [Google Scholar]
  30. Hu, Z.J.; Zhang, Y.L.; Yu, H.B. Simulation of Stipa purpurea distribution pattern on Tibetan Plateau based on MaxEnt model and GIS. Ying Yong Sheng Tai Xue Bao 2015, 26, 505–511. (In Chinese) [Google Scholar] [CrossRef]
  31. Ding, W.N.; Ree, R.; Spicer, R.; Xing, Y. Ancient orogenic and monsoon-driven assembly of the world’s richest temperate alpine flora. Science 2020, 369, 578–581. [Google Scholar] [CrossRef] [PubMed]
  32. An, J. Study on Molecular Phylogeography of Cunninghamia lanceolata (Lamb.) Hook. Master’s Thesis, Central South University of Forestry and Technology, Hunan, China, 2012. (In Chinese). [Google Scholar]
  33. Wang, K.F.; Xu, S. Quaternary Palynology; Guizhou People’s Publishing House: Guizhou, China, 1988; p. 333. (In Chinese) [Google Scholar]
  34. Song, Z.C. Late Cenozoic palyno-flora from Zhaotong, Yunnan. J. Nanjing Inst. Geol. Paleontol. 1988, 24, 1–108. (In Chinese) [Google Scholar]
  35. Liu, H.L.; Wang, D.Y. A study on the remains of ancient forest in Mianning, Sichuan. Sci. Silvae Sin. 1984, 20, 175–184. (In Chinese) [Google Scholar]
  36. Huang, Z.G.; Li, P.R.; Zhang, Z.Y.; Li, K.H.; Qiao, P.N. Formation, Development and Evolution of Pearl River Delta; Science and Technology of China Press: Guangzhou, China, 1982; p. 274. (In Chinese) [Google Scholar]
  37. Gu, H.B. Sporopollen Analysis and Paleoenvironment Discussion of Pengtoushan Site in Lixian County, Hunan Province. Cult. Relics 1990, 8, 30–32. (In Chinese) [Google Scholar]
  38. Peng, Z.H. On the origin of Chinese fir from historical documents. J. Anhui Agric. Univ. 1984, 2, 23–32. (In Chinese) [Google Scholar] [CrossRef]
  39. Huang, B.L.; Lan, T.G. Preliminary discussion on the history of cultivation and utilization of Chinese fir. J. Nanjing For. Univ. (Nat. Sci. Ed.) 1988, 2, 54–59. (In Chinese) [Google Scholar] [CrossRef]
  40. Hou, B.X.; Chen, F.S.; Cheng, Z.H. Origin of distribution, utilization and cultivation history of Chinese fir in Hunan. Hunan For. Sci. Technol. 1995, 3, 1–6. (In Chinese) [Google Scholar]
  41. Li, Y.X. Genetic Diversity and Genetic Divergence of Cunninghamia lanceolata (Lamb.) Hook. Geographical Provenances. Master’s Thesis, Chinese Academy of Forestry, Beijing, China, 2015. (In Chinese). [Google Scholar]
  42. Wu, Z.L. Preliminary study on the distribution of Chinese fir. Acta Geogr. Sin. 1955, 3, 273–285. (In Chinese) [Google Scholar] [CrossRef]
  43. Lenoir, J.; Gégout, J.C.; Marquet, P.A.; de Ruffray, P.; Brisse, H. A significant upward shift in plant species optimum elevation during the 20th century. Science 2008, 320, 1768–1771. [Google Scholar] [CrossRef]
  44. van Vuuren, D.P.; Edmonds, J.; Kainuma, M.; Riahi, K.; Thomson, A.; Hibbard, K.; Hurtt, G.C.; Kram, T.; Krey, V.; Lamarque, J.-F.; et al. The representative concentration pathways: An overview. Clim. Chang. 2011, 109, 5. [Google Scholar] [CrossRef]
  45. Shugart, H.H.; Antonovsky, M.Y.; Jarvis, P.G.; Sandford, A.P. CO2 climatic change and forest ecosystems. In The Greenhouse Effect, Climatic Change and Ecosystems; Bolin, B., Doeoes, B.R., Jaeger, J., Warrick, R.A., Eds.; John Wiley and Sons: New York, NY, USA, 1986. [Google Scholar]
  46. Parmesan, C.; Yohe, G. A globally coherent fingerprint of climate change impacts across natural systems. Nature 2003, 421, 37–42. [Google Scholar] [CrossRef]
  47. Chen, G.X.; Yu, K.W.; Liao, L.P.; Xu, G.S. Effect of human activities on forest ecosystems: N cycle and soil fertility. Nutr. Cycl. Agroecosyst. 2000, 57, 47–54. [Google Scholar] [CrossRef]
  48. Liang, D.L.; Wang, B.; Jiang, L.L.; Chen, K. The population and its spatial characteristic analysis from 2000 to 2010 in Taiwan. J. Shanxi Norm. Univ. (Nat. Sci. Ed.) 2016, 30, 90–97. (In Chinese) [Google Scholar] [CrossRef]
  49. Yang, X.Y.; Zhang, S.B.; Lyu, Y.Q.; Zhao, Y.; Lyu, S.H. Characteristics and future projections of summer extreme precipitation in Sichuan Province, China. J. Mt. Sci. 2020, 17, 1696–1711. [Google Scholar] [CrossRef]
  50. Xu, C.C.; Wu, W.X.; Ge, Q.S. Impact assessment of climate change on rice yields using the ORYZA model in the Sichuan Basin, China. Int. J. Climatol. 2018, 38, 2922–2939. [Google Scholar] [CrossRef]
  51. Li, N.; Bai, R.; Wu, L.; Li, W.; Chen, M.; Chen, X.; Fan, C.H.; Yang, G.S. Impacts of future climate change on spring phenology stages of rubber tree in Hainan, China. Ying Yong Sheng Tai Xue Bao 2020, 31, 1241–1249. (In Chinese) [Google Scholar] [CrossRef]
  52. Wu, Z.Q. Preliminary study on growth and environmental factors of Cunninghamia lanceolata in the south of Yangtze River in Anhui province. Lin Ye Ke Xue Yan Jiu 1998, 1, 34–36. (In Chinese) [Google Scholar]
  53. Tian, D.L.; Xiang, W.H.; Chen, X.Y.; Yan, W.D.; Fang, X.; Kang, W.X.; Dan, X.W.; Peng, C.H.; Peng, Y.Y. A long-term evaluation of biomass production in first and second rotations of Chinese fir plantations at the same site. Forestry 2011, 84, 411–418. [Google Scholar] [CrossRef]
Figure 1. The geographical location of distribution points of Cunninghamia lanceolata (Lamb.) Hook. in China.
Forests 15 00830 g001
Figure 2. The receiver operating characteristic (ROC) curve of the MaxEnt model.
Forests 15 00830 g002
Figure 3. Correlation analysis of environmental factors.
Forests 15 00830 g003
Figure 4. Results of knife-cutting of environmental factors.
Forests 15 00830 g004
Figure 5. Response curve of leading environmental factors. The curves show the mean response of the 10 replicate Maxent runs (red) and the mean ± one standard deviation (blue, two shades for categorical variables).
Forests 15 00830 g005
Figure 6. Current distribution of suitable habitats of C. lanceolata.
Forests 15 00830 g006
Figure 7. Current distribution of suitable habitats of C. lanceolata without human activities.
Forests 15 00830 g007
Figure 8. Change in the distribution of C. lanceolata habitats under different scenarios in the 2050s and 2070s. (A) RCP2.6, (B) RCP4.5, (C) RCP6.0, (D) RCP8.5.
Forests 15 00830 g008
Figure 9. The core distributional shifts of C. lanceolata under different climate scenarios (the pink line represents RCP2.6, the purple line represents RCP4.5, the green line represents RCP6.0, and the black line represents RCP8.5).
Forests 15 00830 g009
Table 1. The suitable range of the leading variable environmental factors.
Environmental
Factors
Elevation
(m)
Bio6
(°C)
Bio7
(°C)
Bio11
(°C)
Bio12
(mm)
Bio19
(mm)
Hfp
Suitable minimum value01146110012040
Suitable maximum value6001230154700510105
Table 2. Changes in suitable habitat areas under different scenarios in the 2050s and 2070s.
RCP2.6RCP4.5RCP6.0RCP8.5
2050s2070s2050s2070s2050s2070s2050s2070s
Expansion
/×104 km2
22.7623.1623.2717.9427.3324.8822.8316.44
contraction
/×104 km2
8.465.748.0413.374.157.816.269.14
No change
/×104 km2
205.96208.68206.39201.05210.28206.61208.16205.28
No occupancy
/×104 km2
722.82722.42722.31727.64718.25720.70722.75729.14
Disclaimer/Publisher’s Note: The statements, opinions and data contained in all publications are solely those of the individual author(s) and contributor(s) and not of MDPI and/or the editor(s). MDPI and/or the editor(s) disclaim responsibility for any injury to people or property resulting from any ideas, methods, instructions or products referred to in the content.

