
Complete Plastid Genome Sequences of Three Tropical African Beilschmiediineae Trees (Lauraceae: Crytocaryeae)
1
Southwest Research Center for Landscape Architecture Engineering, National Forestry and Grassland Administration, Southwest Forestry University, Kunming 650224, China
2
Key Laboratory of Ecology of Rare and Endangered Species and Environmental Protection (Ministry of Education), Guangxi Normal University, Guilin 541001, China
3
Guangxi Key Laboratory of Landscape Resources Conservation and Sustainable Utilization in Lijiang River Basin, Guangxi Normal University, Guilin 541001, China
*
Authors to whom correspondence should be addressed.
Forests 2024, 15(5), 832; https://doi.org/10.3390/f15050832
Submission received: 13 April 2024
/
Revised: 6 May 2024
/
Accepted: 8 May 2024
/
Published: 10 May 2024
(This article belongs to the Special Issue Forest-Tree Comparative Genomics and Adaptive Evolution)
Abstract
:Millions of years of isolation have given Madagascar a unique flora that still reflects some of its relationship with the continents of Africa and India. Here, the complete chloroplast sequence of Beilschmiedia moratii, a tropical tree in Madagascar, was determined. The plastome, with a length of 158,410 bp, was 143 bp and 187 bp smaller than those of two closely related species, B. pierreana and Potameia microphylla, in sub-Saharan Africa and Madagascar with published sequences, respectively. A total of 124 repeats and 114 simple sequence repeats (SSRs) were detected in the plastome of B. moratii. Six highly variable regions, including ndhF, ndhF-rpl32, trnC-petN, pebE-petL, rpl32-trnL, and ycf1, among the three African species were identified and 1151 mutation events, including 14 SVs, 351 indels, and 786 substitutions, were accurately located. There were 634 mutation events between B. moratii and P. microphylla with a mean nucleotide variability (π) value of 0.00279, while there were 827 mutation events between B. moratii and B. pierreana with a mean π value of 0.00385. The Ka/Ks ratios of 86 protein-coding genes in the three African species were less than 1, and the mean value between B. moratii and P. microphylla was 0.184, while the mean value between B. moratii and B. pierreana was 0.286. In this study, the plastid genomes of the three African Beilschmiediineae species were compared for the first time and revealed that B. moratii and P. microphylla from Madagascar were relatively conserved, with low mutation rates and slower evolutionary rates.
1. Introduction
Madagascar, located in the southeast of the African continent, is the world’s fourth largest island after Greenland, New Guinea, and Kalimantan. Renowned for its remarkable biodiversity, Madagascar stands out as a prime hotspot for plant diversity research on a global scale [1,2,3]. It is considered one of the few regions in the world to have evolved in isolation, as it separated from India about 88 million years ago (mya) and before that, from Africa about 170 mya, which led to its unique composition of plant species [4,5,6]. As of January 2024, a total of 249 vascular plant families, including 1698 genera and 11,580 native vascular plant species (angiosperms, gymnosperms, and ferns), have been recorded in Madagascar, of which 9329 (82%) are endemic [7]. Madagascar’s terrain is dominated by mountainous regions and continental rifts, with the highest plant diversity and rarity found on the steep eastern side of this geographical feature [8]. Despite the richness and uniqueness of Madagascar’s species, there is evidence that levels of biodiversity in Madagascar are declining and that many species have even gone extinct before they were recorded [2]. This issue has attracted the attention of many researchers, and the conservation of biodiversity in Madagascar has become urgent. Protection of plant diversity in Madagascar is one of the goals of the local government and the international community to work together. The integration of technology reduced sequencing costs, and molecular tools for studying species diversity in Madagascar has proven to be a successful pathway towards implementing efficient conservation strategies in the face of environmental challenges and biodiversity threats [9,10].
Chloroplasts (cp) are semi-autonomous organelles necessary for photosynthesis and various metabolic pathways essential for growth and development in plants [11]. The unique genetic characteristics of plant cp are determined by their haploid, non-recombination, and highly conserved characters [12,13]. Typically, genomes range in size from 107 to 218 kb and have a tetrad structure consisting of a pair of inverted repeat regions (IRs), a large single-copy region (LSC) and a small single-copy region (SSC) [14]. The cp genome in plants typically retains a limited number of genes, around 120–130, that play essential roles in various cellular functions such as photosynthesis, gene expression, and protein synthesis [15,16]. Although the cp genome is small, it contains a large amount of genetic information, showing evolution and conservation at the nucleotide sequence level and structural rearrangement [17,18]. The coding and non-coding regions have different evolutionary rates, and there are significant differences at the molecular level [17]. It can be used to distinguish interspecific relationships and evaluate interspecific variability and is widely used in the research fields of population genetic diversity and phylogeny [19,20]. In the past two decades, significant progress has been made in the study of cp genome composition and structure, interspecific differences, and evolutionary relationships of Lauraceae, but the study of Beilschmiediineae is very limited [21,22,23].
Beilschmiedia is one of the largest pantropical genera of the Lauraceae family, distributed mainly in Africa, Southeast Asia, Oceania, and the Americas (https://www.iplant.cn/info/Beilschmiedia?t=foc, accessed on 23 March 2024). So far, 268 species have been accepted by the World Plant Online website (https://powo.science.kew.org/taxon/urn:lsid:ipni.org:names:330809-2, accessed on 23 March 2024). This genus is dominated by tall trees, with a few shrubs, which are important components of their ecosystems and are usually the dominant species in their communities due to their size and ecological role (https://eol.org/pages/39964810/articles, accessed on 23 March 2024) [24]. As a result of overlapping characters, it is challenging to differentiate Beilschmiedia from its close relatives [25,26]. Examples of such species include Potameia Thouars, Endiandra R. Br., Syndiclis Hook.f., Sinopora J. Li, N. H. Xia, and H. W. Li, and Yasunia van der Werff, all of which are included in Beilschmiediineae [26]. In recent years, due to the destruction of primary forests, loss of habitat, invasion of alien species, and overexploitation, the number of Beilschmiedia plants has decreased year-by-year [27]. A search in the IUCN Red List for ‘Beilschmiedia’ reveals 241 species, with one classified as ‘extinct’, 44 species (18.26%) as ‘critically endangered’, 64 species (26.56%) as ‘endangered’, and 46 species (19.09%) as ‘vulnerable’ (https://www.iucnredlist.org/search?query=Beilschmiedia&searchType=species, accessed on 23 March 2024) [28]. Beilschmiedia moratii van der Werff, first published in 1996, is endemic to Madagascar, which brings the number of species of the genus Beilschmiedia in Madagascar to 10, greatly contributing to the study of the Malagasy flora [29].
Little research has been reported about B. moratii since it was published. Nishida and van der Werff (2007) [25] studied twenty-one species of Aspidostemon, nine of Beilschmiedia, three of Cryptocarya, and five of Potameia, all from Madagascar, including B. moratii, and concluded that cuticle characteristics play an important role in dealing with the classification of Lauraceae plants [30]. The molecular study of B. moratii, however, was the first of its kind in the work of Song et al. (2023), who used 176 cp genomes to investigate the phylogeny and biogeography of the Cryptocaryeae (Lauraceae), but the cp genomic characteristics of B. moratii were not compared [31]. In addition, previous research suggested that Potameia from Madagascar should be classified into Beilschmiedia [31,32], which needs appropriate material to be collected, combined with morphology and molecular evidence for further research. In this study, for the first time, we compared the cp genome of B. moratii from Madagascar with that of other species from the African Beilschmiediineae. Our main aim was to reveal genetic differences between Madagascar and sub-Saharan Africa and explore their relationship by comparing the cp genomes of the African Beilschmiediineae. This result can provide us with a better understanding of the genetic diversity and evolutionary history of plants in Madagascar, so as to provide an important basis for plant taxonomy and biodiversity conservation.
2. Materials and Methods
2.1. Sampling, DNA Extraction, Genomic Sequencing
Fresh young B. moratii leaves were collected in Madagascar using the silica gel drying method. The harvested tissues were deposited at the Kunming Institute of Botany, Chinese Academy of Sciences (collection number: 17CS16181). Total genomic DNA of B. moratii was extracted from healthy fresh young leaves by the modified CTAB method [33]. Genomic DNA that qualified for library construction was used to construct a paired-end library with an insertion size of 150 bp, which was sequenced using the Illumina HiSeq 2500 platform at BGI-Shenzhen, and more than 2.0 Gb of reads for the sample were obtained.
2.2. Genome Assembly and Annotation
The raw data were subjected to quality control using fastp v 0.23.2 [34], resulting in about 1.82 Gb of clean data, with a Q20 rate of 98.056%. Then, we ran the GetOrganelle v1.7.6.1 [35] script on a Linux system to assemble the genome. Bandage v0.8.1 [36] was used to visualize whether the genome forms a circle. The genome was automatically annotated using CPGAVAS2 (http://47.96.249.172:16019/analyzer/annotate, accessed on 18 January 2024) [37], then adjusted using Geneious Prime v2023.2.1 [38] to manually confirm the start and stop codons and the intron/exon boundaries of the protein-coding genes. OGDRAW (https://chlorobox.mpimp-golm.mpg.de/OGDraw.html, accessed on 20 January 2024) [39] was used to create a linear cp genome map.
2.3. Phylogenetic Analysis
The matK gene sequences of B. acuta (accession No. KC627796), B. jacques-felixii (accession No. KC627456), B. madagascariensis (accession No. AJ627915), B. sp. (accession No: KC627690, KC627846, KC627629, and HG314964), B. velutina (accession No. HG314975), P. chartacea (accession No. AJ627930), P. thouarsiana (accession No. HG315002), the entire cp genomes of B. pierreana (accession No. MT720942), P. microphylla (accession No. MT720950), and B. immersinervis (accession No. MT720939) were collected from GenBank (https://www.ncbi.nlm.nih.gov/, accessed on 18 January 2024). Then PhyloSuite v1.2.3 [40] was used to extract the matK gene sequences of B. moratii, B. pierreana, P. microphylla, and B. immersinervis. The 14 matK gene sequences were aligned using MAFFT v7.520 [41] and manually adjusted in BioEdit v7.0.9.0 [42]. The matK gene dataset was analyzed for BI using jModelTest v2.1.10 [43], and the optimal HKY + F model was selected. The phylogenetic tree was constructed using the Bayesian inference (BI) method in MrBayes v3.2.7 [44], with B. immersinervis as an outgroup, running 1 million generations and sampling every 1000 generations. A majority-rule consensus tree was created using the trees that remained after the first 25% were burned out as burn-in. FigTree v1.4.4 (http://tree.bio.ed.ac.uk/publications/, accessed on 24 January 2024) was used to visualize and modify the phylogenetic tree.
2.4. Analysis of Repeats and Simple Sequence Repeats (SSR)
In order to locate repeat sequences in the cp genomes of B. moratii, the repeat sequences were predicted using the online tool REPuter (https://bibiserv.cebitec.uni-bielefeld.de/reputer, accessed on 28 January 2024) [45]. The configurations were as follows: the estimated maximum repetitions were 5000, the minimum repeat size was 25, and the Hamming distance was 3. In addition, we used MISA (https://webblast.ipk-gatersleben.de/misa, accessed on 28 January 2024) [46] to predict mono-, di-, tri-, tetra-, penta-, and hexa-nucleotides repeats with repetition thresholds of 10, 5, 4, 3, 3, and 3, and finally plotted using Circos v0.69-9 [47].
2.5. Mutation Events Detection and Sliding Window Analysis of the Plastomes
We constructed four whole cp genome matrices. Matrix I is composed of sequences from B. moratii and P. microphylla, Matrix II includes sequences from B. moratii and B. pierreana, Matrix III is made up of sequences from P. microphylla and B. pierreana, and Matrix IV integrates sequences from B. moratii, P. microphylla, and B. pierreana. The four matrices were aligned using MAFFT v7.520 [41] and then manually adjusted in BioEdit v7.0.9.0 [42], especially the inversion sites. The mutation sites of Matrix Ⅰ, Matrix Ⅱ, Matrix Ⅲ, and Matrix IV, including insertions and deletions (indels) and SNPs, were detected using Geneious Prime v2023.2.1 [38]. These sites were then manually verified in BioEdit v7.0.9.0 [42].
The nucleotide polymorphism values (π) of Matrix I, II, III, and IV were calculated using DnaSP v6.12.03 [48], respectively. The window length was set to 600 base pairs and the step size to 200 base pairs. The values were plotted in the plastomes using an R program. The paired nucleotide distances of the three genomes were calculated using MEGA v11.0.13 [49] based on the Nei-Gojobori method [50].
2.6. Selective Pressure Analysis
The 86 protein-coding genes shared by B. moratii, P. microphylla, and B. pierreana were extracted by PhyloSuite v1.2.3 [40] and aligned with MAFFT v7.520 [41]. The non-synonymous (Ka) and synonymous (Ks) nucleotide substitution rates, as well as the Ka/Ks ratio, were calculated using the KaKs_Calculator v2.0 [51]. Finally, 40 genes potentially under selection were chosen from the three groups for further analysis. Selective pressure was assessed using the Ka/Ks ratio: ratios between 0.5 and 1 indicate relaxed selection, ratios less than 0.5 suggest purifying selection, a ratio of 1 indicates neutral evolution, and ratios greater than 1 signify positive selection [52].
3. Results
3.1. Phylogenetic Analysis
Here, phylogenetic relationships were obtained based on a matK matrix. The resulting phylogenetic tree, as shown in Figure 1B, is clearly divided into the Madagascar clade and the sub-Saharan Africa clade, which are sister groups to each other. The Madagascar clade consists entirely of species from Madagascar, namely B. madagascariensis, B. moratii, B. velutina, P. chartacea, P. microphylla, and P. thouarsiana, with support values up to 0.78. The species in the sub-Saharan African Clade are all from sub-Saharan Africa, including B. acuta, B. jacques-felixii, B. pierreana, and B. sp. (No: KC627690, KC627846, KC627629, and HG314964), and show a stronger support value of 0.99.
3.2. Characteristics of the cp Genome of B. moratii
The newly assembled plastome of B. moratii (deposited in LCGDB: LAU00173) had a quadripartite structure forming a circular molecule, and the size of the genome was 158,410 bp in length, which was 187 bp smaller than that of P. microphylla (158,597 bp, GenBank accession No: MT720950) and 143 bp smaller than that of B. pierreana (158,553 bp, GenBank accession No. MT720942) (Figure 2). The B. moratii cp genome includes a pair of inverted repeats (IRs) of 25,537 bp, separated by a large single copy (LSC) region of 89,198 bp and a small single copy (SSC) region of 18,138 bp (Figure 2). The overall GC content within the plastome was 39.1%. The IR regions exhibited a higher GC content of 43%, whereas the LSC and SSC regions had values of 37.8% and 34%, respectively.
For the newly assembled plastome genome, a total of 131 genes were annotated. These included 86 protein-coding genes, 37 tRNA genes, and 8 rRNA genes (Supplementary Table S1). Out of these genes, 22 were found to contain introns. This included 14 protein-coding genes: atpF, clpP, ndhA, ndhB (2), petB, petD, rpl16, rpl2, rpoC1, rps12 (2), rps16, and ycf3, as well as 8 tRNA genes: trnA-UGC (2), trnG-UCC, trnI-GAU (2), trnK-UUU, trnL-UAA, and trnV-UAC. Of these 22 genes, only clpP and ycf3 had two introns, while the remaining 20 genes had a single intron each. The gene rps12 was identified as a trans-spliced gene, with its 5′ end located in the LSC region and its duplicated 3′ end in the IR region. In addition, of the 131 genes, 17 were double-copy genes and the rest were single-copy genes.
3.3. Repeats Analysis
In the B. moratii cp genome, four types of repeats were identified, including forward repeats (F), palindromic repeats (P), reverse repeats (R), and complement repeats (C) (Figure 3). The repeat analysis showed 52 forward repeats, 46 palindromic repeats, 14 reverse repeats, and 12 complementary repeats (Figure 3B). Most of the repeats observed were forward repeats (accounting for 41.94%) and the least were complement repeats (accounting for 9.68%). The longest repeat was 48 bp and belonged to palindromic repeats, located in the LSC region.
The B. moratii cp genome contains 114 SSRs, and a total of 6 types of SSRs were found, with the largest number of mononucleotide repeats (89), followed by dinucleotide repeats (12), tetranucleotide repeats (6), and trinucleotide repeats (5), and at least 1 pentanucleotide and 1 hexanucleotide repeat, respectively (Figure 3C). The 13 repeat units of the six SSR types included the most abundant mononucleotide repeat unit A/T, accounting for 76.35% of all SSRs (Figure 3C). The AT/AT and AAT/ATT repeat units also predominated in their respective SSR types. The distribution of SSR in different regions of the genome was different. In the cp genome of B. moratii, the number of SSR distributed in the LSC region was the largest (94, accounting for 82.46%), while the number of SSR in the IR regions was the smallest (only 4, accounting for 3.51%) (Figure 3A). In addition, 81 SSRs, accounting for 71.05%, were located in the intergenic region, most of the rest were distributed in the intron region, and a few were in the exon region (Figure 3A).
3.4. Number and Forms of Microstructural Mutations
To better understand cp genomic differences between sub-Saharan Africa and Madagascar, indel mutations between cp genomes of the three species were analyzed for comparison. In Matrix I (B. moratii and P. microphylla), there were 136 indels in gene spacer regions, 28 in introns, and 18 in exons. Matrix II (B. moratii and B. pierreana) revealed 147 indels in gene spacer regions, 39 in introns, and 22 in exons. Matrix III (P. microphylla and B. pierreana) contained a total of 218 indels, with 158 in gene spacer regions, 42 in introns, and 18 in exons. Finally, in Matrix IV (B. moratii, P. microphylla, and B. pierreana), a total of 351 indels were detected across all regions. These findings are presented in Figure 4A. In Matrix I, Matrix II, and Matrix III, indels were more common in gene spacer regions than in other regions. Notably, Matrix I, both species from Madagascar, had the fewest indels. Furthermore, these indels are classified into simple repeat sequence (SSR)-type indels and non-SSR-type indels. In Matrix I, Matrix II, and Matrix III, there were 81, 89, 86 SSR-type and 101, 119, 132 non-SSR-type, respectively (Figure 4B). In SSR-type indels, most of the indel length changes ranged from 1 to 6 bp, but the insertion length of 24 bp in the ycf2 gene of Matrix III was the longest among Matrix I, Matrix II, and Matrix III. For non-SSR-type indels, most length changes ranged from 1 to 10 bp, but there was a 61 bp deletion in the intergenic region of psbE-petL in Matrix III. There was a 54 bp deletion in ycf1 in Matrix II, and a 54 bp deletion in the double copy of ycf2 in Matrix I. In Matrix I, Matrix II, and Matrix III, indels accounted for 69.78%, 68.75% and 68.81% in LSC region, and the proportion of IR region was 10.99%, 12.98%, and 17.89%, with 10, 6, and 10 micro-inversion events identified, respectively, ranging in length from 2 to 8 bp.
3.5. Numbers and Pattern of SNP Mutations
SNP markers were identified as the most prevalent type of mutation across the three species. In Matrix I (B. moratii and P. microphylla), a total of 442 SNPs were observed, including 251 transitions (Ts) and 191 transversions (Tv), with a Tv to Ts ratio of 1:1.31 (Figure 5B). Specifically, 188 SNPs were identified in intergenic regions, 39 in introns, and 215 in exons (Figure 5A). In Matrix II (B. moratii and B. pierreana), a total of 613 SNPs were detected, comprising 371 Ts and 242 Tv sites, with a Tv to Ts ratio of 1:1.53 (Figure 5B). Out of these SNPs, 270 were found in intergenic regions, 60 in introns, and 283 in exons (Figure 5A). In Matrix III (P. microphylla and B. pierreana), a total of 519 SNPs were identified, consisting of 332 Ts and 182 Tv, with a Tv to Ts ratio of 1:1.82 (Figure 5B). Among these SNPs, 235 were located in intergenic regions, 53 in introns, and 231 in exons (Figure 5A). In Matrix IV (B. moratii, P. microphylla, and B. pierreana), a total of 786 SNPs were observed, including 476 Ts and 310 Tv, with a Tv to Ts ratio of 1:1.54 (Supplementary Table S2). The types of base mutations were consistent in Matrix I, Matrix II, Matrix III, and Matrix IV, with the most common SNP mutation types being A to G and T to C, with fewer mutations from A to T or T to A (Figure 5B).
3.6. Divergence Hotspots of B. moratii
To elucidate levels of sequence difference, we calculated the nucleotide variability (π) values. The π values in Matrix I ranged from 0 to 0.03, with an average value of 0.00279 (Figure 6A). The π values of Matrix Ⅳ ranged from 0 to 0.02667, with an average value of 0.00334 (Figure 6A). The π values of Matrix I and IV are very similar, sharing the highest and lowest points. For the plastomes of Matrix III, the π values ranged from 0 to 0.01833, with a mean value of 0.00330 (Figure 6B). Comparatively, the π values of Matrix II plastomes varied from 0 to 0.02833, with a mean of 0.00385 (Figure 6C). In Matrix I, Matrix II, and Matrix III, the average π is the largest in Matrix II and the smallest in Matrix I. In addition, we discovered nine hypervariable loci (π > 0.014) in Matrix I, with two in ndhF and seven in ycf1. However, in Matrix II, we identified 19 hypervariable loci (π > 0.014). These loci were found in ndhF-rpl32, trnT-trnL, two in ndhF-rpl32, ndhG-ndhI, rps15-ycf1, and thirteen in ycf1. Similarly, we found 18 hypervariable loci (π > 0.014) in Matrix III. These loci include trnC-petN, rpl32-trnL, psbE-petL (two loci), ndhF-rpl32 (three loci), and ycf1 (eleven loci).
In addition, the pairwise nucleotide divergence values between two of the three plastomes varied from 0.00283 to 0.00459 (Table 1). The larger values between sub-Saharan Africa and Madagascar, and the lowest values between B. moratii and P. microphylla, both in Madagascar, are the same as the results of the nucleotide polymorphism.
3.7. Selective Pressure Analysis of Protein-Coding Genes
To investigate whether there is selection occurring in the plastid genes of B. moratii, P. microphylla, and B. pierreana, we calculated the Ka, Ks, and Ka/Ks ratios of 86 CDS between them. Among the three comparisons, the highest average Ka was observed between B. moratii vs. B. pierreana, at 0.00192 (Figure 7A). The largest mean value of Ks was found in B. moratii vs. B. pierreana, which was 0.00802, and the smallest was found in P. microphylla vs. B. pierreana, which was 0.00549 (Figure 7B). The mean value of Ka was significantly lower than that of Ks. We then selected 40 genes that showed potential selection pressure for further analysis (Figure 7C). The average Ka/Ks value of the 40 protein-coding genes examined between B. moratii and B. pierreana was found to be 0.286. Out of these, 20 genes had Ka/Ks values higher than the average. Among these twenty genes, the six genes with the highest ratios were ndhD, petA, rps4, rpl16, ycf1a, and ycf1b (Figure 7C). However, none of these genes had a Ka/Ks ratio greater than one. This result was replicated in the other two comparisons, suggesting that none of the genes were positively or neutrally selected between B. moratii, P. microphylla, and B. pierreana. In the comparison of B. moratii vs. P. microphylla, the average Ka/Ks ratio of the 40 protein-coding genes was 0.184. Among these genes, 19 had ratios higher than the average. The top six genes with the highest ratios were ndhF, ndhK, petD, psbB, psbZ, and ycf1a (Figure 7C). In the comparison of P. microphylla vs. B. pierreana, the average Ka/Ks ratio was found to be 0.206. Seventeen genes had ratios higher than the average, with the top six genes being matK, ndhD, ndhI, psbA, rps12, and ycf1a (Figure 7C). In addition, in the comparison between B. moratii and B. pierreana, the Ka/Ks ratio was higher than the other two groups, with the lowest Ka/Ks ratio between B. moratii and P. microphylla.
4. Discussion
Comparative plastome analyses have revealed structural variations, gene content differences, and evolutionary rate variations that provide insights into the phylogenetic relationships and evolutionary history of these plant groups, as evidenced by studies on Betulaceae [53], Paeonia (Paeoniaceae) [54], and Trollius (Ranunculaceae) [55]. In this study, by comparing cp genome analyses, we hope to shed light on the evolutionary relationships between species and gain insight into the mechanisms of adaptation and differentiation in their respective habitats (Madagascar and sub-Saharan Africa).
4.1. Phylogenetic Analysis of Beilschmiediineae from Africa
Our phylogenetic results suggest that the Beilschmiediineae species in Madagascar may share a common ancestor with the Beilschmiediineae species in sub-Saharan Africa. This result is similar to that of Rohwer et al. (2014) [32], Li et al. (2020) [56], and Song et al. (2023) [31]. Rohwer et al. (2014) [32] confirmed that Dahlgrenodendron from sub-Saharan Africa was a sister clade to Aspidostemon from Madagascar on the basis of nuclear ITS and plastid trnK intron sequences, and distinguished sub-Saharan African Beilschmiedia species from Madagascar. Li et al. (2020) [56] reconstructed the phylogenetic tree based on the entire cp genome of the Beilschmiedia group using Bayesian inference and maximum likelihood method and evaluated its differentiation time. B. pierreana from sub-Saharan Africa and P. microphylla from Madagascar were found to form a sister clade with strong support, and their differentiation time ranged from about 3.1 to 31.4 mya. Song et al. (2023) [31] used plastid genome sequences to re-investigate the phylogenetic and biogeographic history of the tribe Crytocaryeae, and found that the Beilschmiediineae of sub-Saharan Africa and Madagascar were sister clades, and their differentiation time was 15.49–38.49 mya. These studies have shown that there are significant genetic and/or morphological differences between plant species on Madagascar and those on the African continent. This result can be attributed to the peculiarities of the isolated island environment, including factors such as geographical isolation and changes in climatic conditions, which have gradually separated the plants on Madagascar from those on the African continent and formed distinct species groups.
4.2. Structural Variation of B. moratii Plastome
The structure, size, and gene content of the B. moratii cp genome were relatively conserved. It shows a typical quadripartite circular structure with the LSC and SSC regions divided by the IR regions, which were similar to the other Lauraceae plants and most of the angiosperms with no significant differences [57,58]. Moreover, each region contributes to this difference in genome size, and there was little difference between them. During the comparison, we found a large number of inserted and deletion mutation sites, which may be the main cause of their genomic differences. In addition, the IR region plays a crucial role in maintaining plastid structural stability, with its contraction and expansion considered the main reasons for differences in plastid genome sizes [59]. We compared the IR regions between the three and found that their IR regions were stretched or expanded. This, together with IR boundary gene insertion and deletion mutations, caused differences in the size of their IR regions and also affected the size of the LSC region and the SSC region. In contrast, studies of Asparagus densiflorus [60] and tree peony [61] have shown that the main determinant of plastid length is not the contraction and expansion of the IR region, but the length change in the LSC region. While the direct link between these plastid variations and the overall evolutionary process of these species remains elusive, our study provides valuable insights into plastid evolution.
In the genome, single nucleotide polymorphisms (SNPs) and insertion/deletion mutations (indels) are the most common mutation types and are the basic sources of genetic variation that drive evolutionary change in populations [62]. They generally have low genetic effects, but as population size increases, they may have an impact on the genetic diversity of the genome [63]. Of the three sets of comparisons, the two species, all from Madagascar, had the fewest mutations, with 634 mutation events, including 442 SNPs and 192 indels. And among them, the number of SNPs is 2.30–2.95 times the number of indels, and the largest multiple appears in B. moratii and B. pierreana, with the largest number of SNP mutation sites and the largest total mutation sites. Five possible reasons for the mutation number differences include genetic drift, population history, evolutionary timing, biogeographic factors, and natural selection [64]. We hypothesize that the fewer mutation events in the cp genome of Madagascar species may be due to the combination of these factors. This suggests that the ecological environment and evolutionary history of Madagascar may be different from that of sub-Saharan Africa. In addition, we also noticed that the number of SNPs on exons was 11.94–12.86 times that of indels in the three sets of comparisons. The SNPs’ sites are not randomly distributed, but clustered as “hotspots”, which is not only reflected in the intergenic region but also in the exon [65,66]. For example, in the three groups, the SNPs on the exons were mostly concentrated in matK, psbA, ndhD, ndhF, rpoC1, rpoC2, ycf1, etc. It suggests that these genes have frequent genetic variation between species, or play special functional roles in the evolutionary process, so its mutation may be more susceptible to natural selection.
4.3. Divergence Hotspot Analysis
While the cp genome is highly conserved overall, it does contain a number of variable regions and features that can be used for evolutionary and phylogenetic analysis, as well as for the development of genetic markers [67]. Across the four-sequence matrix, nucleotide variability results were very similar, sharing common hypervariable regions, suggesting that mutation events in the genome were concentrated in these regions and drove them to become hotspots. It has been shown that nucleotide variation within the same genus is low and very similar, but the variation between different genera is very large, and often appears with special hypervariable regions [68]. It seems that some clues can also be found from the results of nucleotide variability if we study the problem of the classification divergence between Potameia and Beilschmiedia. In addition, the highest variation points in the four matrices all appear in the ycf1 gene, which has been confirmed in previous studies that ycf1a or ycf1b are the most volatile plastid genomic regions and can serve as the core barcodes of land plants [69]. The ycf1 gene and several other identified hypervariable regions (ndhF, ndhF-rpl32, trnC-petN, pebE-petL, and rpl32-trnL) provide valuable information for further functional studies and plant taxonomy. The IR region is generally considered to be the most conserved part of the plastid genome of land plants, and our results also reflect this.
4.4. Selective Pressure Analysis
The ratio of non-synonymous to synonymous substitutions (Ka/Ks) is a key metric used to characterize natural selection pressures on protein-coding genes [70,71]. In this study, most of the genes across the three comparison sets underwent purifying selection, a few genes were relaxed selection (0.5 < Ka/Ks < 1.0, Figure 7C), and none showed positive or neutral selection, reflecting the typical evolutionary conservation of plastid genes in plants [72]. In the three groups, ycf1a was present at the same time, and showed large differences in mutation and nucleotide polymorphism. The ycf1 gene, the largest gene in the plastome, has been proven to be absent or pseudogenized in many prior research [73]. However, studies have also shown that ycf1 and ycf2 are functional genes, and their encoded products are essential for cell survival [74]. In summary, the encoded proteins of these selected genes function as enzymes involved in chloroplast protein synthesis, gene transcription, energy conversion, and plant development. We inferred that the cp functional genes that were under selection might play key roles during the adaptation and development of the Beilschmiediineae species to terrestrial ecosystems.
5. Conclusions
This study first sequenced and assembled the complete plastome of B. moratii from Madagascar. Phylogenetic relationships constructed using the matK gene show that B. moratii clustered into a clade with other species from Madagascar and formed a sister clade with species from sub-Saharan Africa. A comparison of the cp genomes of three African Beilschmiediineae species found that the species within Madagascar had the fewest mutation events and evolutionary rates, which is supported by multiple results. Six highly variable regions (ndhF, ndhF-rpl32, trnC-petN, pebE-petL, rpl32-trnL, and ycf1) among the three African species were identified, which can be used for phylogenetic studies or as markers for species identification. Our results deepen our understanding of the B. moratii cp genome in Madagascar and the phylogenetic evolution of the African Beilschmiediineae, contributing to the conservation of species diversity in Madagascar.
Supplementary Materials
The following supporting information can be downloaded at: https://www.mdpi.com/article/10.3390/f15050832/s1, Table S1: Genes present in the Beilschmiedia moratii chloroplast genome; Table S2: Forms and numbers of mutation events in three African plastomes.
Author Contributions
Conceptualization, Y.S. and P.X.; Methodology, W.Z. and P.X.; Software, H.Z., Q.L. and Z.C.; Validation, H.Z., Q.L. and Z.C.; Formal analysis, H.Z., Q.L. and Z.C.; Investigation, H.Z., Q.L. and Z.C.; Resources, Y.S. and P.X.; Data curation, W.Z.; Writing—original draft, W.Z.; Writing—review & editing, W.Z., Y.S. and P.X.; Visualization, W.Z.; Supervision, Y.S.; Project administration, Y.S. and P.X.; Funding acquisition, P.X. All authors have read and agreed to the published version of the manuscript.
Funding
This work was supported by the National Natural Science Foundation of China (Nos. 32260060 and 32060710), Key Technologies Research for the Germplasm of Important Woody Flowers in Yunnan Province (No. 202302AE090018), and the Yunnan Science and Technology Talents and Platform Program (No. 202205AF150022).
Data Availability Statement
The data presented in this study are available in the article and Supplementary Materials. The complete plastid genome sequence data of the Beilschmiedia moratii will be submitted to LCGDB (https://lcgdb.wordpress.com, accessed No: LAU00173) during the revision process.
Conflicts of Interest
The authors declare no conflicts of interest.
References
- Myers, N.; Mittermeier, R.A.; Mittermeier, C.G.; da Fonseca, G.A.; Kent, J. Biodiversity hotspots for conservation priorities. Nature 2000, 403, 853–858. [Google Scholar] [CrossRef] [PubMed]
- Ralimanana, H.; Perrigo, A.L.; Smith, R.J.; Borrell, J.S.; Faurby, S.; Rajaonah, M.T.; Randriamboavonjy, T.; Vorontsova, M.S.; Cooke, R.S.C.; Phelps, L.N.; et al. Madagascar’s extraordinary biodiversity: Threats and opportunities. Science 2022, 378, eadf1466. [Google Scholar] [CrossRef] [PubMed]
- Marchese, C. Biodiversity hotspots: A shortcut for a more complicated concept. Glob. Ecol. Conserv. 2015, 3, 297–309. [Google Scholar] [CrossRef]
- Schettino, A.; Scotese, C.R. Apparent polar wander paths for the major continents (200 Ma to the present day): A palaeomagnetic reference frame for global plate tectonic reconstructions. Geophys. J. Int. 2005, 163, 727–759. [Google Scholar] [CrossRef]
- Ali, J.R.; Aitchison, J.C. Gondwana to Asia: Plate tectonics, paleogeography and the biological connectivity of the Indian sub-continent from the Middle Jurassic through latest Eocene (166–35 Ma). Earth-Sci. Rev. 2008, 88, 145–166. [Google Scholar] [CrossRef]
- Emanuel, K. Tropical Cyclones. Annu. Rev. Earth Planet. Sci. 2003, 31, 75–104. [Google Scholar] [CrossRef]
- Madagascar Catalogue. Catalogue of the Plants of Madagascar (Missouri Botanical Garden). Available online: https://www.tropicos.org/Project/Madagascar (accessed on 23 March 2024).
- Liu, Y.; Wang, Y.; Willett, S.D.; Zimmermann, N.E.; Pellissier, L. Escarpment evolution drives the diversification of the Madagascar flora. Science 2024, 383, 653–658. [Google Scholar] [CrossRef] [PubMed]
- Blanco, M.B.; Greene, L.K.; Rasambainarivo, F.; Toomey, E.; Williams, R.C.; Andrianandrasana, L.; Larsen, P.A.; Yoder, A.D. Next-generation technologies applied to age-old challenges in Madagascar. Conserv. Genet. 2020, 21, 785–793. [Google Scholar] [CrossRef]
- Krehenwinkel, H.; Pomerantz, A.; Prost, S. Genetic biomonitoring and biodiversity assessment using portable sequencing technologies: Current uses and future directions. Genes 2019, 10, 858. [Google Scholar] [CrossRef]
- Sierra, J.; Escobar-Tovar, L.; Leon, P. Plastids: Diving into their diversity, their functions, and their role in plant development. J. Exp. Bot. 2023, 74, 2508–2526. [Google Scholar] [CrossRef]
- Clegg, M.T.; Gaut, B.S.; Learn, G.H., Jr.; Morton, B.R. Rates and patterns of chloroplast DNA evolution. Proc. Natl. Acad. Sci. USA 1994, 91, 6795–6801. [Google Scholar] [CrossRef]
- Daniell, H.; Lin, C.S.; Yu, M.; Chang, W.J. Chloroplast genomes: Diversity, evolution, and applications in genetic engineering. Genome Biol. 2016, 17, 134. [Google Scholar] [CrossRef]
- Jansen, R.K.; Raubeson, L.A.; Boore, J.L.; de Pamphilis, C.W.; Chumley, T.W.; Haberle, R.C.; Wyman, S.K.; Alverson, A.J.; Peery, R.; Herman, S.J.; et al. Methods for obtaining and analyzing whole chloroplast genome sequences. Methods Enzym. 2005, 395, 348–384. [Google Scholar] [CrossRef]
- Zhang, Y.; Zhang, A.; Li, X.; Lu, C. The role of chloroplast gene expression in plant responses to environmental stress. Int. J. Mol. Sci. 2020, 21, 6082. [Google Scholar] [CrossRef] [PubMed]
- Yagi, Y.; Shiina, T. Recent advances in the study of chloroplast gene expression and its evolution. Front. Plant Sci. 2014, 5, 61. [Google Scholar] [CrossRef]
- Xiao-Ming, Z.; Junrui, W.; Li, F.; Sha, L.; Hongbo, P.; Lan, Q.; Jing, L.; Yan, S.; Weihua, Q.; Lifang, Z.; et al. Inferring the evolutionary mechanism of the chloroplast genome size by comparing whole-chloroplast genome sequences in seed plants. Sci. Rep. 2017, 7, 1555. [Google Scholar] [CrossRef]
- Wolfe, K.H.; Li, W.-H.; Sharp, P.M. Rates of nucleotide substitution vary greatly among plant mitochondrial, chloroplast, and nuclear DNAs. Proc. Natl. Acad. Sci. USA 1987, 84, 9054–9058. [Google Scholar] [CrossRef] [PubMed]
- Abdullah; Henriquez, C.L.; Mehmood, F.; Hayat, A.; Sammad, A.; Waseem, S.; Waheed, M.T.; Matthews, P.J.; Croat, T.B.; Poczai, P.; et al. Chloroplast genome evolution in the Dracunculus clade (Aroideae, Araceae). Genomics 2021, 113, 183–192. [Google Scholar] [CrossRef]
- Sun, J.; Wang, Y.; Liu, Y.; Xu, C.; Yuan, Q.; Guo, L.; Huang, L. Evolutionary and phylogenetic aspects of the chloroplast genome of Chaenomeles species. Sci. Rep. 2020, 10, 11466. [Google Scholar] [CrossRef] [PubMed]
- Rohwer, J.G. Toward a phylogenetic classification of the Lauraceae: Evidence from matK sequences. Syst. Bot. 2000, 25, 60. [Google Scholar] [CrossRef]
- Chanderbali, A.S.; Van Der Werff, H.; Renner, S.S. Phylogeny and historical biogeography of Lauraceae: Evidence from the chloroplast and nuclear genomes. Ann. Mo. Bot. Gard. 2001, 88, 104–134. [Google Scholar] [CrossRef]
- Song, Y.; Yu, W.B.; Tan, Y.H.; Jin, J.J.; Wang, B.; Yang, J.B.; Liu, B.; Corlett, R.T. Plastid phylogenomics improve phylogenetic resolution in the Lauraceae. J. Syst. Evol. 2019, 58, 423–439. [Google Scholar] [CrossRef]
- Sampson, F.B.; Berry, P.E. “Laurales”. Encyclopedia britannica 2023. Available online: https://www.britannica.com/plant/Laurales (accessed on 23 March 2024).
- Nishida, S.; van der Werff, H. Are cuticular characters useful in solving generic relationships of problematic species of Lauraceae? Taxon 2007, 56, 1229–1237. [Google Scholar] [CrossRef]
- van der Werff, H.; Nishida, S. Yasunia (Lauraceae), a new genus with two species from Ecuador and Peru. Novon A J. Bot. Nomencl. 2010, 20, 493–502. [Google Scholar] [CrossRef]
- Liu, B.; Yang, Y.; Xie, L.; Zeng, G.; Ma, K. Beilschmiedia turbinata: A newly recognized but dying species of Lauraceae from tropical Asia based on morphological and molecular data. PLoS ONE 2013, 8, e67636. [Google Scholar] [CrossRef]
- IUCN 2024. The IUCN Red List of Threatened Species. Version 2023-1. Available online: https://www.iucnredlist.org/search?query=Beilschmiedia&searchType=species (accessed on 23 March 2024).
- van der Werff, H. Studies in Malagasy Lauraceae II: New taxa. Novon 1996, 6, 463–475. [Google Scholar] [CrossRef]
- Werff, H.v.d. A synopsis of the genus Beilschmiedia (Lauraceae) in Madagascar. Adansonia 2003, 25, 77–92. [Google Scholar]
- Song, Y.; Xia, S.W.; Tan, Y.H.; Yu, W.B.; Yao, X.; Xing, Y.W.; Corlett, R.T. Phylogeny and biogeography of the Cryptocaryeae (Lauraceae). Taxon 2023, 72, 1244–1261. [Google Scholar] [CrossRef]
- Rohwer, J.G.; De Moraes, P.L.R.; Rudolph, B.; Werff, H.V.D. A phylogenetic analysis of the Cryptocarya group (Lauraceae), and relationships of Dahlgrenodendron, Sinopora, Triadodaphne, and Yasunia. Phytotaxa 2014, 158, 111–132. [Google Scholar] [CrossRef]
- Doyle, J.J.; Dickson, E.E. Preservation of plant samples for DNA restriction endonuclease analysis. Taxon 2019, 36, 715–722. [Google Scholar] [CrossRef]
- Chen, S.; Zhou, Y.; Chen, Y.; Gu, J. fastp: An ultra-fast all-in-one FASTQ preprocessor. Bioinformatics 2018, 34, i884–i890. [Google Scholar] [CrossRef]
- Jin, J.J.; Yu, W.B.; Yang, J.B.; Song, Y.; dePamphilis, C.W.; Yi, T.S.; Li, D.Z. GetOrganelle: A fast and versatile toolkit for accurate de novo assembly of organelle genomes. Genome Biol. 2020, 21, 241. [Google Scholar] [CrossRef] [PubMed]
- Wick, R.R.; Schultz, M.B.; Zobel, J.; Holt, K.E. Bandage: Interactive visualization of de novo genome assemblies. Bioinformatics 2015, 31, 3350–3352. [Google Scholar] [CrossRef] [PubMed]
- Shi, L.; Chen, H.; Jiang, M.; Wang, L.; Wu, X.; Huang, L.; Liu, C. CPGAVAS2, an integrated plastome sequence annotator and analyzer. Nucleic Acids Res. 2019, 47, W65–W73. [Google Scholar] [CrossRef] [PubMed]
- Kearse, M.; Moir, R.; Wilson, A.; Stones-Havas, S.; Cheung, M.; Sturrock, S.; Buxton, S.; Cooper, A.; Markowitz, S.; Duran, C.; et al. Geneious Basic: An integrated and extendable desktop software platform for the organization and analysis of sequence data. Bioinformatics 2012, 28, 1647–1649. [Google Scholar] [CrossRef] [PubMed]
- Greiner, S.; Lehwark, P.; Bock, R. OrganellarGenomeDRAW (OGDRAW) version 1.3.1: Expanded toolkit for the graphical visualization of organellar genomes. Nucleic Acids Res. 2019, 47, W59–W64. [Google Scholar] [CrossRef] [PubMed]
- Zhang, D.; Gao, F.; Jakovlic, I.; Zou, H.; Zhang, J.; Li, W.X.; Wang, G.T. PhyloSuite: An integrated and scalable desktop platform for streamlined molecular sequence data management and evolutionary phylogenetics studies. Mol. Ecol. Resour. 2020, 20, 348–355. [Google Scholar] [CrossRef] [PubMed]
- Katoh, K.; Standley, D.M. MAFFT multiple sequence alignment software version 7: Improvements in performance and usability. Mol. Biol. Evol. 2013, 30, 772–780. [Google Scholar] [CrossRef]
- Hall, T.A. Bioedit: A user-friendly biological sequence alignment editor and analysis program for windows 95/98/nt. Nucleic Acids Symp. Ser. 1999, 41, 95–98. [Google Scholar]
- Darriba, D.; Taboada, G.L.; Doallo, R.; Posada, D. jModelTest 2: More models, new heuristics and parallel computing. Nat. Methods 2012, 9, 772. [Google Scholar] [CrossRef]
- Ronquist, F.; Teslenko, M.; van der Mark, P.; Ayres, D.L.; Darling, A.; Hohna, S.; Larget, B.; Liu, L.; Suchard, M.A.; Huelsenbeck, J.P. MrBayes 3.2: Efficient Bayesian phylogenetic inference and model choice across a large model space. Syst. Biol. 2012, 61, 539–542. [Google Scholar] [CrossRef] [PubMed]
- Kurtz, S.; Choudhuri, J.V.; Ohlebusch, E.; Schleiermacher, C.; Stoye, J.; Giegerich, R. REPuter: The manifold applications of repeat analysis on a genomic scale. Nucleic Acids Res. 2001, 29, 4633–4642. [Google Scholar] [CrossRef] [PubMed]
- Beier, S.; Thiel, T.; Munch, T.; Scholz, U.; Mascher, M. MISA-web: A web server for microsatellite prediction. Bioinformatics 2017, 33, 2583–2585. [Google Scholar] [CrossRef] [PubMed]
- Krzywinski, M.; Schein, J.; Birol, I.; Connors, J.; Gascoyne, R.; Horsman, D.; Jones, S.J.; Marra, M.A. Circos: An information aesthetic for comparative genomics. Genome Res. 2009, 19, 1639–1645. [Google Scholar] [CrossRef] [PubMed]
- Rozas, J.; Ferrer-Mata, A.; Sanchez-DelBarrio, J.C.; Guirao-Rico, S.; Librado, P.; Ramos-Onsins, S.E.; Sanchez-Gracia, A. DnaSP 6: DNA sequence polymorphism analysis of large data sets. Mol. Biol. Evol. 2017, 34, 3299–3302. [Google Scholar] [CrossRef] [PubMed]
- Tamura, K.; Stecher, G.; Kumar, S. MEGA11: Molecular evolutionary genetics analysis version 11. Mol. Biol. Evol. 2021, 38, 3022–3027. [Google Scholar] [CrossRef] [PubMed]
- Nei, M.; Gojobori, T. Simple methods for estimating the numbers of synonymous and nonsynonymous nucleotide substitutions. Mol. Biol. Evol. 1986, 3, 418–426. [Google Scholar] [CrossRef] [PubMed]
- Wang, D.; Zhang, Y.; Zhang, Z.; Zhu, J.; Yu, J. KaKs_Calculator 2.0: A toolkit incorporating gamma-series methods and sliding window strategies. Genom. Proteom. Bioinform. 2010, 8, 77–80. [Google Scholar] [CrossRef] [PubMed]
- Kimura, M. The neutral theory of molecular evolution and the world view of the neutralists. Genome 1989, 31, 24–31. [Google Scholar] [CrossRef]
- Yang, Z.; Ma, W.; Yang, X.; Wang, L.; Zhao, T.; Liang, L.; Wang, G.; Ma, Q. Plastome phylogenomics provide new perspective into the phylogeny and evolution of Betulaceae (Fagales). BMC Plant Biol. 2022, 22, 611. [Google Scholar] [CrossRef]
- Chen, Q.; Chen, L.; Teixeira da Silva, J.A.; Yu, X. The plastome reveals new insights into the evolutionary and domestication history of peonies in East Asia. BMC Plant Biol. 2023, 23, 243. [Google Scholar] [CrossRef] [PubMed]
- Li, J.; Du, Y.; Xie, L.; Jin, X.; Zhang, Z.; Yang, M. Comparative plastome genomics and phylogenetic relationships of the genus Trollius. Front. Plant Sci. 2023, 14, 1293091. [Google Scholar] [CrossRef] [PubMed]
- Li, H.; Liu, B.; Davis, C.C.; Yang, Y. Plastome phylogenomics, systematics, and divergence time estimation of the Beilschmiedia group (Lauraceae). Mol. Phylogenet Evol. 2020, 151, 106901. [Google Scholar] [CrossRef] [PubMed]
- Zhu, W.; Tan, Y.; Zhou, X.; Song, Y.; Xin, P. The complete plastid genome sequences of the Belian (Eusideroxylon zwageri): Comparative aanalysis and phylogenetic relationships with other Magnoliids. Forests 2023, 14, 2443. [Google Scholar] [CrossRef]
- Song, Y.; Dong, W.; Liu, B.; Xu, C.; Yao, X.; Gao, J.; Corlett, R.T. Comparative analysis of complete chloroplast genome sequences of two tropical trees Machilus yunnanensis and Machilus balansae in the family Lauraceae. Front. Plant Sci. 2015, 6, 662. [Google Scholar] [CrossRef] [PubMed]
- Marechal, A.; Brisson, N. Recombination and the maintenance of plant organelle genome stability. New Phytol. 2010, 186, 299–317. [Google Scholar] [CrossRef] [PubMed]
- Wong, K.H.; Kong, B.L.; Siu, T.Y.; Wu, H.Y.; But, G.W.; Shaw, P.C.; Lau, D.T. Complete chloroplast genomes of Asparagus aethiopicus L., A. densiflorus (Kunth) Jessop M‘yers’, and A. cochinchinensis (Lour.) Merr.: Comparative and phylogenetic analysis with congenerics. PLoS ONE 2022, 17, e0266376. [Google Scholar] [CrossRef]
- Guo, L.; Guo, S.; Xu, J.; He, L.; Carlson, J.E.; Hou, X. Phylogenetic analysis based on chloroplast genome uncover evolutionary relationship of all the nine species and six cultivars of tree peony. Ind. Crops Prod. 2020, 153, 112567. [Google Scholar] [CrossRef]
- Loewe, L.; Hill, W.G. The population genetics of mutations: Good, bad and indifferent. Philos. Trans. R. Soc. Lond. B Biol. Sci. 2010, 365, 1153–1167. [Google Scholar] [CrossRef] [PubMed]
- Castellano, D.; Eyre-Walker, A.; Munch, K. Impact of mutation rate and selection at linked sites on DNA variation across the genomes of humans and other homininae. Genome Biol. Evol. 2020, 12, 3550–3561. [Google Scholar] [CrossRef]
- Clancy, S. Genetic mutation. Nat. Educ. 2008, 1, 187. [Google Scholar]
- Shaw, J.; Lickey, E.B.; Schilling, E.E.; Small, R.L. Comparison of whole chloroplast genome sequences to choose noncoding regions for phylogenetic studies in angiosperms: The tortoise and the hare III. Am. J. Bot. 2007, 94, 275–288. [Google Scholar] [CrossRef] [PubMed]
- Worberg, A.; Quandt, D.; Barniske, A.-M.; Löhne, C.; Hilu, K.W.; Borsch, T. Phylogeny of basal eudicots: Insights from non-coding and rapidly evolving DNA. Org. Divers. Evol. 2007, 7, 55–77. [Google Scholar] [CrossRef]
- Ahmed, I.; Matthews, P.J.; Biggs, P.J.; Naeem, M.; McLenachan, P.A.; Lockhart, P.J. Identification of chloroplast genome loci suitable for high-resolution phylogeographic studies of Colocasia esculenta (L.) Schott (Araceae) and closely related taxa. Mol. Ecol. Resour. 2013, 13, 929–937. [Google Scholar] [CrossRef]
- Xu, S.; Stapley, J.; Gablenz, S.; Boyer, J.; Appenroth, K.J.; Sree, K.S.; Gershenzon, J.; Widmer, A.; Huber, M. Low genetic variation is associated with low mutation rate in the giant duckweed. Nat. Commun. 2019, 10, 1243. [Google Scholar] [CrossRef]
- Dong, W.; Xu, C.; Li, C.; Sun, J.; Zuo, Y.; Shi, S.; Cheng, T.; Guo, J.; Zhou, S. ycf1, the most promising plastid DNA barcode of land plants. Sci. Rep. 2015, 5, 8348. [Google Scholar] [CrossRef] [PubMed]
- Gonzales, M.J.; Dugan, J.M.; Shafer, R.W. Synonymous-non-synonymous mutation rates between sequences containing ambiguous nucleotides (Syn-SCAN). Bioinformatics 2002, 18, 886–887. [Google Scholar] [CrossRef] [PubMed]
- Pond, S.K.; Muse, S.V. Site-to-site variation of synonymous substitution rates. Mol. Biol. Evol. 2005, 22, 2375–2385. [Google Scholar] [CrossRef] [PubMed]
- Lee-Yaw, J.A.; Grassa, C.J.; Joly, S.; Andrew, R.L.; Rieseberg, L.H. An evaluation of alternative explanations for widespread cytonuclear discordance in annual sunflowers (Helianthus). New Phytol. 2019, 221, 515–526. [Google Scholar] [CrossRef]
- Wicke, S.; Schneeweiss, G.M.; dePamphilis, C.W.; Muller, K.F.; Quandt, D. The evolution of the plastid chromosome in land plants: Gene content, gene order, gene function. Plant Mol. Biol. 2011, 76, 273–297. [Google Scholar] [CrossRef]
- Drescher, A.; Ruf, S.; Calsa, T., Jr.; Carrer, H.; Bock, R. The two largest chloroplast genome-encoded open reading frames of higher plants are essential genes. Plant J. 2000, 22, 97–104. [Google Scholar] [CrossRef] [PubMed]
Figure 1.
A phylogenetic tree constructed by Bayesian inference based on the matK gene. (A) A map of species loci in phylogenetic trees. Light green circles represent the recorded sites of the Beilschmiediineae in Africa, with data sourced from GBIF (https://www.gbif.org/ (accessed on 12 March 2024)). The blue circle and the red circle are the species that built the phylogenetic tree, from sub-Saharan Africa and Madagascar, respectively. Sites marked by species name with a black dot in the center indicate the species for which the cp genome was compared in this study. (B) A Bayesian phylogenetic tree based on the matK gene. Different clades are highlighted with different colors. Two species with red font and one species with blue font, all with whole cp genome data, are located in Madagascar and sub-Saharan Africa, respectively. The numbers above the branches are the Bayesian posterior probabilities values.

Figure 2.
A gene map of the plastomes of B. moratii, B. pierreana, and P. microphylla in the family Lauraceae.
Figure 2.
A gene map of the plastomes of B. moratii, B. pierreana, and P. microphylla in the family Lauraceae.
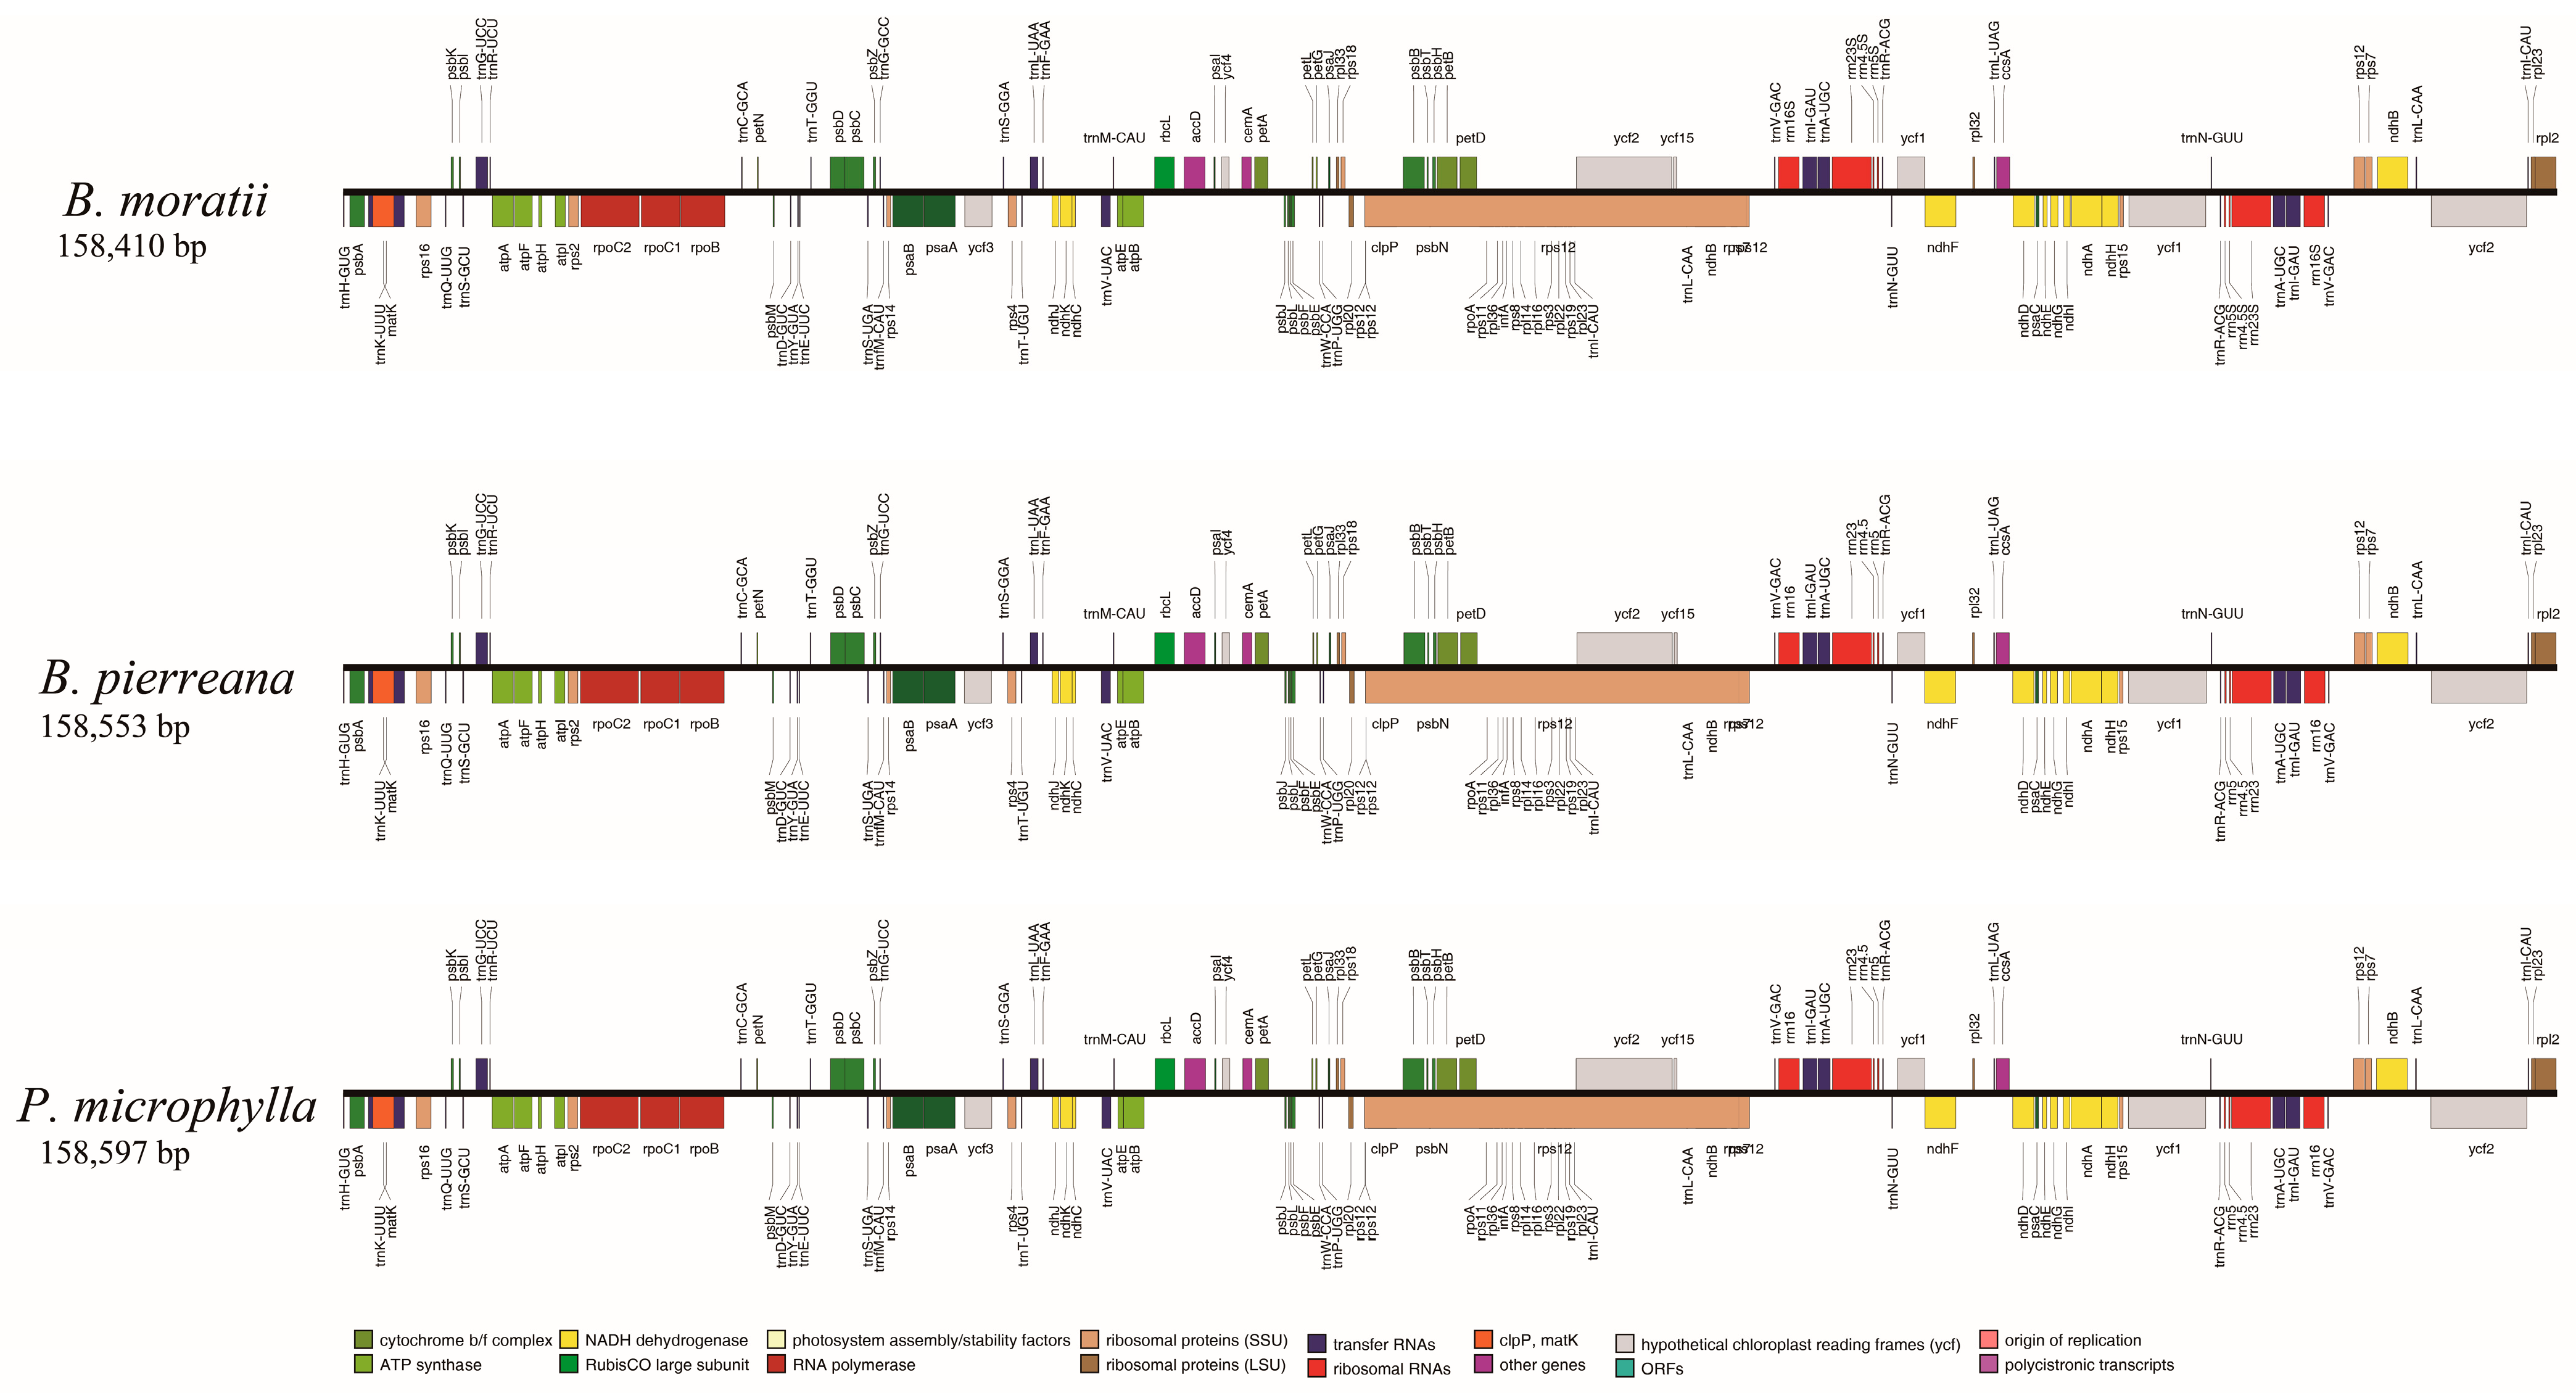
Figure 3.
A comparison of the distribution of repeat sequences and SSRs in the cp genome of B. moratii. (A) A distribution map of repeat sequence and SSRs in cp genome. The innermost yellow line represents forward repeats (F), the green line represents palindromic repeats (P), the red line represents reverse repeats (R), and the black line represents complement repeats (C). The blue circle in the innermost circle represents the density of SSR. The outermost circle is the physical map of the cp genome, the two thick black lines are the IR regions, the blue lines are the SSC region, and the green lines are the LSC region. (B) The number of repeats of different types. (C) The type frequency of SSR motifs in different repeat class types.

Figure 4.
The number of indels in different types and regions. (A) The number of indels distributed in different regions. (B) The number of different types of indels.
Figure 4.
The number of indels in different types and regions. (A) The number of indels distributed in different regions. (B) The number of different types of indels.

Figure 5.
The number of SNPs in different types and regions. (A) The number of SNPs distributed in different regions. (B) The number of different types of SNPs.
Figure 5.
The number of SNPs in different types and regions. (A) The number of SNPs distributed in different regions. (B) The number of different types of SNPs.

Figure 6.
A comparison of the nucleotide variability (π) values. (A) The nucleotide variability of Matrix Ⅰ and Matrix Ⅳ, the red line represents Matrix Ⅰ, which includes B. moratii and P. microphylla, while the blue line represents Matrix IV, including B. moratii, P. microphylla, and B. pierreana. (B) The nucleotide variability in Matrix Ⅱ, which includes B. moratii and B. pierreana. (C) The nucleotide variability of Matrix Ⅲ, which includes P. microphylla and B. pierreana. In the figure, red circles represent SNP sites and blue circles represent indel sites.

Figure 7.
The Ka, Ks, and Ka/Ks nucleotide substitution values of B. moratii, P. microphylla, and B. pierreana. (A) The Ks values of 86 PCGs. (B) The Ka values of 86 PCGs. (C) The Ka/Ks values for 40 potential selection genes.
Figure 7.
The Ka, Ks, and Ka/Ks nucleotide substitution values of B. moratii, P. microphylla, and B. pierreana. (A) The Ks values of 86 PCGs. (B) The Ka values of 86 PCGs. (C) The Ka/Ks values for 40 potential selection genes.


Table 1.
Pairwise nucleotide divergences of the three plastomes of Beilschmiediineae.
| Beilschmiedia moratii | Potameia microphylla | Beilschmiedia pierreana | |
|---|---|---|---|
| Beilschmiedia moratii | - | 0.00283 | 0.00459 |
| Potameia microphylla | 0.00283 | - | 0.00405 |
| Beilschmiedia pierreana | 0.00459 | 0.00405 | - |
Disclaimer/Publisher’s Note: The statements, opinions and data contained in all publications are solely those of the individual author(s) and contributor(s) and not of MDPI and/or the editor(s). MDPI and/or the editor(s) disclaim responsibility for any injury to people or property resulting from any ideas, methods, instructions or products referred to in the content. |
© 2024 by the authors. Licensee MDPI, Basel, Switzerland. This article is an open access article distributed under the terms and conditions of the Creative Commons Attribution (CC BY) license (https://creativecommons.org/licenses/by/4.0/).
Share and Cite
MDPI and ACS Style
Zhu, W.; Zhang, H.; Li, Q.; Cao, Z.; Song, Y.; Xin, P. Complete Plastid Genome Sequences of Three Tropical African Beilschmiediineae Trees (Lauraceae: Crytocaryeae). Forests 2024, 15, 832. https://doi.org/10.3390/f15050832
AMA Style
Zhu W, Zhang H, Li Q, Cao Z, Song Y, Xin P. Complete Plastid Genome Sequences of Three Tropical African Beilschmiediineae Trees (Lauraceae: Crytocaryeae). Forests. 2024; 15(5):832. https://doi.org/10.3390/f15050832
Chicago/Turabian StyleZhu, Wen, Haorong Zhang, Qishao Li, Zhengying Cao, Yu Song, and Peiyao Xin. 2024. "Complete Plastid Genome Sequences of Three Tropical African Beilschmiediineae Trees (Lauraceae: Crytocaryeae)" Forests 15, no. 5: 832. https://doi.org/10.3390/f15050832
Note that from the first issue of 2016, this journal uses article numbers instead of page numbers. See further details here.