
Streamflow Variation under Climate Conditions Based on a Soil and Water Assessment Tool Model: A Case Study of the Bailong River Basin


1
School of Geographical Sciences, Hebei Key Laboratory of Environmental Change and Ecological Construction, Hebei Technology Innovation Center for Remote Sensing Identification of Environmental Change, Hebei Normal University, Shijiazhuang 050024, China
2
MOE Key Laboratory of Western China’s Environmental Systems, College of Earth and Environmental Sciences, Lanzhou University, Lanzhou 730000, China
3
School of Earth Sciences, Lanzhou University, Lanzhou 730000, China
*
Author to whom correspondence should be addressed.
Sustainability 2024, 16(10), 3901; https://doi.org/10.3390/su16103901
Submission received: 1 April 2024
/
Revised: 25 April 2024
/
Accepted: 30 April 2024
/
Published: 7 May 2024
Abstract
:We coupled the global climate models (GCMs) from the sixth phase of the Coupled Model Intercomparison Project (CMIP6) and Future Land Use Simulation model (FLUS) to evaluate land use change in the Bailong River Basin (BRB) under three shared socioeconomic pathway and representative concentration pathway scenarios (SSP1–2.6, SSP2–4.5, SSP5–8.5). Additionally, we used calibrated soil and water assessment tools (SWATs) to evaluate the streamflow in the BRB from 2008 to 2100 under the combined influence of climate and land use changes. The results indicate that (1) under the SSP126-EP scenario, forests have been well preserved, and there has been an increase in the combined area of forests and water bodies. The SSP245-ND scenario has a similar reduction pattern in agricultural land as SSP126-EP, with relatively good grassland preservation and a moderate expansion rate in built-up land. In contrast, the SSP585-EG scenario features a rapid expansion of built-up land, converting a significant amount of farmland and grassland into built-up land. (2) From 2021 to 2100, the annual average flow increases under all three scenarios, and the streamflow change is most significant under SSP5–8.5. (3) Compared to the baseline period, the monthly runoff increases, with the most significant increase occurring during the summer months (June to August). This study offers a thorough assessment of potential future changes in streamflow. Its findings are expected to be applied in the future to improve the management of water resources at a local level.

1. Introduction
Climate change can significantly impact the components of societal services, such as agriculture, water resources, and ecology [1]. The Intergovernmental Panel on Climate Change reports that average global surface temperatures during the period 2001–2020 were 0.84–1.10 °C higher compared to pre-industrial levels (1850–1900). Since the 1950s, there has been a notable rise in both the frequency and intensity of intense precipitation events across the majority of land regions [2]. If CO2 and other greenhouse gas emissions are not significantly reduced, warming in the 21st century is expected to exceed 1.5 °C and 2 °C [2]. With the further intensification of global warming, rising temperatures have led to increased evapotranspiration and atmospheric water vapor content, altering precipitation patterns and intensity. This exacerbates global hydrology [3,4,5] and significantly affects streamflow [6,7]. In recent years, the impact of climate change on streamflow, particularly the potential changes in streamflow under different future climate scenarios, has become a focus of scholarly attention [8,9]. The Coupled Model Intercomparison Project Phase 6 (CMIP6) has introduced ScenarioMIP, a project based on shared socioeconomic pathways (SSPs) and representative concentration pathways (RCPs) aimed at enhancing climate modeling and forecasting [10]. ScenarioMIP offers valuable data for addressing water resource concerns. Incorporating these forecasted scenarios into hydrological models can improve our comprehension of how climate change and societal factors impact the hydrological system’s physical processes [11]. Evaluating how climate change affects the hydrological system is essential for developing adaptive approaches in water resource management, mitigating debris flow risks, and ensuring ecological preservation [12,13]. This evaluation usually entails acquiring projected climate variables, like precipitation and temperature, from climate models, and incorporating them into hydrological models to simulate forthcoming hydrological processes. Shiferaw et al. [14] applied downscaled outputs from CMIP5 climate models to fuel the soil and water assessment Tool (SWAT), predicting streamflow in Ethiopia’s northern Ilala watershed for different periods in the 21st century. The findings indicated that under RCP4.5, streamflow rose by 1.74% to 0.74% compared to the baseline period of 1980–2009, while under RCP8.5, it increased by 0.76% to 0.36%.
In addition to climatic factors, changes in basin streamflow are influenced by anthropogenic factors [15]. Streamflow in a basin is influenced by anthropogenic factors, with land use and land cover (LUCC) representing the most direct factor [16]. This change significantly impacts hydrological processes in the basin, including surface evaporation, surface vegetation interception, and soil hydrological conditions, thus affecting the basin’s water balance [17]. Relevant studies have indicated that neglecting LUCC increases the uncertainty in streamflow predictions [18,19,20]. Consequently, the impact of LUCC cannot be overlooked in basin streamflow prediction studies. Nonetheless, present research still has limitations when forecasting basin streamflow under the joint impact of climate change and LUCC.
In terms of land use prediction, much of the related research assumes that future LUCC will continue past developmental trends. Land use simulation serves as a crucial element in land use/land cover (LULC) investigations, allowing for simulations to occur over a brief period by leveraging current land classification data [21]. Cellular automata (CA) have been extensively employed as a geographical model to simulate and analyze the spatiotemporal variations in LULC influenced by different factors and driving forces [22,23]. While most research on CA modeling has focused on improving technical methods and model accuracy, there is a lack of understanding of the fundamental concepts of the model and research on the causes of LULC changes [24]. The FLUS model is developed based on the CA model [25]. The model integrates the foundational aspects of CA models while leveraging machine learning techniques to grasp intricate connections between land use transformations and their influential factors. This integration enhances the precision of land use simulations [26]. Most existing streamflow prediction studies typically use historical land use data. However, we projected future LUCC using the FLUS model, integrating it with more dependable CMIP6 global climate model (GCM) data to forecast streamflow variations in the 21st century within the BRB.
The BRB is a high-risk region prone to debris flows, with the regular incidence of such events presenting a significant hazard to the lives and possessions of the local population [27]. Surface hydrological processes play a crucial role in forming debris streamflows, with surface streamflows being particularly prominent. When the material carried by surface streamflow reaches a certain level, a highly hazardous debris streamflow is formed [28]. Accurately predicting future variations in streamflow is crucial for effective disaster prevention related to debris flows and for ensuring sustainable socioeconomic development in the area. Our research objective is (1) to build a SWAT model suitable for the BRB and (2) to simulate LUCC in the BRB from 2040 to 2100 using the FLUS model under three scenarios (SSP1–2.6, SSP2–4.5, SSP5–8.5). (3) Based on the constructed SWAT model and using reliable GCMs results and simulated LUCC scenarios to simulate streamflow in the BRB in the 21st century, we aim to comprehensively reveal potential changes in future streamflow in the BRB and provide references concerning the management and preservation of water resources in watershed environments.
2. Materials and Methods
2.1. Study Area
The BRB, situated in the southern Gansu Province, serves as a key right bank tributary of the Jialing River positioned around 32°36′–34°24′ N and 103°00′–105°30′ E and covering a total area of 17,756 km2 (Figure 1). Originating at the junction of Luqu County in the Gannan Tibetan Autonomous Prefecture, Gansu Province, and Ruoergai County in Sichuan Province near Langmusi, it flows from northwest to southeast across Diebu County, Tanchang County, Zhouqu County, Wudu District, and Wen County before merging with the Jialing River in Sichuan Province. The research area is a typical arid and hot river valley region, featuring an annual mean temperature spanning from −3.86 °C to 15.72 °C and an annual average precipitation of 500–900 mm. During the months of June to September, 80% of the total annual precipitation occurs, with frequent heavy rain in the summer [29]. Climatic conditions cause streamflow in this basin to exhibit significant spatiotemporal differences, making it highly prone to debris flows. Streamflow variations within the research area are extremely important for ensuring the normal operation of local ecological security and socioeconomic systems.
2.2. Data Source and Pre-Processing
The land use data was collected from the natural resource bureaus of five counties in the BRB for the second (2010) and third (2020) national land use surveys. The soil database is sourced from the National Cryosphere Desert Data Center (NCDC) and consists of two parts: a spatial database and an attribute database. The spatial database delineates the spatial arrangement of diverse soil types, whereas the attribute database encapsulates the physical and chemical characteristics of each soil type, encompassing factors like depth, texture, and predominant elemental composition. Daily meteorological data, comprising measurements like precipitation, maximum and minimum temperatures, solar radiation, relative humidity, and wind speed, is sourced from the meteorological station records maintained by the National Meteorological Center. The hydrological data consisted of real measurements collected from hydrological stations located along the Bailong River, including daily streamflow monitoring data from two hydrological stations in Wudu District and Bikou Town from 2005 to 2020. These data were utilized for the calibration and validation of parameters in the SWAT model (Table 1).
The CMIP6 model emphasizes the driving role of different socioeconomic development patterns in climate change through coupled SSPs and RCPs (SSP-RCPs) [30]. We used the following three typical SSP-RCP scenarios to consider a wider range of possibilities for future development. SSP1–2.6 (a combination of SSP1 and RCP2.6) represents a sustainable and green development pathway, emphasizing sustainable socioeconomic growth, low greenhouse gas emissions, and a focus on more inclusive development. SSP2–4.5 (a combination of SSP2 and RCP4.5) represents a middle-of-the-road pathway, reflecting a world that follows an intermediate socioeconomic and technological development path with moderate greenhouse gas emissions. SSP5–8.5 (a combination of SSP5 and RCP8.5) epitomizes a high-end forcing pathway marked by resource-intensive development, material-intensive consumption practices, and elevated reliance on fossil fuels, leading to increased greenhouse gas emissions [31].
Given that enhanced resolution facilitates improved capture of climate diversity in the intricate topography of the BRB, we opted for ten GCMs from various nations featuring relatively high spatial resolutions (Table A1) [32]. We downloaded GCM data for precipitation, downward surface shortwave radiation, surface air temperature (tas), maximum surface air temperature, minimum surface air temperature, surface relative humidity, and surface wind speed from the Lawrence Livermore National Laboratory website for the period 2000–2100 within the study area. We also validated the model data accuracy using meteorological station measurements from 2000 to 2020.
This study graphically represents monthly precipitation and minimum and maximum temperatures for the historical period (2000–2020) using Taylor diagrams (Figure 2 and Figure 3) for ten models. The BCC-CSM2-MR simulation demonstrated a substantial correlation coefficient of 0.8 when compared to the observed data, showcasing a high level of reliability within the BRB. Therefore, this study selected the BCC-CSM2-MR model, which demonstrates a relatively good simulation performance within the study area for future [33] projects and was developed by the National Climate Center of the China Meteorological Administration. It is a multi-layer coupled global climate–carbon cycle model with advantages in simulating China’s regional climate [34]. The four future periods chosen are 2021–2040, 2041–2060, 2061–2080, and 2081–2100, and the baseline period selected was 2008–2020.
The 1 km × 1 km population and Gross Domestic Product (GDP) spatial grid data were sourced from the Resource and Environmental Science Data Centre of the Chinese Academy of Sciences. Concurrently, the population and economic gridded datasets corresponding to the SSPs were retrieved from the Science Data Bank at https://www.scidb.cn/en/detail?dataSetId=73c1ddbd79e54638bd0ca2a6bd48e3ff&dataSetType=organization (accessed on 1 April 2024).
2.3. FLUS Model
The FLUS model was utilized for simulating LUCC within the BRB. Initially, we classified land use into 13 distinct classes based on basin-specific land use types. Sixteen spatial driving factors were then chosen to train the Artificial Neural Network (ANN) model (Table 2). These 13 land use categories are aligned with 13 output layers. The model underwent training on these driving factors and existing land use data to generate a probability distribution map. Subsequently, leveraging the adaptive inertia competition module within the FLUS model, starting from the land use configuration in 2010, we projected and analyzed land use transformations up to 2020. To validate these projections, we compared and assessed the simulated outcomes against the actual land use data for 2020 using the Kappa statistic.
where P0, Pc, and Pp denote the proportion of correct simulations, the correct proportion of the model under random conditions, and the proportion of correct simulations under ideal classification conditions. The verification outcomes indicated an overall accuracy and Kappa coefficient of 84.25% and 88.81%, respectively. These results validate that the simulation accuracy aligns with expectations, indicating that the model adequately captures LUCC patterns in the BRB. Consequently, the simulation outcomes are deemed reliable and suitable for predicting land use scenarios for 2040, 2060, 2080, and 2100 [35,36].
In this study, three prominent SSP-RCP scenarios from CMIP6 were chosen and integrated with potential future development models to create the following scenarios:
- SSP1–2.6 and the Ecological Protection Scenario (SSP126-EP): Emphasizing ecological preservation, this scenario prioritizes social and economic progress guided by ecological protection, achieving sustainable green development.
- SSP2–4.5 and the Natural Development Scenario (SSP245-ND): This scenario is rooted in the existing trajectory of land use development evolution without significant alterations.
- SSP5–8.5 and the Economic Growth Scenario (SSP585-EG): Focused on economic advancement, this scenario is centered on maximizing economic growth, heavily relying on extensive fossil fuel utilization and economic enhancement [37].
To investigate LUCC under diverse SSP-RCP scenarios, four primary driving factors were selected—GDP, population, temperature, and precipitation. These factors are anticipated to undergo substantial changes in future scenarios, exerting significant influences on LUCC [38].
2.4. SWAT Model
The SWAT, originating in the United States, stands as one of the initial semi-distributed watershed hydrological models and is designed to evaluate the evolving effects of watershed management strategies on water, sediment, and nutrients [39]. Given its unrestricted accessibility, the SWAT has found extensive utilization across global watershed management contexts encompassing diverse physical attributes [40,41]. We used ArcSWAT2012 to establish a surface water hydrological model of the BRB. We input meteorological data and the location data for weather stations within and near the BRB. Moreover, within the SWAT model, soil information, vegetation data, and a weather generator were incorporated to replicate streamflow dynamics in the BRB from 2005 to 2100.
The SWAT-CUP automatic calibration tool optimized the model using streamflow observations from hydrological stations. In our evaluation of the model, we utilized the coefficient of determination (R2) and the Nash–Sutcliffe efficiency (NSE). In the SWAT calibration and validation outcomes, a model simulation was considered effective when the NSE exceeded 0.50 and R2 surpassed 0.50, indicating a satisfactory model performance [42].
where is the ith observation value; is the average observation value; is the ith simulated value; is the average simulated value.
3. Results
3.1. Lucc Prediction Based on SSP-RCP Scenarios
The spatial distribution maps illustrating land use forecasts (Figure 4, Figure 5 and Figure 6) reveal that forested regions, predominantly comprising forested land, constitute the majority (66.63–76.88%) and are predominantly situated in the western and southern sectors of the research area. The most extensive coverage is observed in Diebu County. Grasslands come next (comprising 8.18–11.54%) and are mainly located on the slopes of the valley. Farmland and built-up land are concentrated in flat regions along the Bailong River and its tributaries. Wudu District has the largest area of built-up land, and Tanchang County has the most extensive area of farmland.
Under the SSP126-EP scenario, from 2040 to 2100, farmland is primarily converted to forestland (11.1%), followed by built-up land and water bodies. Approximately 37.17% of the unused land was converted into grassland and forestland. Specifically, 19.97% and 4.24% of grasslands were converted to forests and orchards, respectively. Furthermore, 14.67% of built-up land has been transformed into forestland. These changes increased in forestland and water bodies, whereas built-up land, farmland, and unused land decreased (Figure 7).
In the SSP245-ND scenario, in contrast to the SSP126-EP scenario, a substantial conversion of forestland occurred, with 6713.2 km2 being transformed into farmland and 44,983.89 km2 into grassland. This transition resulted in a notable decrease in forest and farmland areas, accompanied by an expansion in grassland and built-up areas, as depicted in Figure 8.
In the context of the SSP585-EG scenario, distinct alterations in land types emerged when compared to the SSP1–2.6 and SSP2–4.5 scenarios. Particularly noteworthy was the notable increase in the conversion of farmland to built-up areas. From 2040 to 2100, a significant shift was observed, with 1.96% of farmland being transformed into built-up areas. However, 4.04%, 5.48%, and 6.56% of forestland, grassland, and orchard areas were converted to farmland. Additionally, 6.0% of the grassland and 2.0% of the orchard areas were converted into forestland. In summary, both forest and grassland areas decreased overall, whereas built-up land and farmland areas increased (Figure 9).
The results of the above scenario simulation show that the range of LUCC will increase between 2040 and 2100, promoting the conversion of grassland and farmland into forestland and built-up land. The scale of mutual conversion of farmland, grassland, and forestland has increased, mainly occurring around human settlements on both sides of the Bailong River [43]. Research shows that under the SSP126-EP scenario, ecological projects such as “natural forest protection” and “returning farmland to forest and grassland” promote ecological protection in the Bailongjiang River Basin, which also leads to the conversion of farmland into forestland and water bodies [44]. Under the SSP245-ND scenario, precipitation and temperature are at moderate levels under suitable weather conditions, which also provides the basis for the development of agriculture, resulting in an increase in farmland and a large-scale reduction in forestland [26]. The SSP585-EG scenario represents a development model with high fossil fuel consumption and rapid economic growth, resulting in a significant increase in the size of built-up land. From 2021 to 2100, the total population of SSP585 is the lowest and shows a decreasing trend. However, this scenario has the highest urbanization rate and the largest urban population. Compared with rural populations, urban populations generally have higher food demands and consumption [45], resulting in the greatest demand for farmland. In summary, economic, demographic, and climatic factors are important influencing factors of future LUCC [46].
3.2. Historical Streamflow in the BRB
In our study of the BRB utilizing the SWAT model, we employed a warm-up period spanning from 2005 to 2007, followed by a calibration phase from 2008 to 2009 and a validation period from 2010 to 2011. The model calibration and validation were based on runoff data sourced from two hydrological stations, specifically Wudu at sub-basin 24 and Bikou at sub-basin 41. To improve the accuracy of the model simulation, the model parameters were first calibrated for the monthly flow (Figure A1 and Figure A2). After passing the parameter calibration, the calibrated parameter range was re-entered into the model, and the results obtained were calibrated for daily runoff.
During the period from 2008 to 2020, there was a distinct upward trend in streamflow, indicating consistent growth. The streamflow exhibited an increasing trend with a growth rate of 0.314 m3/s per year. From upstream to downstream, the streamflow gradually increases, and the trend of streamflow change is consistent (Figure 10). The smallest streamflow is observed at the Zhouqu station in the upper reaches (with a mean annual streamflow of 74.31 m3/s), but it shows the most significant increasing trend over time (with a growth rate of 4.50 m3/s per year). The streamflow at the Wudu station ranks second, with an annual average of 107.65 m3/s and an annual growth rate of 3.05 m3/s, which is lower than that of the Zhouqu station. Conversely, the Bikou station downstream had the largest streamflow of 134.42 m3/s, yet it had the smallest annual growth rate of 2.58 m3/s (Figure A3).
3.3. Prediction of Streamflow in the BRB
3.3.1. Interannual Changes in Streamflow from 2040 to 2100
In our analysis, GCMs were employed to project future levels of various climatic factors, comprising precipitation, temperature, solar radiation, wind speed, and relative humidity (Figure A4), and were combined with the FLUS model to predict LUCC under different SSP-RCP scenarios (Figure 4, Figure 5 and Figure 6). Subsequently, we integrated these data with the SWAT model to simulate future hydrological processes. Figure 11 shows the increasing trends in streamflow under different scenarios from 2021 to 2100. Among these, the SSP5–8.5 scenario exhibits the most significant streamflow increase trend (0.0436 m3/s/year), followed by SSP2–4.5 (0.0195 m3/s/year), SSP1–2.6 has the lowest increase trend (0.0177 m3/s/year). Attribution analysis indicated that global climate models estimate a greater increase in streamflow due to future precipitation, whereas the increase in evaporation is relatively small. This suggests that evapotranspiration is less sensitive to radiation, water vapor transport, and vegetation greening, leading to increased streamflow [11]. Compared to the baseline period (2005–2020), the streamflow increased by 58.20–191.83% under the SSP1–2.6 scenario, 46.48–195.63% under SSP2–4.5, and 50.96–203.39% under SSP5–8.5, indicating that the streamflow change is most significant under SSP5–8.5. Forested areas in the BRB account for over 70% of the total area, with high vegetation coverage and low levels of human development, resulting in a relatively moist natural environment. In a high-emission scenario, rapid socioeconomic development and intensified urbanization could lead to changes in future land use patterns and decreased vegetation coverage, gradually leading to a drier basin [47].
3.3.2. Monthly Changes in Streamflow from 2040 to 2100
The trends in mean monthly runoff are largely consistent across all three scenarios, with the highest streamflow occurring in July (57.68 m3/s, 55.68 m3/s, and 59.89 m3/s, respectively), followed by August and June, while January and February exhibit the lowest streamflow. The median change in streamflow for the winter months (January, February, and December) was close to zero, suggesting that the predicted mean monthly runoff may have remained at historical levels. However, the median change in streamflow is greater than zero for the other months, with the most significant increases occurring during the summer months (June, July, and August) (Figure 12).
In addition, we compared the differences between the predicted annual maximum monthly runoff from 2021 to 2100 and the maximum monthly runoff during the baseline period from 2008 to 2020. Figure 13 shows that the intra-annual differences in the maximum monthly runoff were significantly more pronounced than the differences in the monthly average streamflow. There is a notable increase in the maximum monthly runoff when compared to the baseline period, particularly evident from May to September. The sensitivity of the maximum monthly runoff to climate change varied across the different scenarios. Among the scenarios, SSP5–8.5 exhibits the greatest fluctuations in the maximum monthly runoff within the year, followed by SSP2–4.5, while SSP1–2.6 shows the smallest fluctuations. As per the future climate change projections within the SSP1–2.6 scenario, the maximum monthly runoff occurred in August (73.20 m3/s), followed by July (72.61 m3/s); under SSP2–4.5, the maximum is in July (95 m3/s), and under SSP5–8.5, the maximum occurred in June (115 m3/s). Based on the median changes in the maximum monthly runoff, the predicted variation in the maximum monthly runoff between 2021 and 2100 ranges from 22.17% to 73.17%. The smallest change occurred in March under SSP4–2.5, whereas the largest change occurred in August under SSP5–8.5.
4. Discussion
4.1. Analysis of Changes in Streamflow
Numerous research studies have examined how climate change affects the flow of rivers [48,49]. Numerous studies have extensively employed GCMs to predict and quantify how climate change affects streamflow [50,51,52]. The results indicate that under different RCPs, streamflow changes exhibit significant spatial variability. For instance, In a study by Shrestha et al. (2018) [53], it was observed that under the RCP8.5 and RCP4.5 scenarios, there was a reduction in future streamflow by 19.5% and 24% in Thailand, respectively. However, Wen et al. (2018) [54] reported that future scenarios under RCP2.6, RCP4.5, and RCP8.5 indicate that streamflow in southeastern China will rise due to increasing temperatures and precipitation. According to our scenario analysis, most of the streamflow increase is due to climate change, resulting in an increase of 0.557 m3/s, accounting for 90.075% of the total change (Figure 14a). Therefore, change is the main factor contributing to increased streamflow in the basin. Generally, increased precipitation leads to increased streamflow; however, higher temperatures can reduce streamflow by increasing evaporation.
However, the complete examination of how LUCC influences streamflow remains incomplete, with variations in this impact based on the specific watershed and scenario. We analyze the impact of land use changes on runoff through scenario comparison. The results indicate that the impact of land use on streamflow is less significant than climate change, with streamflow changes ranging from −0.51 to 1.20 m3. Regions where LUCC promoted an increase in streamflow accounted for 62.54% and are mainly located in the mainstream of the Bailong River and the two banks of the Min River (Figure 14b). Human activities densely populate these regions, and increased construction land leads to increased streamflow. As urbanization accelerates, the built-up area has expanded significantly, leading to an expansion of impervious surfaces and a sharp increase in both short- and long-term streamflow [55,56,57]. The areas experiencing a decrease in streamflow are mainly located between Zhouqu County and Wen County in the western part of the study area. Since the 1990s, the BRB has implemented a series of large-scale afforestation and forest conservation projects, such as the “natural forest conservation project” and the “returning farmland to forest project” [58]. The significant increase in forest area has successfully alleviated issues, such as soil erosion, dust storms, desertification, and debris flow disasters. However, large-scale afforestation increases evaporation and reduces streamflow [59,60,61]. However, some studies have indicated that converting forests to farmland and grassland may increase mean annual streamflow [62]. We simulated the scenarios (SSP126-EP) in which the proportion of forestland was the highest and farmland and built-up land were the smallest. In contrast, in the SSP585-EG scenario, forestland notably decreases, whereas farmland and built-up land increase. From 2021 to 2100, the upward trend in streamflow in the SSP5–8.5 scenario exceeded that of the SSP1–2.6 and SSP2–4.5 scenarios. Hence, it is essential to assess the influence of climate change on hydrology and evaluate how various LULC management policies impact streamflow in order to enhance water resource management [63,64].
4.2. Shortcomings and Prospects
- (1)
- Future studies on climate change and its impacts inevitably involve uncertainty. Although employing multiple GCMs can mitigate some of these uncertainties, there are still shortcomings. Subsequent research could select superior-performing climate models to investigate future climate change and its impacts or attempt ensemble modeling methods, such as multi-model median approaches, and ensemble methods based on the allocation of weights according to model performance, to reduce prediction uncertainties further. Moreover, this study focused exclusively on three SSP-RCP scenarios (SSP1–2.6, SSP2–4.5, SSP5–8.5) Subsequent research should consider more climate projection scenarios to reduce the uncertainties associated with climate scenarios.
- (2)
- For the SWAT hydrological model employed in the streamflow prediction process, uncertainty in the input data can lead to uncertainty in the model simulations. Future research should thoroughly investigate the influence of data accuracy and resolution differences on the simulation results. Bosshard et al. (2013) [65] quantitatively calculated the contributions of GCMs, statistical methods, and hydrological models to the uncertainty of short-term and long-term hydrological simulations in the Rhine River Basin based on variance analysis methods. Jung et al. (2011) [66] considered five factors, including GCM structure, future greenhouse gas emission scenarios, LUCC scenarios, natural variability, and hydrological model parameters, to quantify uncertain effects on urban flood changes. The results show that from 2040 to 2069, climate change has a greater impact on basin floods than LUCC.
- (3)
- During the streamflow prediction process, our focus was on examining the response of streamflow in the BRB to the combined effects of climate change and LUCC, with a deliberate exclusion of human activities, like water resource development and utilization from consideration. Indeed, real-world human activities, such as constructing reservoirs, implementing water intake projects, and modifying water usage patterns, have the potential to modify the water cycle within the basin, consequently influencing the generation and development of streamflow. Future research efforts should aim to enhance our comprehension of how climate change, LUCC, water resource management strategies, and human interventions collectively influence streamflow dynamics.
5. Conclusions
We used the BCC-CSM2-MR model data suitable for the BRB combined with the FLUS model and adopted three SSP-RCPs (SSP126-EP, SSP245-ND, SSP585-EG) to predict the LUCC in the BRB from 2040 to 2100. Using the SWAT hydrological model, we forecasted alterations in streamflow within the BRB considering the joint impact of climate change and LUCC. Our objective was to offer decision-making guidance for water resource management and disaster mitigation in the region. The principal research findings are outlined below.
(1) Between 2008 and 2020, streamflow within the BRB displayed a fluctuating upward trajectory, primarily influenced by climate change and resulting in a noticeable increase in streamflow. Compared to the impact of LUCC, the influence of climate change on streamflow was more prominent (contribution rate ranging from 86.17% to 90.10%). (2) We examined the context of different scenarios. In the SSP126-EP scenario, forestland preservation was effective, leading to expansions in forested areas and water bodies. In the SSP245-ND scenario, similar to SSP126-EP, a significant reduction in farmland with preserved grasslands and moderate built-up land expansion was found. In the SSP585-EG scenario, notably, there was built-up land expansion, extensive farmland, and grassland conversions to built-up land, which were especially concentrated along the Bailong River. (3) Across all scenarios, streamflow demonstrates a rising trend from 2021 to 2100, with SSP5–8.5 indicating the most substantial increase (0.195 m3/s/year). Summer streamflow exhibits the highest values and the most pronounced rise, while maximum monthly runoff variations surpass mean monthly runoff fluctuations significantly. (4) Future research should apply more climate scenarios and fuse data to be more suitable for the BRB.
Author Contributions
Conceptualization, S.L. and Y.Z. (Yanyan Zhou); methodology, Y.Z. (Yan Zhao); software, Y.Z. (Yan Zhao); validation, S.L., Y.Z. (Yanyan Zhou) and D.Y.; formal analysis, S.L.; investigation, Y.Z. (Yanyan Zhou); resources, Y.Z. (Yanyan Zhou); data curation, S.L.; writing—original draft preparation, S.L.; writing—review and editing, Y.Z. (Yanyan Zhou); visualization, S.L.; supervision, Y.Z. (Yanyan Zhou); project administration, D.Y.; funding acquisition, Y.Z. (Yanyan Zhou). All authors have read and agreed to the published version of the manuscript.
Funding
This work was supported by the Science Foundation of Hebei Normal University (Grant No. L2024B26), the Major Scientific and Technological Projects of Gansu Province (Grant No. 22ZD6FA051), the National Natural Science Foundation of China (Grant No. 42077230), and the Second Tibetan Plateau Scientific Expedition and Research program (Grant No. 2021QZKK0204).
Institutional Review Board Statement
Not applicable.
Informed Consent Statement
Not applicable.
Data Availability Statement
No new data were created or analyzed in this study. Data sharing is not applicable to this article.
Conflicts of Interest
The authors declare no conflicts of interest.
Appendix A
Figure A1.
Monthly measurement and verification results of SWAT models at Wudu and Bikou stations.

Figure A2.
Daily measurement and verification results of SWAT models at Wudu and Bikou stations.

Figure A3.
Interannual variation of streamflow in the BRB from 2008 to 2020.

Figure A4.
Climate data under different scenarios in the Bailong River Basin from 2020 to 2100.


Table A1.
Basic information of 10 GCMs.
| Number | Model Name | Country | Institution | Number of Grids |
|---|---|---|---|---|
| 1 | BCC-CSM2-MR | China | Beijing Climate Center | 160 × 320 |
| 2 | EC-Earth3-Veg | Europe | EC Earth consortium | 256 × 512 |
| 3 | GFDL-ESM4 | USA | Geophysical Fluid Dynamics Laboratory | 180 × 288 |
| 4 | MRI-ESM2-0 | Japan | Meteorological Research Institute | 160 × 320 |
| 5 | MPI-ESM1-2-HR | Germany | Max-Planck-Institut fiir Meteorologie | 192 × 384 |
| 6 | NORESM2-MM | Europe | NorESM Climate Modeling Consortium | 192 × 288 |
| 7 | SAM0-UNICON | Korea | Seoul National University | 192 × 288 |
| 8 | INM-CM4-8 | Russia | Russian Institute for Numerical Mathematics Climate Model | 120 × 180 |
| 9 | CNRM-CM6-1 | France | Centre National de Recherches Meteorologiques | 256 × 128 |
| 10 | MIRCO6 | Japan | Japanese Research Community | 128 × 256 |
References
- Pirnia, A.; Darabi, H.; Choubin, B.; Omidvar, E.; Onyutha, C.; Haghighi, A.T. Contribution of climatic variability and human activities to stream flow changes in the Haraz River basin, northern Iran. J. Hydro-Environ. Res. 2019, 25, 12–24. [Google Scholar] [CrossRef]
- Masson-Delmotte, V.; Zhai, P.; Pirani, A.; Connors, S.L.; Péan, C.; Berger, S.; Caud, N.; Chen, Y.; Goldfarb, L.; Gomis, M.I.; et al. Summary for policymakers. In Climate Change 2021: The Physical Science Basis. Contribution of Working Group I to the Sixth Assessment Report of the Intergovernmental Panel on Climate Change; IPCC: Geneva, Switzerland, 2021; in press. [Google Scholar]
- Allan, R.P.; Soden, B.J. Atmospheric Warming and the Amplification of Precipitation Extremes. Science 2008, 321, 1481–1484. [Google Scholar] [CrossRef]
- Fang, J.; Kong, F.; Fang, J.; Zhao, L. Observed changes in hydrological extremes and flood disaster in Yangtze River Basin: Spatial–temporal variability and climate change impacts. Nat. Hazards 2018, 93, 89–107. [Google Scholar] [CrossRef]
- Zhao, Q.; Ding, Y.; Wang, J.; Gao, H.; Zhang, S.; Zhao, C.; Xu, J.; Han, H.; Shangguan, D. Projecting climate change impacts on hydrological processes on the Tibetan Plateau with model calibration against the glacier inventory data and observed streamflow. J. Hydrol. 2019, 573, 60–81. [Google Scholar] [CrossRef]
- Zheng, H.; Zhang, L.; Zhu, R.; Liu, C.; Sato, Y.; Fukushima, Y. Responses of streamflow to climate and land surface change in the headwaters of the Yellow River Basin. Water Resour. Res. 2009, 45, 7. [Google Scholar] [CrossRef]
- Chien, H.; Yeh, P.J.F.; Knouft, J.H. Modeling the potential impacts of climate change on streamflow in agricultural watersheds of the Midwestern United States. J. Hydrol. 2013, 491, 73–88. [Google Scholar] [CrossRef]
- Majone, B.; Avesani, D.; Zulian, P.; Fiori, A.; Bellin, A. Analysis of high streamflow extremes in climate change studies: How do we calibrate hydrological models? Hydrol. Earth Syst. Sci. 2022, 26, 3863–3883. [Google Scholar] [CrossRef]
- Aich, V.; Liersch, S.; Vetter, T.; Fournet, S.; Andersson, J.C.; Calmanti, S.; Weert, F.H.A.; Hattermann, F.F.; Paton, E.N. Flood projections within the Niger River Basin under future land use and climate change. Sci. Total Environ. 2016, 562, 666–677. [Google Scholar] [CrossRef]
- Eyring, V.; Bony, S.; Meehl, G.A.; Senior, C.A.; Stevens, B.; Stouffer, R.J.; Taylor, K.E. Overview of the Coupled Model Intercomparison Project Phase 6 (CMIP6) experimental design and organization. Geosci. Model Dev. 2016, 9, 1937–1958. [Google Scholar] [CrossRef]
- Zhang, Y.; Zheng, H.; Zhang, X.; Leung, L.R.; Liu, C.; Zheng, C.; Guo, Y.; Chiew, F.H.S.; Post, D.; Kong, D.; et al. Future global streamflow declines are probably more severe than previously estimated. Nat. Water 2023, 1, 261–271. [Google Scholar] [CrossRef]
- Stergiadi, M.; Di Marco, N.; Avesani, D.; Righetti, M.; Borga, M. Impact of geology on seasonal hydrological predictability in alpine regions by a sensitivity analysis framework. Water 2020, 12, 2255. [Google Scholar] [CrossRef]
- Wang, X.; Liu, L. The Impacts of Climate Change on the Hydrological Cycle and Water Resource Management. Water 2023, 15, 2342. [Google Scholar] [CrossRef]
- Shiferaw, H.; Gebremedhin, A.; Gebretsadkan, T.; Zenebe, A. Modelling hydrological response under climate change scenarios using SWAT model: The case of Ilala watershed, Northern Ethiopia. Model. Earth Syst. Environ. 2018, 4, 437–449. [Google Scholar] [CrossRef]
- Foley, J.A.; Defries, R.; Asner, G.P.; Barford, C.; Bonan, G.; Carpenter, S.R.; Snyder, P.K. Global consequences of land use. Science 2005, 309, 570–574. [Google Scholar] [CrossRef]
- Chang, J.; Zhang, H.; Wang, Y.; Zhu, Y. Assessing the impact of climate variability and human activities on streamflow variation. Hydrol. Earth Syst. Sci. 2016, 20, 1547–1560. [Google Scholar] [CrossRef]
- DeFries, R.; Eshleman, K. Land-use change and hydrologic processes: A major focus for the future. Hydrol. Process. 2004, 18, 2183–2186. [Google Scholar] [CrossRef]
- Zhou, J.; He, D.; Xie, Y.; Liu, Y.; Yang, Y.; Sheng, H.; Guo, H.; Zhao, L.; Zou, R. Integrated SWAT model and statistical downscaling for estimating streamflow response to climate change in the Lake Dianchi watershed, China. Stoch. Environ. Res. Risk Assess. 2015, 29, 1193–1210. [Google Scholar] [CrossRef]
- Zhang, L.; Bai, K.Z.; Wang, M.J.; Karthikeyan, R. Basin-scale spatial soil erosion variability: Pingshuo opencast mine site in Shanxi Province, Loess Plateau of China. Nat. Hazards 2016, 80, 1213–1230. [Google Scholar] [CrossRef]
- Li, C.; Fang, H. Assessment of climate change impacts on the streamflow for the Mun River in the Mekong Basin, Southeast Asia: Using SWAT model. CATENA 2021, 201, 105199. [Google Scholar] [CrossRef]
- Zhang, Y.; Lu, K.; He, N.; Zhang, P. Research on land use/cover classification based on RS and GIS. In Proceedings of the 2006 Second International Symposium on Plant Growth Modeling and Applications, Beijing, China, 13–17 November 2006; pp. 244–250. [Google Scholar]
- Cunha, E.; Santos, C.; Silva, R.; Bacani, V.; Pott, A. Future scenarios based on a CA-Markov land use and land cover simulation model for a tropical humid basin in the Cerrado/Atlantic forest ecotone of Brazil. Land Use Policy 2021, 101, 105141. [Google Scholar] [CrossRef]
- Liu, J.; Deng, X. Progress of the research methodologies on the temporal and spatial process of LUCC. Chin. Sci. Bull. 2010, 55, 1354–1362. [Google Scholar] [CrossRef]
- Cao, M.; Tang, G.; Shen, Q.; Wang, Y. A new discovery of transition rules for cellular automata by using cuckoo search algorithm. Int. J. Geogr. Inf. Sci. 2015, 29, 806–824. [Google Scholar] [CrossRef]
- Li, C.; Wu, Y.; Gao, B.; Zheng, K.; Wu, Y.; Li, C. Multi-scenario simulation of ecosystem service value for optimization of land use in the Sichuan-Yunnan ecological barrier, China. Ecol. Indic. 2021, 132, 108328. [Google Scholar] [CrossRef]
- Zhang, S.; Yang, P.; Xia, J.; Wang, W.; Cai, W.; Chen, N.; Hu, S.; Luo, X.; Li, J.; Zhan, C. Land use/land cover prediction and analysis of the middle reaches of the Yangtze River under different scenarios. Sci. Total Environ. 2022, 833, 155238. [Google Scholar] [CrossRef]
- Zhou, Y.; Yue, D.; Liang, G.; Li, S.; Zhao, Y.; Chao, Z.; Meng, X. Risk Assessment of Debris Flow in a Mountain-Basin Area, Western China. Remote Sens. 2022, 14, 2942. [Google Scholar] [CrossRef]
- Li, K.; Yue, D.; Guo, J.; Jiang, F.; Zeng, J.; Zou, M.; Segarra, E. Geohazards mitigation strategies simulation and evaluation based on surface runoff depth: A case study in Bailong River basin. CATENA 2018, 173, 1–8. [Google Scholar] [CrossRef]
- Chen, G.; Meng, X.; Tan, L.; Zhang, F.; Qiao, L. Comparison and combination of different models for optimal landslide susceptibility zonation. Q. J. Eng. Geol. Hydrogeol. 2014, 47, 283–306. [Google Scholar] [CrossRef]
- Huang, M.; Wang, J.; Wang, B.; Liu, D.L.; Feng, P.; Yu, Q.; Pan, X.; Li, S.; Jiang, T. Dominant sources of uncertainty in simulating maize adaptation under future climate scenarios in China. Agric. Syst. 2022, 199, 103411. [Google Scholar] [CrossRef]
- Wang, Z.; Li, X.; Mao, Y.; Li, L.; Wang, X.; Lin, Q. Dynamic simulation of land use change and assessment of carbon storage based on climate change scenarios at the city level: A case study of Bortala, China. Ecol. Indic. 2022, 134, 108499. [Google Scholar] [CrossRef]
- Su, F.; Zhang, L.; Ou, T.; Chen, D.; Yao, T.; Tong, K.; Qi, Y. Hydrological response to future climate changes for the major upstream river basins in the Tibetan Plateau. Glob. Planet. Chang. 2015, 136, 82–95. [Google Scholar] [CrossRef]
- Liu, S.; Yao, Y.; Kuang, X.; Zheng, C. A preliminary investigation on the climate-discharge relationship in the upper region of the Yarlung Zangbo River basin. J. Hydrol. 2021, 603, 127066. [Google Scholar] [CrossRef]
- Wu, T.; Song, L.; Li, W.; Wang, Z.; Zhang, H.; Xin, X.; Zhang, Y.; Zhang, L.; Li, J.; Wu, F.; et al. An overview of BCC climate system model development and application for climate change studies. J. Meteorol. Res. 2014, 28, 34–56. [Google Scholar] [CrossRef]
- Lin, Q.; Wang, Y.; Glade, T.; Zhang, J.; Zhang, Y. Assessing the spatiotemporal impact of climate change on event rainfall characteristics influencing landslide occurrences based on multiple GCM projections in China. Clim. Chang. 2020, 162, 761–779. [Google Scholar] [CrossRef]
- Shan, X.; Yin, J.; Wang, J. Risk assessment of shanghai extreme flooding under the land use change scenario. Nat. Hazards 2022, 110, 1039–1060. [Google Scholar] [CrossRef]
- Fu, G.; Charles, S.P.; Chiew, F.H.; Ekström, M.; Potter, N.J. Uncertainties of statistical downscaling from predictor selection: Equifinality and transferability. Atmos. Res. 2018, 203, 130–140. [Google Scholar] [CrossRef]
- Zhang, X.; Yang, H.; Zhang, W.; Fenicia, F.; Peng, H.; Xu, G. Hydrologic impacts of cascading reservoirs in the middle and lower Hanjiang River basin under climate variability and land use change. J. Hydrol. Reg. Stud. 2022, 44, 101253. [Google Scholar] [CrossRef]
- Wu, H.; Chen, B.; Snelgrove, K.; Lye, L.M. Quantification of Uncertainty Propagation Effects during Statistical Downscaling of Precipitation and Temperature to Hydrological Modeling. J. Environ. Inform. 2019, 34, 139–148. [Google Scholar] [CrossRef]
- Zabaleta, A.; Meaurio, M.; Ruiz, E.; Antigüedad, I. Simulation climate change impact on streamflow and sediment yield in a small watershed in the Basque Country, Northern Spain. J. Environ. Qual. 2013, 43, 235–245. [Google Scholar] [CrossRef] [PubMed]
- Bailey, R.T.; Park, S.; Bieger, K.; Arnold, J.G.; Allen, P.M. Enhancing SWAT+ simulation of groundwater flow and groundwater-surface water interactions using MODFLOW routines. Environ. Model. Softw. 2020, 126, 104660. [Google Scholar] [CrossRef]
- Moriasi, D.N.; Arnold, J.G.; Van Liew, M.W.; Bingner, R.L.; Harmel, R.D.; Veith, T.L. Model evaluation guidelines for systematic quantification of accuracy in watershed simulations. Trans. ASABE 2007, 50, 885–900. [Google Scholar] [CrossRef]
- Li, S.; Cao, Y.; Liu, J.; Wang, S. Simulating land use change for sustainable land management in China’s coal resource-based cities under different scenarios. Sci. Total Environ. 2024, 916, 170126. [Google Scholar] [CrossRef]
- Peng, L.; Wang, X.-X. What is the relationship between ecosystem services and urbanization? A case study of the mountainous areas in Southwest China. J. Mt. Sci. 2019, 16, 2867–2881. [Google Scholar] [CrossRef]
- Jiang, X.; Duan, H.; Liao, J.; Song, X.; Xue, X. Land use in the Gan-Lin-Gao Region of middle reaches of Heihe River Basin based on a PLUS-SD coupling model. Arid. Zone Res. 2022, 39, 1246–1258. [Google Scholar]
- Zhang, Z.; Li, X.; Liu, X.; Zhao, K. Dynamic simulation and projection of land use change using system dynamics model in the Chinese Tianshan mountainous region, central Asia. Ecol. Model. 2024, 487, 110564. [Google Scholar] [CrossRef]
- Xu, Z.; Liu, Z.; Liang, L.; Zhai, R.; Zhao, H.; Zhang, W. Variable parameter Budyko theory considering climate change factors and its application in water resources prediction of Ganjiang River Basin. Water Resour. Hydropower Eng. 2022, 53, 10. [Google Scholar]
- Gao, P.; Jiang, G.; Wei, Y.; Mu, X.; Wang, F.; Zhao, G.; Sun, W. Streamflow regimes of the Yanhe River under climate and land use change, Loess Plateau, China. Hydrol. Process. 2015, 29, 2402–2413. [Google Scholar] [CrossRef]
- Chase, K.J.; Haj, A.E.; Regan, R.S.; Viger, R.J. Potential effects of climate change on streamflow for seven watersheds in eastern and central Montana. J. Hydrol. Reg. Stud. 2016, 7, 69–81. [Google Scholar] [CrossRef]
- Neupane, R.P.; White, J.D.; Alexander, S.E. Projected hydrologic changes in monsoon-dominated Himalaya Mountain basins with changing climate and deforestation. J. Hydrol. 2015, 525, 216–230. [Google Scholar] [CrossRef]
- Eisner, S.; Flörke, M.; Chamorro, A.; Daggupati, P.; Donnelly, C.; Huang, J.; Hundecha, Y.; Koch, H.; Kalugin, A.; Krylenko, I.; et al. An ensemble analysis of climate change impacts on streamflow seasonality across 11 large river basins. Clim. Chang. 2017, 141, 401–417. [Google Scholar] [CrossRef]
- Zheng, H.; Chiew, F.H.S.; Charles, S.; Podger, G. Future climate and streamflow projections across South Asia from CMIP5 global climate models and hydrological modelling. J. Hydrol. 2018, 18, 92–109. [Google Scholar]
- Shrestha, S.; Bhatta, B.; Shrestha, M.; Shrestha, P.K. Integrated assessment of the climate and landuse change impact on hydrology and water quality in the Songkhram River Basin, Thailand. Sci. Total Environ. 2018, 643, 1610–1622. [Google Scholar] [CrossRef]
- Wen, X.; Liu, Z.; Lei, X.; Lin, R.; Fang, G.; Tan, Q.; Wang, C.; Tian, Y.; Quan, J. Future changes in Yuan River ecohydrology: Individual and cumulative impacts of climates change and cascade hydropower development on runoff and aquatic habitat quality. Sci. Total Environ. 2018, 633, 1403–1417. [Google Scholar] [CrossRef] [PubMed]
- Suriya, S.; Mudgal, B. Impact of urbanization on flooding: The Thirusoolam sub watershed—A case study. J. Hydrol. 2012, 412–413, 210–219. [Google Scholar] [CrossRef]
- Li, C.; Liu, M.; Hu, Y.; Shi, T.; Qu, X.; Walter, M.T. Effects of urbanization on direct streamflow characteristics in urban functional zones. Sci. Total Environ. 2018, 643, 301–311. [Google Scholar] [CrossRef]
- Zhang, Y.; Xia, J.; Yu, J.; Randall, M.; Zhang, Y.; Zhao, T.; Shao, Q. Simulation and assessment of urbanization impacts on streamflow metrics: Insights from landuse changes. J. Hydrol. 2018, 560, 247–258. [Google Scholar] [CrossRef]
- Zhang, Y.; You, Q.; Chen, C.; Ge, J. Impacts of climate change on streamflows under RCP scenarios: A case study in Xin River Basin, China. Atmos. Res. 2016, 178–179, 521–534. [Google Scholar] [CrossRef]
- Zuo, D.; Xu, Z.; Yao, W.; Jin, S.; Xiao, P.; Ran, D. Assessing the effects of changes in land use and climate on streamflow and sediment yields from a watershed in the Loess Plateau of China. Sci. Total Environ. 2016, 544, 238–250. [Google Scholar] [CrossRef] [PubMed]
- Wang, X.; He, K.; Dong, Z. Effects of climate change and human activities on streamflow in the Beichuan River Basin in the northeastern Tibetan Plateau, China. CATENA 2019, 176, 81–93. [Google Scholar] [CrossRef]
- Yang, W.; Long, D.; Bai, P. Impacts of future land cover and climate changes on streamflow in the mostly afforested river basin in North China. J. Hydrol. 2019, 570, 201–219. [Google Scholar] [CrossRef]
- Guo, Y.; Fang, G.; Xu, Y.-P.; Tian, X.; Xie, J. Identifying how future climate and land use/cover changes impact streamflow in Xinanjiang Basin, East China. Sci. Total Environ. 2019, 710, 136275. [Google Scholar] [CrossRef]
- Shi, X. Study on Distributed Hydrological Simulation and Drought Evaluation Method in Luanhe River Basin Based on SWAT Model; University of Chinese Academy of Sciences: Beijing, China, 2013. [Google Scholar]
- Bai, X.; Zhao, W. Impacts of climate change and anthropogenic stressors on streamflow variations in major river basins in China since 1950. Sci. Total Environ. 2023, 898, 165349. [Google Scholar] [CrossRef]
- Bosshard, T.; Carambia, M.; Goergen, K.; Kotlarski, S.; Krahe, P.; Zappa, M.; Schär, C. Quantifying uncertainty sources in an ensemble of hydrological climate-impact projections. Water Resour. Res. 2013, 49, 1523–1536. [Google Scholar] [CrossRef]
- Jung, I.-W.; Chang, H.; Moradkhani, H. Quantifying uncertainty in urban flooding analysis considering hydro-climatic projection and urban development effects. Hydrol. Earth Syst. Sci. 2011, 15, 617–633. [Google Scholar] [CrossRef]
Figure 1.
Location map of the BRB.

Figure 2.
Taylor plot between GCMs and observed precipitation.

Figure 3.
Taylor plot between maximum and minimum temperatures for GCMs and observational data.

Figure 4.
Spatial distribution of land use in the BRB under the SSP126-EP scenario during 2040–2100.
Figure 4.
Spatial distribution of land use in the BRB under the SSP126-EP scenario during 2040–2100.

Figure 5.
Spatial distribution of land use in the BRB under the SSP245-ND scenario during 2040–2100.
Figure 5.
Spatial distribution of land use in the BRB under the SSP245-ND scenario during 2040–2100.

Figure 6.
Spatial distribution of land use in the BRB under the SSP585-EG scenario during 2040–2100.
Figure 6.
Spatial distribution of land use in the BRB under the SSP585-EG scenario during 2040–2100.

Figure 7.
Sangji map of land use area transfer under SSP1–2.6 scenarios from 2040 to 2100.

Figure 8.
Sangji map of land use area transfer under SSP2–4.5 scenarios from 2040 to 2100.

Figure 9.
Sangji map of land use area transfer under SSP5–8.5 scenarios from 2040 to 2100.

Figure 10.
Annual streamflow in the BRB in 2020.

Figure 11.
Annual streamflow changes under various scenarios (SSP1–2.6, SSP2–4.5, and SSP5–8.5) in the BRB from 2021 to 2100.
Figure 11.
Annual streamflow changes under various scenarios (SSP1–2.6, SSP2–4.5, and SSP5–8.5) in the BRB from 2021 to 2100.

Figure 12.
Boxplot of the mean monthly runoff and its variation under different scenarios from 2021 to 2100. The error bars represent 75% (upper limit) and 25% (lower limit) of streamflow variance.
Figure 12.
Boxplot of the mean monthly runoff and its variation under different scenarios from 2021 to 2100. The error bars represent 75% (upper limit) and 25% (lower limit) of streamflow variance.

Figure 13.
Box plots of maximum monthly runoff and its variations under different scenarios from 2021 to 2100. The error bars represent 75% (upper limit) and 25% (lower limit) of streamflow variance.
Figure 13.
Box plots of maximum monthly runoff and its variations under different scenarios from 2021 to 2100. The error bars represent 75% (upper limit) and 25% (lower limit) of streamflow variance.
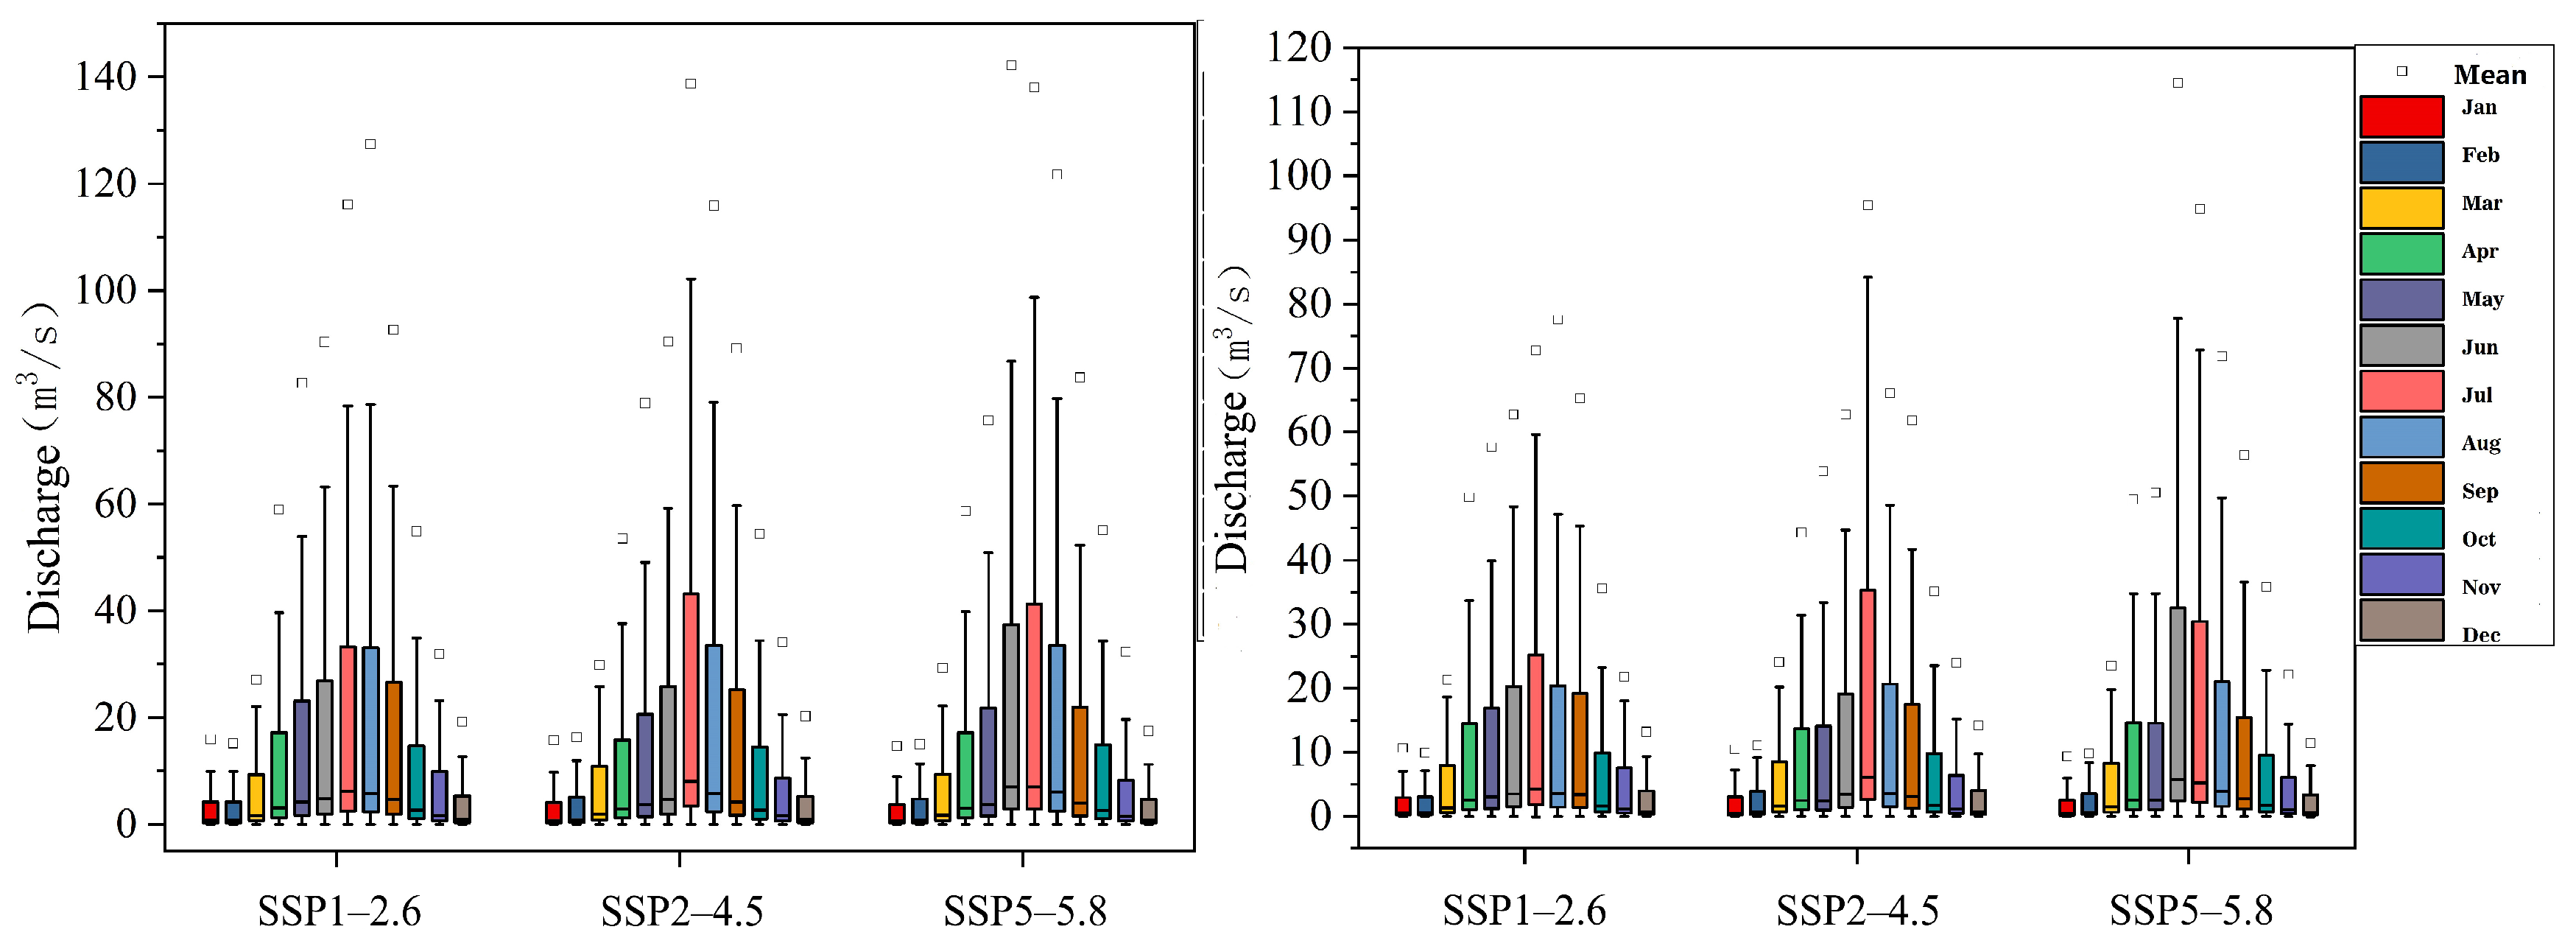
Figure 14.
Spatial distribution of streamflow changes influenced by climate (a) and land use changes (b).
Figure 14.
Spatial distribution of streamflow changes influenced by climate (a) and land use changes (b).

Table 1.
Locations of hydrological stations.
| Station | East Longitude | North Latitude | Year |
|---|---|---|---|
| Wudu | 104°55′ | 33°23′ | 2005–2020 |
| Bikou | 105°15′ | 32°45′ | 2005–2020 |
Table 2.
Drivers of LUCC.
| Category | Data Type | Original Resolution | Source |
|---|---|---|---|
| Socioeconomic factors | Population | 1 km | http://www.resdc.cn (accessed on 1 April 2024) |
| GDP | 1 km | http://www.resdc.cn (accessed on 1 April 2024) | |
| Proximity to Settlements | Shpfile | http://www.ngcc.cn/ngcc/ (accessed on 1 April 2024) | |
| Proximity to railways | |||
| Proximity to highways | |||
| Proximity to primary roads | |||
| Proximity to secondary roads | |||
| Proximity to tertiary roads | |||
| Environmental elements | Precipitation | 1 km | http://www.resdc.cn (accessed on 1 April 2024) |
| Temperature | 1 km | http://www.resdc.cn (accessed on 1 April 2024) | |
| Elevation | 30 m | http://www.giscloud.cn/ (accessed on 1 April 2024) | |
| Slope | 30 m | http://www.giscloud.cn/ (accessed on 1 April 2024) | |
| Primary rivers and water bodies | Shpfile | http://www.ngcc.cn/ngcc/ (accessed on 1 April 2024) | |
| Soil type | 1 km | http://www.ncdc.ac.cn (accessed on 1 April 2024) | |
| Soil content | 1 km | https://www.fao.org/home/en/ (accessed on 1 April 2024) | |
| Soil organic matter | 1 km | https://www.fao.org/home/en/ (accessed on 1 April 2024) |
Disclaimer/Publisher’s Note: The statements, opinions and data contained in all publications are solely those of the individual author(s) and contributor(s) and not of MDPI and/or the editor(s). MDPI and/or the editor(s) disclaim responsibility for any injury to people or property resulting from any ideas, methods, instructions or products referred to in the content. |
© 2024 by the authors. Licensee MDPI, Basel, Switzerland. This article is an open access article distributed under the terms and conditions of the Creative Commons Attribution (CC BY) license (https://creativecommons.org/licenses/by/4.0/).
Share and Cite
MDPI and ACS Style
Li, S.; Zhou, Y.; Yue, D.; Zhao, Y. Streamflow Variation under Climate Conditions Based on a Soil and Water Assessment Tool Model: A Case Study of the Bailong River Basin. Sustainability 2024, 16, 3901. https://doi.org/10.3390/su16103901
AMA Style
Li S, Zhou Y, Yue D, Zhao Y. Streamflow Variation under Climate Conditions Based on a Soil and Water Assessment Tool Model: A Case Study of the Bailong River Basin. Sustainability. 2024; 16(10):3901. https://doi.org/10.3390/su16103901
Chicago/Turabian StyleLi, Shuangying, Yanyan Zhou, Dongxia Yue, and Yan Zhao. 2024. "Streamflow Variation under Climate Conditions Based on a Soil and Water Assessment Tool Model: A Case Study of the Bailong River Basin" Sustainability 16, no. 10: 3901. https://doi.org/10.3390/su16103901
Note that from the first issue of 2016, this journal uses article numbers instead of page numbers. See further details here.