
Comprehensive Evaluation of Resilience for Qinling Tunnel Group Operation Safety System Based on Combined Weighting and Cloud Model

1
School of Highway, Chang’an University, Xi’an 710064, China
2
Zhejiang Expressway Construction Management Co., Ltd., Hangzhou 310020, China
*
Author to whom correspondence should be addressed.
Sustainability 2024, 16(10), 3937; https://doi.org/10.3390/su16103937
Submission received: 28 March 2024
/
Revised: 23 April 2024
/
Accepted: 6 May 2024
/
Published: 8 May 2024
(This article belongs to the Special Issue Sustainable Development of Underground Engineering and Tunnel Construction Technology)
Abstract
:An extensive network of tunnels has recently been constructed in the Qinling Mountains. Characterized by high and steep terrain, this network has led to frequent traffic accidents. To address this issue, this paper introduces the theory of resilience into the evaluation system of safety systems during the operation period of highway tunnel groups. Based on this, this paper establishes a resilience evaluation index system for the operation safety system of highway tunnel groups, including a human system, vehicle system, and road system. To address both qualitative and quantitative issues concerning the indicators, this paper employs the analytic hierarchy process (AHP) and entropy weight method to combine and assign weights to the resilience evaluation indicators. Subsequently, the cloud model method is utilized to quantify the level of resilience of the highway tunnel group safety system during the operation period. The study results unveiled the patterns of traffic accidents within the Qinling Tunnel Group from the perspectives of vehicle, road, and human factors. The final weight allocation reveals that the road system has the highest proportion, exerting the greatest influence as a primary level index. Moreover, by taking the Qinling Tunnel Group on the Xihan Expressway as an engineering example, the resilience level of the case project was analyzed and obtained. Proposals for enhancing resilience were put forth, taking into account the project’s unique attributes, encompassing adaptability, resistance, and recovery. Overall, this study validates the feasibility and reliability of the proposed method for assessing the resilience of highway networks, offering empirical support for transportation administrators in the implementation of resilience-enhancing strategies.
1. Introduction
Transportation infrastructure construction in China has made significant advances in recent years with the implementation of major national strategies, such as the Western Development, the “Belt and Road Initiative”, and “Strong Transport Country”. This progress has ushered in a new era for building a robust transportation network. Highway tunnels, a vital component of highway routes, have developed alongside highway construction. Tunnels play an irreplaceable role under specific conditions and are widely used in the construction of high-grade highways. The tunnel group operation system is a comprehensive engineering system that is affected by various factors such as the environment, personnel, equipment, etc., resulting in the system encountering the impact and disturbance of numerous unsafe factors. As highway construction rapidly advances, traffic safety issues are becoming increasingly pronounced in mountain highway tunnel segments, significantly impacting the overall operational safety of highways. The consequences are extremely serious when a disaster occurs. Therefore, a scientific and systematic evaluation of mountain expressway tunnel group operation safety has become a key problem to be solved [1].
Currently, numerous studies have significantly contributed to research on the operational safety of highway tunnel groups, with a primary focus on two aspects. One study focuses on the characteristics of traffic accidents in tunnel groups. Sun et al. [2] gathered 2703 tunnel traffic accidents (TTAs) that occurred in expressway tunnels in China from 2001 to 2019 to summarize the temporal and spatial characteristics of the traffic accidents. Their findings showed that 58% of TTAs took place in the entrance and exit zones, with rear-end accidents being the most prevalent. Pervez et al. [3] identified the most accident-prone zones in long, medium, and short tunnels (the mid-zone, entrance zone, and access zone, respectively), considering tunnel length and the entrance and exit zones as factors. Wang et al. [4] determined the time, space, accident form, vehicle type, and road alignment distribution characteristics of traffic accidents in the long downhill tunnel sections of mountain expressways. Li Shun et al. [5] conducted an empirical analysis on road/tunnel design, traffic volume, and environmental factors. The research findings indicate that the likelihood of sequential accidents in highway tunnels is influenced by important factors such as tunnel length, traffic congestion level, time period, season, and vehicle type. Luo et al. [6] examined the characteristics of traffic accident data in Pennsylvania spanning from 1997 to 2020, revealing that tunnel traffic accidents primarily result from rear-end collisions and collisions with stationary objects, with a significant proportion involving speeding. Shen [7] analyzed 200 traffic accidents’ data from the Yingtian Street Tunnel in Nanjing city and extracted the main factors affecting tunnel traffic conditions from three aspects: time, traffic flow, and tunnel environment. Previous scholars have delineated the characteristics and risk factors associated with tunnel traffic incidents; however, these analyses have overlooked the integral elements constituting the highway tunnel collective system. Moreover, there has been a lack of a comprehensive synthesis of risk factors for tunnel traffic accidents from a holistic standpoint.
Other studies from different perspectives have also been conducted using methods such as the analytic hierarchy process (AHP), entropy weight method, decision trees, fuzzy mathematics, and neural networks, among others, to determine the operational safety of highway tunnels [8,9,10,11,12,13]. Li et al. [14] established the safety indicator system. Additionally, this paper analyzed factors that affect tunnel operating safety and proposed an evaluation method for reference. Liu et al. [15] developed a binary discrete time-varying Bayesian copula model for precisely evaluating the structural reliability of operational tunnels to overcome the deficiencies. Zhao et al. [16] integrated the fuzzy analytic hierarchy process (FAHP) and the Set Pair Analysis (SPA) to assess operational safety risk for long and large highway tunnels. However, there remains a dearth of efficient and user-friendly approaches for assessing the safety systems of tunnel operations. This shortfall primarily stems from the inherent fuzziness, randomness, and indeterminacy characteristic of evaluation metrics. The cloud model, adept at encapsulating the random and fuzzy nature of entities and facilitating the transition from qualitative assessments to quantitative analyses, stands out as an exemplary method for appraising systems fraught with uncertainties. Nevertheless, the application of this model to the domain of tunnel operation safety assessment has yet to be documented in the literature.
To minimize the response time of safety accidents, prevent secondary accidents, and enhance accident management, this study introduces the resilience theory to analyze the safety system of highway tunnel groups during their operational phase, aiming to ensure their safe and stable operation [17]. Regarding resilience assessment, Wei et al. [18] adopted the Bayesian network and the traditional failure mode and effect analysis (FMEA) method to realize resilience assessment with multiple performance indicators. Qiao et al. [19] established a Bayesian network (BN) model to quantify resilience. The prior probabilities of parent nodes and a conditional probability table for the network are obtained by fuzzy theory and expert elicitation. In recent years, the theory of resilience has been progressively applied to the transportation sector [20,21,22]. Xu et al. [23] proposed the concept of tunnel system resilience and built a theoretical analysis model of road tunnel resilience. Lin et al. [24] proposed an analytical model for evaluating the resilience of shield tunnel linings considering multistage disturbances and recoveries on the basis of resilience theory. Caliendo, C et al. [25] developed a traffic simulation model to quantitatively assess the resilience of a twin-tube motorway tunnel in the event of a traffic accident or fire occurring within a tube.
In summary, this study conducts a comprehensive analysis of traffic accident risk factors in tunnel groups, focusing on human, vehicular, and road elements. It constructs a resilience assessment framework for tunnel groups’ operational safety systems that considers the interactive effects of these elements. A resilience model specific to highway tunnel groups is then developed, employing traffic accident data and a combined weighting approach for resilience evaluation. The model’s applicability is demonstrated through the resilience analysis of the Qinling Tunnel Group’s safety system. These findings offer valuable insights for highway management in resilience assessment and possess significant scholarly and practical implications.
2. Data Basis and Statistics
2.1. An Analysis of the Distribution Characteristics
In 2017, a devastating traffic accident occurred on the Xihan Expressway in Shaanxi Province, resulting in 36 fatalities and 13 injuries, causing substantial damages, as illustrated in Figure 1. The Xihan Expressway, an integral component of the main framework of the highway network in Shaanxi Province, includes the Qinling Tunnel Group. This tunnel group is one of the largest tunnel systems in the province, comprising 137 single-hole tunnels that span the entire length of the expressway. This group includes tunnels referred to as Qinling I, II, and III, which are known for their remarkable length. The Qinling Tunnel Group exhibits distinctive features, such as a large number of tunnels, short connecting sections at tunnel entrances, and a continuous arrangement of tunnels [4,26,27].
The sample data for this study were obtained through surveys conducted by the traffic police department and transportation management department of Shaanxi Province. After screening and processing, the sample data on vehicle traffic accidents in the Qinling Tunnel Group on the Xi’an–Hanzhong Expressway from 2015 to 2021 were obtained. Table 1 presents the statistical findings of certain traffic accidents that occurred within the Western Han Dynasty’s high-speed tunnel complex. The data sources and accident recording forms are unified, which facilitates data mining for potential patterns of accident occurrence. The aim is to investigate the typical accident characteristics of the Qinling Tunnel Group, including distribution patterns concerning time periods, months, spatial locations, and accident types. The distribution characteristics of traffic accidents in the Qinling Tunnel Group of the Western Han Expressway are presented in Figure 2. Analysis shows that traffic accidents in the tunnel group exhibit a certain regularity over 24 h, with a distinct peak during specific hours. The number of traffic accidents remains high from 0800 to 1800, with accidents during peak hours comprising 60.1% of the total. Figure 3 depicts the monthly distribution characteristics of traffic accidents in the Qinling Tunnel Group of the Western Han Expressway. February, April, August, and October are identified as the months when traffic accidents most frequently occur in the Qinling Tunnel Group of the Western Han Expressway, constituting approximately 70.1% of the total number of accidents. Notably, different traffic environments and compositions may lead to varying spatial distributions of tunnel accidents [28,29]. Figure 4 shows the spatial distribution characteristics of traffic accidents in the Qinling Tunnel Group, with the majority of accidents occurring inside the tunnels, comprising 74.6%. The entrances and exits of the tunnels are concentrated locations for accidents, constituting 25.4% of the total. Figure 5 presents the distribution characteristics of traffic accidents in the Qinling Tunnel Group. The highest proportion corresponds to rear-end accidents, representing 58.8% of the total number of accidents, followed closely by unilateral accidents, including rollovers and collisions with tunnel walls. These accidents are mostly attributed to factors such as fatigue or a lack of expertise in driving, with a proportion of 27.8%. Accidents due to scratches and spontaneous combustion constitute a relatively small proportion of the total.
2.2. Analysis of Risk Factors for Traffic Accidents in Tunnel Groups
Through the investigation and collection of data on traffic accidents that occurred in the Qinling Tunnel Group, data from 2015 to 2021 were statistically analyzed to identify the risk factors for traffic accidents in the Qinling Tunnel Group of the Western Han Expressway.
2.2.1. Human Factor Analysis
To investigate the influence of driver behavior on traffic accidents, we conducted a comprehensive analysis of 468 accidents caused by unsafe driving behavior over recent years. We excluded accidents attributed to vehicle malfunctions, slippery road conditions, and severe weather and were left with 308 accidents due to unsafe driver behaviors, such as speeding, overloading, overtaking, fatigue driving, and inadequate following distance. The statistical breakdown of these classified accidents is presented in Table 2 and illustrated in Figure 6.
The results in Table 2 and Figure 6 show that the leading cause of traffic accidents is speeding, comprising 37.3% of the total accidents, followed by overloading, exceeding the speed limit, and improper overtaking, which have similar proportions of occurrence. Fatigue driving constitutes 13.5% of traffic accidents, whereas accidents resulting from an insufficient following distance represent the smallest percentage (5.5%) of the total accidents.
2.2.2. Vehicle Factor Analysis
- (1)
- The type of vehicle involved in a traffic accident
A classification and statistical analysis were conducted based on survey data regarding the types of vehicles involved in accidents to assess the effect of vehicle types on traffic accidents. The results are listed in Table 3 and depicted in Figure 7.
As indicated, large trucks and sedans represent the primary types of vehicles involved in traffic accidents, which is consistent with common perceptions. These two vehicle types together constitute 73.9% of all traffic accidents. Large trucks are known for their bulkiness, limited maneuverability, and longer braking distances, which contribute to the severity of accidents when they are involved. Meanwhile, small cars are often associated with higher speeds and shorter response times, rendering them more accident-prone than large vehicles. These results emphasize that the proportion of vehicle types on the roads significantly influences the occurrence of traffic accidents.
- (2)
- Traffic volume
Traffic volume refers to the number of participants who actually participate in traffic at a certain location or section on the road within a unit time. To explore the impact of traffic volume on traffic accidents, this article introduces the concept of the traffic accident rate. The road traffic accident rate serves as a measure of the correlation between the number of accidents, casualties, and factors such as population, registered vehicles, and distance traveled on a particular road in a specific region or throughout a country over a certain period. Jiawei Yuan analyzed the characteristics of traffic accidents in highway tunnels in Sichuan Province, selected eight typical tunnels, and calculated the traffic volume and accident rate. He found that as the traffic volume increased, tunnel accidents first increased and then decreased [30]. Therefore, it can help illustrate that this internationally recognized measure provides insights into the level of traffic safety, with lower values indicating higher safety levels. Equation (1) presents the formula for calculating the accident rate:
where RV is the number of accidents per 1 million vehicle kilometers throughout the year, D is the number of traffic accidents throughout the year, and V is the total operating kilometers throughout the year.
In order to examine the influence of traffic volume on traffic accidents, the traffic volume and tunnel traffic accident rate of the Qinling Tunnel Group over the past 7 years were analyzed, and the results are displayed in Table 4 and Figure 8.
Figure 8 illustrates a clear relationship between the traffic volume and accident rate in the tunnel. As the traffic volume increases, the accident rate shows a gradual incline. Notably, in 2018, there was a significant decrease in the accident rate following the pavement milling treatment conducted in the Qinling Tunnel. However, from 2018 to 2021, as the traffic volume continued to rise, the accident rate still showed an upward tendency. This suggests a positive correlation between traffic volume and the occurrence of accidents, which is basically consistent with the research of other scholars [30]. The increase in traffic volume contributes to higher road congestion and reduced traffic capacity, resulting in a heightened risk of accidents such as rear-end collisions, scrapes, and collisions with walls.
2.2.3. Road Factor Analysis
- (1)
- Tunnel structural problems
In assessing the condition of tunnels, routine inspections were conducted to analyze tunnel problems such as lining cracks, back cavities, and road surface subsidence, which help the overall condition of tunnels [31]. In the present study, the annual regular inspection report of the Qinling Tunnel Group is used, and the health status of the tunnel is evaluated based on the guidelines outlined in the “Technical Specification for Highway Tunnel Maintenance”. The technical condition of the tunnel structure is assessed using the following formula:
where ωi denotes the weight of each item, and JGCIi is the value of each condition ranging from 0 to 4.
- (2)
- Linear
The horizontal alignment of roads can be classified into straight lines and flat curves, both of which significantly affect traffic safety. To investigate the relationship between traffic accidents and road geometry, we statistically analyzed the occurrence of accidents in tunnels along the highway, with a focus on curves and straight sections. The results of this analysis are presented in Table 5 and Figure 9.
As shown in Figure 9, traffic accidents predominantly occur in the curved sections of the Qinling Tunnel. This tendency can be attributed to two primary factors: First, a considerable portion of the tunnel design includes curved sections, increasing the likelihood of accidents occurring in these areas. Second, the presence of walls within the tunnel restricts the field of vision of the driver, impeding their ability to perceive visual cues while traversing curved sections. Moreover, the high humidity levels inside the tunnel contribute to a lower road surface friction coefficient than that outside the tunnel. Consequently, the risk of skidding and the loss of control is increased, particularly on sections with small curve radii. Evidently, curves significantly influence the occurrence of traffic accidents.
- (3)
- Road condition
To assess the effect of road surface conditions on traffic accidents, we selected tunnels that had undergone road milling measures and analyzed the accident rates before and after milling. In 2018, along the direction from Hanzhong to Xi’an, the upper layers of the following tunnels were milled over varying lengths: Qinling Tunnel 1 over 6132 m, Qinling Tunnel 2 over 6098 m, and Qinling Tunnel 3 over 4930 m. The calculation results are presented in Table 6 and Figure 10.
As shown in Figure 10, the accident rate after the road surface was milled significantly decreased. Specifically, the accident rate decreased by 73.3% in Qinling Tunnel 1, by 34.1% in Qinling Tunnel 2, and 35.3% in Qinling Tunnel 3. The improved adhesion coefficient of the road surface after milling reduces the likelihood of tire sliding on the ground, effectively reducing the occurrence of traffic accidents. This finding emphasizes the significant role of road conditions in traffic accidents.
3. Resilience of Operation Safety System for Expressway Tunnel Group
3.1. Conceptual Model of Resilience for Safety System of Expressway Tunnel Group Operation
In 1973, the Canadian ecologist Holling first introduced the notion of ecosystem resilience. In 1980, the concept of “resilient cities” emerged following its expansion and application to the field of urban planning. Academic applications originally stemmed from the field of materials science, demonstrating that certain types of wood are capable of withstanding instantaneous loads. The concept of resilience proposed in this article refers to the process attribute of a system that enables it to maintain normal operation by its own resistance and recovery ability in the event of interference. Figure 11 depicts the resilience conceptual model for the operational safety system of highway tunnel clusters.
This article adheres to the principles of scientific rigor, systemic analysis, hierarchical structure, independence, measurability, and dynamics to analyze the risk factors associated with tunnel accidents. Building upon this analysis, we developed an evaluation index system for the resilience of the expressway tunnel group operation safety system [32]. This index system consists of eight indicators and focuses on three key aspects: human, vehicle, and road factors. The indicators include driving behavior, driving duration, vehicle type, traffic volume, tunnel condition, tunnel spacing, road condition, and horizontal alignment. Figure 12 provides a visual representation of these indicators.
3.2. Classification of Operational Safety Evaluation Indicators for Expressway Tunnel Group
On the basis of the relevant literature [33,34,35,36,37,38] and based on the analysis of the aforementioned traffic accident data, the evaluation indicators for the operational safety factors of the expressway tunnel group were qualitatively and quantitatively classified. R1 classifies based on the proportion of high-risk driving behaviors, R2 by driving time, S1 by traffic volume, S2 by the percentage of large trucks, T1 by tunnel condition scores, T2 by tunnel spacing, T3 by pavement grade, and T4 by the number of curve segments. The results are listed in Table 7.
The operational safety of the expressway tunnel group is divided into four levels, denoted as , corresponding to low safety, medium safety, relatively safe, and extremely safe. The levels are classified and described in Table 8.
4. Methodology
This paper employs subjective and objective weighting techniques to address the qualitative and quantitative evaluation challenges inherent in the operational safety system resilience of highway tunnel groups. The analytic hierarchy process (AHP) is applied for subjective weighting, the entropy weight method is utilized for objective weighting, and a combined weighting method is employed for the combination of subjective and objective weights to minimize the influence of subjective factors, thereby ensuring that the evaluation results are as objective and accurate as possible. Subsequently, the cloud model method is utilized to quantify the level of resilience of the highway tunnel group safety system during the operation period. The detailed workflow is illustrated in Figure 13.
4.1. Analytical Hierarchy Process
The index factors of each layer in the hierarchical structure in pairs are compared based on the significance of photography to the elements in the previous layer. A judgment matrix A is thus created:
The comparison matrix :
where represents the proportional scale of importance of elements a and b relative to the previous layer of elements. The comparison matrix scale and its corresponding significance are listed in Table 9.
The calculation of weights using the AHP involves numerous complex steps [39,40]. This process was simplified using MatlabR2018a for programming and calculation purposes. This approach allowed for the determination of the subjective weights for each index within the comprehensive evaluation index system of operation safety for the Qinling Tunnel Group. The weights are listed in Table 10.
4.2. Calculating Objective Weights via the Entropy Weight Method
Information entropy, often referred to as Shannon entropy, is an extended concept of entropy introduced by Shannon in 1948 in the field of information theory. This concept represents the uncertainty of signals in an information source. In information theory, entropy serves as a measure of the degree of disorder within a system. Entropy allows for the quantification of the amount of effective information contained within the data. Therefore, entropy can be used to determine weight values [41,42].
When the values of an evaluation object for a specific evaluation indicator vary considerably, the entropy value is diminished. This suggests that the evaluation indicator carries a significant amount of effective information, resulting in a larger weight value for that indicator. Conversely, when the values for a certain evaluation indicator only slightly vary, the entropy value is enlarged. This suggests that the evaluation indicator conveys a minimal amount of effective information, resulting in a smaller weight value for that indicator. If the values for the evaluation object are identical for a specific evaluation indicator, the entropy value reaches the maximum. This suggests that the evaluation indicator offers no useful information and can be omitted from the evaluation indicator system.
In real-life scenarios, we can calculate the entropy weight for each evaluation indicator by considering the degree of differentiation of their values. This process involves using entropy to determine the weight of each evaluation indicator. These weights are then applied to all evaluation indicators to obtain more objective evaluation results. The basic steps of the entropy weight method are outlined below:
- (1)
- The number of existing projects to be evaluated is assumed to be m, and the number of evaluation indicators is n. The original data matrix for forming the corresponding evaluation indicators of the project to be evaluated is as follows:where aij is the evaluation value of the jth evaluation indicator under the ith evaluation project.
- (2)
- The raw measurement data of each evaluation indicator are classified and normalized.If the evaluation indicator is a positive indicator, it is normalized to the following:If the evaluation indicator is a reverse indicator, it is normalized to the following:The decision matrix after standardization can be expressed as follows:
- (3)
- The proportion can be calculated as follows:
- (4)
- The entropy is given by the following:
- (5)
- The entropy weight can be expressed as follows:
This study collects data from the Qinling Tunnel Group of the Western Han Expressway, as shown in Table 11 and Table 12.
Therefore, Equations (5)–(11) are used to calculate the objective weights of various indicators:
4.3. Calculate the Final Weight Using the Combination Weighting Method
The weights of evaluation indicators derived from the AHP are typically reasonable but exhibit a relatively high degree of subjective randomness. Meanwhile, the entropy weight method relies solely on data for weight calculation, ignoring the experience and knowledge of experts and the perspectives of decision-makers. Consequently, the rationality of the approach is generally moderate and may not completely reflect the real-world situation. Both subjective and objective weight calculations need to be integrated to address this limitation [43,44]. This coupling is expressed as follows:
where is the combined weight of the ith indicator calculated by the AHP and the entropy weight method, denotes the weight of each indicator obtained by the AHP, represents the weight of each indicator determined using the entropy weight method, and n is the number of indicators.
Table 13 presents the weight of the comprehensive evaluation index for the operational safety of the expressway tunnel group operation safety. As shown, the road system holds the highest proportion and as a first-level index, exerts the most effect. Among the second-level indicators, tunnel conditions, road conditions, and driving behavior comprise a relatively substantial proportion, significantly affecting the operational safety of the tunnel group. Thus, these indicators should be prioritized and given careful attention.
4.4. Cloud Model
The cloud model, proposed by Academician Li Deyi of the Chinese Academy of Engineering in 1995, consists of numerous cloud droplets, each representing a definite point that constitutes an uncertain cloud [45]. The description of a cloud encompasses three elements, denoted as: (Ex0, En0, He0). Here, Ex0 symbolizes the fuzzy set’s expected value, representing the average or central tendency of its elements. En0 represents entropy, indicating the uncertainty or disorder within the fuzzy set. He0 denotes the fuzzy set’s hyper-entropy, an enhancement of entropy, mirroring the set’s information richness, diversity, or dispersion level, as calculated by Formula (14).
where represents the upper and lower bounds of the evaluation range; b is a constant, representing the standard value of super-entropy. In the text, the super-entropy is set to 0.06.
Given the challenge in precisely quantifying resilience metrics, evaluation grades are established with reference to the relevant literature and standards [46,47], assigning a full score of 100 points. The specific details are presented in Table 14, where “D” denotes the comprehensive evaluation score for the resilience of highway tunnel clusters.
Then, a forward cloud generator is programmed in MatlabR2018a to produce a standard cloud diagram, as shown in Figure 14.
5. Case Study
5.1. Example Introduction
In this study, we selected the Qinling No. 1 Tunnel in the Qinling Tunnel Group of the Western Han Expressway as a case for analysis. The Qinling No. 1 Tunnel is a bidirectional four-lane separated expressway tunnel from K1158 + 721 to K1164 + 883. It has a net width of 9.75 m, a net height of 5 m, and a road width of 8.5 m. The actual data for each indicator are listed in Table 15.
The data presented in Table 15 underwent normalization and dimensionless processing based on their positive and negative effects. Using Equation (14) and the forward cloud generator, we derived the comprehensive evaluation cloud model for the Qinling No. 1 Tunnel. As indicated by Figure 15, the comprehensive evaluation of the Qinling No. 1 Tunnel’s resilience is positioned between levels “III” and “IV”, leaning towards level “III”. It is thus inferred that the tunnel’s resilience grade is classified as the “III” level. We should prepare to take countermeasures.
5.2. Result Analysis
During the operation period of the selected instance project, a combination weighting method was employed to assess the safety resilience system indicators. The evaluation is conducted using the cloud model, and the selected sample projects are classified as Level III, indicating a relatively high resilience level. Once interference occurs, rescue measures can be implemented and rectified, enabling the highway operation system to be restored to a safe state within a specified time frame. Based on the indicator data in Table 15, it is evident that certain examples selected in this article exhibit unsatisfactory performance in the vehicle system, whereas the human system and road system remain in good condition. Therefore, it is necessary to monitor and pay attention to the influencing factors in the vehicle system during the subsequent operation and maintenance process. Because of the sturdy system and high resistance to interference in this segment, it exhibits good resilience; however, there is substantial opportunity for enhancement in its adaptability to interact closely with human systems. As a result, there is still a need for improvement in the section’s capacity to ensure the smooth functioning of daily safety systems.
5.3. Safety Improvement Measures
This article suggests measures to improve the operational capacity of highway tunnel groups from three aspects encompassing the concept of resilience.
Firstly, in terms of the resilience of the safety system, adaptation refers to the capacity to react to fluctuating environments. The case selected in this article still has considerable potential for enhancing its adaptability. On the one hand, during the design process, efforts should be made to increase tunnel spacing, minimize tunnel curve sections, and mitigate driver operational risks. On the contrary, it is imperative to reinforce daily management, carry out periodic maintenance, and enhance monitoring techniques, in order to promptly address any potential dangers that may emerge at any moment.
Secondly, when viewed from the resistance of resilience within the safety system, it denotes the transportation system’s capacity to ensure normal operation even when subjected to a certain level of interference. However, due to the uniqueness of tunnel groups, the system’s capacity to ensure regular operation in sudden disasters is comparatively limited. It is recommended that highway management departments intensify their supervision of traffic safety in highway tunnel groups located in mountainous regions, rigorously investigate high-risk driving incidents in tunnel sections, and reinforce safety education for drivers to fundamentally improve the system’s resilience.
Finally, from the recovery of the security system’s resilience, it denotes the capacity to swiftly restore to the pre-disturbance state, whether during or post-disturbance. Because of the extensive distance and numerous tunnels in the tunnel group, there is a need to enhance the security system’s capacity to recreate and adjust to novel surroundings post-interference. It is advisable to prepare pre-disaster emergency plans for potential disasters in subsequent operations and reinforce emergency plans during disasters. Additionally, it is crucial to update monitoring and warning equipment in a timely manner while attaching importance to information processing and learning capabilities to enhance the system’s resilience.
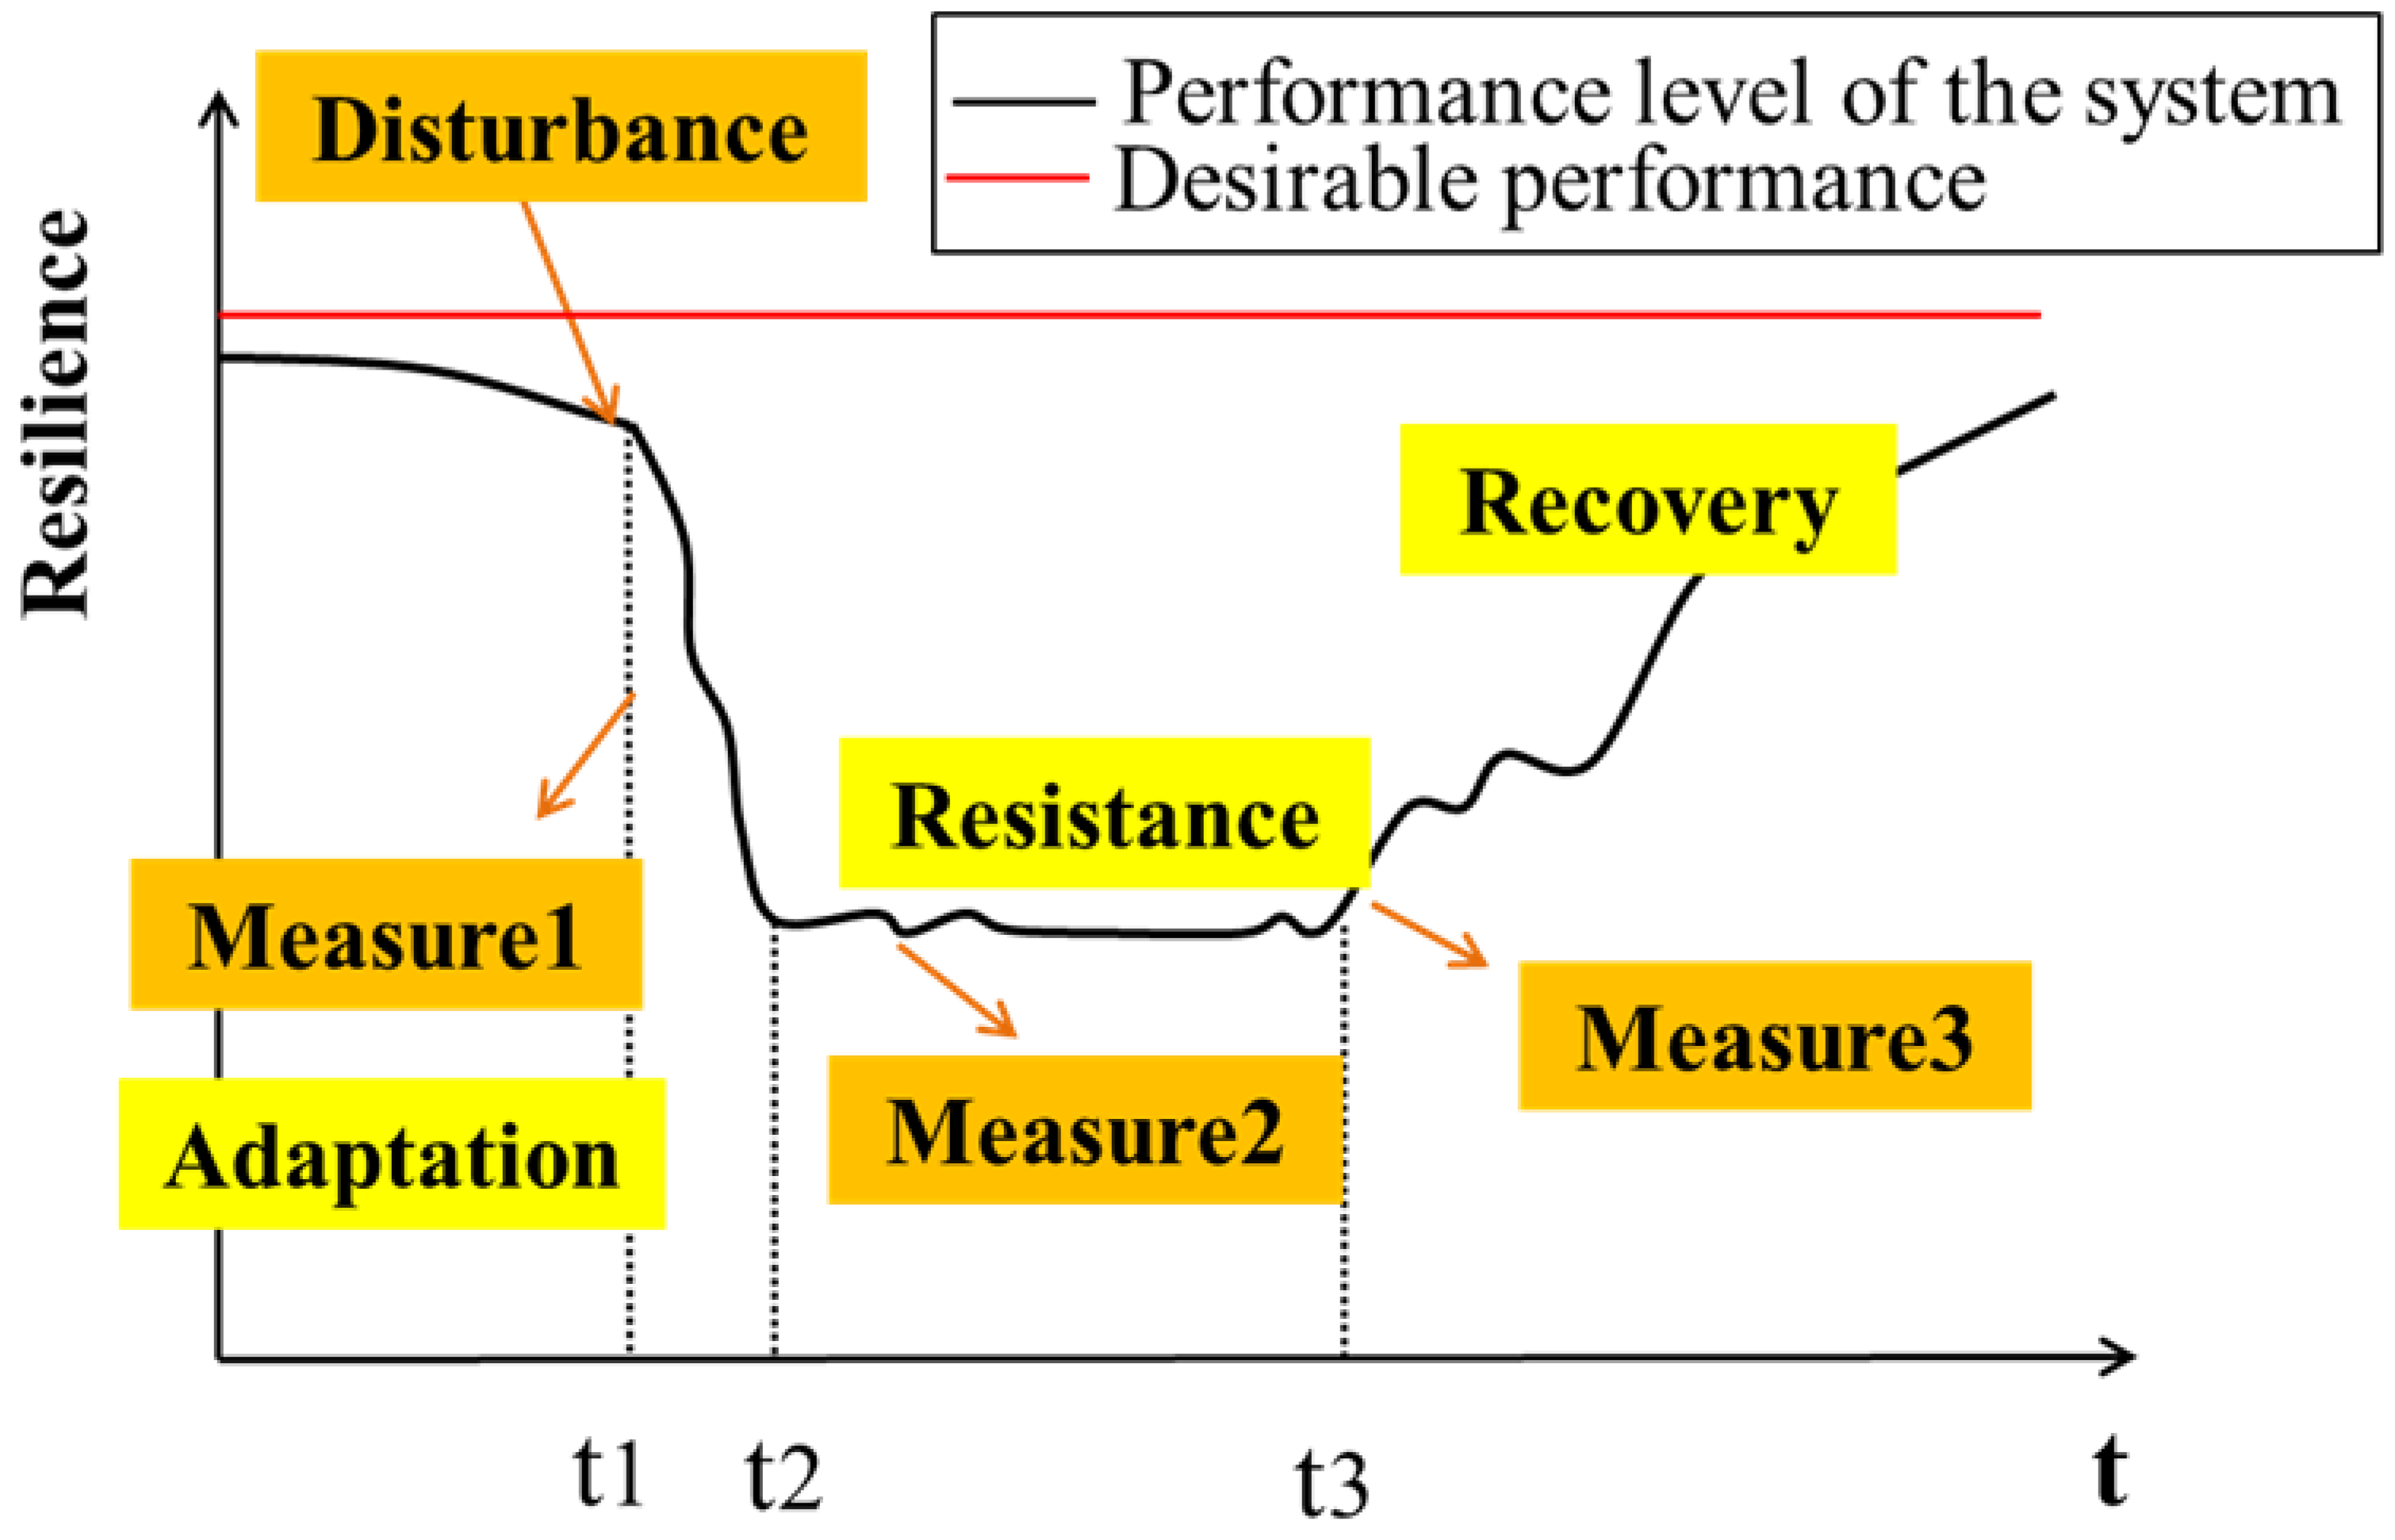
To sum up, this article proposes improvement measures for the three characteristics of resilience and draws a resilience performance curve of the safety system for highway tunnel group operation. As shown in Figure 16, after applying measures at different stages, the tunnel resilience will be improved to varying degrees.
6. Discussion
This study assessed the resilience of operational safety systems in highway tunnel networks by integrating weighting and cloud models. Previous research on tunnel safety has overlooked the concept of resilience, a gap this paper addresses. We established a comprehensive safety resilience index for tunnel operations, considering human, vehicle, and road factors, based on traffic accident analysis and risk identification. The resilience was then quantitatively assessed using a combination of weighting and cloud models, with the methodology’s efficacy demonstrated via case studies. However, the reliance on data from the Qinling Tunnel Group limits the study’s generalizability. Future research will aim to incorporate broader datasets over extended periods to refine the weighting results. Overall, this study offers a novel approach to evaluating highway tunnel network resilience, providing valuable insights for transportation authorities to enhance safety measures proactively, with significant practical implications.
7. Conclusions
This study summarizes and analyzes the traffic accident data of the Qinling Tunnel Group, establishes a resilience evaluation index system for the expressway tunnel group, and evaluates the resilience level of the expressway tunnel group. The research findings can be summarized as follows:
- This study performs a statistical analysis on traffic accidents within the Qinling Tunnel Group, delineating their distribution patterns and identifying risk factors associated with human, vehicle, and road elements.
- A resilience model for the highway tunnel group’s operational safety system was developed, incorporating a comprehensive set of indicators, grading criteria, and evaluation tiers based on traffic data analysis.
- The analytic hierarchy process was employed to assign subjective weights, while the entropy weight method was utilized for objective weights. A combined weighting approach determined the overall indicator weights. Subsequently, a cloud model facilitated the quantification of the operational safety resilience, enabling a synthesis of quantitative and qualitative insights for enhanced accuracy.
- To bolster the operational security system’s resilience, targeted improvement strategies were formulated, addressing its adaptation, resistance, and recovery.
Author Contributions
Conceptualization, H.L.; Methodology, H.L.; Software, H.L.; Formal analysis, H.L.; Investigation, Y.H.; Resources, Y.H.; Writing—original draft, H.L.; Writing—review & editing, H.L.; Visualization, H.L.; Supervision, Y.H. All authors have read and agreed to the published version of the manuscript.
Funding
This research was funded by Anhui Jianzhu University, grant number No. 2022QDZ24.
Institutional Review Board Statement
Not applicable.
Informed Consent Statement
Not applicable.
Data Availability Statement
Some or all data, models, or code that support the findings of this study are available from the corresponding author upon reasonable request.
Conflicts of Interest
Author Yiyang He was employed by the company Zhejiang Expressway Construction Management Co., Ltd. The remaining author declares that the research was conducted in the absence of any commercial or financial relationships that could be construed as a potential conflict of interest.
References
- Editorial Department of China Journal of Highway and Transport. A review of academic research on traffic tunnel engineering in China·2022. China J. Highw. Transp. 2022, 35, 1–40. [Google Scholar]
- Sun, H.; Wang, Q.; Zhang, P.; Zhong, Y.; Yue, X. Spatialtemporal Characteristics of Tunnel Traffic Accidents in China from 2001 to Present. Adv. Civ. Eng. 2019, 2019, 4536414. [Google Scholar] [CrossRef]
- Pervez, A.; Huang, H.; Han, C.; Wang, J.; Li, Y. Revisiting freeway single tunnel crash characteristics analysis: A six-zone analytic approach. Accid. Anal. Prev. 2020, 142, 105542. [Google Scholar] [CrossRef] [PubMed]
- Wang, F.; Wang, J.; Zhang, X.; Gu, D.; Yang, Y.; Zhu, H. Analysis of the causes of traffic accidents and identification of accident-prone points in long downhill tunnel of mountain expressways based on data mining. Sustainability 2022, 14, 8460. [Google Scholar] [CrossRef]
- Li, S.; Huang, S.; Wang, J.; He, S. Analysis of Factors Affecting the Over-Representation of Sequential Crashes in Freeway Tunnels: Using Rule-Based Data Mining Method. J. Adv. Transp. 2023, 2023, 7128408. [Google Scholar] [CrossRef]
- Luo, Q.; Liu, C. Exploration of road closure time characteristics of tunnel traffic accidents: A case study in Pennsylvania, USA. Tunn. Undergr. Space Technol. 2023, 132, 104894. [Google Scholar] [CrossRef]
- Shen, Y.; Zheng, C.; Wu, F. Study on Traffic Accident Forecast of Urban Excess Tunnel Considering Missing Data Filling. Appl. Sci. 2023, 13, 6773. [Google Scholar] [CrossRef]
- Cui, L.; Sheng, Q.; Zhang, J.; Dong, Y.-K.; Guo, Z.-S. Evaluation of input geological parameters and tunnel strain for strain-softening rock mass based on GSI. Sci. Rep. 2022, 12, 20575. [Google Scholar] [CrossRef]
- Kim, J.; Kim, C.; Kim, G.; Kim, I.; Abbas, Q.; Lee, J. Probabilistic tunnel collapse risk evaluation model using analytical hierarchy process (AHP) and Delphi survey technique. Tunn. Undergr. Space Technol. 2022, 120, 104262. [Google Scholar] [CrossRef]
- Ye, F.; Han, X.; Qin, N.; Ouyang, A.; Liang, X.; Xu, C. Damage management and safety evaluation for operating highway tunnels: A case study of Liupanshan tunnel. Struct. Infrastruct. Eng. 2020, 16, 1512–1523. [Google Scholar] [CrossRef]
- Yan, Y.; Wang, X.; Shi, L.; Liu, H. Influence of light zones on drivers’ visual fixation characteristics and traffic safety in extra-long tunnels. Traffic Inj. Prev. 2017, 18, 102–110. [Google Scholar] [CrossRef] [PubMed]
- Hyun, K.-C.; Min, S.; Choi, H.; Park, J.; Lee, I.-M. Risk analysis using fault-tree analysis (FTA) and analytic hierarchy process (AHP) applicable to shield TBM tunnels. Tunn. Undergr. Space Technol. Inc. Trenchless Technol. Res. 2015, 49, 121–129. [Google Scholar] [CrossRef]
- Luo, Y.; Gong, H.; Qu, D.; Zhang, X.; Tao, Y.; Li, X. Vibration velocity and frequency characteristics of surrounding rock of adjacent tunnel under blasting excavation. Sci. Rep. 2022, 12, 8453. [Google Scholar] [CrossRef] [PubMed]
- Lei, L.; Wang, F. The research on index system and method of high-speed railway tunnel operational safety evaluation. In Proceedings of the 2011 2nd IEEE International Conference on Emergency Management and Management Sciences, Beijing, China, 8–10 August 2011; IEEE: Piscataway, NJ, USA, 2011; pp. 116–119. [Google Scholar]
- Liu, W.; Cai, L.; Chen, J.; Wang, Y.; Wu, H. Reliability analysis of operational metro tunnel based on a dynamic Bayesian copula model. J. Comput. Civ. Eng. 2020, 34, 05020002. [Google Scholar] [CrossRef]
- Zhao, Y.; Qiu, R.; Chen, M.; Xiao, S. Research on Operational Safety Risk Assessment Method for Long and Large Highway Tunnels Based on FAHP and SPA. Appl. Sci. 2023, 13, 9151. [Google Scholar] [CrossRef]
- Shao, Y.; Xu, J. Understanding Urban resilience: A Conceptual Analysis Based on Integrated International Literature Review. Urban Plan. Int. 2015, 30, 48–54. [Google Scholar]
- Wei, Y.; Liang, J.; Deng, Y.; Dou, F.; Ning, Y.; Zhou, D.; Liu, J. Resilience Assessment of Beijing Subway Lines under Extreme Precipitation Weather. Appl. Sci. 2023, 13, 3964. [Google Scholar] [CrossRef]
- Qiao, W.; Ma, X.; Liu, Y.; Lan, H. Resilience assessment for the northern sea route based on a fuzzy Bayesian network. Appl. Sci. 2021, 11, 3619. [Google Scholar] [CrossRef]
- Wang, J.; Zhao, F.; He, X.; Wang, B. Resilience Evaluation of Subway Tunnel Surrounding Rock Based on Euclidean Distance. Railw. Stand. Des. 2019, 63, 106–111. [Google Scholar]
- Khetwal, S.; Pei, S.; Gutierrez, M. A Data-Driven Approach for Direct Assessment and Analysis of Traffic Tunnel Resilience. In Information Technology in Geo-Engineering; Springer International Publishing: Cham, Switzerland, 2022; pp. 168–177. [Google Scholar]
- Zheng, G.; Cheng, X.; Zhou, H.; Zhang, T.; Yu, X.; Diao, Y.; Wang, R.; Yi, F.; Zhang, W.; Guo, W. Evaluation and Control of Structural Resilience in Geotechnical and Underground Engineering. China Civ. Eng. J. 2022, 55, 1–38. [Google Scholar]
- Xu, C.; Hu, H.; Wang, H. A theoretical study on the resilience evaluation method of operational road tunnel systems. Appl. Sci. 2023, 13, 13279. [Google Scholar] [CrossRef]
- Lin, X.T.; Chen, X.; Su, D.; Han, K.; Zhu, M. An analytical model to evaluate the resilience of shield tunnel linings considering multistage disturbances and recoveries. Tunn. Undergr. Space Technol. 2022, 127, 104581. [Google Scholar] [CrossRef]
- Caliendo, C.; Russo, I.; Genovese, G. Resilience Assessment of a Twin-Tube Motorway Tunnel in the Event of a Traffic Accident or Fire in a Tube. Appl. Sci. 2022, 12, 513. [Google Scholar] [CrossRef]
- Liu, F.; Tang, C.; Zhang, Y.; Ma, T. Rockburst and microseismicity characteristics in the qinling water conveyance tunnel of the hanjiang-to-weihe river diversion project. Int. J. Rock Mech. Min. Sci. 2021, 148, 104973. [Google Scholar] [CrossRef]
- Wang, X.; Lai, J.; Garnes, R.; Luo, Y. Support system for tunnelling in squeezing ground of qingling-daba mountainous area: A case study from soft rock tunnels. Adv. Civ. Eng. 2019, 2019, 8682535. [Google Scholar] [CrossRef]
- Xing, R.; Li, Z.; Cai, X.; Yang, Z.; Zhang, N.; Yang, T. Accident Rate Prediction Model for Urban Expressway Underwater Tunnel. Sustainability 2023, 15, 10730. [Google Scholar] [CrossRef]
- Sun, Z.; Liu, S.; Tang, J.; Wu, P.; Tang, B. Exploring the Impacts of Driving Environment on Crashes in Tunnel-Bridge-Tunnel Groups: An Eight-Zone Analytic Approach. Sustainability 2021, 13, 2272. [Google Scholar] [CrossRef]
- Yuan, J. Analysis of Traffic Accident Characteristics and Safety Risk Assessment of Expressway Tunnels in Sichuan Province. Master’s Thesis, Southwest Jiaotong University, Chengdu, China, 2018. [Google Scholar]
- Tichy, T.; Broz, J.; Belinova, Z.; Pirnik, R. Analysis of predictive maintenance for tunnel systems. Sustainability 2021, 13, 3977. [Google Scholar] [CrossRef]
- Wang, N.; Ren, Z.; Zhang, Z.; Fu, J. Evaluation and Prediction of Higher Education System Based on AHP-TOPSIS and LSTM Neural Network. Appl. Sci. 2022, 12, 4987. [Google Scholar] [CrossRef]
- Cai, X.; Lei, C.; Peng, B.; Tang, X.; Gao, Z. Road traffic safety risk estimation method based on vehicle onboard diagnostic data. J. Adv. Transp. 2020, 2020, 3024101. [Google Scholar] [CrossRef]
- Chen, X.; Li, X.; Zhu, H. Condition evaluation of urban metro shield tunnels in shanghai through multiple indicators multiple causes model combined with multiple regression method. Tunn. Undergr. Space Technol. 2019, 85, 170–181. [Google Scholar] [CrossRef]
- Deng, Y.; Song, L.; Zhou, J.; Xu, N.; Ni, G.; Wang, L. Analysis of Failures and Influence Factors of Critical Infrastructures: A Case of Metro. Adv. Civ. Eng. 2020, 2020, 2301276. [Google Scholar] [CrossRef]
- Wang, J.; Pervez, A.; Wang, Z.; Han, C.; Hu, L.; Huang, H. Crash analysis of chinese freeway tunnel groups using a five-zone analytic approach. Tunn. Undergr. Space Technol. 2018, 82, 358–365. [Google Scholar] [CrossRef]
- Bi, X.; Fan, Q.; He, L.; Zhang, C.; Diao, Y.; Han, Y. Analysis and Evaluation of Extreme Rainfall Trends and Geological Hazards Risk in the Lower Jinshajiang River. Appl. Sci. 2023, 13, 4021. [Google Scholar] [CrossRef]
- Zakeri, S.; Choupani, A.A. Operational evaluation of a throughabout to give priority to public transport at standard roundabouts. J. Adv. Transp. 2021, 2021, 1840040. [Google Scholar] [CrossRef]
- Yao, P.; Yu, Z.; Lv, Y.; Shi, B.; He, Y.; Wang, H.; Liu, D.; Wei, S. Safety level assessment of shield tunneling in water rich sandy pebble strata with large particle size. Sci. Rep. 2023, 13, 3854. [Google Scholar] [CrossRef] [PubMed]
- Bognár, F.; Benedek, P. A novel AHP-PRISM risk assessment method—An empirical case study in a nuclear power plant. Sustainability 2022, 14, 11023. [Google Scholar] [CrossRef]
- Li, Y.; Zhao, L.; Suo, J. Comprehensive assessment on sustainable development of highway transportation capacity based on entropy weight and TOPSIS. Sustainability 2014, 6, 4685–4693. [Google Scholar] [CrossRef]
- Sun, Q.; Zhang, T.; Wang, X.; Lin, W.; Fong, S.; Chen, Z.; Xu, F.; Wu, L. An ambient air quality evaluation model based on improved evidence theory. Sci. Rep. 2022, 12, 5753. [Google Scholar] [CrossRef] [PubMed]
- Li, Z.; Fan, Z.; Shen, S. Urban green space suitability evaluation based on the AHP-CV combined weight method: A case study of Fuping county, China. Sustainability 2018, 10, 2656. [Google Scholar] [CrossRef]
- Yu, H.; Liang, C.; Li, P.; Niu, K.; Du, F.; Shao, J.; Liu, Y. Evaluation of waterlogging risk in an urban subway station. Adv. Civ. Eng. 2019, 2019, 5393171. [Google Scholar] [CrossRef]
- Chang, Z.; Mei, H.; Yan, C.; Shi, Y.; Zhu, X.; Lu, Z.; Jia, Z. Health status evaluation of highway tunnel inverted arch based on variable weight and extension cloud model. Eng. Fail. Anal. 2024, 157, 107939. [Google Scholar] [CrossRef]
- Ministry of Transport, Engineering Quality Supervision Bureau. Analysis of the Safety Risk Assessment System and Guide for Highway Bridge and Tunnel Construction; People’s Transportation Publishing House: Beijing, China, 2011. [Google Scholar]
- Wen, X.; Nie, Y.; Du, Z.; Huang, L. Operational safety assessment of straddle-type monorail vehicle system based on cloud model and improved CRITIC method. Eng. Fail. Anal. 2022, 139, 106463. [Google Scholar] [CrossRef]
Figure 1.
Qinling No.1 Tunnel 8.10 major traffic accident (https://www.sohu.com/a/163754832_99917167, accessed on 8 July 2023).
Figure 1.
Qinling No.1 Tunnel 8.10 major traffic accident (https://www.sohu.com/a/163754832_99917167, accessed on 8 July 2023).

Figure 2.
The hourly distribution of traffic accidents in the Qinling Tunnel Group.

Figure 3.
The monthly distribution of traffic accidents in the Qinling Tunnel Group.

Figure 4.
A figure displaying the proportion of traffic accidents in the Qinling Tunnel Group.

Figure 5.
A figure of the proportion of traffic accidents in the Qinling Tunnel Group.

Figure 6.
Proportion of traffic accident causes.
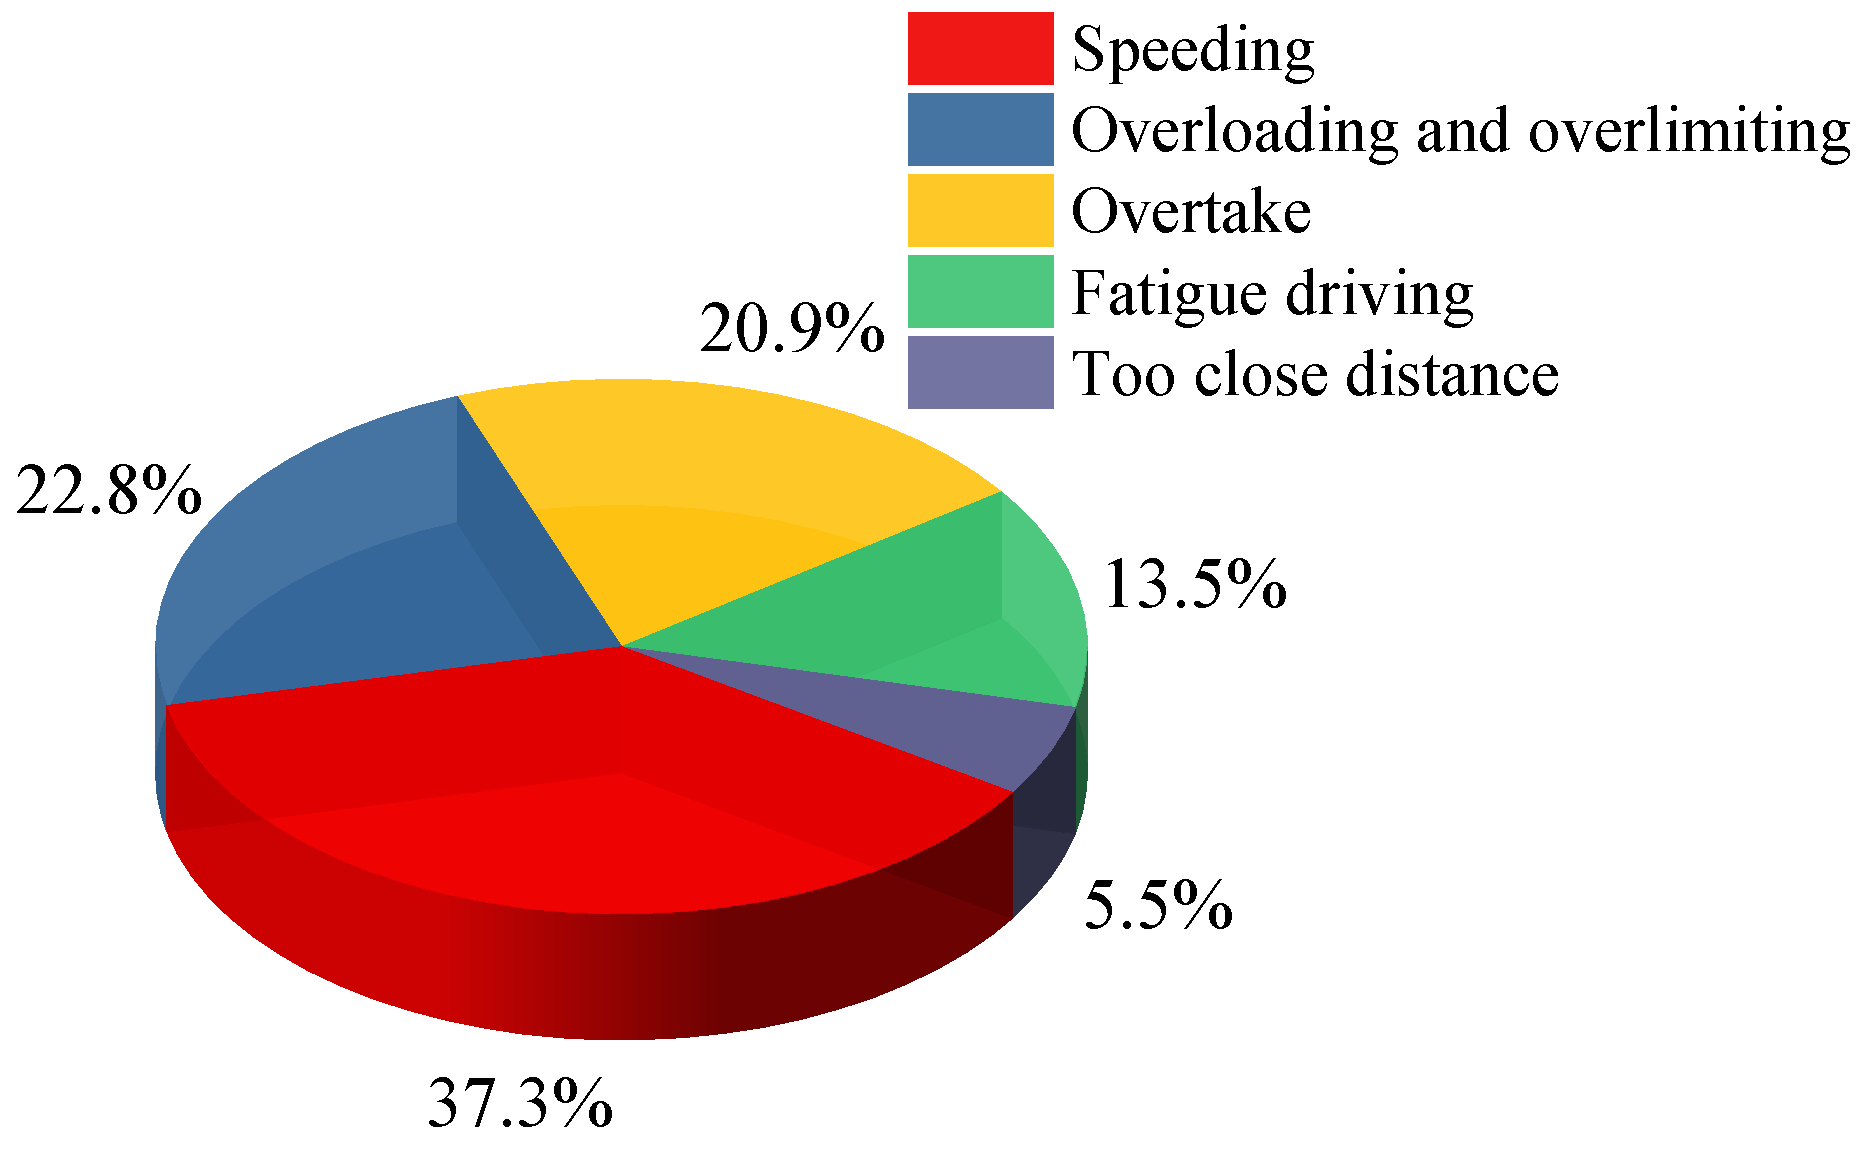
Figure 7.
Proportion of vehicle types in traffic accidents.
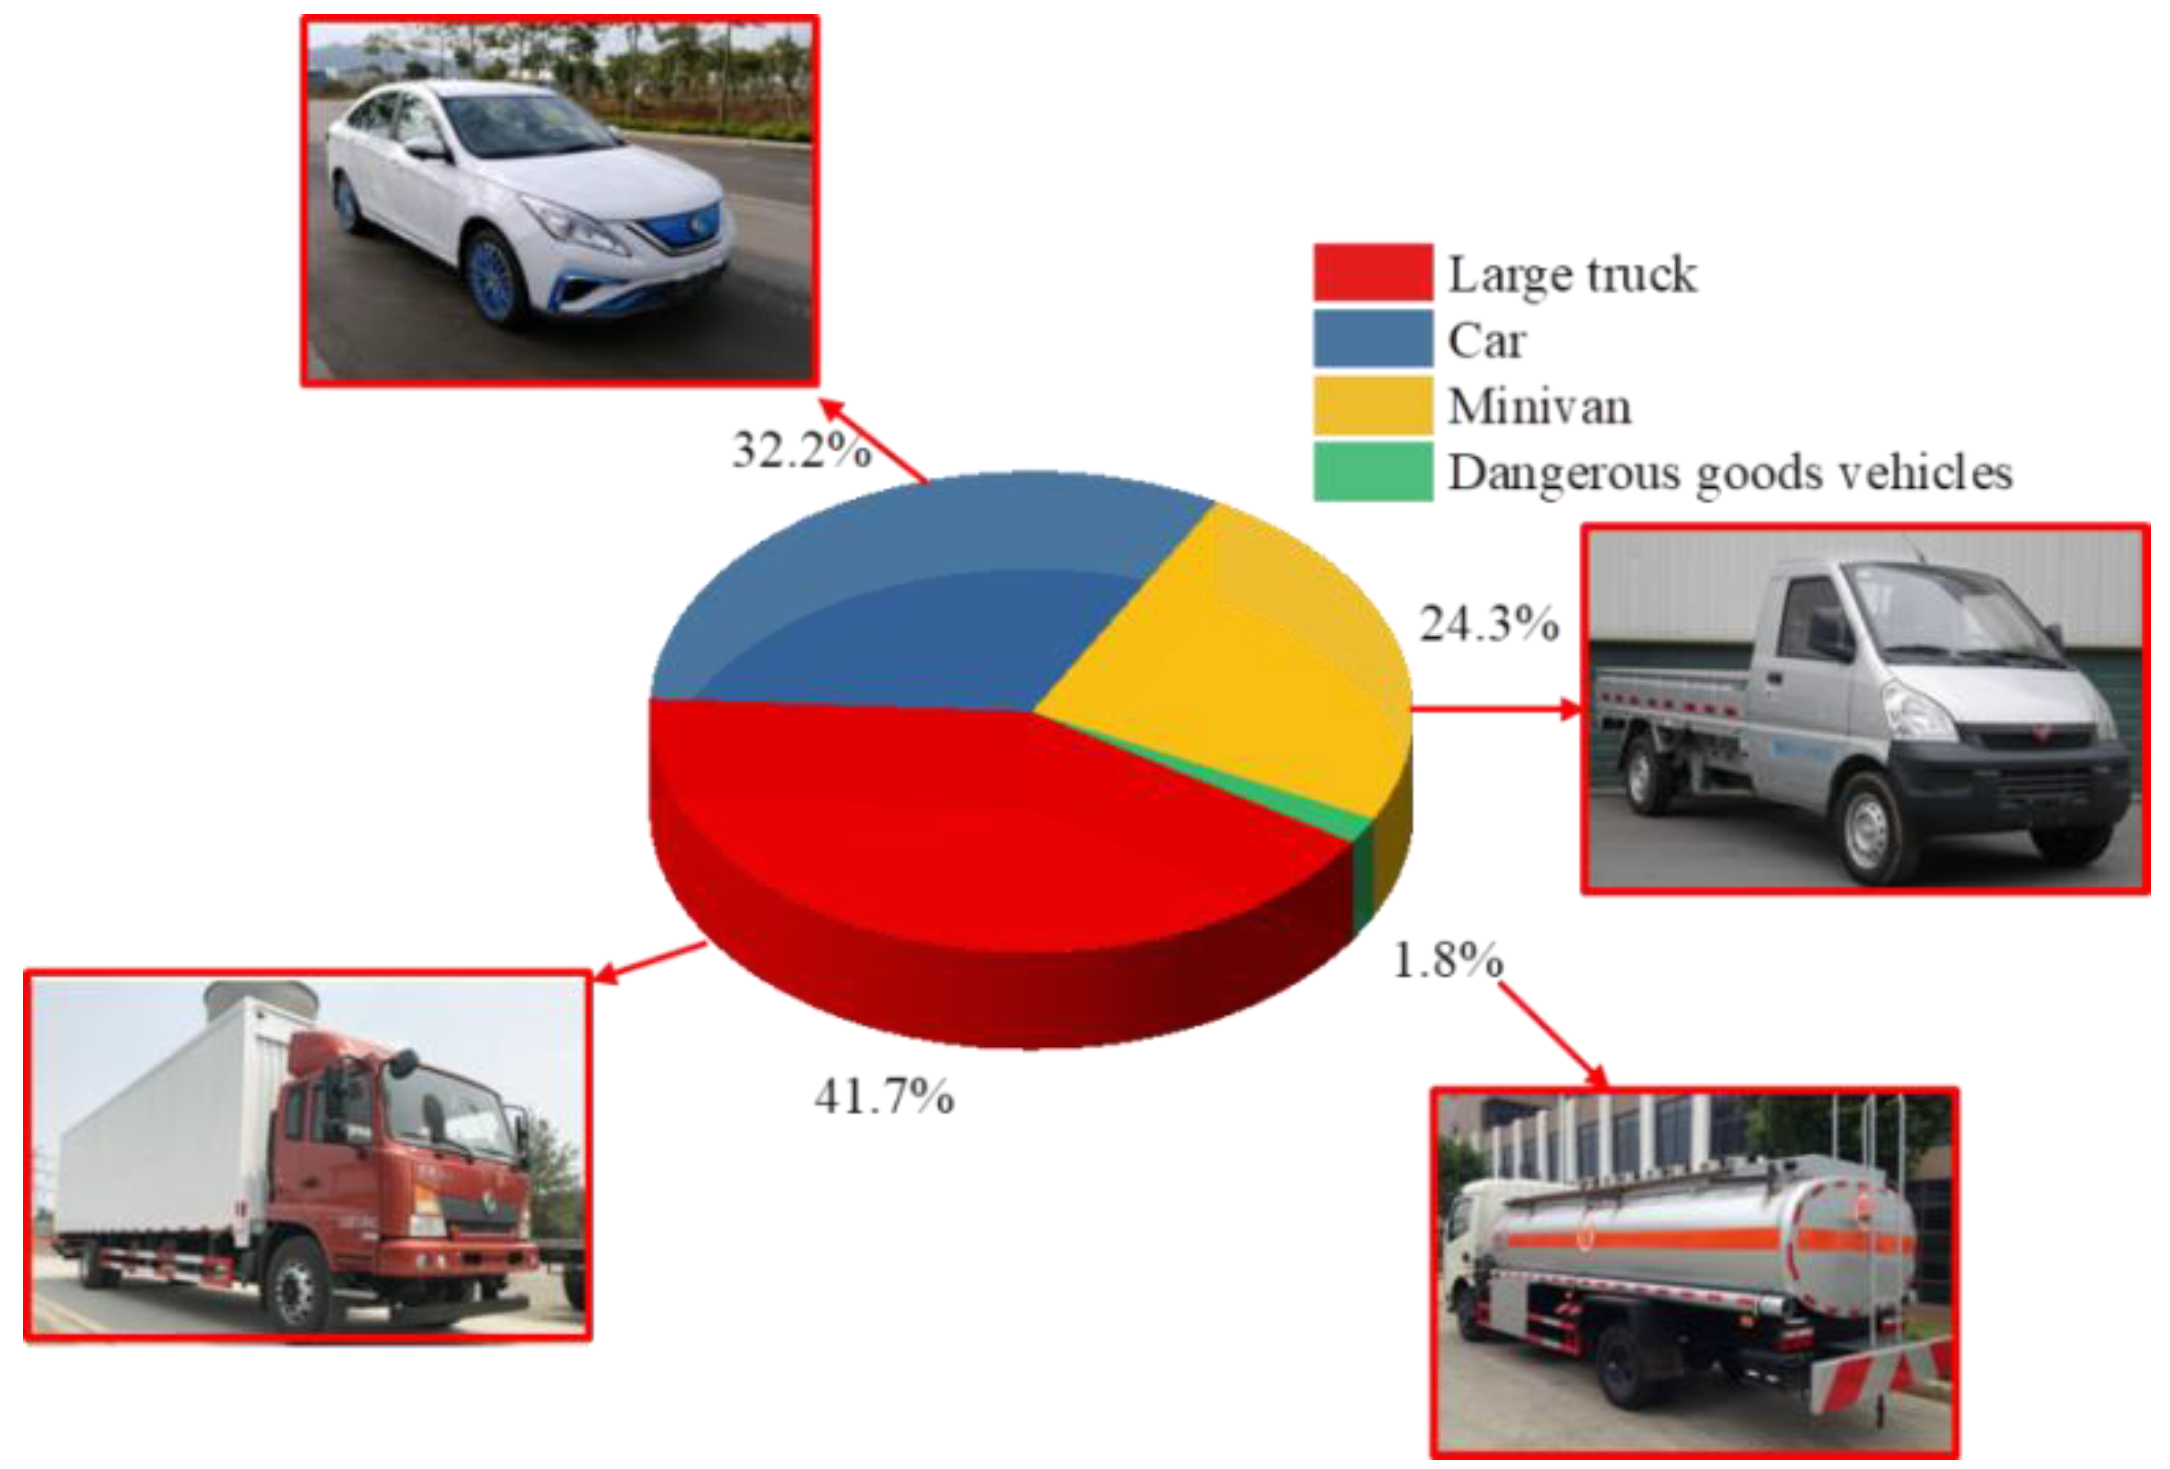
Figure 8.
Comparison chart of traffic volume and accident rate.

Figure 9.
The horizontal linear distribution law of traffic accidents.
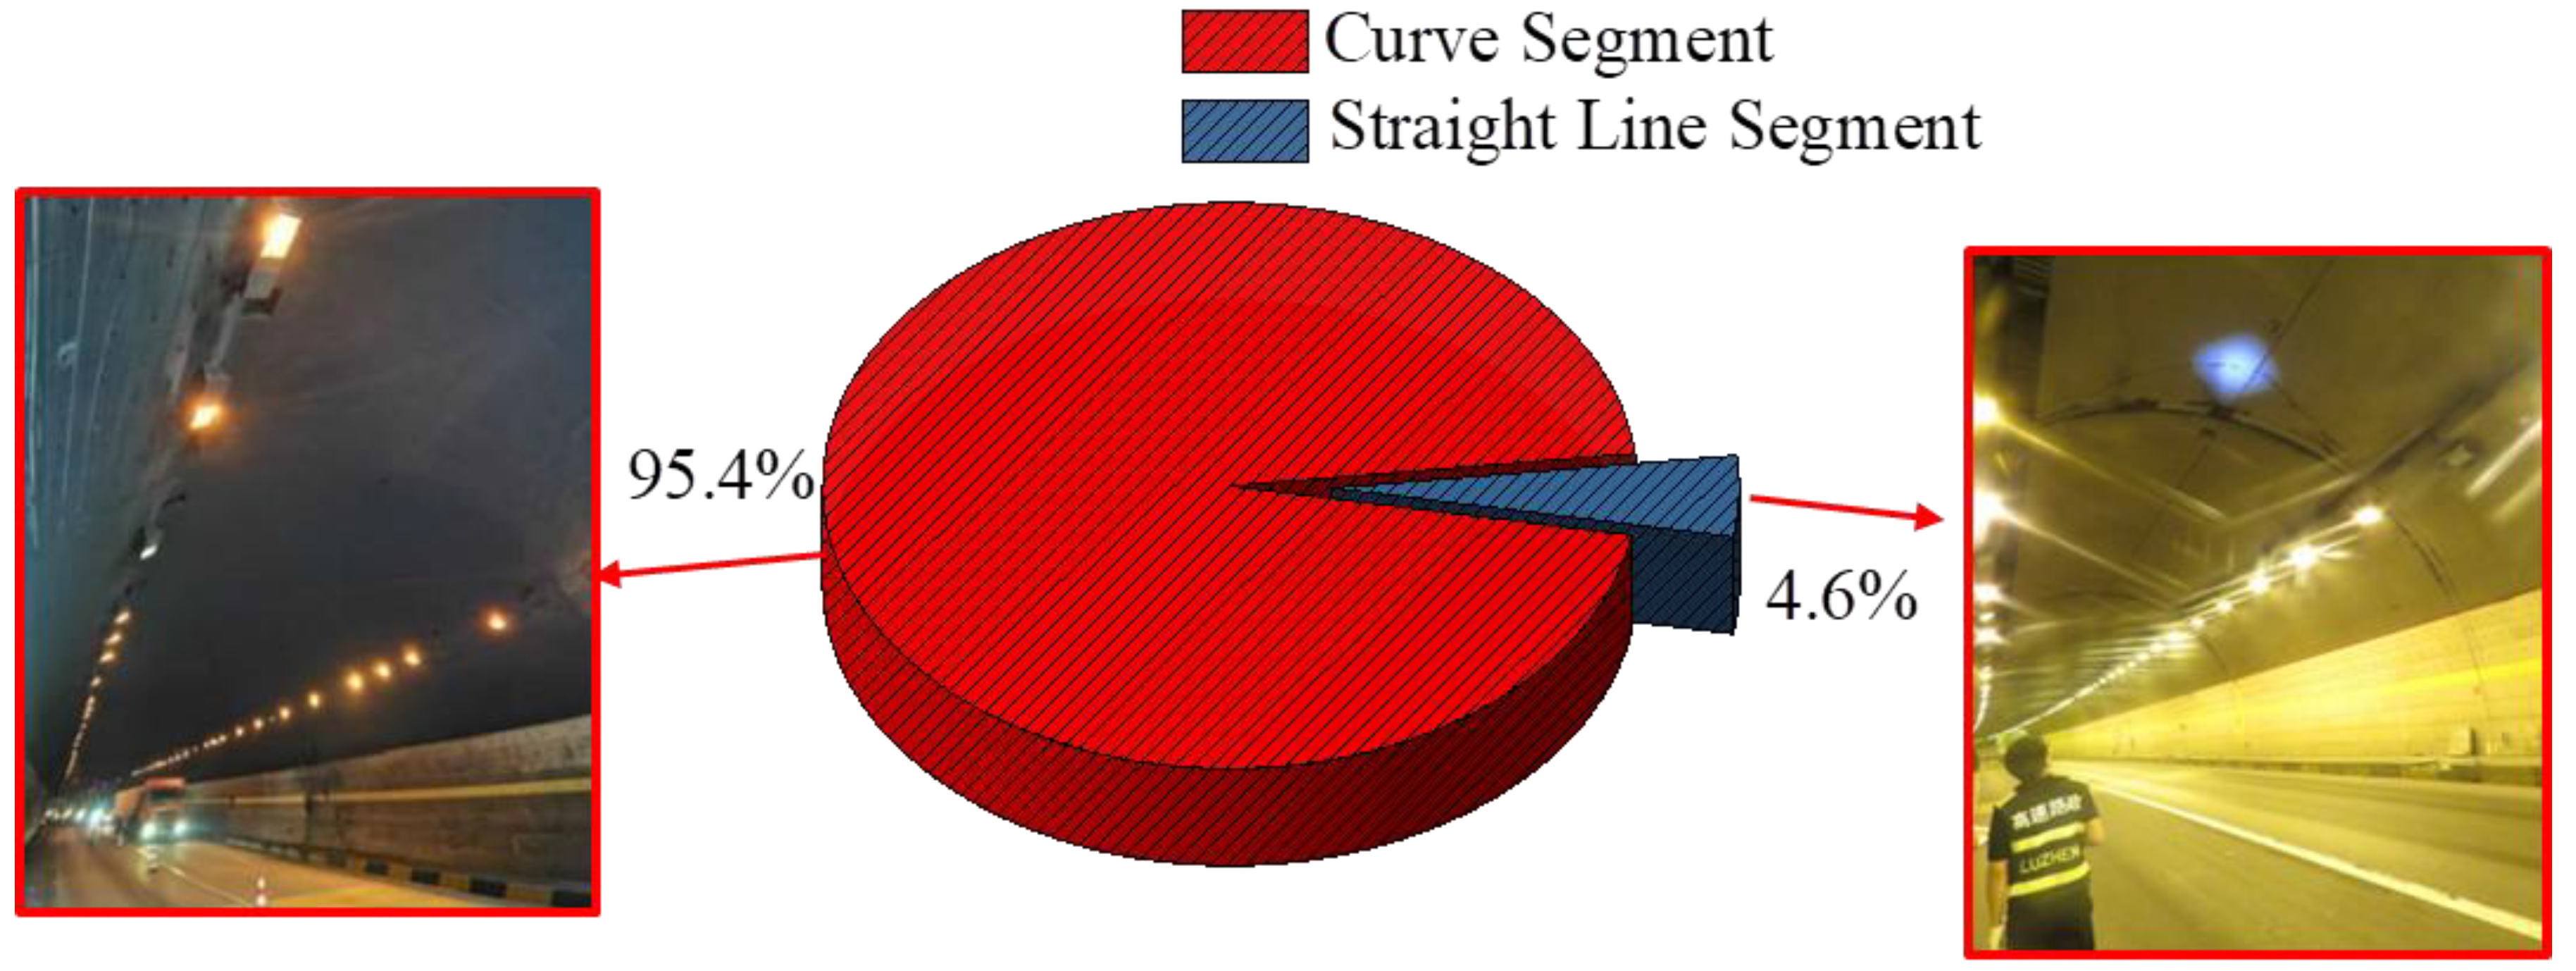
Figure 10.
Comparison of tunnel accident rates before and after milling.

Figure 11.
Conceptual model of resilience for safety system of expressway tunnel group operation.
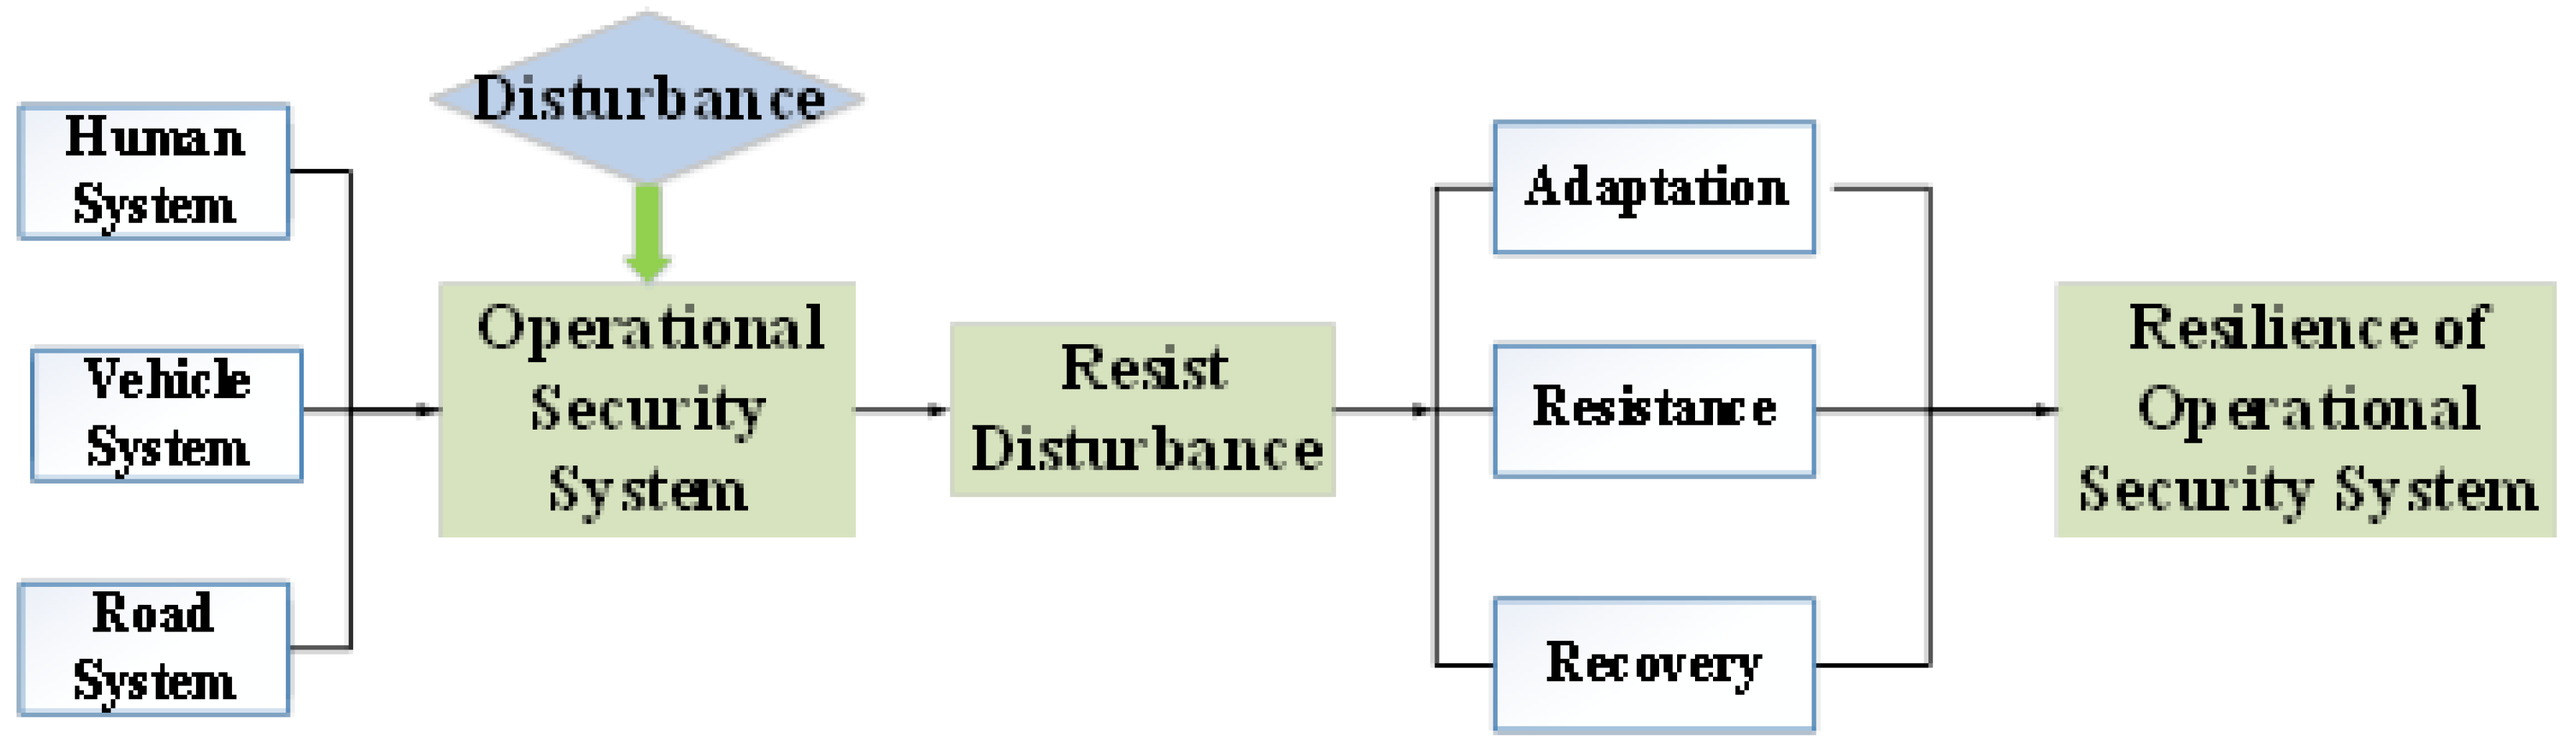
Figure 12.
Evaluation index system for resilience of expressway tunnel group operation safety system.
Figure 12.
Evaluation index system for resilience of expressway tunnel group operation safety system.

Figure 13.
Resilience rating calculation process.

Figure 14.
Standard cloud model.

Figure 15.
Comprehensive evaluation cloud model diagram of Qinling Tunnel No. 1.

Figure 16.
Resilience performance curve of safety system for highway tunnel group operation.

Table 1.
The statistical findings of certain traffic accidents that occurred within the Western Han Dynasty’s high-speed tunnel complex.
Table 1.
The statistical findings of certain traffic accidents that occurred within the Western Han Dynasty’s high-speed tunnel complex.
| No. | Accident Site | Accident Time | Accident Location | Accident Reason | Type of Accident Vehicle | Casualties |
|---|---|---|---|---|---|---|
| 1 | Qinling No.1 Tunnel | 16 May 2018 14:20 | K1159 + 100 m Xian direction | Overspeed | Car | 2 Injuries |
| 2 | Qinling No.2 Tunnel | 14 September 2018 13:30 | 1171 + 400 m Xian direction | Overloading | Large truck | 1 Injuries |
| 3 | Shuanglin Tunnel | 19 January 2019 19:53 | K1153 + 800 m Hanzhong direction | Overspeed | Car | 1 Injuries |
| 4 | Heichagou Tunnel | 31 January 2019 9:50 | K1148 + 100 m Hanzhong direction | Fatigue driving | Car | - |
| 5 | Guanyinshan Tunnel | 9 October 2019 19:10 | K1158 + 900 m Hanzhong direction | Too close interval | Car | 1 Injuries |
| 6 | Qinling No.3 Tunnel | 21 April 2020 22:56 | K1172 + 400 m Hanzhong direction | Overtake | Car | - |
| 7 | Xishuiliu No.2 Tunnel | 27 May 2020 21:52 | K1149 + 100 m Xian direction | Overspeed | Large truck | 2 Injuries |
| 8 | Qinling No.2 Tunnel | 26 November 2020 23:01 | K1165 + 510 m Hanzhong direction | Overspeed | Light truck | 2 Death |
Table 2.
Statistical table of traffic accident causes.
| Accident Cause | Number of Accidents | The Proportion of Accidents (%) |
|---|---|---|
| Speeding | 115 | 37.3 |
| Overloading and overlimiting | 70 | 22.8 |
| Overtake | 64 | 20.9 |
| Fatigue driving | 42 | 13.5 |
| Too close interval | 17 | 5.5 |
Table 3.
Statistical table of vehicle types in traffic accidents.
| Type of Accident Vehicle | Number of Accidents | The Proportion of Accidents (%) |
|---|---|---|
| Large truck | 201 | 41.7 |
| Car | 155 | 32.2 |
| Light truck | 117 | 24.3 |
| Dangerous material vehicles | 9 | 1.8 |
Table 4.
Statistical table of traffic volume and accident rate of Qinling Tunnel Group.
| Year | Traffic Volume (10,000 Vehicles/Year) | Accident Rate (Times/Million Vehicles Kilometers) |
|---|---|---|
| 2015 | 847 | 0.456 |
| 2016 | 921 | 0.499 |
| 2017 | 1005 | 0.523 |
| 2018 | 1113 | 0.360 |
| 2019 | 1441 | 0.391 |
| 2020 | 1173 | 0.302 |
| 2021 | 1289 | 0.425 |
Table 5.
Statistical table of plane linear distribution of traffic accidents.
| Characteristics of the Accident Site | Number of Accidents | The Proportion of Accidents (%) |
|---|---|---|
| Curve section | 447 | 95.4 |
| Straight section | 21 | 4.6 |
Table 6.
Statistical table of accident rate before and after milling.
| Tunnel Name | Accident Rate (Times/Million Vehicles Kilometers) | Reduction Rate (%) | |
|---|---|---|---|
| Before Measures | After Measures | ||
| Qinling No.1 Tunnel | 0.667 | 0.455 | 31.8 |
| Qinling No.2 Tunnel | 0.603 | 0.398 | 34.1 |
| Qinling No.3 Tunnel | 0.647 | 0.347 | 35.3 |
Table 7.
Standard for grading resilience evaluation index of expressway tunnel group operation safety system.
Table 7.
Standard for grading resilience evaluation index of expressway tunnel group operation safety system.
| Index Classification | Index Description | Index Influence | ||||
|---|---|---|---|---|---|---|
| Primary Index | Resilience Indicator | Low Resilience | Medium Resilience | Relatively High Resilience | High Resilience | |
| Human | Driving behavior R1 | High-risk driving behavior >75‱ | High-risk driving behavior 50–75‱ | High-risk driving behavior 25–50‱ | High-risk driving behavior <25‱ | − |
| Driving time R2 | 8:00 to 18:00 >80% | 8:00 to 18:00 60–80% | 8:00 to 18:00 40–60% | 8:00 to 18:00 <40% | − | |
| Vehicle | Traffic volume S1 | >1400 (10,000 vehicles/year) | 1200 (10,000 vehicles/year)–1400 (10,000 vehicles/year) | 1000 (10,000 vehicles/year)–1200 (10,000 vehicles/year) | <1000 (10,000 vehicles/year) | − |
| Vehicle type S2 | Large truck > 40% | Large truck 20–30% | Large truck 10–20% | Large truck < 10% | − | |
| Road | Tunnel condition T1 | Technical Condition Score < 55 | Technical Condition Score 55–70 | Technical Condition Score 70–85 | Technical Condition Score 85–100 | − |
| Tunnel spacing T2 | 0–200 m | 200–400 m | 400–600 m | >600 m | + | |
| Pavement condition T3 | Pavement grade 1 | Pavement grade 2 | Pavement grade 3 | Pavement grade 4 | + | |
| Plane alignment T4 | Number of curve segments > 2 | Number of curve segments 2 | Number of curve segments 1 | Number of curve segments 0 | − | |
The “+” symbol indicates a direct correlation where larger indicator values enhance system resilience, while the “−“ symbol denotes an inverse relationship, with higher indicator values reducing resilience.
Table 8.
Resilience grading and description.
| Evaluation Level | Ⅰ | II | III | IV |
|---|---|---|---|---|
| Level Description | Low resilience | Medium resilience | Relatively high resilience | High resilience |
| The system’s weak anti-interference ability results in substantial losses when faced with interference. After interference occurs, effective rescue and repair become impossible, and it takes a considerable amount of time to restore a safe state. | The system possesses a specific capacity to resist interference, albeit resulting in moderate losses when faced with such interference. Once interference takes place, rescue measures can be implemented and maintenance can be performed, enabling the restoration of the tunnel group operation system to a safe state within a specified time frame. | The system boasts excellent resistance to interference, resulting in minimal damage to the system due to interferences. Moreover, it can efficiently carry out rescue operations and repair equipment, enabling the tunnel group operation system to be restored to a safe state in a brief time frame. | The system boasts excellent anti-interference capabilities, resulting in minimal losses in the presence of interference. Once interference occurs, prompt and efficient rescue measures can be implemented, enabling the tunnel group operation system to be swiftly restored to a secure state. |
Table 9.
Judgment matrix scale and its meaning.
| Scale | Mean |
|---|---|
| 1 | Both elements are equally important |
| 3 | The former is slightly more important than the latter |
| 5 | The former is obviously more important than the latter |
| 7 | The former is more important than the latter |
| 9 | The former is more important than the latter |
| 2, 4, 6, 8 | The middle of two adjacent judgments |
| Count backwards | Less important than the other element |
Table 10.
Subjective weight table for safety and resilience indicators of expressway tunnel group operation.
Table 10.
Subjective weight table for safety and resilience indicators of expressway tunnel group operation.
| Primary Index | Weight | Secondary Indicator | Weight | Relative Weight |
|---|---|---|---|---|
| Human R | 0.23 | Driving behavior R1 | 0.75 | 0.171 |
| Driving time R2 | 0.25 | 0.057 | ||
| Vehicle S | 0.18 | Traffic volume S1 | 0.8 | 0.146 |
| Vehicle type S2 | 0.2 | 0.036 | ||
| Road T | 0.59 | Tunnel condition T1 | 0.47 | 0.278 |
| Tunnel spacing T2 | 0.11 | 0.064 | ||
| Pavement condition T3 | 0.26 | 0.151 | ||
| Plane alignment T4 | 0.16 | 0.097 |
Table 11.
Traffic data of Qinling Tunnel Group on Xihan Expressway.
| Secondary Indicator | Driving Behavior R1 | Driving Time R2 | Traffic Volume S1 | Vehicle Type S2 |
|---|---|---|---|---|
| 2015 | 8 | 44 | 847 | 20 |
| 2016 | 9 | 47 | 921 | 27 |
| 2017 | 10 | 52 | 1005 | 40 |
| 2018 | 15 | 67 | 1113 | 31 |
| 2019 | 20 | 50 | 1441 | 29 |
| 2020 | 22 | 61 | 1173 | 38 |
Table 12.
Structural data of Qinling Tunnel Group on Xihan Expressway.
| Secondary Indicator | Tunnel Condition T1 | Tunnel Spacing T2 | Pavement Condition T3 | Plane Alignment T4 |
|---|---|---|---|---|
| Qinling Tunnel No.1 | 82.7 | 538 | 4 | 9 |
| Qinling Tunnel No.2 | 79.8 | 120 | 3 | 6 |
| Qinling Tunnel No.3 | 78.1 | 645 | 3 | 7 |
| Guojiashan Tunnel | 79.2 | 824 | 4 | 8 |
| Zhujiaya Tunnel | 80.2 | 312 | 2 | 6 |
| Liangxin Tunnel | 76.7 | 674 | 3 | 7 |
Table 13.
Weighting table of safety and resilience indicators for expressway tunnel group operation.
Table 13.
Weighting table of safety and resilience indicators for expressway tunnel group operation.
| Primary Index | Weight | Secondary Indicator | Weight |
|---|---|---|---|
| Human R | 0.23 | Driving behavior R1 | 0.211 |
| Driving time R2 | 0.058 | ||
| Vehicle S | 0.18 | Traffic volume S1 | 0.141 |
| Vehicle type S2 | 0.024 | ||
| Road T | 0.59 | Tunnel condition T1 | 0.204 |
| Tunnel spacing T2 | 0.056 | ||
| Pavement condition T3 | 0.178 | ||
| Plane alignment T4 | 0.128 |
Table 14.
Comprehensive resilience evaluation grades for highway tunnel clusters.
| Evaluation Level | Composite Evaluation Value | Safety Conditions | Countermeasure |
|---|---|---|---|
| Ⅰ | 66 ≥ D > 0 | Low resilience | Take immediate countermeasures |
| II | 80 ≥ D > 66 | Medium resilience | Take countermeasures as soon as possible |
| III | 90 ≥ D > 80 | Relatively high resilience | Prepare to take countermeasures |
| IV | 100 ≥ D > 90 | High resilience | Monitoring and observation |
Table 15.
Data of Qinling No.1 Tunnel.
| Primary Index | Secondary Indicator | Real Data | Indicator Description |
|---|---|---|---|
| Human (R) | Driving behavior (R1) | 37‱ | Relatively high resilience |
| Driving time (R2) | 47% | Relatively high resilience | |
| Vehicle (S) | Traffic volume (S1) | 847 | Low resilience |
| Vehicle type (S2) | 13% | Medium resilience | |
| Road (T) | Tunnel condition (T1) | 82.7 | Relatively high resilience |
| Tunnel spacing (T2) | 538 | Relatively high resilience | |
| Pavement condition (T3) | 3 | High resilience | |
| Plane alignment (T4) | 9 | Low resilience |
Disclaimer/Publisher’s Note: The statements, opinions and data contained in all publications are solely those of the individual author(s) and contributor(s) and not of MDPI and/or the editor(s). MDPI and/or the editor(s) disclaim responsibility for any injury to people or property resulting from any ideas, methods, instructions or products referred to in the content. |
© 2024 by the authors. Licensee MDPI, Basel, Switzerland. This article is an open access article distributed under the terms and conditions of the Creative Commons Attribution (CC BY) license (https://creativecommons.org/licenses/by/4.0/).
Share and Cite
MDPI and ACS Style
Liu, H.; He, Y. Comprehensive Evaluation of Resilience for Qinling Tunnel Group Operation Safety System Based on Combined Weighting and Cloud Model. Sustainability 2024, 16, 3937. https://doi.org/10.3390/su16103937
AMA Style
Liu H, He Y. Comprehensive Evaluation of Resilience for Qinling Tunnel Group Operation Safety System Based on Combined Weighting and Cloud Model. Sustainability. 2024; 16(10):3937. https://doi.org/10.3390/su16103937
Chicago/Turabian StyleLiu, Haiyang, and Yiyang He. 2024. "Comprehensive Evaluation of Resilience for Qinling Tunnel Group Operation Safety System Based on Combined Weighting and Cloud Model" Sustainability 16, no. 10: 3937. https://doi.org/10.3390/su16103937
Note that from the first issue of 2016, this journal uses article numbers instead of page numbers. See further details here.