

Decomposition of China’s Carbon Emissions Responsibility from the Perspective of Technological Heterogeneity

School of Business, Suzhou University of Science and Technology, Suzhou 210059, China
*
Author to whom correspondence should be addressed.
Sustainability 2024, 16(10), 3978; https://doi.org/10.3390/su16103978
Submission received: 27 March 2024
/
Revised: 23 April 2024
/
Accepted: 7 May 2024
/
Published: 9 May 2024
Abstract
:A global agreement has been reached on the reduction in greenhouse gas emissions. Worldwide, countries have implemented measures to tackle carbon emission issues by establishing aggregate targets and decomposing responsibilities. This study aims to decompose carbon emissions by creating an input–output model that incorporates multivariate factors like energy consumption and water consumption, together with a ZSG-DEA (zero-sum data envelopment analysis) model considering technological heterogeneity (Tech-ZSG-DEA). Based on the total carbon emission data predicted using the STIRPAT (Stochastic Impacts by Regression on Population, Affluence, and Technology) model, the carbon emission efficiency of 30 provinces in China is evaluated according to multiple principles. This is achieved by considering variations in population, economy, energy consumption, and water consumption across different locations. The efficiency findings indicate a discrepancy between the initial allocation and the highest efficiency value of 1. The traditional ZSG-DEA model overlooks regional disparities and may worsen carbon emission pressures in less developed areas. In contrast, the Tech-ZSG-DEA model, which considers regional technological diversity, allows more efficient regions to help alleviate some of the carbon emission burden and considers economic and social benefits. There is a large difference in the emission responsibility of the provinces based on the different decomposition principles. Finally, relevant policy recommendations are provided, such as the formulation of differentiated and inclusively coordinated emission plans. In addition, there are also mechanisms for coordinating interests and joint prevention among different regions.
1. Introduction
Climate change is an urgent issue for humanity. Growing industrialization and urbanization have caused significant greenhouse gas emissions and the depletion of natural resources, resulting in a constant increase in global temperatures. The Earth’s ecological environment is experiencing an unparalleled catastrophe. The previous economic growth paradigm characterized by high energy consumption and high emissions is not viable in this situation. Controlling greenhouse gas emissions has become everyone’s responsibility. As the world’s largest carbon emitter and second-largest economy, China is actively addressing climate change. At the Paris Climate Summit in 2015, China formally pledged to peak carbon dioxide emissions around 2030 and strove to reach the peak as soon as possible. The report of the 20th CPC National Congress clearly states that China will “actively and steadily encourage carbon peaking and carbon neutrality” and emphasizes the implementation of carbon-peaking actions in a planned and step-by-step manner based on energy resource endowments [1]. The Fourteenth Five-Year Plan aims to promote energy conservation and emission reduction while achieving carbon peaking and carbon neutrality.
However, according to the IEA Carbon Dioxide Emissions Report 2022, China’s carbon dioxide emissions were 1147.7 million tons. This accounts for 28.87% of the global total and ranks first on the list of greenhouse gas emissions over the next few years. Fulfilling China’s carbon emissions commitments is a major task. Controlling carbon emissions is essential to improving environmental quality in China. Establishing reasonable carbon emission goals and decomposing them regionally is crucial. A carbon reduction guarantee was essential for the systematic development of the national carbon emission trading market. Carbon emissions targets depend on regional emissions’ collective behavior. The emission intensity of each province depends on the carbon emissions responsibility division [2,3]. Therefore, responsibility decomposition is a vital part of carbon footprint reduction. The establishment of a CO2 emissions responsibility decomposition mechanism that takes into account a variety of principles has drawn attention [4]. It remains a challenging issue in the current study to find a balance between the rationale and acceptability of carbon dioxide allocation among provinces. Current research is still grappling with the challenge of balancing CO2 allocation rationally and acceptably among different locations. Scholars have analyzed issues concerning the total amount and responsibility associated with carbon dioxide emissions and decomposition. This has been one of the hot topics in academic research. They mainly focus on the following aspects:
(1) Forecasting total carbon emissions peak. Currently, the majority of scholars worldwide focus on emissions forecasting. On the one hand, some experts have established prediction models and scenarios for China. These models simulate China’s carbon emissions over time and at peak levels under different scenarios. Meng Sun et al. have found that China is expected to achieve peak carbon emissions by 2030 [5,6]. Martin and Xiliang Zhang et al. believe that China’s current emission policies cannot guarantee peak carbon by 2030. It needs to be more active in industrial restructuring, energy restructuring, and other initiatives [7]. On the other hand, based on China’s climate goals, Bingbing Zhang, Jia Sun et al. have focused their research on the peak carbon projections of representative provinces or industries in China, exploring the utility of China’s carbon-reducing and emission reduction intervention policies and the prospects for China’s low-carbon transition and development [8,9]. In terms of research methodology, common carbon-peaking prediction models include the Kaya constant equation [10], IPAT model [11], STIRPAT model [12], GM(1, 1) model [13], panel regression [14], environmental Kuznets EKC curves [15], energy system model [16], input–output model [17], LEAP model [18], CGE model [19], and so on.
(2) Research on carbon emission efficiency. Existing methods for measuring carbon emissions efficiency include data envelopment, the Malmquist index, and stochastic frontier analysis. Since the issues related to the efficiency of the decomposition of carbon emission responsibility involve the efficiency evaluation of multiple inputs and outputs among decision-making units of the same type, the mainstream research method is the DEA model based on the efficiency perspective [20]. For example, scholars such as Juhong Yuan and Xiang Yu attempted to incorporate non-expected outputs into the analytical framework of data envelopment analysis (DEA) models through various treatments [21,22,23]. With constant resources, the traditional DEA model incorporates the concept of a zero-sum game to maximize production efficiency. The ZSG-DEA model of resource allocation is established. This model effectively solves the optimization of comprehensive efficiency under total quantity constraints. This is suitable for realistic “dual-carbon” and “dual-control” objectives. Based on this, Birong Huang, Rui Zhao et al. use the model to research carbon emission distribution efficiency, and construct the carbon emission responsibility decomposition model [24,25]. Pei-kwan Ye, Liangshi Zhao et al. further transformed the model by incorporating energy use rights [26,27] and considering multidimensional outputs [28]. Scholars such as Qingyuan Zhu analyzed the quota allocation problem based on game models, comprehensive indicators, and other methods to cope with economic complexity [29,30].
(3) Research on the principle of carbon emissions decomposition. Current research on the principle of carbon emissions decomposition focuses on fairness and efficiency, including the principle of single fairness, single efficiency, and the principle of combining fairness and efficiency. Typically, studies use macroeconomic and energy data particular to each region or industry as the initial step in assessing carbon emissions. They decompose the responsibility of the region or industry based on the principles of fairness, efficiency, and fairness and efficiency. For example, Weiguang Cai, Qiqi Liu et al. selected the optimal carbon emission responsibility decomposition scheme by comparing and analyzing the cost differences of three different schemes [31,32,33]. In addition, it is known that the definition of regional carbon emission responsibility can be considered from the perspectives of producer responsibility, consumer responsibility, and shared responsibility [34]. Rui Wei et al. also analyze the decomposition of regional carbon emission responsibility based on perspectives such as value capturer responsibility [35] to explore the differences in the impacts on the results of carbon emission responsibility decomposition under the principle of responsibility from different perspectives.
In conclusion, the research of scholars both in China and abroad on the possibility of carbon peaking and the principles and methods of carbon emission allocation provide important references for this study to construct the decomposition model of provincial carbon responsibility under the goal of carbon peaking by 2030. However, a consensus allocation mechanism has not been established due to the variety of allocation principles and methods. Firstly, most scholars analyze carbon responsibility decomposition from the perspective of fairness and efficiency, lacking a comparison based on multiple principles. This situation is likely to lead to extreme allocation results, which are difficult to accept by different emission subjects and constrained in practice. Secondly, recent studies indicate that the majority of input–output models fail to consider factors like water and energy consumption. Furthermore, most ZSG-DEA models make the automatic assumption that all decision-making units possess the same technology level, disregarding the significant technological heterogeneity among regions in China. The allocation mechanism could lead to a rise in carbon emissions in areas that have lagged behind. In addition, based on the differences among Chinese regions in terms of population, economic level, resource endowment, and energy structure, most scholars pay more attention to certain specific sectors or representative provinces rather than the whole country.
Therefore, based on China’s goal of a carbon peak by 2030, this study constructs the STIRPAT model to systematically predict China’s total carbon emissions in 2030 by combining the scenario analysis method. Also, the ZSG-DEA method under the perspective of technological heterogeneity (Tech-ZSG-DEA) and the input–output model with multiple variables such as energy and water consumption are designed to rationally decompose the responsibility for carbon emissions of each province in China by adopting the decomposition principles of fairness, efficiency, output value, and retrospection to realize the Pareto-optimal allocation of energy, economic, and environmental variables in the provinces.
2. Research Methodology and Data
2.1. Research Methodology and Modeling
2.1.1. ZSG-DEA Model Considering Technological Heterogeneity
DEA (data envelopment analysis) is a widely used method for evaluating multi-input and multi-output decision-making units’ efficiency. The 30 provinces in China are considered a system containing multiple inputs and multiple outputs, with each province using I input factors and producing M output factors .
Initially, the DEA model developed by Charnes, Cooper et al. [36]. was referred to as the CCR model, which assumed constant returns to scale. This model is a widely used and classic DEA method for assessing the relative effectiveness of decision units. The CCR model is an efficiency evaluation model that works on the assumption of constant returns to scale. Later, Banker, Charnes et al. [37] added the constraint that the sum of the weights is equal to 1 in the formula and proposed a DEA model with variable returns to scale (VRS), namely the BCC model [38]. This model can assess the efficiency of DMUs based on changing returns to scale. Compared to the CCR model, which evaluates the efficiency of DMUs assuming constant returns to scale, the BCC model matches better with actual scenarios.
Based on production technology differences, all decision-making units (DMUs) can be decomposed into N clusters, with each DMU within a cluster possessing the same or similar production technologies and each DMU between clusters having large differences in production technologies. The cluster frontier production possibility set represents the optimal technology level within each cluster divided by production technology differences, and the common frontier production possibility set indicates the optimal technology level of all DMUs [26]. As shown in Figure 1, the common frontier production possibility set is the concatenation of all cluster production possibility sets.
Based on the consideration of technological heterogeneity, the input-oriented DEA model is selected for estimation in this study. Specifically, carbon emission is used as an input variable to assess the efficiency level of CO2 emission of each province under a certain output level. Under the possible set of cluster production and the possible set of common frontier production , the cluster frontier efficiency and the common frontier efficiency of their corresponding rth DMU can be derived from the following DEA model, respectively:
In the above model, is the output level of the nth province, denotes the CO2 emissions of the nth province, is the number of provinces in the cluster, is the weight of each input and output, and denotes the CO2 emission efficiency of each province [20].
In a DEA model, the variables are often considered to be independent of each other. Because of the competitive traits of the resource allocation problem, the input or output variables of a decision unit are limited by the constant total amount of that input. An increase or decrease in the emissions of one Decision-Making Unit (DMU) will result in a corresponding decrease or rise in the emissions of other DMUs. This invalidates the premise of independence and resembles a zero-sum game. Lins and Gomes et al. [39]. modified the traditional DEA model and proposed a zero-sum DEA model (ZSG-DEA model) for calculating the efficiency apportionment results of emission rights. This model allows each DMU to achieve the efficiency boundary [40]. The key assumptions of the ZSG-DEA model are ① Aggregate constraint: Resources are considered constant across the entire economy. ② Non-independence: Each DMU is considered to be interdependent, with the input/output of one DMU being influenced by the inputs of other DMUs. ③ Same technology level: Assume that all decision-making units possess an equivalent level of technology ④ Input and output variables: The input variables are energy consumption, water consumption, capital stock, and population, and the output variables are GDP and CO2 emissions. During the process, decision-making units can be reallocated by adjusting an input or output variable until all units achieve desired boundaries with a technical efficiency value of 1 [41]. The ZSG-DEA model assumes that all decision-making units have the same technology level, therefore ignoring the considerable technological diversity within areas in China. This allocation process may create more pressure on energy savings and emission reduction in underdeveloped provinces and cities, leading to more resistance to the operation of the environmental rights trading market. Therefore, based on ZSG-DEA, the ZSG-DEA model considering technical heterogeneity (Tech-ZSG-DEA) is built.
The model suggests recalibrating the carbon emission quotas of all DMUs in the group by adjusting allocations. This requires increasing the quotas of high-efficiency DMUs and decreasing the quotas of inefficient DMUs so that all DMUs in the group achieve cluster DEA effective results [42]. The specific iterative process is as follows:
In the input-oriented model, if DMU0 is a non-DEA efficient decision unit, its efficiency value is . In order to be DEA-efficient, DMU0 must reduce its use of inputs by:
In the above equation, is the amount of DMU0 inputs, is the amount of reduction, and is the relative efficiency of DMU0 under the Tech-ZSG-DEA model. For the treatment of the reduction , Lins et al. [39] proposed two different strategies: equal increase and proportional increase [43]. The use of the equal increase strategy has limitations in its effectiveness. This strategy can only be used when (n is the number of decision units); otherwise, it will cause some DMUs to produce new undesired outputs. The proportional increase strategy can circumvent this limitation, so the second strategy is used in this study. According to this strategy, the inefficient DMU0 has to reduce the amount of input in order to improve its efficiency. The proportional increase strategy requires the other n − 1 DMUs to increase their respective inputs in equal proportions according to the value of each initial input. The greater the usage of , the greater the amount of increase. Each DMU receives a carbon allowance related to its actual CO2 emissions as a percentage of the cluster total. The proportional increase strategy implies that each of the other DMUi increases by:
In Equation (4), is the amount of DMU0 inputs, is the amount of DMUi inputs, is the relative efficiency of DMU0 under the Tech-ZSG-DEA model, and is the sum of all DMUi inputs except DMU0. In accordance with the proportional increase strategy, the formula for evaluating the relative efficiency of decision unit DMU0 using the Tech-ZSG-DEA method is shown below:
In the above equation, is the relative efficiency of DMU0 under the Tech-ZSG-DEA model and denotes the efficiency of carbon dioxide emissions of a provincial domain under the cluster frontier of the Tech-ZSG-DEA model. This iterative process continues until all decision-making units reach the desired state where the technical efficiency value is 1, which means that all decision-making units are on a new frontier (Tech-ZSG-DEA frontier).
2.1.2. Explanation of the Principle of Decomposition
Considering the complex correlative mobility of carbon emissions among Chinese provinces, it is imperative to pay careful attention to the principle of decomposition of carbon emissions responsibility. Therefore, the principles of efficiency, equity, production value, and retroactivity are designed to decompose the responsibility for carbon emissions.
(1) Principle of efficiency. This principle means adding game theory thinking to the efficiency-based carbon emissions responsibility decomposition scheme. Using the total amount of carbon emissions in 2030 to conduct a zero-sum game, the increase in carbon quotas in one province must come from the decrease in carbon quotas in other provinces. The Tech-ZSG-DEA model achieves maximum decision unit efficiency after several iterations.
(2) Principle of equity. This principle distributes carbon dioxide emissions per unit of time, averaged over a country’s total population. It reflects the per capita share of carbon emissions generated by a country during current economic development. It guarantees regions’ human rights.
(3) Principle of output value. This principle emphasizes the maximization of the economic output for total CO2 emissions. Different regions have different economic outputs, and the value added by a province is its contribution to national GDP; the broader the value added, the greater its potential ability to reduce emissions.
(4) Principle of retroactivity. The principle means that each province should have the same CO2 emissions. Regions with higher historical CO2 emissions should have lower future emissions. Higher historical CO2 emissions indicate that they have contributed more to global warming and should be held more responsible for carbon emissions.
To ensure the comprehensiveness of each principle, weighting factors can be introduced according to actual needs by setting a single principle. Consider, for example, the efficiency principle and the equity principle by setting the weighting factor for calculating a province’s carbon emissions. This is based on the above two principles, . Then, use the Tech-ZSG-DEA model to obtain the decomposition results of carbon emission responsibility under the two principles.
2.2. Data Sources and Descriptions
2.2.1. Data Sources and Variable Descriptions
This study adopts the ZSG-DEA method that considers regional technological heterogeneity (Tech-ZSG-DEA). In terms of model indicator selection, drawing on existing research, this study constructs an input–output indicator system based on the reality of total carbon emission allocation, using the non-desired output carbon dioxide as the output variable. Among them, the input variables are energy consumption, water consumption, capital stock, and population, and the output variables are GDP and CO2 emissions. Detailed descriptions of the variables are shown in Table 1. Except for CO2, the data for the calculation of all variables are from the China Statistical Yearbook and the China Energy Statistical Yearbook. Since most of the data for Tibet, Hong Kong, Macao, and Taiwan are missing, the sample selected for the paper is the 30 provinces in China excluding Tibet, Hong Kong, Macao, and Taiwan.
2.2.2. Calculation Formula for Carbon Dioxide Emissions
The United Nations Intergovernmental Panel on Climate Change (IPCC) proposed a methodology in 2006 for estimating CO2 emissions based on fossil fuel consumption and emission factors. As mentioned in the Research Methodology, fossil energy causes greenhouse gas emissions, which are wide-ranging and cover all areas of production and life. Therefore, the methodology provided via the IPCC is highly generalizable and is measured as follows:
In the above equation, CO2 is the emission of carbon dioxide; i represents various energy fuels such as coal, coke, crude oil, liquefied petroleum gas, etc.; Ei refers to the combustion consumption of various energy sources; NCVi means the average low-level heat generation of various energy sources, which is used to convert the consumption of various energy sources into energy units (TJ); and CEFi stands for the carbon dioxide emission factor of various energy sources.
3. Results
3.1. Projections of Total Carbon Emissions
To cope with global warming, China has proposed the goal of achieving carbon peaking by 2030. In order to investigate the achievability of this goal, the STIRPAT model was established via the ridge regression method as follows, taking into full consideration the effects of population (P), urbanization rate (U), GDP per capita (A), foreign trade dependence (T), energy intensity (I), energy structure (F), water use intensity (W), industrial structure (Y), environmental regulation (R), and technological development level (S) on carbon emissions:
Firstly, an inflection point is determined by observing the ridge trace plot, so that the curves converge and overlap synchronously. Figure 2 shows the variables’ curves leveled off when k = 0.05, at which point, the corresponding R-square was about 0.99 and the model showed an acceptable fit. Therefore, the second step of the ridge regression analysis was performed by substituting k = 0.05 into the regression process to obtain the basic information of the ridge regression as shown in Table 2.
As can be seen from the above table, R-square, F value, and Significance F reached 0.9923, 128.0393, and 0.0000, respectively. The coefficient of determination is 0.9961, which shows an excellent fit. For this, the calculation of the values of the relevant variables in the equation was continued and Table 3 was obtained.
Based on the above table the fitted ridge regression equation is obtained as follows:
The forecasting model was tested for reliability. As a result, the prediction was further combined with scenario analysis. The results show that under the medium-growth model, China’s total carbon emissions in 2030 will be about 11,623,508,510 tons. These data will be used in the following section as the basis for allocating the total carbon emissions available to each province in China in 2030.
3.2. Calculation Results of Tech-ZSG-DEA Based on the Principle of Efficiency
3.2.1. Calculation Results of the Initial DEA Based on the Principle of Efficiency
In this study, we first use DEAP2.1 software to calculate the allocation efficiency of the initial carbon emission allowances of 30 provinces in China in 2030 through the traditional DEA BCC (data envelopment analysis with the Banker, Charnes, and Cooper model) model. Figure 3 shows the common frontier efficiency results for the initial allocation of each province.
As can be seen in Figure 3, there is a large gap between the initial efficiency values of DEA BCC for carbon emission allowances in the 30 provinces of China. The average efficiency of the initial carbon emission allocation is 0.8070, indicating that the average efficiency of the primary allocation is moderate. And, there are 15 regions below average efficiency, accounting for half of the proportion. Nine regions, such as Beijing, Tianjin, and Hebei, have the maximum efficiency value of 1. Seven provinces have efficiency values exceeding 0.8, which are close to the effective boundary but have not yet reached DEA efficiency. The efficiency value of the remaining 14 provinces is lower than 0.8. For example, Sichuan’s efficiency value is only 0.570, which is in the lower middle of the range, suggesting that there is still a big gap between the DEA and its effectiveness.
Based on the efficiency measurements for each province, Cluster 1 includes Tianjin, Hainan, Shanxi, Beijing, Ningxia, Hebei, Jilin, Qinghai, and Inner Mongolia; Cluster 2 includes Jiangsu, Chongqing, Liaoning, Jiangxi, Shanghai, Shaanxi, Xinjiang, Anhui, Heilongjiang, Guizhou, and Gansu; and Cluster 3 includes Sichuan, Henan, Fujian, Guangdong, Yunnan, Zhejiang, Shandong, Hunan, Guangxi, and Hubei. As shown in Figure 4, the common frontier efficiencies of the three clusters show a stepwise distribution of Cluster 1 > Cluster 2 > Cluster 3. Cluster frontier efficiencies are relatively concentrated.
To make all provinces’ carbon allowances efficient, it is necessary to redistribute carbon emissions responsibility. However, the efficiency values and slack variables of the original DEA model do not meet the aggregation constraints. Adjusting the carbon allowances in these regions based on the slack variables may increase the efficiency values. Thus, the Tech-ZSG-DEA model will be applied in the next section to adjust carbon emission quotas.
3.2.2. Tech-ZSG-DEA Iterative Process and Reallocation of CO2 Based on the Principle of Efficiency
The efficiency assessment of the initial allocation indicates that the historical allocation method is not effective according to DEA standards. Therefore, it is essential to use the proportional adjustment approach to modify the allocation mentioned above for a better assessment of efficiency. This study categorizes China’s 30 provinces into three groups using the Tech-ZSG-DEA model and conducts several iterations within each group until each DMU achieves cluster efficiency. At this time, the cluster frontier efficiency is approximated to 1. Figure 5 shows the change in cluster frontier efficiency in each province during the iteration process. It can be found that each subsequent iteration of the algorithm enhances the efficiency of the cluster frontier.
According to the above figure, all 30 provinces achieved DEA efficiency levels with the Tech-ZSG-DEA model after iteration. The adjustment of carbon allowances through the regions in the case of constant total national carbon emissions allows more regions to reach the technical efficiency frontier. This indicates that the coordination between carbon emissions and the inputs and economic outputs of factors such as population, capital, and energy is steadily improving in China. The optimization process has reduced the share of carbon emissions from regions with low initial efficiency values, such as Heilongjiang, Henan, and Sichuan, as well as less developed regions like Guizhou and Yunnan. On the contrary, areas like Beijing and Tianjin start with an efficiency value of 1 or extremely close to 1 with a limited margin of error. They, thus, receive reduced allowances from other locations in the optimization process. These regions are increasing their carbon emissions, and the input–output efficiencies of these provincial regions always remain on the frontier formed with the DEA model, depending on the group. That is to say, all these regions are Tech-ZSG-DEA-efficient.
The entire number of allowances remains constant in the 30 provinces throughout the iterative process, as shown by the total adjustments and emissions. The total carbon allowances transferred out of each province are equal to the quantity transferred in. Thirteen of the thirty provinces have carbon emission allowances lower than their actual emissions in 2020, while the remaining provinces experienced an increase. Qinghai, Ningxia, and Hebei showed significant drops, while Beijing and Shanghai had notable rises. Carbon emissions have substantially shifted from less developed regions to provinces in developed regions, particularly the eastern coast. Tech-ZSG-DEA orientation is achieved for each decision-making unit using the model. Regions that are underdeveloped and have a high consumption of energy and emissions typically exhibit poor rates of carbon utilization. The decrease in carbon allowances aligns with the model’s aim of improving carbon emission efficiency. Considering technical heterogeneity in the quota allocation process can help alleviate resistance to policy implementation. This can also help reduce disparities in regional development.
In terms of the absolute value of the total emissions allocated, three regions, Beijing, Shanghai, and Jiangsu, were allocated the largest amount of CO2 emissions. At the same time, three provinces, Gansu, Heilongjiang, and Guangxi, received the least emissions. This is all determined via various factors, such as the economic scale, energy consumption, water consumption, and population of each region. Three regions—Beijing, Shanghai, and Jiangsu—accounted for the first, second, and third highest GDP per capita in the provincial rankings, respectively. Gansu has the lowest per capita GDP in China, followed by Heilongjiang and Guangxi, which have the second and third lowest per capita GDP, respectively. Furthermore, the population size, energy consumption, and capital stock of these three regions are situated in the medium to lower range among all regions in China. Thus, from the perspective of ZSG-DEA efficiency, the amount of CO2 allocated is directly proportional to the total regional economy. Further analysis suggests that among regions with roughly equal relative efficiencies, the higher the output value, the greater the number of inputs.
3.2.3. Comparison of Tech-ZSG-DEA Model and ZSG-DEA Model Decomposition Schemes
To test the reasonableness and feasibility of the carbon emission decomposition results of each province derived in the previous section, this study further comprehensively compares the responsibility decomposition schemes of the Tech-ZSG-DEA model based on technological heterogeneity with the traditional ZSG-DEA model.
This study compares the pressure on energy saving and carbon emissions in each region under the two scenarios by constructing energy saving coefficients and emission coefficients. The energy saving coefficient represents the ratio of the energy consumption standard implemented by the region according to the 2030 allocation plan to the actual energy consumption in 2020. The emission coefficient represents the ratio of the carbon emission standard implemented by the region in the 2030 allocation scenario to actual carbon emissions in 2020. A coefficient greater than 1 indicates that the quota is generous and there is no pressure on energy savings or carbon emissions. If it is less than 1, it means the quota is tight and there is pressure on energy savings or carbon emissions. A comparison of energy saving and emission coefficients between Tech-ZSG-DEA and traditional ZSG-DEA models is shown in Figure 6 and Figure 7.
As can be seen from the above figures, the energy saving and emission coefficients of Cluster 1 provinces in the traditional ZSG-DEA model are both greater than 1, indicating that there is no pressure to save energy or reduce carbon emissions. In contrast, Cluster 3 provinces have energy saving and emission coefficients below 1. There is still a gap from 1, which indicates that Cluster 3 provinces, especially Henan, Shandong, and Guangxi, are under substantial pressure regarding energy conservation and carbon emissions. Compared with the traditional ZSG-DEA model, in the Tech-ZSG-DEA model, the provinces in Cluster 1 have energy saving and emission obligations, but these are less burdensome compared to the inefficient provinces in Cluster 3, showing the principle of “common but differentiated” responsibilities. Provinces like Sichuan, Guangdong, and Zhejiang in Cluster 3 of the Tech-ZSG-DEA model have shifted from facing high pressure on energy savings and carbon emissions to having an excess of allowances, which will further support their economic growth. Energy saving and emission coefficients in provinces such as Henan, Shandong, and Guangxi have also been significantly reduced. The overall pressure has been reduced, avoiding “pulling up seedlings” in inefficient regions.
Compared with the traditional ZSG-DEA model, the Tech-ZSG-DEA model makes high-efficiency regions share a certain amount of carbon emission pressure, which is a better explanation of the “common but differentiated” environmental responsibility among regions. It is a compromise between the historical method and the traditional ZSG-DEA, which focuses on economic efficiency and is more scientifically and practically feasible. In addition, it improves the existing problem of sacrificing advanced technology efficiency in the ZSG-DEA model. It helps to stimulate the enthusiasm of all subjects in the high-efficiency region to participate in carbon-free activities.
3.3. Calculation Results of Tech-ZSG-DEA Based on the Principles of Equity, Output Value, and Retroactivity
Based on the principle of equity, output value, and retroactivity, the allocation efficiency of carbon emission quotas in the 30 provinces of China in 2030 is calculated. Then, the Tech-ZSG-DEA model is used for efficiency optimization, and the final results of carbon emission responsibility decomposition under multiple principles are obtained as follows.
As can be seen from the allocation results in Figure 8, the results of the Tech-ZSG-DEA efficiency emission responsibility decomposition based on the three different principles are all quite diverse. The carbon emissions and future development space gained by the same region varied significantly under different principles. Thus, implementing a specific principle will face heightened resistance. Regions like Shanghai and Jiangsu can receive additional carbon emission allowances based on equity and output value principles. The increase in residents and economic activity determines this. Regions like Heilongjiang have smaller populations because of population outflow, while Guangxi, Gansu, and Qinghai have lower populations due to their geographical location and climate. These provinces receive less carbon emissions based on the equity principle.
The disparities in responsibility decomposition principles lead to diverse decomposition results, showing considerable variability in responsibility decomposition values among provinces. Decomposition analysis reveals significant inequalities in Beijing, Tianjin, Shanghai, and Hainan based on efficiency, equity, retroactivity, and output value principles. However, various principles indicate that these areas can contribute to an increase in carbon emissions somewhat. When comparing the results of different decomposition principles horizontally, contradictions can arise. For example, some regions may be required to reduce emissions under one principle while being permitted to increase emissions under another principle, as seen in Shaanxi, Sichuan, Yunnan, and Gansu. The underlying reason for such contradictory data conflict situations is the differentiated interest orientation of a single decomposition principle.
Figure 9 shows the proportions of carbon emission allowances received by East, Central, and West China in 2030 under the three different principles. The circle diagram shows from inside to outside the allocation results under the principles of equity, output value, and retroactivity, respectively. From the figure, it is clear that under the three principles, East China receives the largest amount of carbon emission allowances, followed by Central China and West China. Under the equity principle and the output value principle, the proportion of carbon allocation allowances taken up by East, Central, and West China is approximately the same. Conversely, following the principle of retroactivity, the percentage of carbon allowances in Eastern China increases from 54% to 63%. The percentage of carbon allowances in Central China decreased to 19%, and in the West, it dropped marginally.
3.4. Calculation Results of ZSG-DEA Based on Multiple Principles
To better balance each emission responsibility decomposition principle, according to different principles combined with the calculation formula, the weighting factors of efficiency, equity, output value, and retroactive principles were taken to the value of 0.25, respectively. Then, the results of carbon emission allowance responsibility decomposition under the combination principles of each province in China are calculated. The results are shown in the table below.
As can be seen from Table 4, in Cluster 1, even though the increase in emissions caused the absolute efficiency level of the region to decrease, its relative efficiency level still increased due to the decrease in the production possibility boundary. Carbon emissions have increased in Beijing, Tianjin, Shanghai, and Zhejiang, as well as central provinces such as Jiangxi and Hunan. Hebei, Shanxi, and Inner Mongolia have improved their efficiency by decreasing their carbon emission allocations. These provinces all emit more pollutants in their raw form than the level of emissions considered efficient, to various extents. In this way, CO2 emissions are continuously reduced according to successive efficiency levels. During the six iterations, the adjusted magnitude of CO2 in each region also gradually decreases as the iterative process advances. Among the three clusters, Cluster 1 had the lowest total adjustment amounts in the final iteration compared to the other two clusters.
China’s regions vary greatly in terms of economic base, energy structure, population structure, and stage of development and each has its characteristics. As can be seen from Figure 10, based on the multiple principles, China’s carbon emission quotas are mainly concentrated in Beijing the southern part of the Yangtze River Delta, and various coastal cities. The Northwest and Southwest regions, by contrast, receive relatively fewer carbon emission allowances than other regions. The main reasons for this are: (1) Economic base: the GDP of major cities in the Yangtze River Delta urban agglomerations, such as Shanghai, Jiangsu, and Zhejiang, ranks high in the country. (2) Energy structure: coal is the main source of CO2 emissions in resource-rich Inner Mongolia, Shaanxi, and Shanxi. (3) Emission potential: Gansu, Guizhou, Guangxi, and other places are limited by geographical location, natural conditions, and a small population base. The pace of economic growth is sluggish, and carbon emissions are relatively low.
Comparing the results of the Tech-ZSG-DEA model under each principle, it is clear that the decomposition results based on different principles of responsibility decomposition are distinguished, and the allocation mechanisms of the four principles have distinctive focuses. Under different allocation principles, provinces’ emission responsibility varies greatly. In practice, it is necessary to choose or combine suitable principles for the decomposition of emission responsibility. By taking into account actual demand or specific bias requirements, the total carbon emission quota of each region in China can be decomposed reasonably. However, regardless of the principle of responsibility decomposition, the overall total carbon emissions will remain constant.
4. Discussion
This study first assesses the efficiency of carbon emission allocation through the traditional DEA BCC model and the ZSG-DEA model. However, due to the diversity of allocation methods and principles, a consensus allocation scheme has not yet been formed. Moreover, the traditional ZSG-DEA model mostly automatically assumes that all decision-making units have the same technological level, ignoring the significant technological heterogeneity among regions in China. Given this, this study designs an input–output model that includes energy consumption, water consumption, and other variables, and constructs a Tech-ZSG-DEA model that takes technological heterogeneity into account. Moreover, the decomposition principles of equity, efficiency, output value, and retroactivity are comprehensively adopted to derive a carbon emission responsibility decomposition scheme that takes into account multiple principles. The main research conclusions of this study are as follows:
(1) Due to the differences in economic development, population structure, and energy and water consumption patterns in each region, the amount of initial carbon emission allocation will be different. The initial DEA BCC results indicate that the average efficiency of the initial allocation is moderate and falls short of the maximum efficiency value of 1.
(2) Considering the economic development level, population size, energy, and water consumption factors of the regions, a more comprehensive decomposition of carbon emissions was carried out through redistribution based on the principle of efficiency using the ZSG-DEA method. From the final decomposition results, the amount of emission allocation is proportional to the total regional economic volume. Additional investigations indicate that areas with similar levels of effectiveness tend to have greater output variables and input amounts.
(3) There are significant differences in production technology among China’s provinces, particularly between the eastern coastal regions and the less developed regions in the west. There is a wide disparity in economic development, production efficiency, and other aspects. Neglecting regional disparities in the quota allocation process will easily exacerbate carbon emissions pressure in backward provinces and hinder their economic development. Therefore, considering technical heterogeneity in the quota allocation process can effectively alleviate unbalanced regional development.
(4) As compared with the traditional ZSG-DEA model, the Tech-ZSG-DEA model enables high-efficiency regions to share a certain amount of pressure on carbon emissions, which is a better interpretation of the “common but differentiated” environmental responsibility among regions. It also improves the problem of sacrificing cutting-edge technology efficiency in the traditional ZSG-DEA model. It helps to stimulate the enthusiasm of the main bodies in the efficient provinces to participate in carbon emissions reduction programs. It also balances the economic and social benefits.
(5) The outcomes of carbon emission responsibility decomposition vary significantly due to the diverse focuses of several responsibility decomposition principles. The Tech-ZSG-DEA model’s decomposition results show significant variations in emission responsibility among regions based on four decomposition principles. Depending on the specific application, the appropriate decomposition principle for responsibility decomposition should be selected.
5. Conclusions
Based on the panel data of the regions of China from 2002 to 2022, this study constructs the STIRPAT model to systematically predict China’s total carbon emissions in 2030 by combining the scenario analysis method. Also, the ZSG-DEA method under the perspective of technological heterogeneity and the input–output model with multiple variables such as energy and water consumption are designed to rationally decompose the responsibility for carbon emissions of each province in China by adopting the decomposition principles of fairness, efficiency, output value, and retrospection. The study found that (a) China’s average efficiency of the original allocation still has a certain gap from the maximized efficiency value of 1. (b) Regions with similar relative efficiency have larger output variables and input amounts. (c) Considering technical heterogeneity in the quota allocation process can effectively alleviate unbalanced regional development. (d) The Tech-ZSG-DEA model can share the pressure of carbon emissions between regions and balance the economic and social benefits. (e) The results of carbon emission responsibility decomposition based on various responsibility decomposition principles are quite distinct.
This study is limited by the absence of data, which prevented the inclusion of Tibet, Hong Kong, Macao, and Taiwan in the analysis. Furthermore, this study does not consider several variables relevant to carbon emissions, such as national policy and the proportion of renewable energy. Future studies should encompass all regions of China to enhance the reliability and accuracy of the model’s results. A comprehensive analysis of national or regional policies, along with other carbon emissions-related issues, may provide a more effective foundation for distributing carbon emissions throughout different regions.
Author Contributions
All authors contributed to the study concept and design. Conceptualization, validation, methodology, and supervision, Q.S.; software, investigation, data curation, and writing—original draft preparation, Y.X.; resources, writing—review and editing, and visualization, C.Y. All authors have read and agreed to the published version of the manuscript.
Funding
This research was funded by the National Social Science Fund of China, 17BGL146, Study on Three-dimensional Full-Footprint Three-dimensional Correlation and Synergistic Regulation of Water-Energy-Carbon Industries in China in the New Era.
Institutional Review Board Statement
Not applicable.
Informed Consent Statement
Not applicable.
Data Availability Statement
The raw data supporting the results of the study are publicly available on the website of the National Bureau of Statistics of China (NBS) at https://www.stats.gov.cn/ (accessed on 26 March 2024). The generated or analyzed data sets can be obtained from the corresponding authors upon reasonable request.
Conflicts of Interest
The authors declare no conflicts of interest.
References
- Xi, J. Holding High the Great Banner of Socialism with Chinese Characteristics and Striving in Unity for the Comprehensive Construction of a Modernized Socialist Country—Report at the Twentieth National Congress of the Communist Party of China; People’s Daily Press: Beijing, China, 2022. [Google Scholar]
- Wang, W.; Kong, X. Research on Carbon Allowance Allocation among Chinese Provinces and Municipalities Based on the 2030 Peak Carbon Goal. J. Quant. Tech. Econ. 2022, 39, 113–132. [Google Scholar]
- Li, Y.; Li, Z.; Wu, M.; Zhang, F.; De, G. Regional-Level Allocation of CO2 Emission Permits in China: Evidence from the Boltzmann Distribution Method. Sustainability 2018, 10, 2612. [Google Scholar] [CrossRef]
- Jiang, H.; Shao, X.; Zhang, X.; Bao, J. A Study of the Allocation of Carbon Emission Permits among the Provinces of China Based on Fairness and Efficiency. Sustainability 2017, 9, 2122. [Google Scholar] [CrossRef]
- Sun, M.; Li, C.; Xing, Z.; Yu, Y. Analysis of Key Influencing Factors and Scenario Projections of China’s Carbon Emissions under Carbon Neutral Targets. High Volt. Eng. 2023, 49, 4011–4022. [Google Scholar]
- Tollefson, J. China’s carbon emissions could peak sooner than forecast. Nature 2016, 531, 425–426. [Google Scholar] [CrossRef] [PubMed]
- Zhang, X.; Karplus, V.J.; Qi, T.; Zhang, D.; He, J. Carbon emissions in China: How far can new efforts bend the curve? Energy Econ. 2016, 54, 388–395. [Google Scholar] [CrossRef]
- Zhang, B.; Wang, J.; Yan, Z. Structural Decomposition of Peak Carbon Pathways and Their Drivers in Chinese Cities. China Popul. Resour. Environ. 2023, 33, 38–44. [Google Scholar]
- Sun, J.; Sun, Q.; Gao, J.; Zhang, S.; Qiao, J. Research on the optimization of transport structure under carbon peaking constraints. Ecol. Econ. 2023, 39, 54–59. [Google Scholar]
- Fu, Y.; Ma, S.; Song, Q.; Gao, J. Research on Decomposition of Influential Factors of Carbon Emission in China Based on LMDI. J. Math. Pract. Theory 2019, 49, 7–17. [Google Scholar]
- Du, Q.; Chen, Q.; Lu, N. Projections of China’s future carbon emissions based on an improved IPAT model. Acta Sci. Circumstantiae 2012, 32, 2294–2302. [Google Scholar]
- He, Y.; Yu, J. Research on optimization of China’s carbon emissions and industrial structure based on the STIRPAT model. Environ. Eng. 2018, 36, 174–178+184. [Google Scholar]
- Xu, G.; Wang, Y.; Rehman, H. The future trajectory of carbon emissions in the process of carbon neutrality in South Korea. J. Environ. Manag. 2023, 345, 118588. [Google Scholar] [CrossRef] [PubMed]
- Liu, Z.; Zhang, Y. Characteristics of spatial and temporal jumps in China’s carbon emissions, influencing factors and the design of peak pathways. J. Southwest Univ. (Soc. Sci. Ed.) 2022, 48, 99–112. [Google Scholar]
- Xu, D. Capital Deepening, Technological Progress and the Formation of Carbon Emission EKC in China. Syst. Eng. Theory Pract. 2022, 42, 1632–1643. [Google Scholar]
- Li, G.; Song, F.; Chen, J.; Diao, L.; Wang, Y. Structure-type-capacity optimization model for integrated energy systems considering carbon emissions. Electr. Power Constr. 2022, 43, 37–47. [Google Scholar]
- Su, Y.; Liu, X.; Ji, J.; Ma, X. Role of economic structural change in the peaking of China’s CO2 emissions: An input-output optimization model. Sci. Total Environ. 2021, 761, 143306. [Google Scholar] [CrossRef]
- Du, H.; Zhao, L.; Liu, C.; Qiu, K.; Li, H. Carbon Peak Prediction and Uncertainty Analysis of Main Urban Areas Based on LEAP and KAYA Models. J. Ecol. Rural. Environ. 2022, 38, 983–991. [Google Scholar]
- Wang, Y.; Wang, E.; Bi, Y. The Impact of Peak Carbon Emissions on China’s Economy under Different Scenarios: An Analysis Based on the CGE Model. Resour. Sci. 2017, 39, 1896–1908. [Google Scholar]
- Zheng, L. Apportionment of Carbon Emission Reduction Responsibilities among Chinese Provinces and Regions--A Research Based on Zero-Sum Gain DEA Modelling. Resour. Sci. 2012, 34, 2087–2096. [Google Scholar]
- Yuan, J.; Chen, L.; Hu, M. Spatial and temporal variability of green water use efficiency and its influencing factors in the “Central Four Corners”-based on the non-expected output SBM-DEA and geoprobe models. Ecol. Econ. 2023, 39, 138–147. [Google Scholar]
- Żyłowski, T.; Kozyra, J. Crop Cultivation Efficiency and GHG Emission: SBM-DEA Model with Undesirable Output Approach. Sustainability 2023, 15, 10557. [Google Scholar] [CrossRef]
- Yu, X. An assessment of the green development efficiency of industrial parks in China: Based on non-desired output and non-radial DEA model. Struct. Chang. Econ. Dyn. 2023, 66, 81–88. [Google Scholar] [CrossRef]
- Huang, B.; Wang, Z.; Yan, J.; Gong, L. A two-stage model for allocating carbon credits to the provincial power sector under the “dual-carbon” objective. Stat. Decis. 2023, 39, 168–173. [Google Scholar]
- Zhao, R.; Liu, J.; Long, H.; Xiong, X.; Wu, D. A ZSG-DEA model with factor constraint cone-based decoupling analysis for household CO2 emissions: A case study on Sichuan province. Environ. Sci. Pollut. Res. 2023, 30, 93269–93284. [Google Scholar] [CrossRef] [PubMed]
- Ye, P.; Cai, W.; Zhou, Y. Research on the Initial Allocation of Regional Energy Use Rights and Carbon Emission Rights in China from the Perspective of Technological Heterogeneity. Soft Sci. 2023, 37, 114–121. [Google Scholar]
- Liu, H.; Wang, Y. Research on the Initial Allocation of Energy Use Rights and Carbon Emission Rights Based on the Historical Method and Zero-Sum DEA Approach. Chin. J. Manag. Sci. 2020, 28, 209–220. [Google Scholar]
- Zhao, L.; Leng, M.; Sun, C. Measurement of Integrated Water Resources Pollution Allocation Efficiency in China Based on Multidimensional Output ZSG-DEA Modeling. Water Resour. Prot. 2021, 37, 94–102. [Google Scholar]
- Linghu, D.; Wu, X.; Ye, F. Research on Carbon Allowance Allocation and Trading Mechanism Considering Double Heterogeneity. Chin. J. Manag. Sci. 2021, 29, 176–187. [Google Scholar]
- Zhu, Q.; Chen, X.; Chen, J.; Wu, J. Research on Renewable Energy Power Quota Allocation Mechanism for Regional Power Enterprises in China. Chin. J. Manag. Sci. 2022; online first publish. [Google Scholar]
- Cai, W.; Liu, Q.; Li, R.; Huo, T.; Gao, J. Interprovincial Allocation of Total Building Energy Consumption in the Context of Carbon Emission “Double Control”-Based on the Perspective of Equity and Efficiency Coupling. J. Arid Land Resour. Environ. 2023, 37, 100–109. [Google Scholar]
- Liu, Q.; Gao, J.; Cai, W.; Huo, T.; Li, R. A novel allocation method of regional carbon allowance in the building sector: Perspective from coupling equity and efficiency. Environ. Impact Assess. Rev. 2023, 102, 107192. [Google Scholar] [CrossRef]
- Zhang, Z.; Liu, Y.; Du, Z. CO2 Emission Allocation for Urban Public Buildings Considering Efficiency and Equity: An Application at the Provincial Level in China. Buildings 2023, 13, 1570. [Google Scholar] [CrossRef]
- Cong, J.; Shi, Y.; Gao, H.; Zhao, Y. Research on China’s Provincial and Municipal Carbon Emission Responsibility Accounting under the “Dual Carbon” Goal: Based on the Perspective of “Revenue Responsibility”. J. Shanghai Univ. Financ. Econ. 2021, 23, 82–96. [Google Scholar]
- Wei, R.; Peng, S.; Zhang, W. Carbon Emission Responsibility Sharing in Global Value Chains: Based on a Value Capture Perspective. Int. Econ. Trade Res. 2022, 38, 37–51. [Google Scholar]
- Charnes, A.; Cooper, W.W.; Rhodes, E. Measuring the efficiency of decision-making units. Eur. J. Oper. Res. 1978, 6, 429–444. [Google Scholar] [CrossRef]
- Banker, R.D.; Charnes, A.; Cooper, W.W. Some Models for Estimating Technical and Scale Inefficiencies in Data Envelopment Analysis. Manag. Sci. 1984, 30, 1078–1092. [Google Scholar] [CrossRef]
- Guo, J.; Liu, H.; Wu, X.; Wang, Y. Study on the Efficiency of Air Pollutant Emission Right Allocation Based on ZSG-DEA Modeling. China Soft Sci. 2015, 11, 176–185. [Google Scholar]
- Lins, M.P.; Gomes, E.G.; de Mello, J.C.; de Mello, A.J. Olympic ranking based on a zero sum gains DEA model. Eur. J. Oper. Res. 2003, 148, 312–322. [Google Scholar] [CrossRef]
- Lin, T.; Ning, J. A Study on the Efficiency of Carbon Emission Right Allocation in European Union Countries Based on Zero-Sum DEA Modeling. J. Quant. Tech. Econ. 2011, 3, 36–50. [Google Scholar]
- Miao, Z.; Zhou, P.; Li, X. Research on the efficiency allocation of provincial energy intensity constraints in the Eleventh Five-Year Plan. China Popul. Resour. Environ. 2013, 23, 58–64. [Google Scholar]
- Wang, Q.; Li, J. Study on the Efficiency of Carbon Emission Right Allocation in China’s Pilot Provinces and Municipalities under Weak Correlation Constraints. Soft Sci. 2016, 3, 81–107. [Google Scholar]
- Miao, Z.; Zhou, P.; Li, X. Research on China’s Carbon Emission Allowance Allocation Based on European Union’s Allocation Principle-Based on ZSG Environmental Production Technology. Econ. Perspect. 2013, 4, 89–98. [Google Scholar]
Figure 1.
Cluster fronts and common fronts.

Figure 2.
Ridge regression calculation results. (a) Ridge trace plot; (b) decidability coefficient with non-negative factor k.
Figure 2.
Ridge regression calculation results. (a) Ridge trace plot; (b) decidability coefficient with non-negative factor k.

Figure 3.
Initial level of efficiency in each province.

Figure 4.
Box plots by province. (a) Common frontier efficiency; and (b) cluster frontier efficiency.
Figure 4.
Box plots by province. (a) Common frontier efficiency; and (b) cluster frontier efficiency.
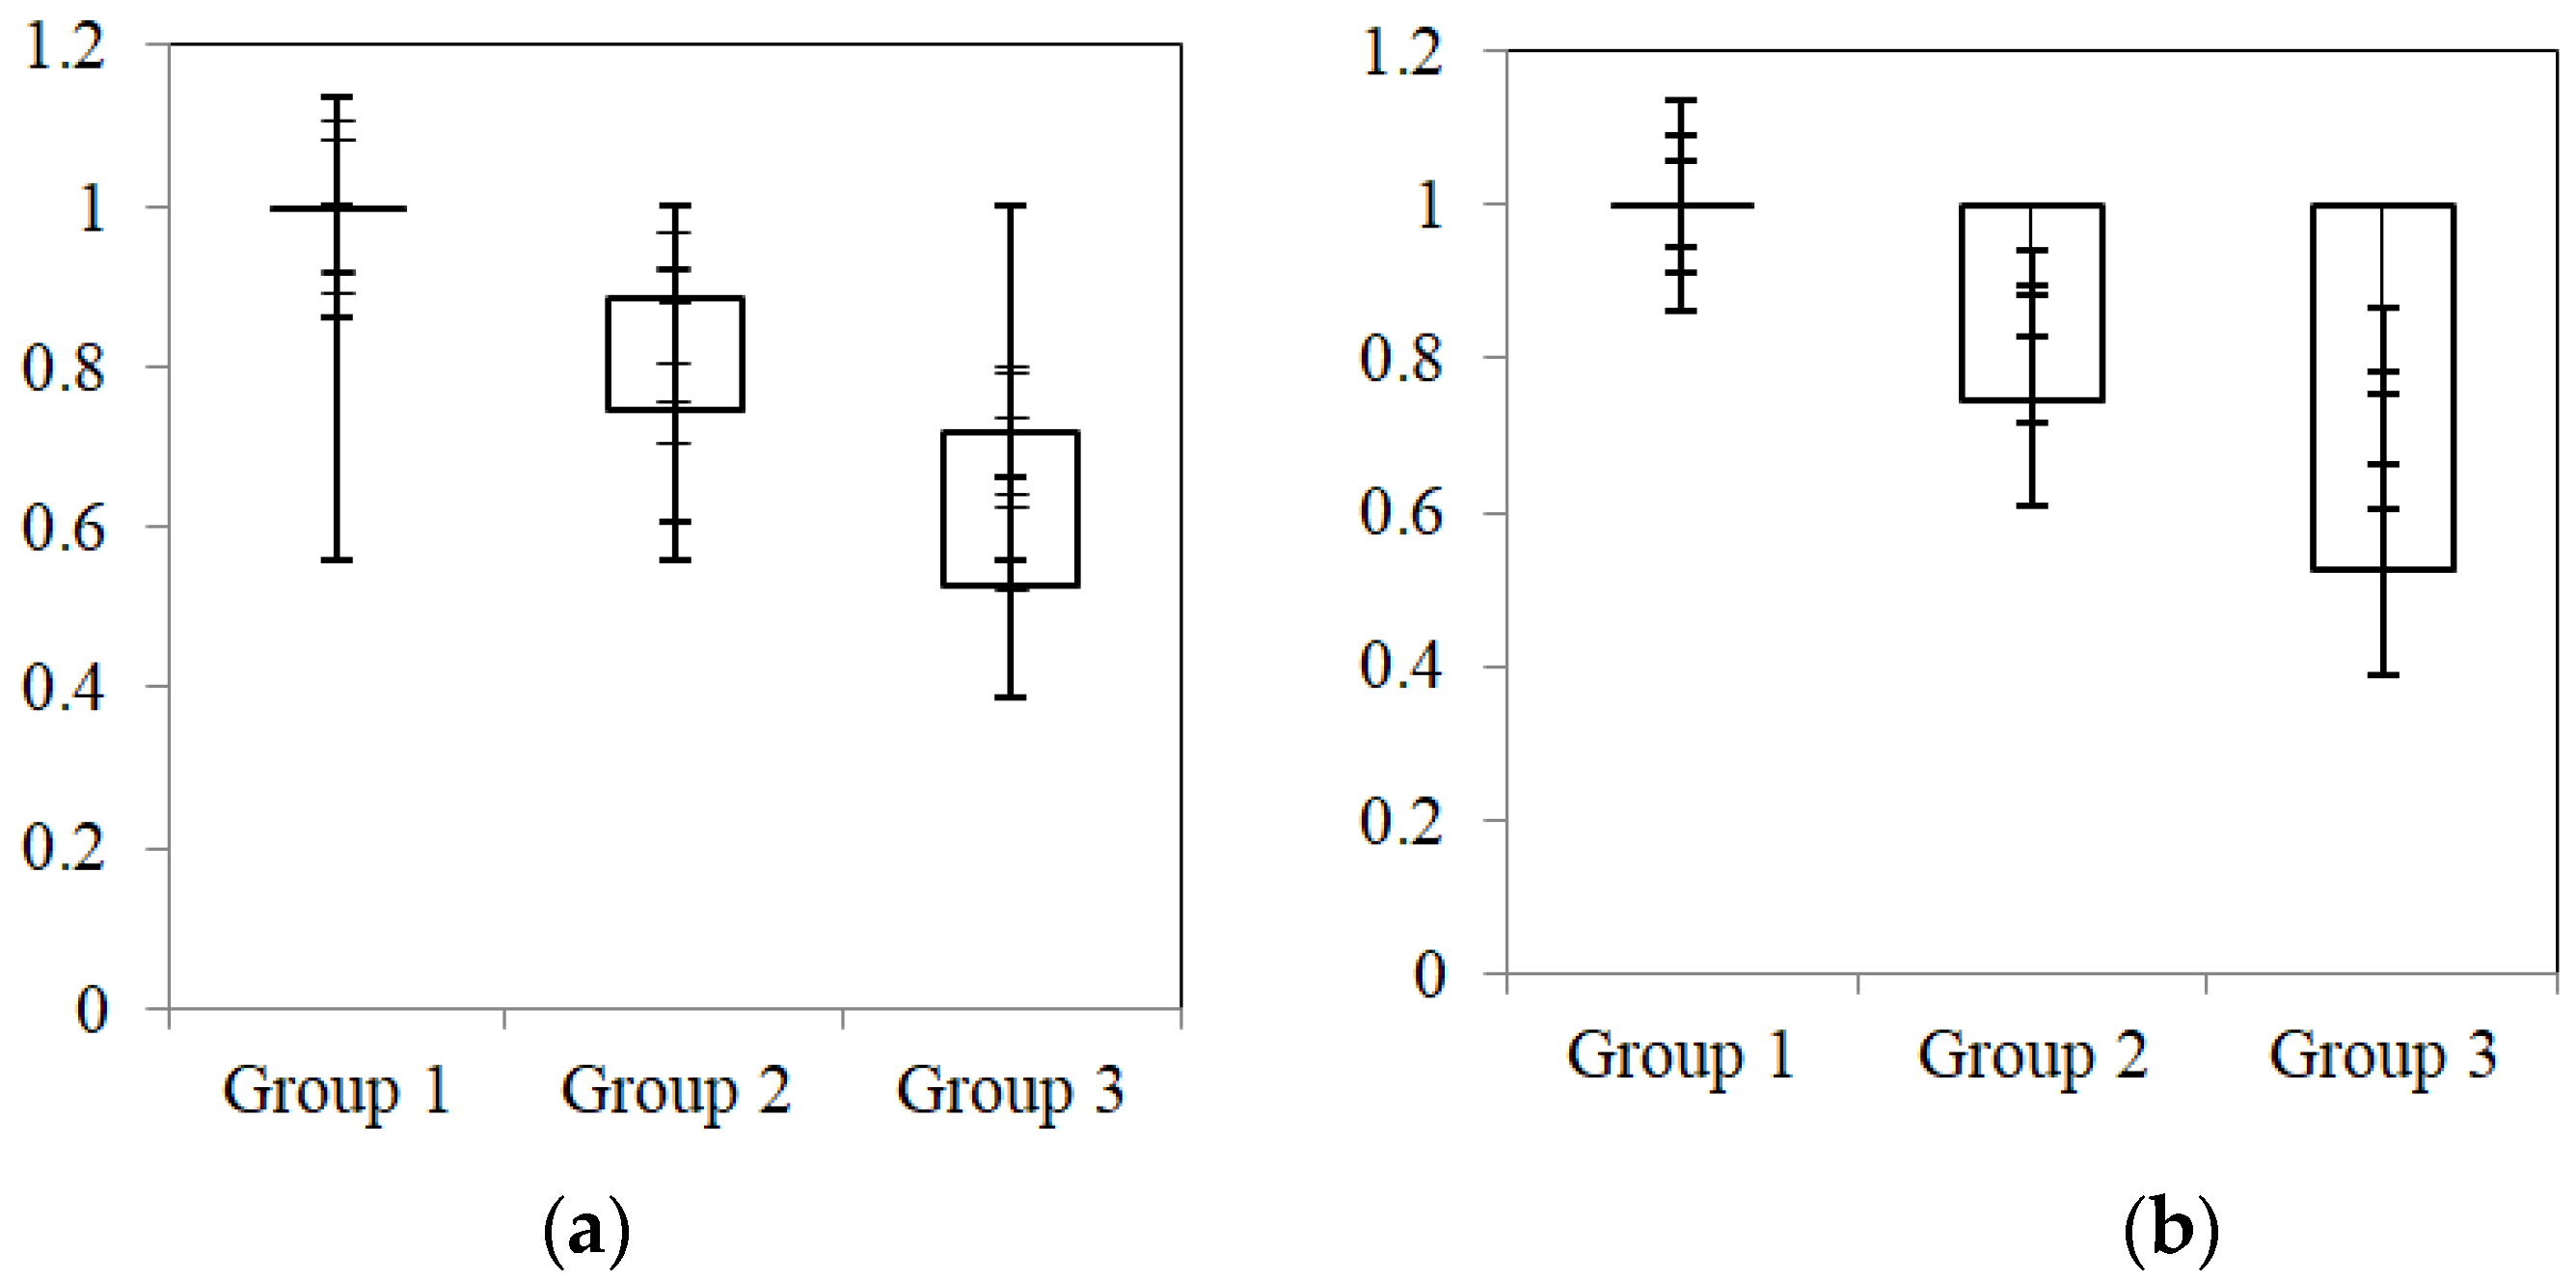
Figure 5.
Changes in frontier efficiency for clusters of provinces during the iteration process.

Figure 6.
Comparison of energy saving coefficients between Tech-ZSG-DEA and ZSG-DEA model.

Figure 7.
Comparison of emission coefficients between Tech-ZSG-DEA and ZSG-DEA model.

Figure 8.
Comparison of carbon emission allowances of 30 provinces based on multiple principles.

Figure 9.
Carbon emission allowance allocation ratio in East, Central, and West China in 2030.

Figure 10.
Distribution of China’s carbon allowances in 2030 under multiple principles.


Table 1.
Description of input and output indicators.
| Category | Indicator Name | Interpretation of Indicators | Unit (of Measure) |
|---|---|---|---|
| Input indicators | Population | Number of residents by province | Ten thousand people |
| Energy consumption | Energy intensity by province | Ten thousand tons of standard coal | |
| Water consumption | Water intensity by province | Cubic meters | |
| Capital stock | Total capital resources available in the provinces | Billion | |
| Output indicators | Economic level | GDP per capita by province | CNY |
| CO2 | Carbon dioxide emissions by province | Ten thousand tons |
Table 2.
Ridge regression basic information (k = 0.05).
| Variable | Value | Variable | Value |
|---|---|---|---|
| Mult R | 0.9961 | SE | 0.0415 |
| R-square | 0.9923 | F value | 128.0393 |
| Adj R-square | 0.9845 | Significance F | 0.0000 |
Table 3.
Values of equation variables.
| Independent Variable | B | SE (B) | Beta | B/SE (B) |
|---|---|---|---|---|
| lnP | 1.7718 | 0.2013 | 0.1720 | 8.8006 |
| lnU | 0.4922 | 0.0383 | 0.2434 | 12.8407 |
| lnA | 0.1362 | 0.0094 | 0.2836 | 14.4207 |
| lnT | −0.2122 | 0.0422 | −0.2296 | −5.0320 |
| lnY | 1.1250 | 0.2028 | 0.2666 | 5.5467 |
| lnI | −0.0822 | 0.0266 | −0.1017 | −3.0916 |
| lnF | 0.5599 | 0.1817 | 0.1558 | 3.0819 |
| lnW | −0.1221 | 0.0095 | −0.2582 | −12.8398 |
| lnR | 0.1657 | 0.0681 | 0.08587 | 2.4339 |
| lnS | −0.0303 | 0.0301 | −0.0397 | −1.0068 |
| Constant | −11.5576 | 2.4870 | 0.0000 | −4.6473 |
Table 4.
Decomposition results for the 30 provinces of China in 2030 under the multiple principles.
| Regions | Initial Efficiency | Initial Carbon Emissions (Ten Thousand Tons) | Efficiency after Iterations | Carbon Allocation after Iteration (Ten Thousand Tons) |
|---|---|---|---|---|
| Beijing | 1.000 | 13,706.970 | 1.000 | 80,544.581 |
| Tianjin | 0.252 | 20,766.969 | 0.999 | 49,610.387 |
| Hebei | 0.021 | 94,389.950 | 0.995 | 23,702.936 |
| Shanxi | 0.037 | 56,892.788 | 0.996 | 24,693.394 |
| Inner Mongolia | 0.039 | 78,622.842 | 0.997 | 35,257.568 |
| Liaoning | 0.045 | 55,311.337 | 0.997 | 28,801.710 |
| Jilin | 0.103 | 22,475.296 | 0.998 | 24,978.833 |
| Heilongjiang | 0.068 | 27,760.411 | 0.998 | 21,007.263 |
| Shanghai | 0.372 | 23,684.063 | 1.000 | 76,003.212 |
| Jiangsu | 0.068 | 77,767.886 | 0.998 | 59,200.879 |
| Zhejiang | 0.124 | 37,120.792 | 0.999 | 48,878.071 |
| Anhui | 0.070 | 39,522.892 | 0.998 | 30,958.308 |
| Fujian | 0.175 | 29,195.801 | 0.999 | 51,622.824 |
| Jiangxi | 0.103 | 24,857.506 | 0.999 | 27,769.452 |
| Shandong | 0.035 | 85,011.731 | 0.997 | 35,181.457 |
| Henan | 0.053 | 44,819.107 | 0.997 | 27,034.071 |
| Hubei | 0.106 | 32,232.651 | 0.999 | 36,741.725 |
| Hunan | 0.092 | 30,389.486 | 0.998 | 30,713.485 |
| Guangdong | 0.071 | 53,809.526 | 0.998 | 42,931.889 |
| Guangxi | 0.074 | 26,248.808 | 0.998 | 21,589.473 |
| Hainan | 1.000 | 6889.325 | 1.000 | 40,482.728 |
| Chongqing | 0.232 | 17,050.042 | 0.999 | 38,098.659 |
| Sichuan | 0.091 | 28,350.210 | 0.998 | 28,368.531 |
| Guizhou | 0.079 | 25,828.604 | 0.998 | 22,579.479 |
| Yunnan | 0.104 | 22,640.628 | 0.999 | 25,370.750 |
| Shaanxi | 0.101 | 29,538.386 | 0.999 | 32,351.275 |
| Gansu | 0.089 | 17,953.014 | 0.998 | 17,602.353 |
| Qinghai | 1.000 | 8889.925 | 1.000 | 52,236.999 |
| Ningxia | 0.166 | 24,800.512 | 0.999 | 41,970.337 |
| Xinjiang | 0.050 | 45,823.391 | 0.997 | 26,068.219 |
Disclaimer/Publisher’s Note: The statements, opinions and data contained in all publications are solely those of the individual author(s) and contributor(s) and not of MDPI and/or the editor(s). MDPI and/or the editor(s) disclaim responsibility for any injury to people or property resulting from any ideas, methods, instructions or products referred to in the content. |
© 2024 by the authors. Licensee MDPI, Basel, Switzerland. This article is an open access article distributed under the terms and conditions of the Creative Commons Attribution (CC BY) license (https://creativecommons.org/licenses/by/4.0/).
Share and Cite
MDPI and ACS Style
Song, Q.; Xie, Y.; Yang, C. Decomposition of China’s Carbon Emissions Responsibility from the Perspective of Technological Heterogeneity. Sustainability 2024, 16, 3978. https://doi.org/10.3390/su16103978
AMA Style
Song Q, Xie Y, Yang C. Decomposition of China’s Carbon Emissions Responsibility from the Perspective of Technological Heterogeneity. Sustainability. 2024; 16(10):3978. https://doi.org/10.3390/su16103978
Chicago/Turabian StyleSong, Qing, Yi Xie, and Chuanming Yang. 2024. "Decomposition of China’s Carbon Emissions Responsibility from the Perspective of Technological Heterogeneity" Sustainability 16, no. 10: 3978. https://doi.org/10.3390/su16103978
Note that from the first issue of 2016, this journal uses article numbers instead of page numbers. See further details here.