
Anisotropic Tensile Properties of a 14YWT Nanostructured Ferritic Alloy: On the Role of Cleavage Fracture


Materials Department, University of California, Santa Barbara, CA 93106, USA
*
Author to whom correspondence should be addressed.
Crystals 2024, 14(5), 439; https://doi.org/10.3390/cryst14050439
Submission received: 17 April 2024
/
Revised: 1 May 2024
/
Accepted: 2 May 2024
/
Published: 5 May 2024
Abstract
:Two plates of nanostructured ferritic alloy NFA-1 were processed by ball milling atomized Fe-14Cr-3W-0.4Ti-0.2Y (wt.%) with FeO powders, canning, and hot-extrusion at 850 °C, followed by annealing and multipass cross-rolling at 1000 °C. This produces a severe (001) brittle cleavage texture on planes running parallel to the plate faces. In the first plate (P1), pre-existing microcracks (MCs) formed on the cleavage planes during cross-rolling. The second plate (P2) contained far fewer, if any, MCs. Here, we compare the tensile data for out-of-plane (S) and in-plane (L) tensile axis orientations, at temperatures from −196 °C to 800 °C. We also assess the tensile property differences between P1 and P2, and the effect of specimen size. The L-orientation strength and ductility were excellent; for example, the room temperature (RT) yield stress, σy ≈ 1042 ± 102 MPa, and the total elongation, εt ≈ 12.9 ± 1.5%. In contrast, the S-orientation RT σy ≈ 708 ± 57 MPa, and εt ≤ 0.2%. These differences were due to cleavage on the brittle (001) planes. Cleavage leads to beneficial delamination toughening, but is deleterious to deformation processing and through-wall heat transfer. Therefore, it is important to quantitatively characterize the pronounced NFA-1 strength anisotropy due to severe crystallographic texturing and cleavage fracture.
1. Introduction
Nanostructured ferritic alloys (NFAs), which are a variant of oxide dispersion strengthened (ODS) steels, possess a unique combination of properties like remarkable irradiation tolerance, high strength, outstanding thermal stability, and corrosion resistance [1,2,3,4,5,6]. Therefore, they are promising candidates for advanced nuclear fission and future fusion reactor applications [1,3,6]. As part of an Oak Ridge National Laboratory ORNL), Los Alamos National Laboratory (LANL), and University of California Santa Barbara (UCSB) collaboration, a 55 kg best practice heat of NFA-1 was processed by first ball milling Fe-14Cr-0.25Y-3W-0.35Ti (wt.%) gas atomized powder with FeO powder to dissolve the Y, and provide a proper balance of Ti and O. The mechanically alloyed powders were then canned, degassed, hot extruded at 850 °C, and annealed and cross-rolled at 1000 °C to form ≈8–10 mm NFA-1 plates. NFAs, with 14% Cr are fully ferritic bcc alloys, lying outside the gamma loop of Fe-Cr steels [1,2,4,5,6]. Background and further details on NFA-1 are reported elsewhere [6,7,8,9].
As noted above, NFAs have a set of outstanding static tensile, creep, and fatigue properties [1,2,3,4,5,6,7,8,9]. NFAs are dispersion strengthened by an ultrahigh density of nm-scale complex oxides like Y2Ti2O7, which precipitate during high-temperature processing. Along with fine grains and high dislocation densities, the nano-oxides not only contribute to high strength, but they also imbue NFAs with a uniquely high irradiation damage tolerance [1,6,9]. This is especially the case for fusion applications since the nano-oxides trap high concentrations of transmutant helium in harmless nm-scale interface bubbles, otherwise, the high helium would lead to the scourges of void swelling and embrittlement [1,6,9]. One exception to the remarkable properties of NFAs is their low fracture toughness [1,6,9,10,11,12,13]. The low toughness is due to both the high NFA strength and crystallographic texturing following deformation processing [1,6,9]. Texturing can result in brittle cleavage plane orientations, leading to both micro- and macro-cracking during the fabrication of product forms such as tubes and plates [1,6,9]. In addition, while the texture anisotropy leads to toughening in some orientations [8], the responsible delamination would degrade high in-service heat flux transfer and deformation processing damage. Thus, the objective of the work reported here was to measure the tensile properties in loading directions normal to the cleavage planes (out-of-plane orientations) and to compare the resulting failure stresses and strains to those previously reported for directions parallel to the cleavage planes (in-plane orientations). Such quantification is needed for a myriad of modeling applications from NFA processing to in-service performance and lifetime assessment applications. The results reported here will also add to our fundamental understanding of cleavage fracture, but these topics were beyond the scope of this paper.
Two NFA-1 plates were examined in this study. Tensile specimens from the first NFA-1, Plate 1 (P1), were fabricated in both the out-of-plane (S)- and in-plane (L)-orientations, as shown in Figure 1a. The 3-D electron backscatter diffraction (EBSD) inverse pole figure (IPF) maps in Figure 1b show that cross-rolling produced a severe (001) brittle cleavage system texture in S-orientation planes parallel to the plate faces [8,11]. Upon cooling, residual stresses resulted in the formation of a population of microcracks (MCs) on the cleavage planes in P1.
The majority of NFA-1 P1 grains were fine and nearly equiaxed in the LT plate face direction, with an average diameter of ≈0.64 ± 0.45 µm [7]. There was also a small fraction of 1–10 µm grains, along with a few that were even larger. Viewed from the plate front (TS) and side (LS) directions, the grains were roughly football-shaped, with dimensions of ≈0.8 ± 0.6 × 0.3 ± 0.1 µm, again, along with fewer grains up to 10 µm in length or more [7]. P2 was nominally processed in the same way; however, while the microstructures were similar, few, if any, pre-existing MCs were observed in P2. The reasons for these differences are not understood.
The TS and LS P1 views in Figure 1c show a large number of MCs lying on the (001) planes, normal to the out-of-plane (plate thickness) S direction. The average MC crack mouth opening was ≈250 nm, and the average crack separation distance was ≈16 µm (Figure 1c and Ref. [7]). Figure 1d shows the corresponding P1 MC length distribution, which ranged from ≈2 µm to 105 µm, averaging ≈12 ± 9.5 µm. Roughly, 75% of the MCs were below 15 µm. The average crack area density in P1 was ≈2.4 × 10⁹/m2. No cracks were observed in the LT plate face view. Further details of the microstructure, texturing, and MCs as well as their formation mechanisms are reported in [7,8,11].
Here, we investigated the properties of S-orientation P1 tensile specimens over a wide range of temperatures from −196 °C to 800 °C. Tensile tests were also carried out on S-orientation tensile specimens, taken from the similarly processed plate, P2, between −150 °C and RT. Our objectives were to compare: (i) the S-(new, in this study) and L-orientation (previously reported in [7,8]) tensile properties fabricated from the same NFA-1 P1; (ii) the S-tensile property variations between P1 and P2; and (iii) the specimen size effect on the S-tensile properties in P2 as well as between P1 and P2.
In summary, the key results show that due to the presence of brittle, cleavage system texturing, and MCs, the NFA-1 tensile properties were highly anisotropic. The in-plane L-orientation had very high strength and ductility over a wide range of temperatures [7,8]. In contrast, the strength and ductility of the out-of-plane, S-orientation tensile properties were much lower, fracturing elastically with zero ductility below a brittle to ductile transition temperature (BDT) of around 100 °C.
2. Materials and Methods
The processing and characterization methods employed for NFA-1 were briefly noted above, and have been previously reported [7,13], so will not be reiterated here. Processing resulted in 10 mm (P1) and 8 mm (P2) cross-rolled NFA-1 plates, respectively.
Uniaxial tensile tests, with loading in the short-thickness (S) direction, were performed on two different dog-bone-shaped, sub-sized coupon specimens, as shown in Figure 2. So-called SSJ2 type specimens [7], with a nominal gauge section length, width, and thickness of 5.0 × 1.2 × 0.5 mm, as shown in Figure 2a, were fabricated by electrical discharge machining (EDM) samples from both NFA-1 P1 and P2. Smaller micro-tensile specimens (µ-SSJ2) were fabricated from P2, which was slightly thinner than P1 (≈14.4 mm vs. ≈15.8 mm with the can). The nominal gauge section dimension of the µ-SSJ2 specimens were 2.2 × 0.86 × 0.5 mm, as shown in Figure 2b. These tests were used to characterize the 0.2% offset yield (σy) and ultimate engineering (σu) tensile stresses as well as the corresponding uniform elongation (εu), total elongation (εt), and reduction in area (RA), measures of ductility. All specimens were sanded down to 1500 grit to remove surface contamination, minor cracks, and any residual EDM stresses. The in-plane SSJ2 L-orientation specimens were all fabricated from P1. Tensile tests, at a strain rate of ≈10−3/s, were conducted in a clam-shell resistance heating air furnace or a cooling chamber for tests above and below RT, respectively. Heated specimens were held at the target temperature for 10 min before testing. The specimens for tests below RT were cooled by controlled LN2 spraying in an atmospheric chamber and held for 30 min at the target temperature. Except for the small specimen sizes, the tensile properties were determined in accordance with ASTM Standard E8M-15 [14]. Except for the P1 conditions with only one test at 100, 400, and 600 °C, two to fifteen tests were performed on all of the others. The S-tensile properties were similar for the specimens taken from both the TS (front) and LS (side) plate locations [7]. All specimens tested in this study were from the TS location (Figure 1a). Since only P1 SSJ2 tests were carried out above RT, the results are presented separately in Section 3.1 and Section 3.2 for lower (≤RT) and higher (≥RT) temperatures, respectively.
3. Results
3.1. P1 Tensile Properties at and Below RT
Table 1 summarizes the average and standard deviations of the tensile properties for all of the P1 SSJ2 specimen tests. Representative 23, −100, and −196 °C engineering stress-strain (σ–ε) curves for the P1 S and L-orientations are shown in Figure 3a–c, and σy, σu, and εt are plotted in Figure 3d–f for all of the tested temperatures from 23 to −196 °C. At and below RT, all of the S-orientation specimens failed elastically, at a low fracture stress (σf) less than σy, which generally decreased with decreasing temperature. This decrease in σf was due to the corresponding increase in the P1 matrix strength, coupled with a decrease in the cleavage fracture toughness, which is a topic of ongoing research. Here, the intrinsic strength refers to that observed in the absence of MC damage and a cleavage orientation texture, which can be approximately measured by tests in the L-orientation. Indeed, the L-orientation tests experienced extensive plastic deformation, with σy decreasing with increasing temperature from 1555 ± 121 at −196 °C to 1042 ± 102 MPa at RT. As a result of brittle cleavage, the corresponding RT σf for the S-orientation P1 tests was 730 ± 92 MPa, which was much less than the corresponding L-orientation average σu = 1133 ± 100 MPa. While the S-orientation tensile specimens fractured elastically with no ductility, the average L-orientation εt was ≈13 ± 5% at −150 °C, decreasing to 7.9 ± 0.7% at −196 °C. Again, the lower failure stress and ductility in the S- versus L-orientations were associated with brittle cleavage versus ductile fracture, respectively, as further discussed below.
Figure 4 shows representative SEM fractographs for the P1 S- and L-orientations for tests from RT to −196 °C. All the S-orientation specimens had flat, cleavage faceted fracture surfaces (Figure 4a–e). It appears that in most cases, cleavage initiated at the un-precracked ligament edges and corners, as indicated by the red arrows in Figure 4a–e. In contrast, the L-orientation fracture surfaces were dominated by periodic delaminations, which split the tensile gauge section into thin, knife-edge ruptured segments with shallow ductile dimples on their tops (Figure 4f–j). The L-orientation delaminations occurred on cleavage planes running parallel to the loading direction. The L-orientation delaminations and necking (indicated by the red dashed lines) were observed down to −196 °C (Figure 4e,j).
3.2. P1 Tensile Properties at and above RT
Figure 5a,b show examples of RT (repeated) to 800 °C engineering stress–strain (σ–ε) curves for the S and L orientations, respectively. The corresponding average strength and ductility properties are plotted in Figure 5c–f, and are summarized in Table 2. While the S-orientation tests at 100 °C showed a small amount of yielding and strain hardening, the fracture was still predominantly brittle cleavage (Figure 5a). There was significant plastic strain and strain hardening at 200 °C, with εt ≈ 8.6 ± 1.6% (Figure 5a,e). While σy remained nearly constant up to 400 °C at ≈700 MPa, it decreased rapidly at higher temperatures, falling to 192 ± 12 MPa at 800 °C (Figure 5c). The corresponding σu increased from 730 ± 92 at RT to a peak of 911 ± 8 MPa at 200 °C due to the corresponding increase in ductility (Figure 5d). The σu remained near the peak up to 400 °C, then also decreased rapidly to 201 ± 12 MPa at 800 °C. The εu peaked at 200 °C, but then steadily decreased to 0.7% at 800 °C (Figure 5e). The εt for the S-orientation followed a BDT trend between RT, with εt ≈ 0%, and 200 °C, with εt ≈9%. In contrast to εu, εt continued to increase approximately linearly with temperature, up to ≈16% at 800 °C (Figure 5f). Again, the BDT σy ≈ 1000 °C was associated with a combination of increasing cleavage fracture toughness and decreasing intrinsic NFA-1 strength at higher temperature.
The in-plane L-orientation σy decreased slightly between RT and 200 °C, primarily due to the corresponding decrease in the shear modulus [7]. The σy transitioned to a more rapid drop above 400 °C, where deformation is increasingly affected by viscoplastic creep, even at relatively high strain rates (≈10−3/s) [7,15]. Despite the decrease at the higher temperature, the L-orientation strength remained reasonably high, with σy ≈ 584 ± 35 MPa and σu ≈ 630 ± 35 MPa at 600 °C, and σy ≈ 251 ± 6 MPa and σu ≈ 278 ± 1 MPa at 800 °C (see Table 2). Thus, in all cases, the L-orientation strength remained higher than for the S-orientation, although they tended to converge with increasing temperature (see Figure 5c,d). The lower strength of the S-orientation at higher temperatures may, in part, be due to the MCs, which reduce the intact gauge section area of the tensile specimens.
Low-magnification SEM gauge section side views for the S-orientation, between 100 °C and 600 °C, are shown in Figure 6a–d. Figure 6e–h shows the corresponding SEM images of the fracture surfaces. Figure 6i–l shows low-magnification SEM images of the L-orientation fracture surfaces. Figure 6a,e clearly show that at 100 °C, the S-orientation fracture surfaces were very flat, without any necking or a reduction in area (RA). The side view in Figure 6b shows a small amount of necking at 200 °C. Here, about 75% of the fracture surface was flat, while the remaining ≈25% appeared to shear off. The corresponding 200 °C fracture surface in Figure 6f showed a collection of small, cleavage facet-bottomed dimples enclosed in larger flat regions, which failed by ductile rupture of the surrounding ligaments. It is likely that the facet-bottomed dimples are the pre-existing cleavage MCs, arrested at the grain boundaries, while the larger enclosing features resulted from the propagation, arrest, and blunting of the MCs at grain boundaries. Figure 6g,h shows that similar features occurred, albeit with a rapidly decreasing frequency up to 600 °C. The important implication of these observations is that cleavage, or what might be better described as quasi-cleavage [16], can occur in the S-orientation of NFA-1 P1 up to very high temperatures. Unfortunately, the fracture surfaces for S-orientation at 800 °C were too oxidized for reliable observations.
As noted previously, the RT and lower temperature L-orientation fracture surfaces were dominated by periodic delaminations that split the tensile gauge sections (Figure 4f–i). The frequency of delaminations decreased at higher temperatures and were completely absent at and above 400 °C (Figure 6i–l). However, the corresponding pre-existing MCs, which did not propagate to form delaminations at high temperature, were visible up to 800 °C.
The higher magnification SEM image of the S-orientation fracture surface in Figure 7a, again showed that cleavage was dominant at 100 °C, with only a few small areas of ductile features (shown in the black box in the top right of Figure 7a, and at much higher magnification in Figure 7b). Figure 7c–e shows higher magnification SEM fracture surface images for the S-orientation at 200, 400, and 600 °C. Again, at 200 and 400 °C, the fracture surfaces were dominated by flat-bottomed dimples covering a wide range of sizes, extending over dimensions of a grain to several grains. As noted above, these features are believed to be cleavage facets, arrested at higher toughness grain boundaries. The ligaments failed by knife edge rupture, again representing a type of quasi-cleavage. While regions of classical ductile dimple fracture increased with temperature, a decreasing fraction of flat-bottomed facets was observed up to 600 °C. Unfortunately, here, the fine fracture surface details were obscured by oxidation. Highly oxidized surfaces also obscured the mix of fracture mechanisms at 800 °C (not shown). Figure 7f shows that the L-orientation fracture surface at 200 °C was again characterized by out-of-plane, loading direction delamination cracks, surrounded by near knife edge ruptures with ductile dimples on their tops. The L-orientation delaminations were absent at and above 400 °C, as shown in Figure 6j and Figure 7g,h. Oxidation was again an issue in the L-orientation tests at and above 600 °C.
3.3. Specimen Size and NFA-1 Plate Variation for the S-Orientation Tensile Tests
The S-orientation SSJ2-tensile specimens were fabricated from two NFA-1 plates (P1 and P2). Smaller µ-SSJ2 tensile specimens were also fabricated from P2 (see Figure 2). The P2 specimens were tested between −150 °C and RT. The average and standard deviations for all of the low-temperature tensile test data are summarized by color-code in Table 3. The corresponding average and standard deviations of σf are plotted in Figure 8. While they were processed in a similar manner, the MC density in P2 was much lower than in P1. Indeed, a closely examined 30 mm2 area of P2 contained no visible MCs, while the equivalent area of P1 would be expected to contain ≈72,000, based on the P1 average MC density cited above. Note, however, that there were many areas of P1 where visible MCs were not observed, while very small MCs may be closed and thus could be invisible in P2. However, while the relative numbers could not be precisely established, it is clear that P1 contained many more pre-existing MCs than P2. Furthermore, evidence of such differences was provided by their respective σf as well as their fracture surfaces, as discussed below.
The RT, −100 °C, and −150 °C SSJ2 tests of the σf P2/P1 ratios averaged 1.40, 1.56, and 1.47 times higher, respectively. The average σf ratio of 1.47 was consistent with different (a) MC populations or (2) cleavage initiation mechanisms. The corresponding σf ratios for P2 µ-SSJ2/SSJ2 were 1.06, 1.19, and 0.8, averaging only 1.02. This size-dependent ratio might be expected to be larger, since the gauge section volumes of the µ-SSJ2 and SSJ2 specimens were 1 mm3 and 3 mm3, respectively. This may suggest that in the absence of large pre-existing MCs, the collective effect of other regions of stress concentrations (small MC, dislocation pile-ups, polycrystalline crystal plasticity effect, trigger particles) activates multiple cleavage sites.
All of the S-orientation fractographs for the P1 and P2 SSJ2 tests at RT and −100 °C in Figure 9 showed cleavage fracture. However, the P1 fracture surfaces in Figure 9a,b were much flatter than in the case of P2, as shown in Figure 9c,d. The flat P1 fracture surface topology and river patterns suggest that in P1, fracture involves the propagation of one or a few MCs, often (but not always) initiating at the edge or corner of the precracked ligament, as indicated by red arrows. This pattern is attributed to the dominant effect of the larger pre-existing MCs. In contrast, the P2 fracture surface suggests that multiple sites of cleavage crack initiation are located throughout the un-precracked ligament. The P2 fracture surfaces were rough, with packets of cleavage regions at different heights. Again, as noted above, this may indicate, in the absence of large pre-existing MCs, the collective effect of a population of small, perhaps invisible, regions of stress concentrations that activate multiple cleavage sites in rapid succession.
To further explore the fracture statistics, a larger number of both SSJ2 and µ-SSJ2 tests were carried out on P2 at −100 °C and −150 °C. These datasets provide an opportunity to carry out a Weibull-type statistical analysis, analogous to what is conducted for weakest link microcracked ceramics [17,18,19]. Figure 10a,b show the Weibull plots of ln(−ln(1−F)) versus ln(σf). Here, the failure probability, F, is defined by ranking the σf in increasing order (i = 1 to N) and assuming Fi = (2i−1)/2N, where N is the total number of data points [18,19,20]. The fit line slope is the Weibull modulus (m), ranging from m ≈4.8 to 9.2. However, since there were only three SSJ2 data points at −100 °C, the m = 9.2 is not very reliable. The Weibull stresses at F = 0.5 (σF0.5) for P2 were respectively 658 MPa and 354 MPa for µ-SSJ2 at −100 °C and −150 °C, and 569 MPa and 458 MPa for SSJ2 P2 at −100 °C and −150 °C. Thus, while at −100 °C, the σF0.5 was larger for the smaller specimens as expected, this was not the case for tests at −150 °C. A normalized Weibull distribution for all four cases for P2 is plotted in Figure 11. The normalization was based on dividing the σf by σF0.5. The Weibull modulus (m) for the normalized σf was 5.4.
4. Discussion
The tensile data reported here will support a broader ongoing effort to understand the BDT in bcc metals and alloys, and to model the invariant shape of the master toughness–temperature curve for steels [21,22]. However, further discussion of these topics was beyond the scope of this paper. Rather, our focus was on the profound anisotropy in the tensile properties and fracture mechanisms operating in a deformation-processed NFA-1 plate. Note that NFA-1 is representative of a broader class of nano-oxide-strengthened steels (NFA, aka ODS). NFAs are leading candidates for advanced fission and fusion applications and a host of other technologies [1,2,3,4,5,6].
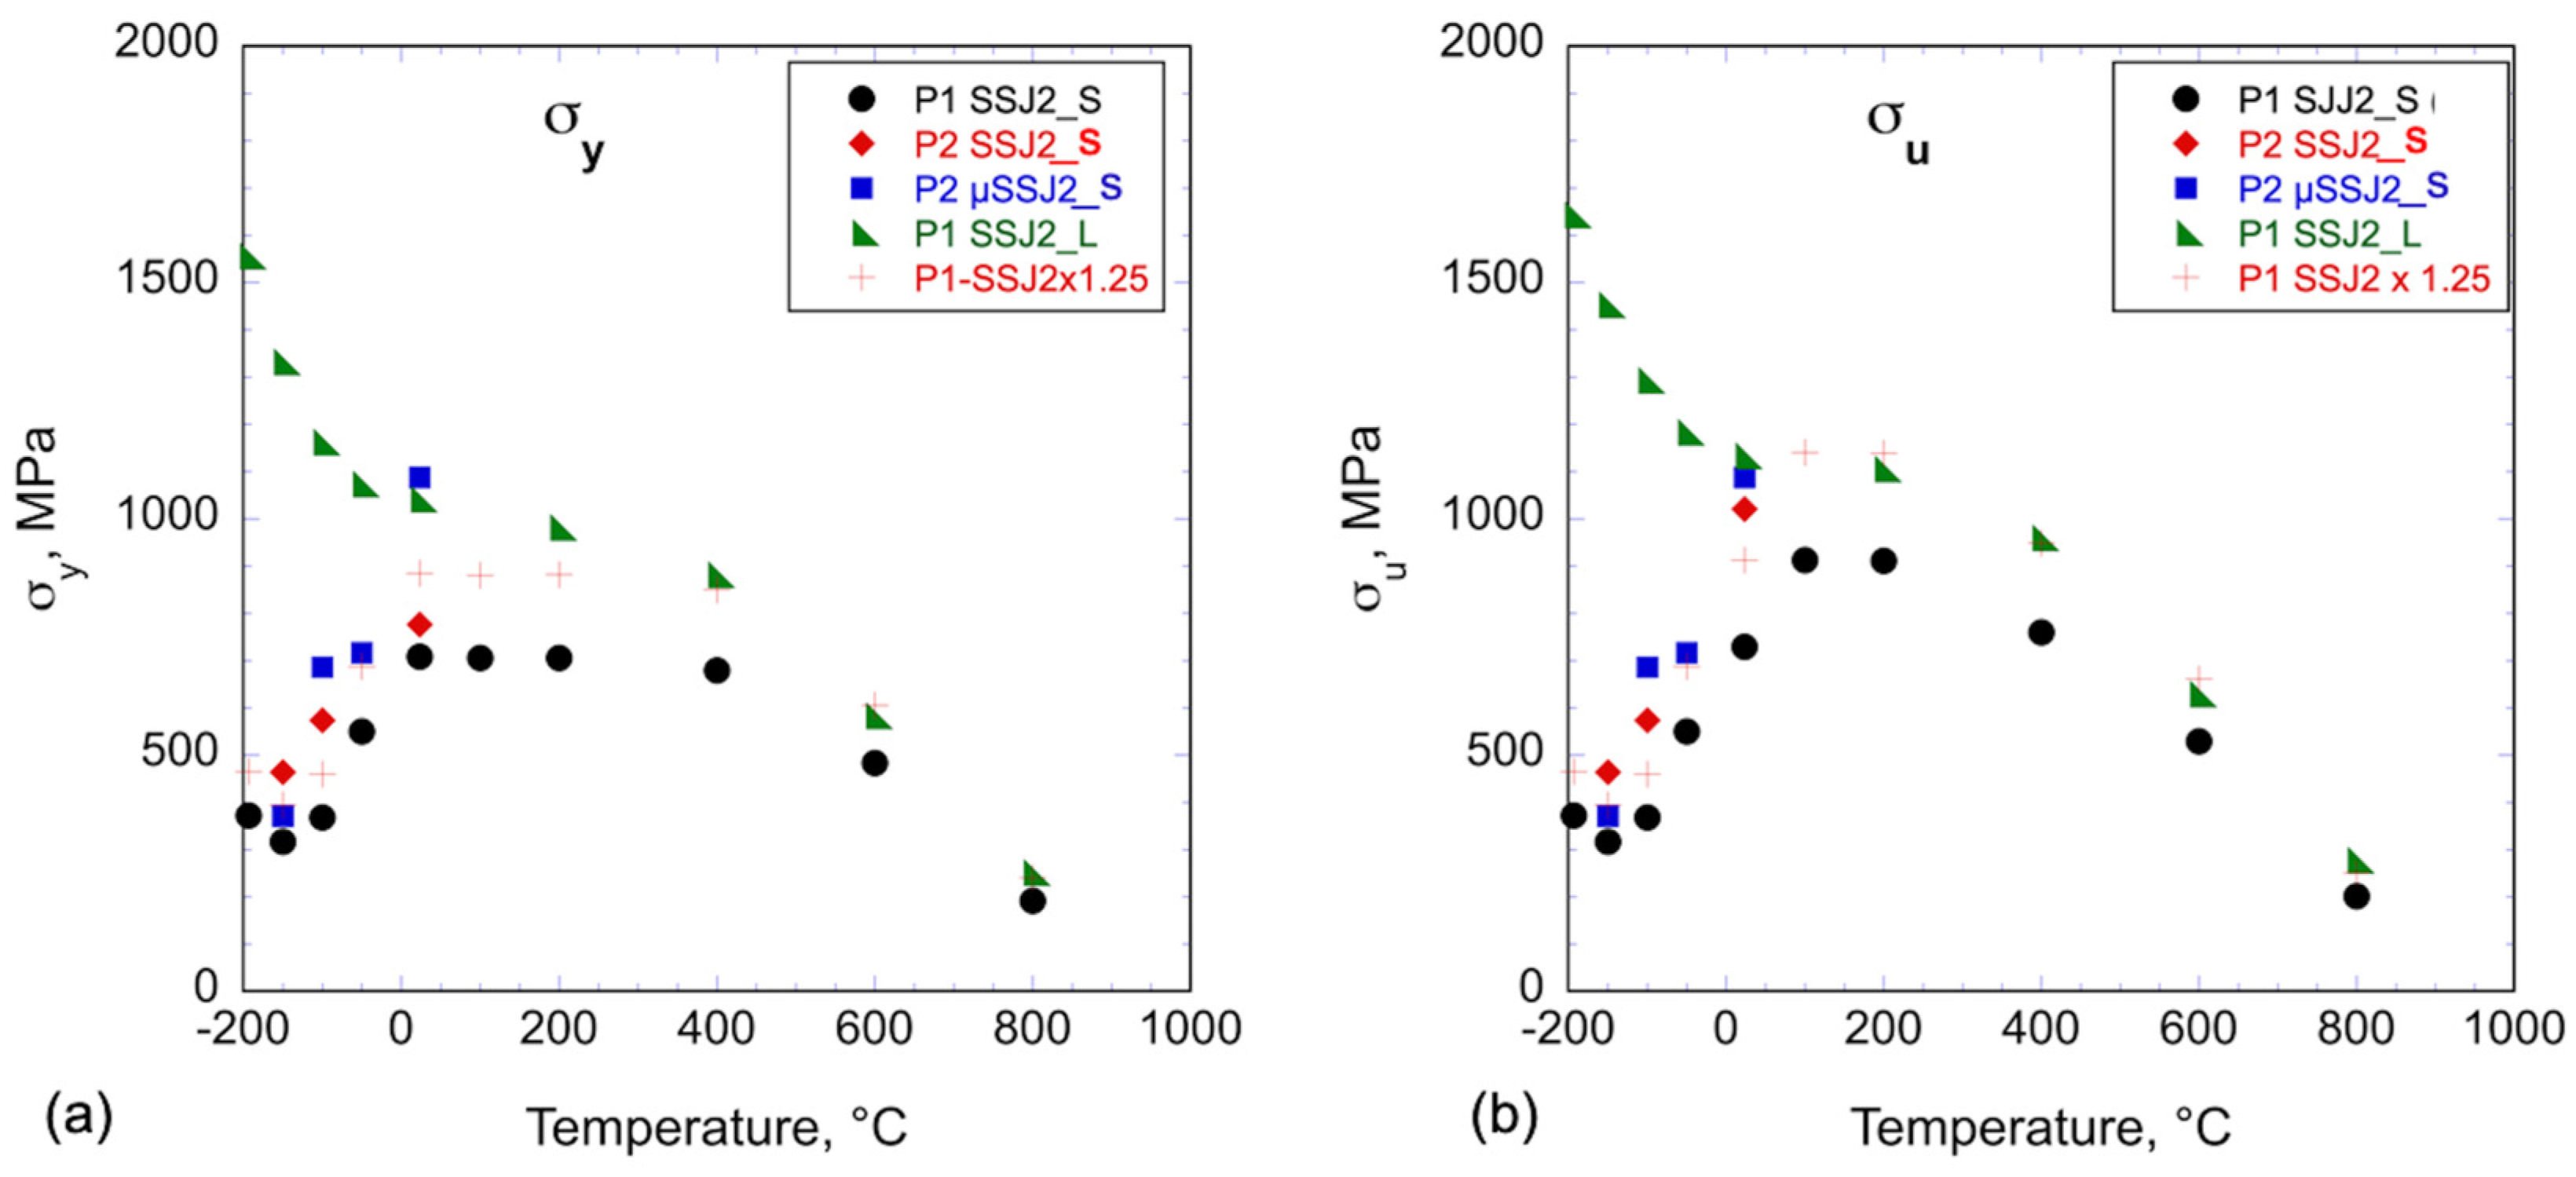
Figure 12 summarizes all of the σy and σu data measured in this study. The most important result reported here is that cross-rolling an extruded NFA bar led to a dominant (001) cleavage system texture anisotropy, resulting in an out-of-plane loading axis direction (S) parallel to the plate thickness direction, with low, brittle, elastic σf. This is in contrast with the normal ductile deformation and fracture processes observed in the in-plane L-orientation. Again, the mechanism leading to the markedly different behavior was cleavage on the (001) planes, which lie parallel to the plate faces. Below RT, the fracture was 100% cleavage. The corresponding σf decreased with decreasing temperature due to a combination of increasing intrinsic (defect-free) NFA-1 strength and decreasing cleavage fracture toughness. The BDT of P1 for the S-orientation was ≈100 °C. The corresponding ductile σy at the BDT was ≈1000 MPa. Note that the L-orientation had no BDT or it was less than −196 °C, our lowest testing temperature.
At higher temperatures and lower strength, cleavage became increasingly infrequent. Nevertheless, cleavage still formed flat-bottomed faceted features at or above 200 °C, which subsequently underwent ductile rupture of the surrounding ligaments. Remarkably, it appears that limited regions of cleavage occurred up to 600 °C, and perhaps even higher. Since the intrinsic P1 σy at the BDT was ≈1000 MPa, it follows that the corresponding BDT temperature increased with increasing NFA strength, associated with either a particular alloy or in-service irradiation hardening. Note that in the absence of large pre-existing MCs, the BDT in P2 may be slightly less than 100 °C. Alternatively, the intrinsic P2 strain-hardened 100 °C BDT stress, the σu at σf at a 100 °C BDT, could be higher. Additional elevated temperature P2 tests are needed to confirm these conclusions.
Another important result shown in Figure 12 is that at and below RT, σf depends on the plate (P1 vs. P2). The average σf at −100 °C and −150 °C was 368 ± 107 and 316 ± 43 MPa for PI SSJ2 and 573 ± 115 and 464 ± 57 MPa for P2 SSJ2. The plate-to-plate differences are likely due to the fact that P1 contained a large population of pre-existing MCs, while P2 had few if any, at least ones that were observable. Larger MCs would reduce the σf relative to a gauge section that is uncracked. Furthermore, the net intact gauge section stresses would be larger than the nominal value in the presence of extensive microcracking. The ‘+’ symbols in Figure 12 are intended to approximately account for such net section stress differences by adjusting the P1 S σf, σy, and σu data by a factor 1.25, which results in approximately the same L- and S-orientation stresses at and above 400 °C for σy and 100 °C for σu. This adjustment also resulted in a somewhat better alignment of the low-temperature P1 and P2 σf.
The large variations in low-temperature S-orientation σf can be described by the weakest link Weibull statistics with a relatively low modulus m ≈5.4 ± 0.6. This compares to the typical moduli for microcracked ceramics of m = 10 to 20 [23]. Assuming the same size distribution, the approximate effect of variations (P1 and P2) in MC density (N1,2) on σf is given by σFP2/σFP1 = (NP2/NP1)1/m.
For the average ratio P1 and P2 σfP2/σfP1 = 1.47, an m ≈5.4 is consistent with an NP2/NP1 ≈ 0.125. Since the actual ratio appears to be much less than this, it seems likely that P2 represents a near upper bound on σf.
5. Summary and Closing Remarks
Tensile tests were performed from −196 °C to 800 °C on the out-of-plane, S-orientation of cross-rolled NFA-1. Elastic cleavage fracture occurred from ≈−196 to 100 °C at a σf that decreased with decreasing temperature. In contrast, previously reported in-plane L-orientation tensile tests showed normally increasing σy and σu with the decreasing temperature, accompanied by significant ductility with εt ≈ 8%, even at −196 °C. The S-orientation behavior was due to severe texturing following cross-rolling, resulting in (001) cleavage system planes running parallel to the plate faces. Higher-temperature S-orientation tests showed gradually increasing ductility with εt ≈ 16.2 ± 0.3% at 800 °C. However, the S-orientation σy remained roughly constant up to 400 °C, decreasing rapidly at higher temperatures, while σu decreased more slowly due to increased ductility. Thus, the S-orientation P1 BDT was ≈ 100 °C, consistent with the cleavage fracture surfaces. Remarkably, however, while increasingly isolated, cleavage regions of the S-orientation fracture surfaces were observed up to 600 °C. In contrast to the divergence of low-temperature strength and ductility, the S- and L-orientation tensile properties tended to converge above 600 °C. The plate-dependent tensile properties can be, at least qualitatively, rationalized based on different cleavage initiation mechanisms depending on the presence or absence of pre-existing MCs.
While plate processing can lead to extensive microcracking, the differences between P1 and P2 show that this can be avoided. However, additional research will be needed to clarify the underlying reasons. Nevertheless, even in the absence of MCs, the tensile S-orientation BDT is at or above RT. Of course, the macroscopic notch or precrack fracture toughness BDT with large local stress concentrations would be much higher. Finally, the results reported here will be of direct use in modeling a variety of important phenomena in NFA such as defect-free deformation processing paths, delamination toughening, heat transfer, and thermal shock resistance. For example, even modest delaminations could degrade through-wall heat transfer, which plays a major functional role in complex energy conversion systems. More generally, the results reported here will also add to our understanding and modeling of the cleavage fracture, the BDT, and the invariant shape of the fracture toughness temperature curve.
Author Contributions
Conceptualization, M.E.A. and G.R.O.; Formal analysis, M.E.A. and G.R.O.; Investigation, M.E.A.; Data curation, M.E.A.; Writing—original draft preparation, M.E.A. and G.R.O.; Writing—review and editing, M.E.A. and G.R.O.; Supervision, G.R.O.; Project administration, G.R.O.; Funding acquisition, G.R.O. All authors have read and agreed to the published version of the manuscript.
Funding
This research was funded by the U.S. Department of Energy (DOE) Office of Fusion Energy Sciences (DE-FG03-94ER54275).
Data Availability Statement
Data will be available upon request.
Acknowledgments
We thank our UCSB colleagues Soupitak Pal, Takuya Yamamoto, David Gragg, and Kirk Fields for their important contributions to this work. We also acknowledge the support provided by the U.S. Department of Energy through the Office of Fusion Energy Sciences (DE-FG02-94ER54275). The U.S. National Science Foundation supported California Nanoscience Institute provided facilities critical to the success of this research. We also gratefully recognize D. T. Hoelzer at ORNL and S. A. Maloy at LANL for their key roles in developing NFA-1.
Conflicts of Interest
The authors declare no conflicts of interest.
References
- Odette, G.R.; Alinger, M.J.; Wirth, B.D. Recent Developments in Irradiation-Resistant Steels. Annu. Rev. Mater. Res. 2008, 38, 471–503. [Google Scholar] [CrossRef]
- Ukai, S. Oxide Dispersion Strengthened Steels. In Comprehensive Nuclear Materials; Konings, R., Ed.; Elsevier: Atlanta, GA, USA, 2012; pp. 241–271. [Google Scholar]
- Zinkle, S.J.; Was, G.S. Materials challenges in nuclear energy. Acta Mater. 2013, 61, 735–758. [Google Scholar] [CrossRef]
- Ukai, S.; Harada, M.; Okada, H.; Inoue, M.; Nomura, S.; Shikakura, S.; Asabe, K.; Nishida, T.; Fujiwara, M. Alloying design of oxide dispersion strengthened ferritic steel for long life FBRs core materials. J. Nucl. Mater. 1993, 204, 65–73. [Google Scholar] [CrossRef]
- Ukai, S.; Ohtsuka, S.; Kaito, T.; de Carlan, Y.; Ribis, J.; Malaplate, J. Oxide dispersion-strengthened/ferrite-martensite steels as core materials for Generation IV nuclear reactors-Ch 10. In Structural Materials for Generation IV Nuclear Reactors; Yvon, P., Ed.; Woodhead Publishing: Sawston, UK; Elsevier: Amsterdam, The Netherlands, 2017; pp. 357–414. ISBN 978-0-08-100906-2. [Google Scholar]
- Odette, G.R.; Cunningham, N.J.; Stan, T.; Alam, M.E.; De Carlan, Y. Chapter 12—Nano-Oxide Dispersion-Strengthened Steels. In Structural Alloys for Nuclear Energy Applications; Elsevier Inc.: Amsterdam, The Netherlands, 2019; pp. 529–583. ISBN 9780123970466. [Google Scholar]
- Alam, M.E.; Pal, S.; Fields, K.; Maloy, S.A.; Hoelzer, D.T.; Odette, G.R. Tensile deformation and fracture properties of a 14YWT nanostructured ferritic alloy. Mater. Sci. Eng. A 2016, 675, 437–448. [Google Scholar] [CrossRef]
- Alam, M.E.; Pal, S.; Maloy, S.A.; Odette, G.R. On delamination toughening of a 14YWT nanostructured ferritic alloy. Acta Mater. 2017, 136, 61–73. [Google Scholar] [CrossRef]
- Odette, G.R. On the status and prospects for nanostructured ferritic alloys for nuclear fission and fusion application with emphasis on the underlying science. Scr. Mater. 2018, 143, 142–148. [Google Scholar] [CrossRef]
- Kasada, R.; Lee, S.G.; Isselin, J.; Lee, J.H.; Omura, T.; Kimura, A.; Okuda, T.; Inoue, M.; Ukai, S.; Ohnuki, S.; et al. Anisotropy in tensile and ductile-brittle transition behavior of ODS ferritic steels. J. Nucl. Mater. 2011, 417, 180–184. [Google Scholar] [CrossRef]
- Pal, S.; Alam, M.E.; Maloy, S.A.; Hoelzer, D.T.; Odette, G.R. Texture evolution and microcracking mechanisms in as-extruded and cross-rolled conditions of a 14YWT nanostructured ferritic alloy. Acta Mater. 2018, 152, 338–357. [Google Scholar] [CrossRef]
- Ukai, S.; Izawa, W.; Oono, N.; Hayashi, S.; Kohno, Y.; Ohtsuka, S.; Kaito, T. Charpy impact property related to {100} cleavage fracture in 15CrODS steel. Mater. Sci. Technol. 2014, 30, 1709–1714. [Google Scholar] [CrossRef]
- Cunningham, N.J.; Wu, Y.; Odette, G.R.; Hoelzer, D.T.; Maloy, S.A. Characterization of a larger best practice heat of 14YWT in annealed powder, HIP consolidated and extruded forms. DOE Fusion React. Mater. Progr. Semiannu. Prog. Rep. 2013, 54, 15–26. [Google Scholar]
- ASTM E8M-15a; Standard Test Methods for Tension Testing of Metallic Materials. ASTM International: West Conshohocken, PA, USA, 2015.
- Kim, J.H.; Byun, T.S.; Hoelzer, D.T.; Park, C.H.; Yeom, J.T.; Hong, J.K. Temperature dependence of strengthening mechanisms in the nanostructured ferritic alloy 14YWT: Part II—Mechanistic models and predictions. Mater. Sci. Eng. A 2013, 559, 111–118. [Google Scholar] [CrossRef]
- Martin, M.L.; Fenske, J.A.; Liu, G.S.; Sofronis, P.; Robertson, I.M. On the formation and nature of quasi-cleavage fracture surfaces in hydrogen embrittled steels. Acta Mater. 2011, 59, 1601–1606. [Google Scholar] [CrossRef]
- Wong, T.F.; Wong, R.H.C.; Chau, K.T.; Tang, C.A. Microcrack statistics, Weibull distribution and micromechanical modeling of compressive failure in rock. Mech. Mater. 2006, 38, 664–681. [Google Scholar] [CrossRef]
- Anderson, T.L. Fracture Mechanics: Fundamentals and Applications, 3rd ed.; Taylor & Francis Group: Boca Raton, FL, USA, 2005. [Google Scholar]
- Rinne, H. The Weibull Distribution: A Handbook; Chapman and Hall/CRC: Boca Raton, FL, USA, 2008. [Google Scholar]
- ASTM E1921-20; Standard Test Method for Determination of Reference Temperature, to, for Ferritic Steels in the Transition Range. ASTM International: West Conshohocken, PA, USA, 2020.
- Odette, G.R.; Rathbun, H.J.; Hribernik, M.; Yamamoto, T.; He, M.; Spätig, P. A Multiscale Approach to Measuring and Modeling Cleavage Fracture Toughness in Structural Steels. In Materials Issues for Generation IV Systems; Ghetta, V., Gorse, D., Mazière, D., Pontikis, V., Eds.; Springer: Dordrecht, The Netherlands, 2008; pp. 203–226. [Google Scholar]
- Hribernik, M.L. Cleavage Oriented Iron Single Crystal Fracture Toughness. Ph.D. Thesis, University of California, Santa Barbara, CA, USA, 2006. [Google Scholar]
- Danzer, R.; Supancic, P.; Pascual, J.; Lube, T. Fracture statistics of ceramics—Weibull statistics and deviations from Weibull statistics. Eng. Fract. Mech. 2007, 74, 2919–2932. [Google Scholar] [CrossRef]
Figure 1.
(a) NFA-1 specimen orientations labeled with respect to the extrusion, cross-rolling, and plate thickness directions; (b) 3-D EBSD inverse pole figure (IPF) maps showing strong <001> texture along the extrusion and cross-rolling directions, and (001) plane grains lying parallel to the LT plate face; (c) SEM image showing the grains and microcracks (MCs); (d) the MC length distribution.

Figure 2.
Tensile specimens used in this study: (a) SSJ2 and (b) µ-SSJ2.

Figure 3.
Engineering tensile stress–strain (σ–ε) curves for the P1 S- and L-oriented NFA-1 specimens at (a) 23 °C, (b) −150 °C, (c) −196 °C. The corresponding tensile properties are shown in (d) σy, (e) σu, and (f) εt, respectively.
Figure 3.
Engineering tensile stress–strain (σ–ε) curves for the P1 S- and L-oriented NFA-1 specimens at (a) 23 °C, (b) −150 °C, (c) −196 °C. The corresponding tensile properties are shown in (d) σy, (e) σu, and (f) εt, respectively.

Figure 4.
(a–d) Low magnification SEM fractographs for the S-orientation tests at (a) 23 °C, (b) −100 °C, (c) −150 °C, and (d) −196 °C, (f–i) show the corresponding images for the L-orientation tests. (e) shows a fracture surface at higher magnification for a P1 S test at 23 °C, with likely cleavage initiation sites indicated by the red arrows; (j) shows a higher magnification SEM image for an L-orientation test at −196 °C, revealing ruptured delamination blades with ductile dimples on the tops.

Figure 5.
Engineering tensile stress–strain (σ–ε) curves at and above RT for the (a) S- and (b) L-orientations. The corresponding tensile properties are shown in (c) σy, (d) σu, (e) εu, and (f) εt, respectively.
Figure 5.
Engineering tensile stress–strain (σ–ε) curves at and above RT for the (a) S- and (b) L-orientations. The corresponding tensile properties are shown in (c) σy, (d) σu, (e) εu, and (f) εt, respectively.

Figure 6.
Low magnification SEM side profile images (a–d) and fracture surfaces (e–h) for the S-oriented tensile specimens tested at (a,e) 100 °C, (b,f) 200 °C, (c,g) 400 °C, and (d,h) 600 °C and the fracture surfaces for the L-oriented specimens at (i) 200 °C, (j) 400 °C, (k) 600 °C, and (l) 800 °C, respectively. The scale bars are shown at the bottom of each column.
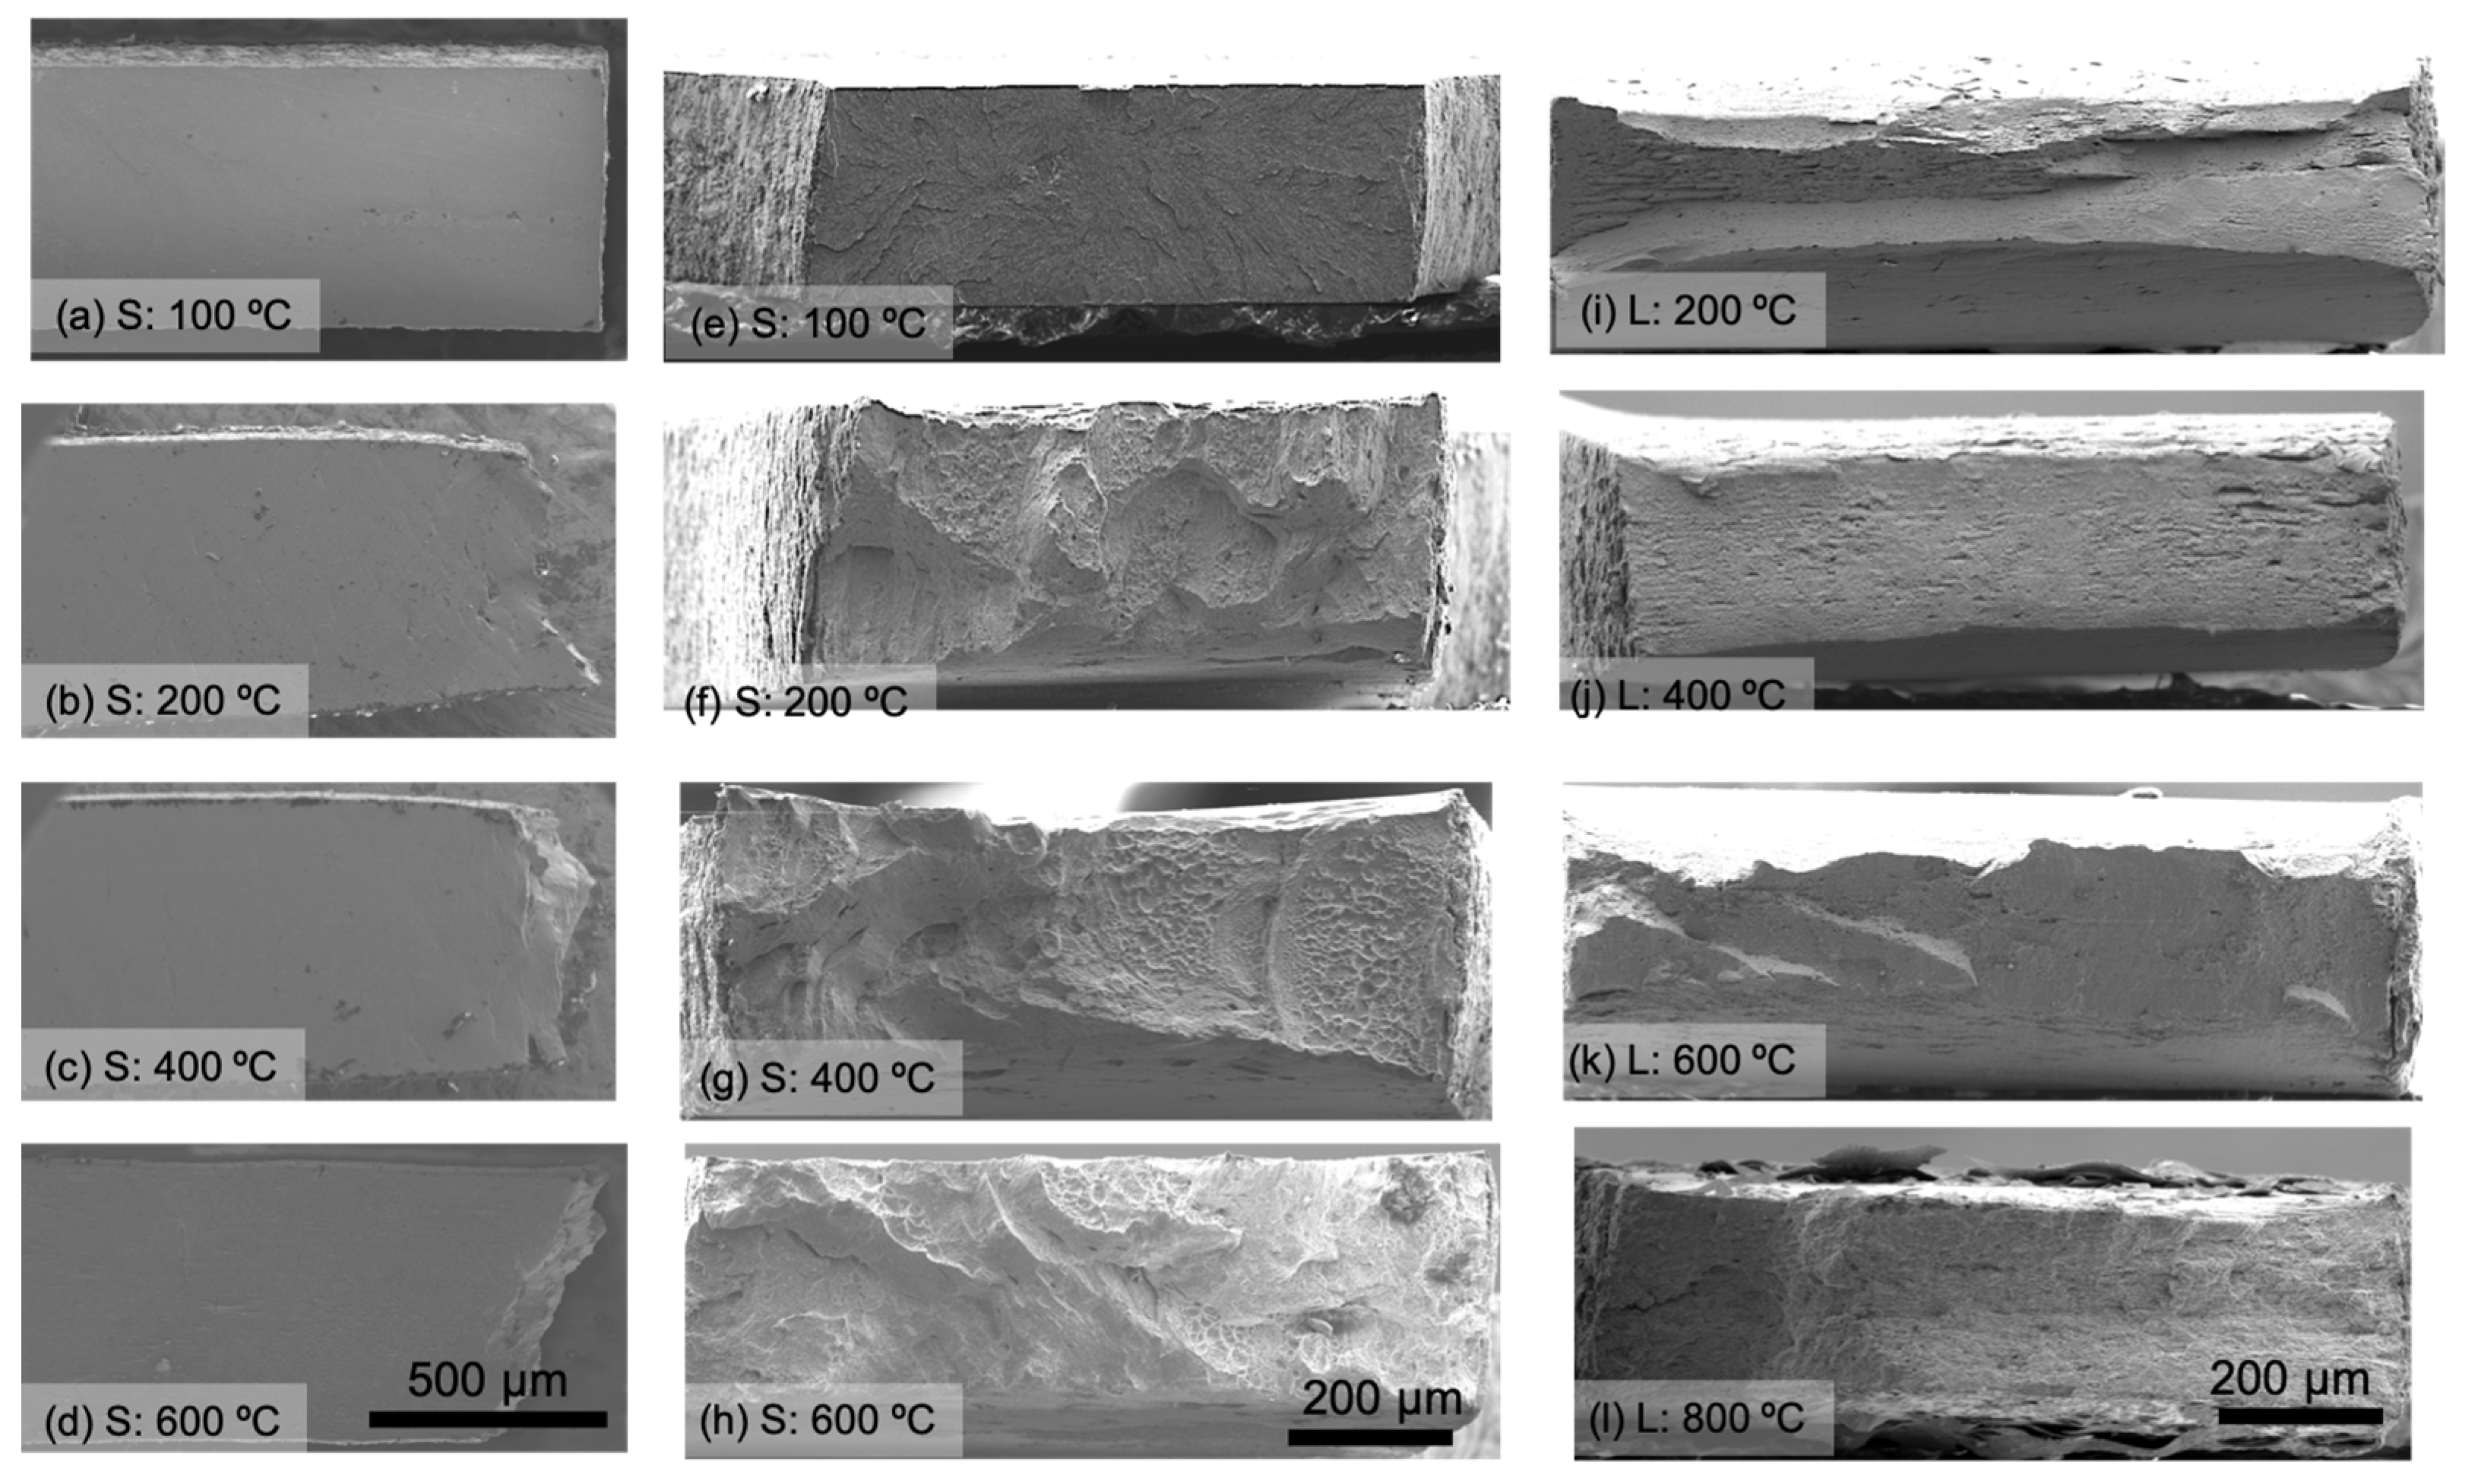
Figure 7.
Higher magnification SEM fracture surfaces for (a,b) S at 100 °C, (c) S at 200 °C, (d) S at 400 °C, (e) S at 600 °C, (f) L at 200 °C, (g) L at 400 °C, and (h) L at 600 °C.
Figure 7.
Higher magnification SEM fracture surfaces for (a,b) S at 100 °C, (c) S at 200 °C, (d) S at 400 °C, (e) S at 600 °C, (f) L at 200 °C, (g) L at 400 °C, and (h) L at 600 °C.

Figure 8.
S-orientation specimen size and plate-to-plate (P1/P2) effects on σf: (a) all S-orientation tests, (b) SSJ2 versus µ-SSJ2 specimens, and, (c) SSJ2 P1 versus P2 tests.
Figure 8.
S-orientation specimen size and plate-to-plate (P1/P2) effects on σf: (a) all S-orientation tests, (b) SSJ2 versus µ-SSJ2 specimens, and, (c) SSJ2 P1 versus P2 tests.

Figure 9.
SEM fractography for the P1 versus P2 SSJ2 S tensile specimens: (a,b) P1 at 23 °C and −100 °C, respectively, (c,d) P2 at 23 °C and −100 °C, and (e,f) corresponding higher magnification images for P2 at 23 °C (e), and −100 °C (f). The right-column images are the same magnification as the left-columns.

Figure 10.
Weibull plots of ln(-ln(1-F)) versus ln(σf) of Plate 2 for the (a) µ-SSJ2 and (b) SSJ2 specimens at −100 °C and −150 °C.
Figure 10.
Weibull plots of ln(-ln(1-F)) versus ln(σf) of Plate 2 for the (a) µ-SSJ2 and (b) SSJ2 specimens at −100 °C and −150 °C.

Figure 11.
Weibull plots of ln(−ln(1−F)) versus normalized ln(σf/σF0.5) of Plate 2 for all four conditions. The normalization was performed by individually dividing σF by σF0.5 to their respective conditions.
Figure 11.
Weibull plots of ln(−ln(1−F)) versus normalized ln(σf/σF0.5) of Plate 2 for all four conditions. The normalization was performed by individually dividing σF by σF0.5 to their respective conditions.

Figure 12.
(a) σy and (b) σu of all S- and L-tensile specimens over a wide range of temperatures.

Table 1.
Room (≈23 °C) to liquid nitrogen (−196 °C) temperature tensile properties of S- and L-orientation SSJ2 NFA-1 P1.
Table 1.
Room (≈23 °C) to liquid nitrogen (−196 °C) temperature tensile properties of S- and L-orientation SSJ2 NFA-1 P1.
| Test Temp. (°C) | Specimen Orientation | σy or σf, MPa | σu, MPa | εu, % | εt, % | RA, % |
|---|---|---|---|---|---|---|
| 23 | S | 708 ± 57 | 730 ± 92 | 0.2 ± 0.3 | 0.2 ± 0.3 | 4 ± 2 |
| L | 1042 ± 102 | 1133 ± 100 | 3.8 ± 3.7 | 12.9 ± 1.5 | 56 ± 8 | |
| −50 | S | 550 ± 8 | 550 ± 8 | 0 ± 0 | 0 ± 0 | 0 |
| L | 1073 ± 65 | 1183 ± 76 | 6.9 ± 4 | 15.7 ± 0.7 | 50 ± 4 | |
| −100 | S | 368 ± 107 | 368 ± 107 | 0 ± 0 | 0 ± 0 | 0 |
| L | 1162 ± 54 | 1293 ± 62 | 5.7 ± 6 | 14.8 ± 1.8 | 56 ± 14 | |
| −150 | S | 316 ± 43 | 316 ± 43 | 0 ± 0 | 0 ± 0 | 0 |
| L | 1332 ± 69 | 1453 ± 103 | 6 ± 6.5 | 13 ± 5 | 51 ± 3 | |
| −196 | S | 372 ± 23 | 372 ± 23 | 0 ± 0 | 0 ± 0 | 0 |
| L | 1555 ± 121 | 1643 ± 112 | 1.0 ± 0 | 7.9 ± 0.7 | 31 ± 6 |
σy = yield stress, σf = fracture stress, σu = ultimate tensile stress, εu = uniform elongation, εt = total elongation, RA = reduction in area.
Table 2.
Room (23 °C) to high (800 °C) temperature SSJ2 tensile properties of the S- and L-orientation NFA-1 tests.
Table 2.
Room (23 °C) to high (800 °C) temperature SSJ2 tensile properties of the S- and L-orientation NFA-1 tests.
| Test Temp. (°C) | Specimen Orientation | σy, MPa | σu, MPa | εu, % | εt, % |
|---|---|---|---|---|---|
| 23 | S | 708 ± 57 | 730 ± 92 | 0.2 ± 0.3 | 0.2 ± 0.3 |
| L | 1042 ± 102 | 1133 ± 100 | 3.8 ± 3.7 | 12.9 ± 1.5 | |
| 100 | S | 705 | 912 | 2.3 | 2.3 |
| L | - | - | - | - | |
| 200 | S | 706 ± 9 | 911 ± 8 | 5.4 ± 1.2 | 8.6 ± 1.6 |
| L | 982 ± 25 | 1106 ± 21 | 4.8 ± 1.5 | 10.4 ± 1.5 | |
| 400 | S | 680 | 759 | 3.2 | 10.7 |
| L | 882 ± 21 | 960 ± 34 | 4.5 ± 1.3 | 9.2 ± 1.7 | |
| 600 | S | 484 | 529 | 1.7 | 13.5 |
| L | 584 ± 35 | 630 ± 35 | 2.3 ± 1.0 | 16.5 ± 3.9 | |
| 800 | S | 192 ± 12 | 201 ± 12 | 0.7 ± 0.0 | 16.2 ± 0.3 |
| L | 251 ± 6 | 278 ±1 | 3.4 ± 0 | 17.3 ± 0.4 |
Table 3.
Room to liquid nitrogen temperature tensile properties of S-oriented NFA-1 as a function of specimen type and plates.
Table 3.
Room to liquid nitrogen temperature tensile properties of S-oriented NFA-1 as a function of specimen type and plates.
| Test Temp. (°C) | NFA-1 Plate | Specimen Type | Specimen ID | σy, MPa | σu, MPa | εt, % |
|---|---|---|---|---|---|---|
| 23 | P1 | SSJ2 | ST-01 | 765 | 832 | 0.5 |
| SSJ2 | ST-02 | 707 | 707 | 0 | ||
| SSJ2 | ST-13 | 652 | 652 | 0 | ||
| P2 | SSJ2 | ST-14 | 777 | 1020 | 3.6 | |
| µ-SSJ2 | ST-15 | 1074 | 1074 | 0 | ||
| µ-SSJ2 | ST-16 | 1100 | 1100 | 0 | ||
| −50 | P1 | SSJ2 | ST-L1 | 544 | 544 | 0 |
| SSJ2 | ST-L8 | 555 | 555 | 0 | ||
| P2 | µ-SSJ2 | ST-L38 | 717 | 717 | 0 | |
| −100 | P1 | SSJ2 | ST-L2 | 443 | 443 | 0 |
| SSJ2 | ST-L9 | 292 | 292 | 0 | ||
| P2 | SSJ2 | ST-L11 | 551 | 551 | 0 | |
| SSJ2 | ST-L12 | 749 | 749 | 0 | ||
| SSJ2 | ST-L13 | 538 | 538 | 0 | ||
| SSJ2 | ST-L14 | 428 | 428 | 0 | ||
| SSJ2 | ST-L15 | 686 | 686 | 0 | ||
| SSJ2 | ST-L16 | 625 | 625 | 0 | ||
| SSJ2 | ST-L17 | 586 | 586 | 0 | ||
| SSJ2 | ST-L18 | 423 | 423 | 0 | ||
| µ-SSJ2 | ST-L20 | 781 | 781 | 0 | ||
| µ-SSJ2 | ST-L21 | 605 | 605 | 0 | ||
| µ-SSJ2 | ST-L22 | 734 | 898 | 3.2 | ||
| µ-SSJ2 | ST-L23 | 658 | 658 | 0 | ||
| µ-SSJ2 | ST-L24 | 486 | 486 | 0 | ||
| −150 | P1 | SSJ2 | ST-L3 | 285 | 285 | 0 |
| SSJ2 | ST-L10 | 346 | 346 | 0 | ||
| P2 | SSJ2 | ST-L5 | 458 | 458 | 0 | |
| SSJ2 | ST-L6 | 410 | 410 | 0 | ||
| SSJ2 | ST-L19 | 524 | 524 | 0 | ||
| µ-SSJ2 | ST-L25 | 553 | 553 | 0 | ||
| µ-SSJ2 | ST-L26 | 249 | 249 | 0 | ||
| µ-SSJ2 | ST-L27 | 393 | 393 | 0 | ||
| µ-SSJ2 | ST-L29 | 342 | 342 | 0 | ||
| µ-SSJ2 | ST-L30 | 414 | 414 | 0 | ||
| µ-SSJ2 | ST-L3 | 335 | 335 | 0 | ||
| µ-SSJ2 | ST-L32 | 474 | 474 | 0 | ||
| µ-SSJ2 | ST-L33 | 298 | 298 | 0 | ||
| µ-SSJ2 | ST-L34 | 277 | 277 | 0 | ||
| µ-SSJ2 | ST-L35 | 365 | 365 | 0 | ||
| −196 | P1 | SSJ2 | ST-L4 | 388 | 388 | 0 |
| SSJ2 | ST-L7 | 356 | 356 | 0 |
Black: P1 SSJ2; Red: P2 SSJ2; Blue: P2 µ-SSJ2.
Disclaimer/Publisher’s Note: The statements, opinions and data contained in all publications are solely those of the individual author(s) and contributor(s) and not of MDPI and/or the editor(s). MDPI and/or the editor(s) disclaim responsibility for any injury to people or property resulting from any ideas, methods, instructions or products referred to in the content. |
© 2024 by the authors. Licensee MDPI, Basel, Switzerland. This article is an open access article distributed under the terms and conditions of the Creative Commons Attribution (CC BY) license (https://creativecommons.org/licenses/by/4.0/).
Share and Cite
MDPI and ACS Style
Alam, M.E.; Odette, G.R. Anisotropic Tensile Properties of a 14YWT Nanostructured Ferritic Alloy: On the Role of Cleavage Fracture. Crystals 2024, 14, 439. https://doi.org/10.3390/cryst14050439
AMA Style
Alam ME, Odette GR. Anisotropic Tensile Properties of a 14YWT Nanostructured Ferritic Alloy: On the Role of Cleavage Fracture. Crystals. 2024; 14(5):439. https://doi.org/10.3390/cryst14050439
Chicago/Turabian StyleAlam, Md Ershadul, and G. Robert Odette. 2024. "Anisotropic Tensile Properties of a 14YWT Nanostructured Ferritic Alloy: On the Role of Cleavage Fracture" Crystals 14, no. 5: 439. https://doi.org/10.3390/cryst14050439
Note that from the first issue of 2016, this journal uses article numbers instead of page numbers. See further details here.