
Bovine Serum Albumin Effect on Collapsing PNIPAM Chains in Aqueous Solutions: Spin Label and Spin Probe Study
 , , , ,
Abstract
:1. Introduction
2. Materials and Methods
2.1. Substances
2.2. PNIPAM Synthesis
2.3. SL-PNIPAM Synthesis
2.3.1. Synthesis of N-Hydroxysuccinimide [28]
2.3.2. Synthesis of N-Acryloxysuccinimide (NAS)
2.3.3. Copolymerization of NIPAM and NAS
2.3.4. TEMPO-Modification of P(NIPAM-co-NAS)
2.4. Size Exclusion Chromatography (SEC)
2.5. Solution Preparation
2.5.1. PNIPAM/BSA Solutions
2.5.2. SL-PNIPAM/BSA Solutions
2.6. Turbidimetry (Step-Wise Regime)
2.7. EPR Spectroscopy
2.8. EPR Spectra Treatment and Simulation
3. Results
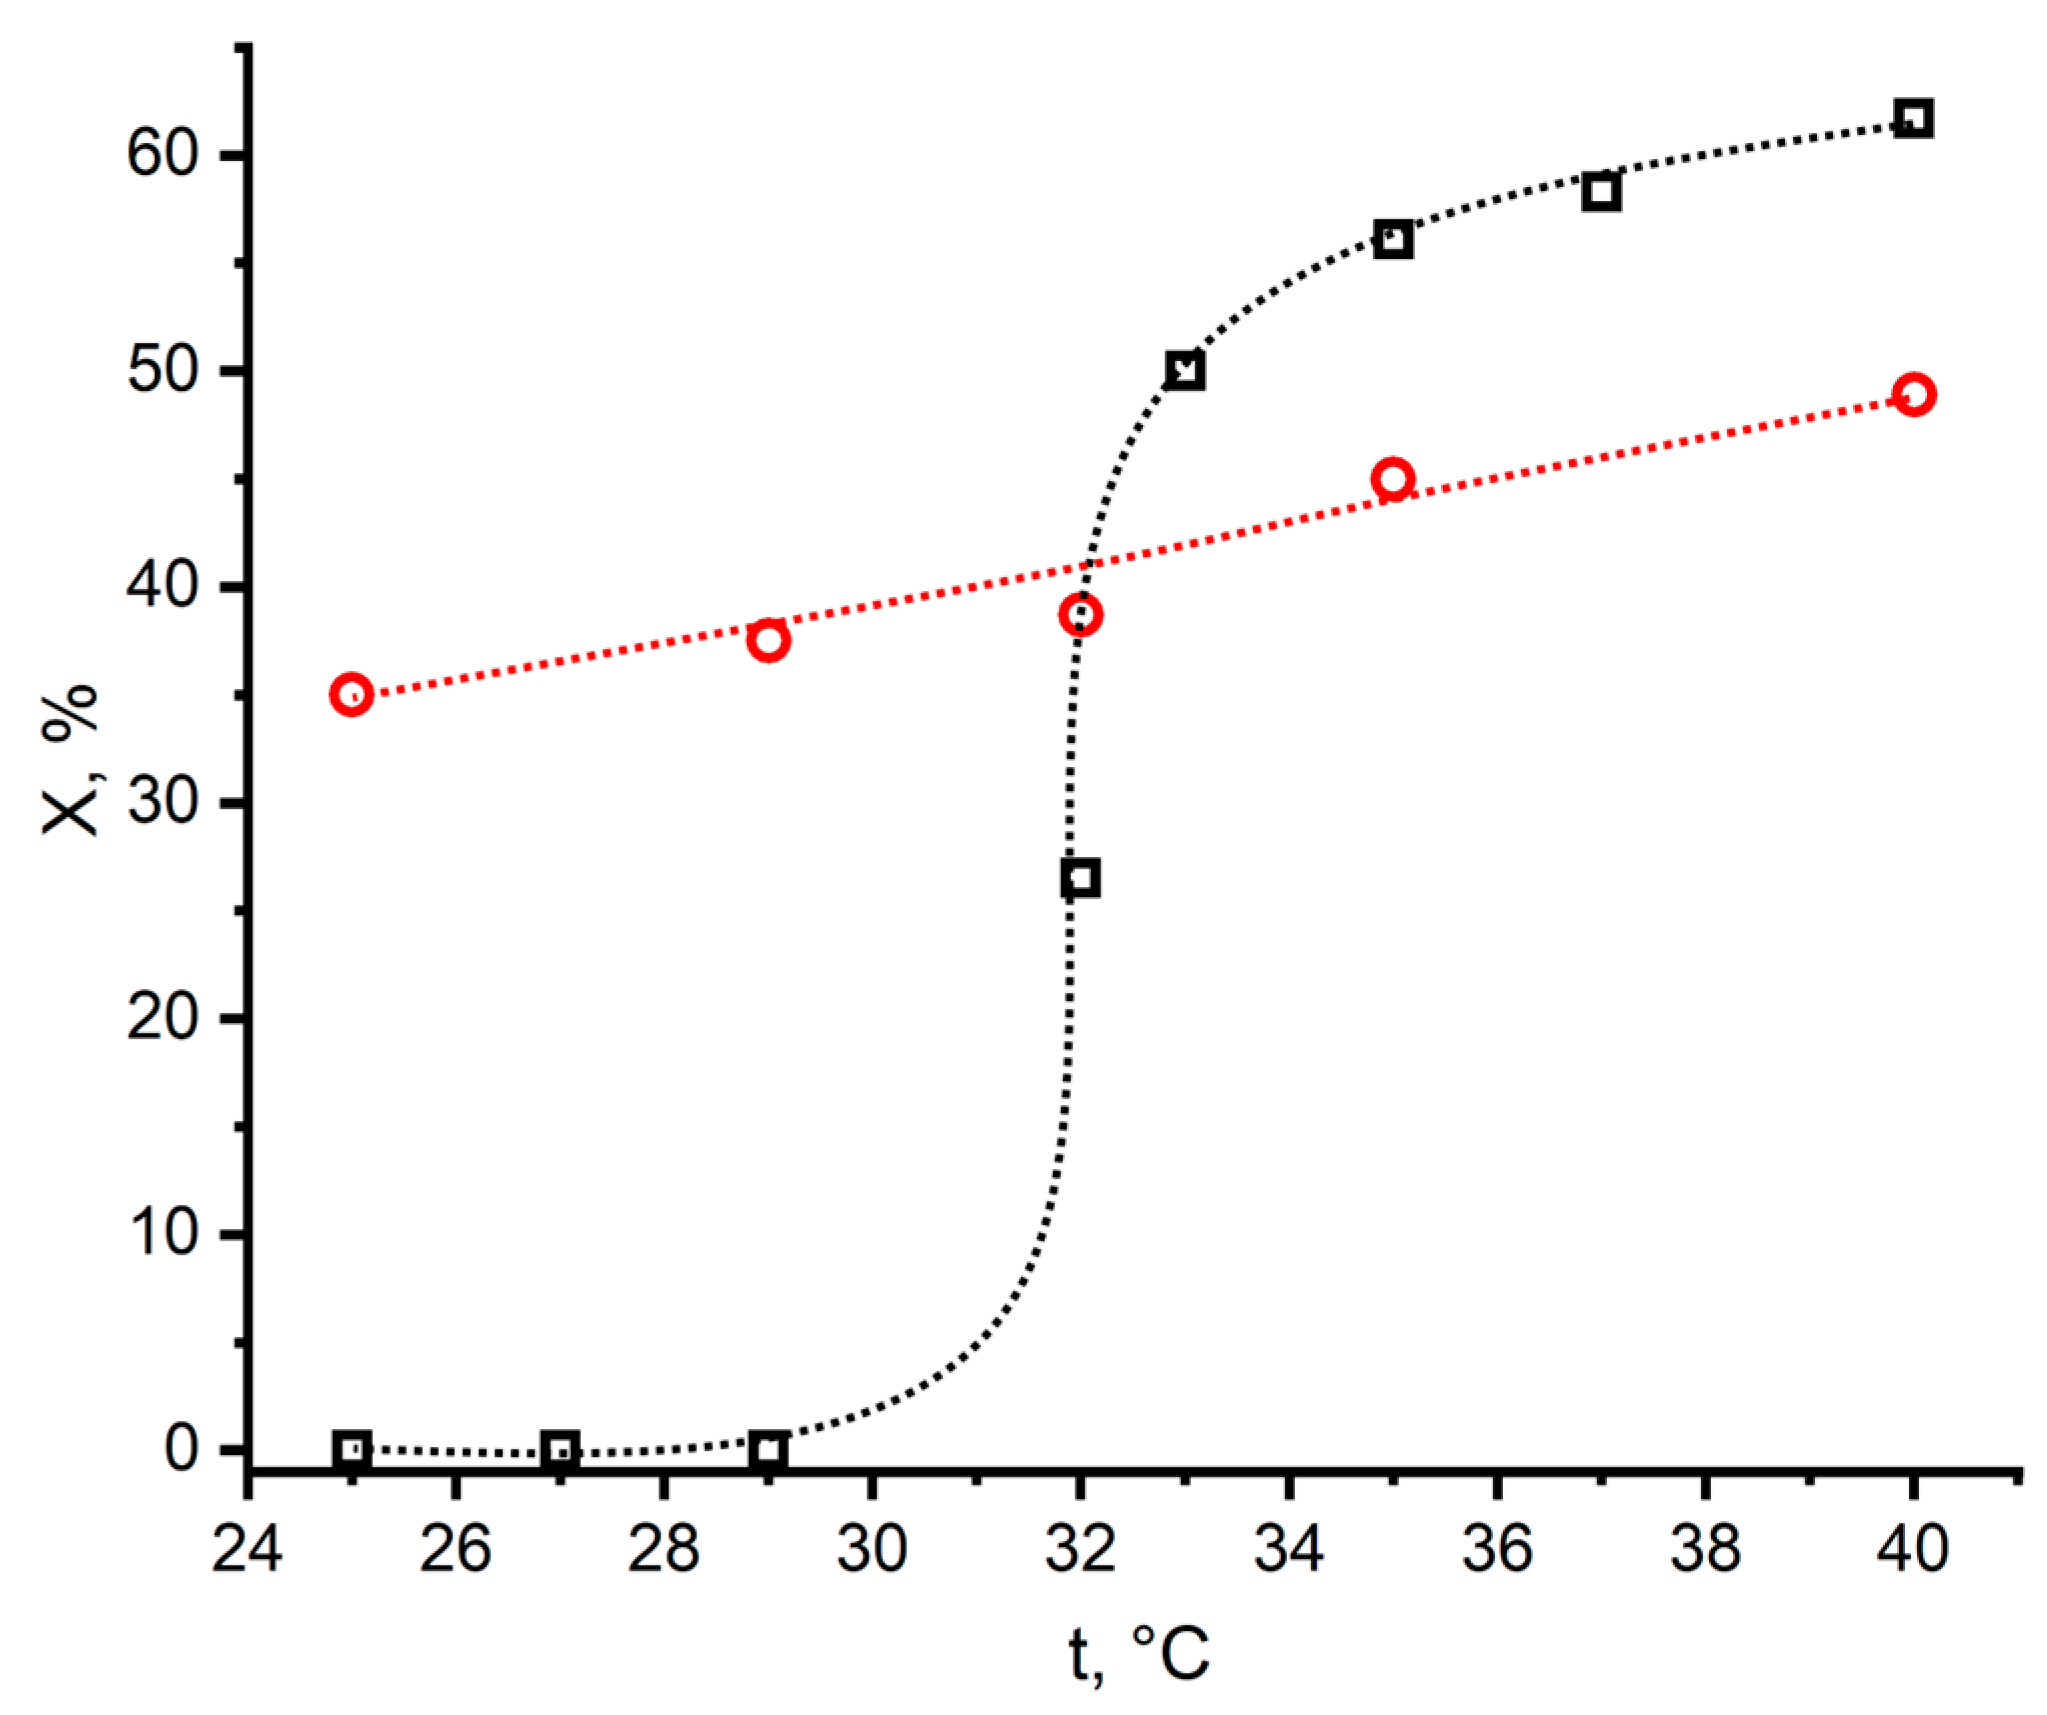
3.1. Turbidimetry
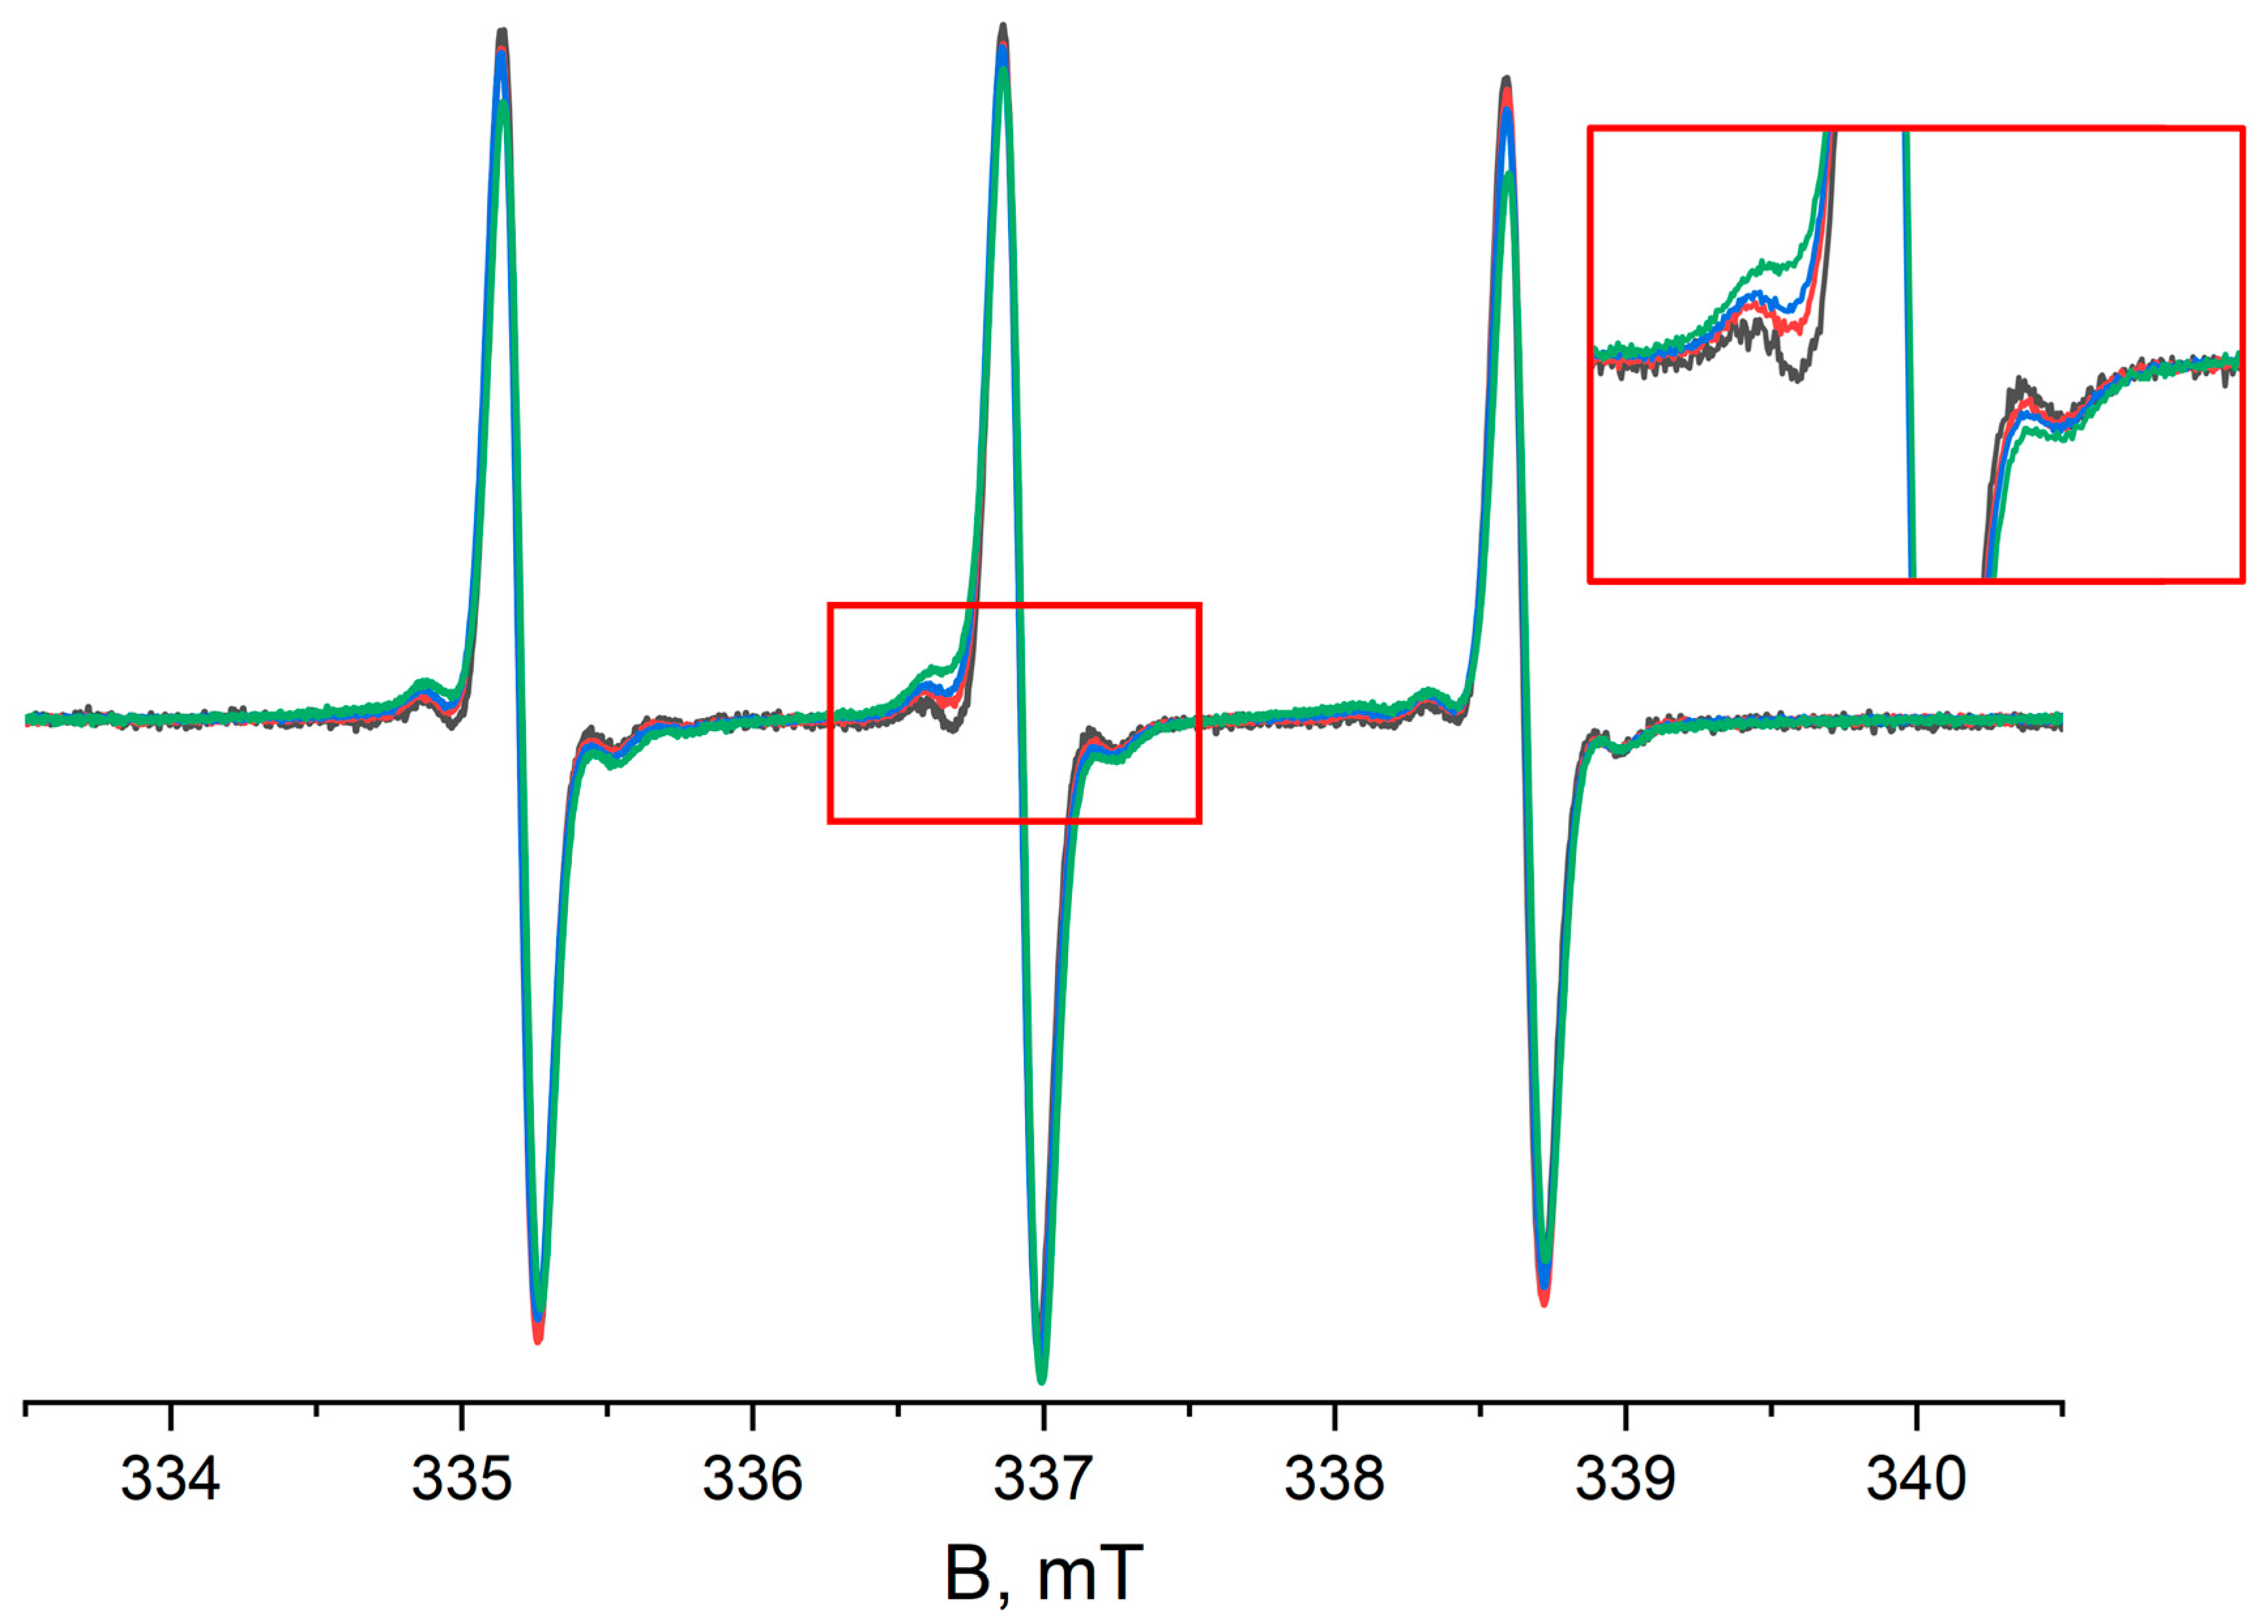
3.2. EPR Spectroscopy of SL-PNIPAM Solution
3.3. EPR Spectra of SL-PNIPAM/BSA Solutions
3.4. Spin Probe EPR
4. Discussion
5. Conclusions
- The presence of BSA in the PNIPAM aqueous solutions caused a slight decrease in the LCST and promoted polymer chain collapse in the narrow temperature region near the LCST.
- Small hydrophobic or amphiphilic molecules, e.g., drugs, may be captured by the inner cavities of BSA dimers. So, drug transport can occur not only via strong binding to proteins, but also via capturing by protein dimers.
- To predict the drug release from a PNIPAM-based drug delivery system under in vivo conditions, an estimation of the effect of BSA on drug release is necessary.
Supplementary Materials
Author Contributions
Funding
Institutional Review Board Statement
Data Availability Statement
Acknowledgments
Conflicts of Interest
Appendix A
Appendix A.1. EPR Spectra Simulation Details
Appendix A.2. SL-PNIPAM/BSA Solutions EPR Spectra

| N | w(SL-PNIPAM), wt% | w(BSA), wt% | w(PNIPAM)/w(BSA) |
|---|---|---|---|
| 1 | 10 | 0 | N/A |
| 2 | 10 | 2.5 | 4:1 |
| 3 | 5 | 2.5 | 2:1 |
| 4 | 5 | 10 | 1:2 |
References
- Teotia, A.K.; Sami, H.; Kumar, A. Thermo-Responsive Polymers. In Switchable and Responsive Surfaces and Materials for Biomedical Applications; Elsevier: Amsterdam, The Netherlands, 2015; pp. 3–43. [Google Scholar]
- Texter, J. Anion Responsive Imidazolium-Based Polymers. Macromol. Rapid Commun. 2012, 33, 1996–2014. [Google Scholar] [CrossRef] [PubMed]
- Kocak, G.; Tuncer, C.; Bütün, V. PH-Responsive Polymers. Polym. Chem. 2017, 8, 144–176. [Google Scholar] [CrossRef]
- Bertrand, O.; Gohy, J.-F. Photo-Responsive Polymers: Synthesis and Applications. Polym. Chem. 2017, 8, 52–73. [Google Scholar] [CrossRef]
- Colson, Y.L.; Grinstaff, M.W. Biologically Responsive Polymeric Nanoparticles for Drug Delivery. Adv. Mater. 2012, 24, 3878–3886. [Google Scholar] [CrossRef] [PubMed]
- Zhang, Q.; Weber, C.; Schubert, U.S.; Hoogenboom, R. Thermoresponsive Polymers with Lower Critical Solution Temperature: From Fundamental Aspects and Measuring Techniques to Recommended Turbidimetry Conditions. Mater. Horiz. 2017, 4, 109–116. [Google Scholar] [CrossRef]
- Cao, Z.-Q.; Wang, G.-J. Multi-Stimuli-Responsive Polymer Materials: Particles, Films, and Bulk Gels. Chem. Rec. 2016, 16, 1398–1435. [Google Scholar] [CrossRef] [PubMed]
- Schattling, P.; Jochum, F.D.; Theato, P. Multi-Stimuli Responsive Polymers—The All-iN-One Talents. Polym. Chem. 2014, 5, 25–36. [Google Scholar] [CrossRef]
- Magnusson, J.P.; Khan, A.; Pasparakis, G.; Saeed, A.O.; Wang, W.; Alexander, C. IoN-Sensitive “Isothermal” Responsive Polymers Prepared in Water. J. Am. Chem. Soc. 2008, 130, 10852–10853. [Google Scholar] [CrossRef] [PubMed]
- Razavi, B.; Abdollahi, A.; Roghani-Mamaqani, H.; Salami-Kalajahi, M. Light- and Temperature-Responsive Micellar Carriers Prepared by SpiropyraN-Initiated Atom Transfer Polymerization: Investigation of Photochromism Kinetics, Responsivities, and Controlled Release of Doxorubicin. Polymer 2020, 187, 122046. [Google Scholar] [CrossRef]
- Ward, M.A.; Georgiou, T.K. Thermoresponsive Polymers for Biomedical Applications. Polymers 2011, 3, 1215–1242. [Google Scholar] [CrossRef]
- Nash, M.E.; Fan, X.; Carroll, W.M.; Gorelov, A.V.; Barry, F.P.; Shaw, G.; Rochev, Y.A. Thermoresponsive Substrates Used for the Expansion of Human Mesenchymal Stem Cells and the Preservation of Immunophenotype. Stem. Cell Rev. Rep. 2013, 9, 148–157. [Google Scholar] [CrossRef]
- Cao, M.; Wang, Y.; Hu, X.; Gong, H.; Li, R.; Cox, H.; Zhang, J.; Waigh, T.A.; Xu, H.; Lu, J.R. Reversible Thermoresponsive Peptide-PNIPAM Hydrogels for Controlled Drug Delivery. Biomacromolecules 2019, 20, 3601–3610. [Google Scholar] [CrossRef]
- Doberenz, F.; Zeng, K.; Willems, C.; Zhang, K.; Groth, T. Thermoresponsive Polymers and Their Biomedical Application in Tissue Engineering—A Review. J. Mater. Chem. B 2020, 8, 607–628. [Google Scholar] [CrossRef]
- Wells, C.M.; Harris, M.; Choi, L.; Murali, V.P.; Guerra, F.D.; Jennings, J.A. Stimuli-Responsive Drug Release from Smart Polymers. J. Funct. Biomater. 2019, 10, 34. [Google Scholar] [CrossRef] [PubMed]
- Bordbar-Khiabani, A.; Gasik, M. Smart Hydrogels for Advanced Drug Delivery Systems. Int. J. Mol. Sci. 2022, 23, 3665. [Google Scholar] [CrossRef]
- Kim, H.; Witt, H.; Oswald, T.A.; Tarantola, M. Adhesion of Epithelial Cells to PNIPAm Treated Surfaces for Temperature-Controlled Cell-Sheet Harvesting. ACS Appl. Mater. Interfaces 2020, 12, 33516–33529. [Google Scholar] [CrossRef]
- Heskins, M.; Guillet, J.E. Solution Properties of Poly(N-Isopropylacrylamide). J. Macromol. Sci. Part A Chem. 1968, 2, 1441–1455. [Google Scholar] [CrossRef]
- Zhang, Y.; Furyk, S.; Bergbreiter, D.E.; Cremer, P.S. Specific Ion Effects on the Water Solubility of Macromolecules: PNIPAM and the Hofmeister Series. J. Am. Chem. Soc. 2005, 127, 14505–14510. [Google Scholar] [CrossRef]
- Pastoor, K.J.; Rice, C.V. Cation Effects on the Phase Transition of N-Isopropylacrylamide Hydrogels. Macromol. Chem. Phys. 2015, 216, 1024–1032. [Google Scholar] [CrossRef] [PubMed]
- Umapathi, R.; Kumar, K.; Rani, G.M.; Venkatesu, P. Influence of Biological Stimuli on the Phase Behaviour of a Biomedical Thermoresponsive Polymer: A Comparative Investigation of Hemeproteins. J. Colloid. Interface Sci. 2019, 541, 1–11. [Google Scholar] [CrossRef] [PubMed]
- Junk, M.J.N.; Jonas, U.; Hinderberger, D. EPR Spectroscopy Reveals Nanoinhomogeneities in the Structure and Reactivity of Thermoresponsive Hydrogels. Small 2008, 4, 1485–1493. [Google Scholar] [CrossRef] [PubMed]
- Kurzbach, D.; Junk, M.J.N.; Hinderberger, D. Nanoscale Inhomogeneities in Thermoresponsive Polymers. Macromol. Rapid Commun. 2013, 34, 119–134. [Google Scholar] [CrossRef] [PubMed]
- Kurzbach, D.; Schömer, M.; Wilms, V.S.; Frey, H.; Hinderberger, D. How Structure-Related Collapse Mechanisms Determine Nanoscale Inhomogeneities in Thermoresponsive Polymers. Macromolecules 2012, 45, 7535–7548. [Google Scholar] [CrossRef]
- Zubanova, E.M.; Kostjuk, S.V.; Timashev, P.S.; Rochev, Y.A.; Kokorin, A.I.; Melnikov, M.Y.; Golubeva, E.N. Inhomogeneities in PNIPAM Aqueous Solutions: The Inside View by Spin Probe EPR Spectroscopy. Polymers 2021, 13, 3829. [Google Scholar] [CrossRef] [PubMed]
- Zubanova, E.M.; Ivanova, T.A.; Ksendzov, E.A.; Kostjuk, S.V.; Timashev, P.S.; Melnikov, M.Y.; Golubeva, E.N. Structure and Dynamics of Inhomogeneities in Aqueous Solutions of Graft Copolymers of N-Isopropylacrylamide with Lactide (P(NIPAM-Graft-PLA)) by Spin Probe EPR Spectroscopy. Polymers 2022, 14, 4746. [Google Scholar] [CrossRef]
- Winnik, F.M.; Ottaviani, M.F.; Bossmann, S.H.; Garcia-Garibay, M.; Turro, N.J. Cononsolvency of Poly(N-Isopropylacrylamide) in Mixed Water-Methanol Solutions: A Look. at SpiN-Labeled Polymers. Macromolecules 1992, 25, 6007–6017. [Google Scholar] [CrossRef]
- Anderson, G.W.; Zimmerman, J.E.; Callahan, F.M. The Use of Esters of N-Hydroxysuccinimide in Peptide Synthesis. J. Am. Chem. Soc. 1964, 86, 1839–1842. [Google Scholar] [CrossRef]
- Kokorin, A.I. Nitroxides—Theory, Experiment and Applications; Kokorin, A., Ed.; InTech: London, UK, 2012; ISBN 978-953-51-0722-4. [Google Scholar]
- Stoll, S.; Schweiger, A. EasySpin, a Comprehensive Software Package for Spectral Simulation and Analysis in EPR. J. Magn. Reson. 2006, 178, 42–55. [Google Scholar] [CrossRef] [PubMed]
- Schneider, D.J.; Freed, J.H. Calculating Slow Motional Magnetic Resonance Spectra. In Spin Labeling: Theory and Applications; Springer: Boston, MA, USA, 1989; pp. 1–76. [Google Scholar]
- Budil, D.E.; Lee, S.; Saxena, S.; Freed, J.H. Nonlinear-Least-Squares Analysis of Slow-Motion EPR Spectra in One and Two Dimensions Using a Modified Levenberg–Marquardt Algorithm. J. Magn. Reson. A 1996, 120, 155–189. [Google Scholar] [CrossRef]
- Francis, G.L. Albumin and Mammalian Cell Culture: Implications for Biotechnology Applications. Cytotechnology 2010, 62, 1–16. [Google Scholar] [CrossRef]
- Winnik, F.M.; Ottaviani, M.F.; Bossmann, S.H.; Pan, W.; Garcia-Garibay, M.; Turro, N.J. Cononsolvency of Poly(N-Isopropylacrylamide): A Look at SpiN-Labeled Polymers in Mixtures of Water and Tetrahydrofuran. Macromolecules 1993, 26, 4577–4585. [Google Scholar] [CrossRef]
- Hinderberger, D. EPR Spectroscopy in Polymer Science. Top. Curr. Chem. 2012, 321, 67–90. [Google Scholar] [CrossRef]
- Caragheorgheopol, A.; Schlick, S. Hydration in the Various Phases of the Triblock Copolymers EO13PO30EO13 (Pluronic L64) and EO6PO34EO6 (Pluronic L62), Based on Electron Spin Resonance Spectra of Cationic Spin Probes. Macromolecules 1998, 31, 7736–7745. [Google Scholar] [CrossRef]
- Maeda, Y. IR Spectroscopic Study on the Hydration and the Phase Transition of Poly(Vinyl Methyl Ether) in Water. Langmuir 2001, 17, 1737–1742. [Google Scholar] [CrossRef]
- Akdogan, Y.; Emrullahoglu, M.; Tatlidil, D.; Ucuncu, M.; CakaN-Akdogan, G. EPR Studies of Intermolecular Interactions and Competitive Binding of Drugs in a Drug–BSA Binding Model. Phys. Chem. Chem. Phys. 2016, 18, 22531–22539. [Google Scholar] [CrossRef] [PubMed]
- Levi, V.; González Flecha, F.L. Reversible Fast-Dimerization of Bovine Serum Albumin Detected by Fluorescence Resonance Energy Transfer. Biochim. Biophys. Acta (BBA)—Proteins Proteom. 2002, 1599, 141–148. [Google Scholar] [CrossRef]
- Molodenskiy, D.; Shirshin, E.; Tikhonova, T.; Gruzinov, A.; Peters, G.; Spinozzi, F. Thermally Induced Conformational Changes and Protein–Protein Interactions of Bovine Serum Albumin in Aqueous Solution under Different PH and Ionic Strengths as Revealed by SAXS Measurements. Phys. Chem. Chem. Phys. 2017, 19, 17143–17155. [Google Scholar] [CrossRef] [PubMed]
- Chubarov, A.; Spitsyna, A.; Krumkacheva, O.; Mitin, D.; Suvorov, D.; Tormyshev, V.; Fedin, M.; Bowman, M.K.; Bagryanskaya, E. Reversible Dimerization of Human Serum Albumin. Molecules 2021, 26, 108. [Google Scholar] [CrossRef]
- Bujacz, A. Crystal Structure of Bovine Serum Albumin. 2012. Available online: https://www.wwpdb.org/pdb?id=pdb_00004f5s (accessed on 25 March 2024).
- Bujacz, A. Structures of Bovine, Equine and Leporine Serum Albumin. Acta Crystallogr. D Biol. Crystallogr. 2012, 68, 1278–1289. [Google Scholar] [CrossRef]
- Berliner, L.J. Refinement and Location of the Hydrogen Atoms in the Nitroxide 2,2,6,6-Tetramethyl-4-Piperidinol-1-Oxyl. Acta Crystallogr. B 1970, 26, 1198–1202. [Google Scholar] [CrossRef]
- Ottaviani, M.F.; Garcia-Garibay, M.; Turro, N.J. TEMPO Radicals as EPR Probes to Monitor the Adsorption of Different Species into X Zeolite. Colloids Surf. A Physicochem. Eng. Asp. 1993, 72, 321–332. [Google Scholar] [CrossRef]
- Stoll, S. Computational Modeling and Least-Squares Fitting of EPR Spectra. In Multifrequency Electron Paramagnetic Resonance; Wiley: Hoboken, NJ, USA, 2014; pp. 69–138. [Google Scholar]
- Gordon Cameron, G.; Stewart, D. Liquid Polyether Electrolytes—A SpiN-Probe Study. Eur. Polym. J. 1993, 29, 245–248. [Google Scholar] [CrossRef]
- Bogdanov, A.V.; Vorobiev, A.K. Orientation Order and Rotation Mobility of Nitroxide Biradicals Determined by Quantitative Simulation of EPR Spectra. Phys. Chem. Chem. Phys. 2016, 18, 31144–31153. [Google Scholar] [CrossRef] [PubMed]


| Type | t, °C | aiso, mT | tx, ns | ty, ns | tz, ns | tiso, ns | x, % |
|---|---|---|---|---|---|---|---|
| 10 wt% SL-PNIPAM | |||||||
| A | 25 | 1.71 | 8.8 | 0.7 | 0.7 | 1.6 | |
| B | 40 | 1.67 | 9.2 | 100.0 | 9.7 | 20.7 | |
| C | 40 | 1.72 | 0.015 | 0.015 | 0.015 | 0.015 | |
| TEMPO/1 wt% PNIPAM | |||||||
| D | 40 | 1.73 | 0.01 | 0.01 | 0.01 | 0.01 | |
| E1 | 40 | 1.60 | 17.8 | 0.3 | 1.8 | 2.1 | 25% |
| TEMPO/10 wt% BSA | |||||||
| D | 25 | 1.73 | 0.01 | 0.01 | 0.01 | 0.01 | |
| E2 | 25 | 1.68 | 20.0 | 0.3 | 2.5 | 2.5 | 50% |
| TEMPO/10 wt% PNIPAM + 10 wt% BSA | |||||||
| D | 25 | 1.73 | 0.01 | 0.01 | 0.01 | 0.01 | |
| E3 * | 25 | 1.60 | 50 | 0.4 | 2.7 | 3.8 | 66% |
Disclaimer/Publisher’s Note: The statements, opinions and data contained in all publications are solely those of the individual author(s) and contributor(s) and not of MDPI and/or the editor(s). MDPI and/or the editor(s) disclaim responsibility for any injury to people or property resulting from any ideas, methods, instructions or products referred to in the content. |
© 2024 by the authors. Licensee MDPI, Basel, Switzerland. This article is an open access article distributed under the terms and conditions of the Creative Commons Attribution (CC BY) license (https://creativecommons.org/licenses/by/4.0/).
Share and Cite
Simenido, G.A.; Zubanova, E.M.; Ksendzov, E.A.; Kostjuk, S.V.; Timashev, P.S.; Golubeva, E.N. Bovine Serum Albumin Effect on Collapsing PNIPAM Chains in Aqueous Solutions: Spin Label and Spin Probe Study. Polymers 2024, 16, 1335. https://doi.org/10.3390/polym16101335
Simenido GA, Zubanova EM, Ksendzov EA, Kostjuk SV, Timashev PS, Golubeva EN. Bovine Serum Albumin Effect on Collapsing PNIPAM Chains in Aqueous Solutions: Spin Label and Spin Probe Study. Polymers. 2024; 16(10):1335. https://doi.org/10.3390/polym16101335
Chicago/Turabian StyleSimenido, Georgii A., Ekaterina M. Zubanova, Evgenii A. Ksendzov, Sergei V. Kostjuk, Peter S. Timashev, and Elena N. Golubeva. 2024. "Bovine Serum Albumin Effect on Collapsing PNIPAM Chains in Aqueous Solutions: Spin Label and Spin Probe Study" Polymers 16, no. 10: 1335. https://doi.org/10.3390/polym16101335