
Overheating in the Tree Shade of Urban Parks: A Field Study of Thermal Adaption in China


1
School of Civil and Architectural Engineering, Anyang Institute of Technology, Anyang 455000, China
2
School of Housing, Building and Planning, University Sains Malaysia, Penang 11800, Malaysia
*
Author to whom correspondence should be addressed.
Atmosphere 2024, 15(5), 575; https://doi.org/10.3390/atmos15050575
Submission received: 1 April 2024
/
Revised: 29 April 2024
/
Accepted: 4 May 2024
/
Published: 8 May 2024
(This article belongs to the Section Biometeorology)
Abstract
:With increased atmospheric temperature, temperatures in the shade of trees in parks also increase, and people are faced with high temperature challenges. In this study, thermal comfort in the shade of the trees of an urban park during summer in China was assessed. The subjective responses of the respondents were recorded via questionnaires, and environment parameters were measured. The results show that the air temperature in the shade was 31.1 ± 3.0 °C during the day, and that it peaked at 36.9 °C; the globe temperature was 31.3 ± 3.1 °C, and it peaked at 40.1 ℃. Respondents’ clothing insulation was 0.31 ± 0.08 clo, and the effect of clothing adjustment on thermal adaptation was limited. Thermal sensation is linearly related to standard effective temperature (SET), and the upper limit of 80% acceptable SET was 32.1 °C. At different temperature values, the proportion of expected airflow enhancement exceeded 50%. The respondents preferred a neutral-warm sensation. Moreover, there was an obvious thermal adaptation, with thermal history and psychological adaptation being the main factors affecting thermal comfort. This study confirmed the value of shade and provided us with guidance for park planning and design.
1. Introduction
Global greenhouse gas concentrations are rising annually, with a significant acceleration in ocean warming and a continued global warming trend. Analysis of the China Meteorological Administration’s global surface temperature dataset indicates that the global average temperature in 2022 was 1.13 °C above pre-industrial levels, marking it as the sixth highest value since recording began in 1850. Furthermore, the average surface temperature in China in 2022 exceeded the normal value by 0.92 °C, ranking it among the top three warmest years since the early 20th century [1]. Urban parks, as critical green spaces within cities, play an essential role in maintaining urban ecological balance, improving the urban thermal environment [2], mitigating urban heat island effects [3], and improving habitats.
1.1. Cooling Effect of Urban Parks in Summer
Urban parks, a category of urban green spaces [4], serve ecological functions such as climate regulation, air purification, and biodiversity maintenance. Additionally, they fulfill a social service, in that they provide spaces for including leisure, fitness, parent–child activities, and social interaction. They are primary venues for public recreation. During warmer seasons, substantial vegetation cover can significantly lower park air temperatures [5], improving the environment for public visitation. In well-established parks in particular, tall and leafy trees provide ample shade, enhancing the public’s comfort and increasing park use. Numerous studies have confirmed that parks are cooler than their surroundings, evidencing a cooling effect on the environment [6,7]. The temperature was lower 0.2–2.6 °C in summer [8], approximately 1.7 °C than adjacent areas [9], and with a maximum midday temperature difference reaching 4.8 °C and a cooling effect extending up to 1.4 km [5]. Urban greening can reduce air temperature by up to 4 °C and mean radiant temperature by up to 4.5 °C [3]. Of course, the cooling efficiency of variable greenery coverage ratios in different urban densities is different [10].
Within a park, temperatures in tree-shaded areas are lower compared to non-shaded areas. In a park in Chengdu in summer, air temperatures beneath well-shaded trees (27.8 °C) were significantly cooler than in the open, unshaded areas (30.3 °C) [11]. Critical thermal points within these parks underscore the importance of shade—particularly its volume and continuity along paths [12].
Parks exert a cooling effect mainly because trees provide shade, reduce solar and terrestrial radiation, lower air temperatures through enhanced leaf evapotranspiration, improve microclimates, and significantly enhance thermal comfort in outdoor spaces [13]. While extensive shading and vegetation cover can mitigate heat stress, their effectiveness is likely to decrease with continued climate warming [14]. During summer, Yan’s study of a city park in Beijing recorded air temperatures around 34 °C at 2:00 p.m., indicating high heat levels [5].
1.2. Thermal Adaptation in Urban Parks
Green infrastructure significantly enhances perceived thermal comfort [15]. Urban parks play a key role in providing comfort to their citizens from a physical and psychological perspective [16]. Given the favorable thermal and landscape environments of urban parks, they are highly valued by citizens for daily physical activities, recreation, excursions, and socialization, making them key outdoor recreation destinations for urban dwellers. However, climatic conditions and thermal comfort significantly influence urban park attendance, particularly during the hot summer months [17]. Air temperature is the primary determinant of urban park visitation, and lower temperatures had a more elastic effect on visitation than higher temperatures [18]. Temperatures exceeding 33 °C in summer and 29 °C in spring and fall in Canada cause overheating, negatively affecting park visitation [19]. To meet outdoor activities, citizens was even willing to pay for heat-resilient infrastructure [20].
Additionally, thermal conditions significantly influence the distribution of visitors, particularly in areas designed for prolonged stays and high-intensity activities [21]. During summer, increased tree coverage or shaded areas enhance outdoor environments, improving thermal comfort and acceptability [22]. Based on thermal perception, shaded areas in a South Korean park registered two levels lower in physiological equivalent temperature than sunny areas [23]. In a survey of thermal comfort across Seoul, South Korea, 60.3% of respondents felt hot in central business district areas during summer, compared to 23.8% in urban forests, and 31.1% reported feeling comfortable in central business district areas, versus 79.3% in urban forests [24].
Visitor zoning in parks reflects active adaptation strategies. An important premise of adaptation is that the person is no longer simply a passive recipient of the given thermal environment but instead is an active agent interacting with and adjusting to the person–environment system via multiple feedback loops [25]. In the context of thermal comfort, this may involve all the processes that people go through to improve the fit between the environment and their requirements [26]. Human perception of the thermal environment is a complex process that involves not only physical heat transfer but also the physiological and psychological adjustment mechanism of the human body. Brager and de Dear clearly divide adaptation into three types: behavioral adjustment, physiological acclimation, and psychological adaptation [27]. Behavioral adjustment includes all modifications a person might consciously, or unconsciously make, including personal adjustment, technical or environmental adjustment, and cultural adjustment.
When temperatures become too high, people tend to move out of direct sunlight and into the shade [17], as a kind of personal adjustment. The proportion of people seeking shade increases with the average radiant temperature. In addition, outdoor thermal perception and thermal adaptation are also affected by individual or psychological factors, encompassing thermal history, expectations, and activity purposes [28,29]. Among non-thermal factors, socioeconomic factors significantly influence outdoor thermal perception [30] through varying urban park designs because of the differing economic development levels of cities. Variation in urban residents’ living habits also affects park use patterns, thereby influencing the assessment of thermal comfort in parks.
1.3. Study Aim
With most research having focused on megacities [31,32] and provincial capitals [11,33], little is known about the thermal comfort of citizens in prefecture-level cities [34]. Thermal adaptation theory suggests that these disparities could influence peoples’ thermal comfort. Additionally, previous research has focused on thermal comfort in outdoor spaces or urban parks, but studies focusing on thermal comfort and acclimatization in the shade of trees, particularly regarding high-temperature conditions, are few in number [31]. High-temperature conditions here refers to the condition that the ambient temperature exceeds the thermal comfort temperature range of the human body and may cause adverse effects on it. In Chinese meteorology, high temperature generally refers to when the daily maximum temperature reaches or exceeds 35 °C.
Therefore, this study involved the conducting of a seven-day thermal comfort field study of the shaded areas in People’s Park, Anyang City, central China, in order to obtain the parameters of environments and people’s responses, as well as to identify the characteristics of people’s thermal responses and their neutral, preferred, and acceptable temperatures. These findings will provide guidelines for urban park planning and landscape design, as well as for sustainable urban development.
2. Methods
2.1. Location of Study
The field study was conducted in People’s Park, Anyang City, central China (Figure 1), established in 1955. The park covers an area of 18.2 hectares and is surrounded by low-rise residential areas with low density. The tall trees in the park are mainly Platanus acerifolia Willd, which are large deciduous trees, with a maximum diameter at breast height of 80 cm, a height of more than 30 m, and luxuriant branches and leaves. In addition, there are privet, pine, cypress, willow, Prunus lannesiana, and so on. In summer, people are provided a good shading environment and a comfortable thermal environment. Grassland and hard pavement are mainly found under the trees, and the survey objects were mainly people on the hard pavement.
Anyang is a prefecture-level city within China’s administrative hierarchy, with an urban area that is home to 1.5 million permanent residents. The city experiences a continental monsoon climate characterized by four distinct seasons, including hot summers. Annual mean temperatures vary from 12.7 °C to 13.7 °C, peaking during June–August (Figure 2), with relative humidity levels of 53.7% (June), 71.6% (July), and 77.2% (August). Prevailing winds are southerly in spring, summer, and fall, shifting to northerly in winter, with average annual wind speeds range from 1.7 to 3.5 m/s [35].
2.2. Time of Survey
According to the typical annual meteorological data of Anyang, this study was performed from 27 June 2023 to 5 July 2023—a time and duration chosen to precisely assess the thermal comfort and adaptation of citizens under high temperature in a hot summer climate.
Given the extreme summer heat, especially during midday with fewer visitors, and to ensure the health and safety of the research team, data collection was conducted from 6:00 a.m. to 11:00 a.m. and from 3:00 p.m. to 6:00 p.m.
2.3. Respondents
Respondents were selected on a random basis, mainly those who were under the shade of the trees, without deliberately fixing their age and gender, etc. Sample statistics, presented in Table 1, reveal that respondents aged between 50 and 79 years constituted a significant majority, approximately 72.2% of park users, highlighting the elderly as the park’s primary demographic. These findings align with those reported in Lai’s study [32].
2.4. Field Survey Methods
2.4.1. Microclimate Measurement
Four primary thermal environment parameters impacting human thermal comfort were measured: air temperature (Ta), global temperature (Tg), air velocity (Va), and relative humidity (RH). The principal instrument utilized for measurement was the HD32.3 (Delta Ohm), selected for its compliance with the range and accuracy requirements of the ISO 7726 standard [36], as shown in Table 2. Measurement points were positioned in accordance with ASHRAE 55 standards [37], ensuring proximity to the respondent. The instrument was positioned at a height of 0.6 m for seated respondents and 1.1 m for those standing. Prior to interviewing respondents, the measuring instrument was activated approximately 20 min in advance to ensure stability.
2.4.2. Questionnaire
The questionnaire was divided into two sections: The first section collected personal information, such as gender, age, height, weight, and clothing types, as well as activity status within the 20 min prior to the interview and at that time. Detailed records of respondents’ clothing were taken to estimate ensemble insulation based on the ASHRAE Standard 55, and metabolic rates were assessed from activities conducted 20 min before the survey.
The second section focused on psychological responses, encompassing sensations of heat and humidity, wind, thermal comfort and acceptability, and expectations regarding heat and airflow. Given the study’s timing during the hot summer months, thermal sensations were gauged using an extended nine-point scale of ISO 15001 (ISO, 2002) [38], ranging from “very cold” to “very hot”. Figure 3 presents the psychological response questionnaire’s format and scale. It employs a breakpoint scale where participants mark their current sensations, with investigators available to assist those who find the questionnaire challenging. The total sample size recovered from this questionnaire was 589, and 557 were valid questionnaires.
2.4.3. Investigation Process
The field survey was completed by volunteers, who were college students. After the volunteers came to the park, they first selected the shade area of trees to test the thermal environment before officially starting the questionnaire, with the record interval of 5 s (Figure 4a). The location was generally under a tree or around a tree, and the location was adjusted in time according to the sunshine to ensure that the instrument was in the shade. Then, the volunteers began to look for the respondents who were in the shade to take the thermal comfort questionnaire and test the thermal environment parameters (Figure 4b). In order to avoid the influence of thermal history or activities in the previous stage, the questionnaire was not filled out for the respondents who had just entered the shade.
2.5. Data Process and Analysis
Due to a large amount of field data being collected, in order to reduce the impact of few extremes and better represent the majority, the “bin” and “weighted” methods were used for data analysis, i.e., the data were divided into bins by operative temperature in 0.5 °C steps, the values of the variables were averaged for each bin, and the averages were analyzed by their weighted sample size.
SET (standard effective temperature) integrates the effects of air temperature, relative humidity, mean radiant temperature, air velocity, and clothing insulation, and it is also used for indoor and outdoor thermal environment evaluation. Referring to the literature [39,40,41,42], SET was also used as the thermal environment evaluation index. In addition, the PMV-PPD model was used for thermal comfort evaluation.
Linear regression was adopted to derive the relationship between thermal sensation, humidity sensation, percentage dissatisfied, and SET. Polynomial regression was used to analyze the relationship between the percentage of dissatisfaction and thermal sensation.
All the statistical analyses were conducted with SPSS v 22.0 software (IBM, New York, NY, USA), and all the differences were accepted as significant at a 0.05 level.
3. Results
3.1. Physical Environments
Air temperature in the shade of trees throughout the survey period are illustrated in Figure 5. It was revealed that air temperatures sometimes exceeded 35 °C, indicating high heat conditions. Early morning temperatures at approximately 6 am were notably lower. Daytime air temperatures in the shade averaged 31.1 ± 3.0 °C, peaking at 36.9 °C. Similarly, the black globe temperature averaged 31.3 ± 3.1 °C and peaked at 40.1 °C. The maximum recorded radiant temperature was 57.1 °C. Relative humidity averaged 55.3% ± 19.0%, and air velocity averaged 0.40 ± 0.36 m/s.
3.2. Clothing Insulation
During summer, typical clothing included lightweight, short-sleeved tops; shorts; and sandals, as depicted in Figure 6, which present clothing insulation values. Despite variable air temperature, the clothing insulation (clo) remained relatively constant, slightly higher than 0.3 clo, averaging at 0.31 ± 0.08 clo. These data suggest that there were minimal adjustments in clothing to achieve thermal comfort were minimal.
3.3. Subjective Responses
3.3.1. Thermal Sensation
Linear regression analysis was performed to determine relationships between thermal sensation vote (TSV) and SET (Figure 7). A significant linear correlation existed, with TSV increasing alongside SET. The regression equations were obtained as
TSV = 0.137SET − 1.672 (R2 = 0.525)
This equation suggests a thermal sensitivity of 0.137 °C−1 among the respondents, meaning thermal sensation escalated by 0.137 units for every 1 °C rise in SET.
3.3.2. Humidity Sensation
Linear regression was used to explore relationships between humidity sensation vote (HSV) and relative humidity (RH), as illustrated in Figure 8. A positive linear correlation was found, indicating that HSV increased as RH rose. The regression equations were obtained as
HSV = 0.027RH − 1.467 (R2 = 0.867)
According to this equation, the neutral point for humidity sensation—where respondents neither feel dry nor wet—was at RH of 54.3%.
3.3.3. Thermal Comfort
For thermal comfort votes, 48.8% of respondents reported being comfortable, 34.3% slightly uncomfortable, 10.7% uncomfortable, 2.1% very uncomfortable, and 3.6% reported no discomfort. Reclassifying “slightly uncomfortable” votes to “comfortable” elevated the overall thermal comfort level to 83.1%. Although it was a hot summer, the majority reported a high level of comfort. Segmentation into 0.5 °C temperature increments (Figure 9) revealed a higher proportion of comfort at lower temperatures, with discomfort rates increasing at higher temperatures.
3.3.4. Percentage Dissatisfied
The percentage dissatisfied was the percentage of respondents who reported a negative thermal acceptability vote. For each temperature band, votes indicating thermal acceptability below 0 were tallied to calculate the percentage dissatisfied of the total vote count. A significant correlation existed between percentage dissatisfied (PD) and SET (Figure 10). This relationship indicates that the percentage dissatisfied escalates with an increase in SET. The regression equations were obtained as
PD = 1.585SET − 30.95 (R2 = 0.245)
Based on Equation (3), a SET value of 32.1 °C corresponds to an 80% acceptability rate, while a SET of 25.8 °C aligns with a 90% acceptability rate.
3.3.5. Thermal Preference
Respondent expectations for temperature adjustments (“warmer”, “cooler”, and “no change”) across various temperature bands, in increments of 0.5 °C, are depicted in Figure 11. Notably, most respondents preferred a decrease in temperature throughout the study, with over 50% preferring cooler conditions even at 21 °C. This preference intensified at higher temperatures, where the preference for lower temperatures exceeded 70% when the SET exceeded 27 °C.
3.3.6. Airflow Preference
In a similar way to the thermal preference, the changes of airflow preference with SET were analyzed, as shown in Figure 12. It can be seen that a consistent preference for more airflow existed across all temperature ranges, with a unanimous 100% of respondents preferring more airflow when the SET exceeded 35.5 °C. Expectations for less airflow were minimal throughout the study, indicating a preference for more airflow in hot conditions.
4. Discussion
4.1. Comparison with Other Studies (Summer, SET Index)
Summer outdoor thermal comfort survey results, using the SET index across various climate zones, are presented in Table 3. Contrasts reveal that in colder climate zones, both the thermal neutral and acceptable upper temperature limits were higher than in warmer regions. This finding diverges from the literature [43], where thermal neutral and comfort temperatures were higher in hot and humid regions compared with mild regions. Thermal history, a psychological factor that affects thermal comfort [27], could account for these differences because thermal history affects thermal sensation [44], with a warmer thermal history in warm seasons producing a higher neutral temperature and, a lower thermal sensitivity. These results strongly support the results of the literature [43], but they do not strongly support the results of this study.
In fact, thermal history includes both indoor and outdoor thermal history. While outdoor history is largely climate-driven, indoor history relates to the building type [45,46], air-conditioning usage, and duration of use. Zhang’s research [46] found that respondents who use centralized central air-conditioning extensively have lower thermal neutral temperatures and narrower ranges of acceptable temperatures than those who use split air-conditioning less frequently.
In hot summer and cold winter and in hot summer and warm winter areas, summer climates are hot and humid, temperature differences between morning and evening are small, the use time of air-conditioning is prolonged, and the indoor thermal environment temperature is relatively low. This leads to the low thermal neutral temperature and a low upper limit of thermal acceptable temperature. Moreover, the respondents in this study were primarily older, spend more time outdoors, and are greatly affected by the outdoor climate; respondents in other studies have mainly been college students who spend more time indoors and are greatly affected by the indoor thermal environment and thermal history. Differences in outdoor and indoor climate temperatures may explain the differences between our results and those of other studies (Table 3).
4.2. Thermal Adaptaion
The PMV-PPD model was based on the heat balance of the human body, which assumes that thermal sensation is only affected by four environmental parameters (air temperature, mean radiation temperature, air velocity, and relative humidity) and two individual parameters (clothing thermal resistance and metabolic rate), and it does not consider the influence of cultural background, climatic conditions, and social conditions [47]. By comparing with the actual thermal perception, the existence of thermal adaptation can be clarified, and the non-thermal factors affecting thermal adaptation can be explored.
The “actual thermal sensation–percentage dissatisfied” curve and “predicted mean vote–predicted percentage dissatisfied (PMV-PPD)” curve are presented in Figure 13. From this figure, it is evident that the thermal sensation with the highest thermal acceptability was 1, suggesting that respondents are more receptive to the thermal sensation of a neutral-warmer.
The acceptable range of 20% significantly exceeded the PMV-PPD value, indicating that respondents had adapted to the environment. Thermal adaptation involves three main aspects: behavioral regulation, physiological adaptation, and psychological adaptation. Behavioral regulation, critical for maintaining body temperature and thermal balance, involves self-regulation through actions such as changing posture, adjusting clothing, and modifying activity levels. In this study, the movement of respondents from hotter to cooler areas exemplifies behavioral regulation.
Summer clothing is consistently light, suggesting minimal impact of clothing regulation on thermal adaptation (Figure 6). Consequently, psychological adaptation, notably influenced by expectations, is an important factor. Expectations, shaped by past thermal and non-thermal experiences, contribute to this phenomenon. Fanger [48] noted that the variance between actual thermal sensations and PMV can be attributed to differing expectations among populations, introducing an expectation factor for naturally ventilated buildings in warm climates. Similarly, outdoor environments follow this pattern. During summer, when individuals intentionally venture outdoors to, for example, visit a park, they come with preformed expectations of a hot climate, thereby lowering their expectation of comfort. These outings, driven by the desire to socialize or be active, reflect adaptive behavior. Luo [49] introduced a “demand factor” to account for deviations in PPD values.
In summary, multiple factors ultimately lead to a higher acceptability of the thermal environment.
4.3. Study Limitations
This study examined thermal comfort and adaptation in shaded hot environments. However, the predominance of older respondents in our survey limits our ability to generalize across all demographics. Our sample size and survey times were constrained because of the hot climate.
Given the complexity of outdoor environments, encompassing factors like climatic conditions and perceived control, there is a pressing need for more comprehensive research, including quantitative studies, on outdoor psychological adaptation.
5. Conclusions
This study focused on the thermal comfort of persons in shaded outdoor areas, specifically at the People’s Park, Anyang, a city in central China. By way of a field survey during summer high temperatures, it aimed to determine the thermal comfort characteristics of urban citizens in this region. The research involved collecting data on physical environmental parameters and respondents’ psychological responses. Key findings include:
- (1)
- Despite the mitigating effect of tree shade on the thermal environment, daytime air temperatures in the shade averaged 31.1 °C (± 3.0 °C) and peaked at 36.9 °C, and black globe temperatures averaged 31.3 °C (± 3.1 °C) and peaked at 40.1 °C.
- (2)
- The clothing insulation of respondents averaged 0.31 clo (± 0.08 clo), indicating that clothing adjustments minimally affected thermal adaptation.
- (3)
- A linear relationship existed between thermal sensation and SET, with a neutral sensation (neither dry nor wet) at 54.3% RH. We report a high thermal comfort percentage (83.1%), a SET value for 80% acceptance of 32.1 °C, and 90% acceptance of 25.8 °C.
- (4)
- More than 50% of respondents preferred more airflow at varying temperatures, indicating a general preference for increased airflow in hot weather conditions.
- (5)
- Thermal acceptability was the greatest when the thermal sensation was 1, indicating that respondents preferred neutral-warm.
- (6)
- This study noted significant thermal adaptation compared with other studies that have examined regional summer outdoor thermal comfort and the PMV-PPD. The tolerable temperature upper limit was higher in this study population, mainly because of psychological factors like thermal history and expectations of indoor climates.
Based on the outcomes of these studies, the outdoor thermal comfort and thermal adaptation of individuals should be studied across diverse climatic regions and cultural backgrounds. Insights garnered from this research facilitate the configuration of trees in parks to enhance thermal comfort, thereby catering to the recreational and leisure needs of the public.
Author Contributions
Conceptualization, writing, Z.Z.; investigation, D.Z.; review and editing, Y.W. All authors have read and agreed to the published version of the manuscript.
Funding
This research was funded by the Science and Technology Planning Project of Anyang, Henan Province, China, grant number 2023C01SF143.
Institutional Review Board Statement
Not applicable.
Informed Consent Statement
Informed consent was obtained from all subjects involved in the study.
Data Availability Statement
The data presented in this study are available on request from the corresponding author. The data are not publicly available due to privacy.
Conflicts of Interest
The authors declare no conflicts of interest.
References
- China Meteorological Administration, National Climate Centre. Blue Book on Climate Change in China 2023; China Science Press: Beijing, China, 2023. [Google Scholar]
- Yu, C.; Hien, W. Thermal benefits of city parks. Energy Build. 2006, 38, 105–120. [Google Scholar] [CrossRef]
- Aflaki, A.; Mirnezhad, M.; Ghaffarianhoseini, A.; Ghaffarianhoseini, A.; Omrany, H.; Wang, Z.; Akbari, H. Urban heat island mitigation strategies: A state-of-the-art review on Kuala Lumpur, Singapore and Hong Kong. Cities 2017, 62, 131–145. [Google Scholar] [CrossRef]
- CJJ/T 85-2017; Standard for Classification of Urban Green Space. Ministry of Housing and Urban-Rural Development, PRC: Beijing, China, 2017.
- Yan, H.; Wu, F.; Dong, L. Influence of a large urban park on the local urban thermal environment. Sci. Total Environ. 2018, 622–623, 882–891. [Google Scholar] [CrossRef]
- Chang, C.; Li, M. Effects of urban parks on the local urban thermal environment. Urban For. Urban Green. 2014, 13, 672–681. [Google Scholar] [CrossRef]
- Lee, S.; Lee, K.; Jin, W.; Song, H. Effect of an urban park on air temperature differences in a central business district area. Landsc. Ecol. Eng. 2009, 5, 183–191. [Google Scholar] [CrossRef]
- Skoulika, F.; Santamouris, M.; Kolokotsa, D.; Boemi, N. On the thermal characteristics and the mitigation potential of a medium size urban park in Athens, Greece. Landsc. Urban Plan. 2014, 123, 73–86. [Google Scholar] [CrossRef]
- Aram, F.; Solgi, E.; Higueras, G.E.; Mosavi, A.; Várkonyi-Kóczy, A.R. The Cooling Effect of Large-Scale Urban Parks on Surrounding Area Thermal Comfort. Energies 2019, 12, 3904. [Google Scholar] [CrossRef]
- Ouyang, W.; Morakinyo, T.; Ren, C.; Ng, E. The cooling efficiency of variable greenery coverage ratios in different urban densities: A study in a subtropical climate. Build. Environ. 2020, 174, 106772. [Google Scholar] [CrossRef]
- Wei, D.; Yang, L.; Bao, Z.; Lu, Y.; Yang, H. Variations in outdoor thermal comfort in an urban park in the hot-summer and cold-winter region of China. Sustain. Cities Soc. 2022, 77, 103535. [Google Scholar] [CrossRef]
- Hwang, Y.; Lum, Q.; Chan, Y. Micro-scale thermal performance of tropical urban parks in Singapore. Build. Environ. 2015, 94, 467–476. [Google Scholar] [CrossRef]
- Shahidan, M.; Shariff, M.; Jones, P.; Salleh, E.; Abdullah, A. A comparison of Mesua ferrea L. and Hura crepitans L. for shade creation and radiation modification in improving thermal comfort. Landsc. Urban Plan. 2010, 97, 168–181. [Google Scholar] [CrossRef]
- Simath, S.; Emmanuel, R. Urban thermal comfort trends in Sri Lanka: The increasing overheating problem and its potential mitigation. Int. J. Biometeorol. 2022, 66, 1865–1876. [Google Scholar] [CrossRef]
- Klemm, W.; Heusinkveld, B.; Lenzholzer, S.; Jacobs, M.; Van Hove, B. Psychological and physical impact of urban green spaces on outdoor thermal comfort during summertime in The Netherlands. Build. Environ. 2015, 83, 120–128. [Google Scholar] [CrossRef]
- Aram, F.; Solgi, E.; Garcia, E.H.; Mosavi, A. Urban heat resilience at the time of global warming: Evaluating the impact of the urban parks on outdoor thermal comfort. Environ. Sci. Eur. 2020, 32, 117. [Google Scholar] [CrossRef]
- Thorsson, S.; Lindqvist, M.; Lindqvist, S. Thermal bioclimatic conditions and patterns of behaviour in an urban park in Goteborg, Sweden. Int. J. Biometeorol. 2004, 48, 149–156. [Google Scholar] [CrossRef]
- Zhang, Y.; Rao, F.; Xue, J.; Lai, D. Dependence of urban park visits on thermal environment and air quality. Urban For. Urban Green. 2023, 79, 127813. [Google Scholar] [CrossRef]
- Hewer, M.; Scott, D.; Fenech, A. Seasonal weather sensitivity, temperature thresholds, and climate change impacts for park visitation. Tour. Geogr. 2016, 18, 297–321. [Google Scholar] [CrossRef]
- Liu, X.; He, J.; Xiong, K.; Liu, S.; He, B. Identification of factors affecting public willingness to pay for heat mitigation and adaptation: Evidence from Guangzhou, China. Urban Clim. 2023, 48, 101405. [Google Scholar] [CrossRef]
- Qin, H.; Cheng, X.; Han, G.; Wang, Y.; Deng, J.; Yang, Y. How thermal conditions affect the spatial-temporal distribution of visitors in urban parks: A case study in Chongqing, China. Urban For. Urban Green. 2021, 66, 127393. [Google Scholar] [CrossRef]
- Chan, S.Y.; Chau, C.K.; Leung, T.M. On the study of thermal comfort and perceptions of environmental features in urban parks: A structural equation modeling approach. Build. Environ. 2017, 122, 171–183. [Google Scholar] [CrossRef]
- Kong, H.; Choi, N.; Park, S. Thermal environment analysis of landscape parameters of an urban park in summer—A case study in Suwon, Republic of Korea. Urban For. Urban Green. 2021, 65, 127377. [Google Scholar] [CrossRef]
- Jeong, M.; Park, S.; Song, G. Comparison of human thermal responses between the urban forest area and the central building district in Seoul, Korea. Urban For. Urban Green. 2016, 15, 133–148. [Google Scholar] [CrossRef]
- Vischer, J.C. The adaptation and control model of user needs: A new direction for housing research. J. Environ. Psychol. 1985, 5, 287–289. [Google Scholar] [CrossRef]
- Nikolopoulou, M.; Steemers, K. Thermal comfort and psychological adaptation as a guide for designing urban spaces. Energy Build. 2003, 35, 95–101. [Google Scholar] [CrossRef]
- Brager, G.S.; de Dear, R.J. Thermal adaptation in the built environment: A literature review. Energy Build. 1998, 27, 83–96. [Google Scholar] [CrossRef]
- Liu, Z.; Li, J.; Xi, T. A Review of Thermal Comfort Evaluation and Improvement in Urban Outdoor Spaces. Buildings 2023, 13, 3050. [Google Scholar] [CrossRef]
- Xu, M.; Hong, B.; Mi, J.; Yan, S. Outdoor thermal comfort in an urban park during winter in cold regions of China. Sustain. Cities Soc. 2018, 43, 208–220. [Google Scholar] [CrossRef]
- Shooshtarian, S. Socio-economic Factors for the Perception of Outdoor Thermal Environments towards Climate-sensitive Urban Design. Glob. Built Environ. Rev. 2015, 9, 39–53. [Google Scholar]
- Xu, T.; Yao, R.; Du, C.; Li, B.; Fang, F. A quantitative evaluation model of outdoor dynamic thermal comfort and adaptation: A year-long longitudinal field study. Build. Environ. 2023, 237, 110308. [Google Scholar] [CrossRef]
- Lai, D.; Chen, B.; Liu, K. Quantification of the influence of thermal comfort and life patterns on outdoor space activities. Build. Simul. 2019, 13, 113–125. [Google Scholar] [CrossRef]
- Yin, Q.; Cao, Y.; Sun, C. Research on outdoor thermal comfort of high-density urban center in severe cold area. Build. Environ. 2021, 200, 107938. [Google Scholar] [CrossRef]
- Li, J.; Liu, N. The perception, optimization strategies and prospects of outdoor thermal comfort in China: A review. Build. Environ. 2020, 170, 106614. [Google Scholar] [CrossRef]
- Meteorological Information Center, China Meteorological Administration. Special Meteorological Data Set for Building Thermal Environment Analysis in China; China Architecture & Building Press: Beijing, China, 2005. [Google Scholar]
- ISO 7726:1998; Ergonomics of the Thermal Environment- Instruments for Measuring Physical Quantities. International Organization for Standardization: Geneva, Switzerland, 1998.
- ASHRAE Standard 55-2017; Thermal Environmental Conditions for Human Occupancy. ASHRAE: Atlanta, DA, USA, 2017.
- ISO 15001; Ergonomics of the Thermal Environment. Assessment of the Influence of the Thermal Environment Using Subjective Judgement Scales. International Organization for Standardization: Geneva, Switzerland, 2002.
- Zhou, Z.; Deng, Q.; Yang, W.; Zhou, J. Effect of seasonal adaptation on outdoor thermal comfort in a hot-summer and cold-winter city. Adv. Build. Energy Res. 2019, 14, 202–217. [Google Scholar] [CrossRef]
- Zeng, Z.; Chen, H.; Deng, Q.; Mochida, A. A Field Study of Thermal Comfort in Outdoor and Semi-outdoor Environments in a Humid Subtropical Climate City. J. Asian Archit. Build. Engineering 2013, 12, 73–79. [Google Scholar] [CrossRef]
- Xi, T.; Li, Q.; Mochida, A.; Meng, Q. Study on the outdoor thermal environment and thermal comfort around campus clusters in subtropical urban areas. Build. Environ. 2012, 52, 162–170. [Google Scholar] [CrossRef]
- Zhao, L.; Zhou, X.; Li, L.; He, S.; Chen, R. Study on outdoor thermal comfort on a campus in a subtropical urban area in summer. Sustain. Cities Soc. 2016, 22, 164–170. [Google Scholar] [CrossRef]
- Lin, T. Thermal perception, adaptation and attendance in a public square in hot and humid regions. Build. Environ. 2009, 44, 2017–2026. [Google Scholar] [CrossRef]
- Zhang, Y.; Chen, H.; Wang, J.; Meng, Q. Thermal comfort of people in the hot and humid area of China-impacts of season, climate, and thermal history. Indoor Air 2016, 26, 820–830. [Google Scholar] [CrossRef]
- Zhang, Z.; Zhang, Y.; Jin, L. Thermal comfort of rural residents in a hot–humid area. Building Res. Inf. 2016, 45, 209–221. [Google Scholar] [CrossRef]
- Zhang, Z.; Zhang, Y.; Khan, A. Thermal comfort of people from two types of air-conditioned buildings—Evidences from chamber experiments. Build. Environ. 2019, 162, 106287. [Google Scholar] [CrossRef]
- Li, B.; Zheng, J.; Yao, R.; Jing, S. Indoor Thermal Environment and Human Thermal Comfort; Chongqing University Press: Chongqing, China, 2012. [Google Scholar]
- Fanger, P.O.; Toftum, J.O.; Toftum, J. Extension of the PMV model to non-air-conditioned buildings in warm climates. Energy Build. 2002, 34, 533–536. [Google Scholar] [CrossRef]
- Luo, M. The Dynamics and Mechanism of Human Thermal Adaptation in Building Environment: A Glimpse to Adaptive Thermal Comfort in Buildings; Springer Nature: Singapore, 2019. [Google Scholar]
Figure 1.
Location of the study.

Figure 2.
Monthly variation in air temperature.

Figure 3.
Rating scale.

Figure 4.
Field survey (a) Physical environment test in shadow, (b) Questionnaire process.

Figure 5.
Air temperature and air velocity throughout the survey period.

Figure 6.
Clothing insulation changes with air temperatures.

Figure 7.
The relationship between the thermal sensations and the SET.

Figure 8.
The relationship between the humidity sensations and the relative humidity.

Figure 9.
Thermal comfort proportion of different SETs.
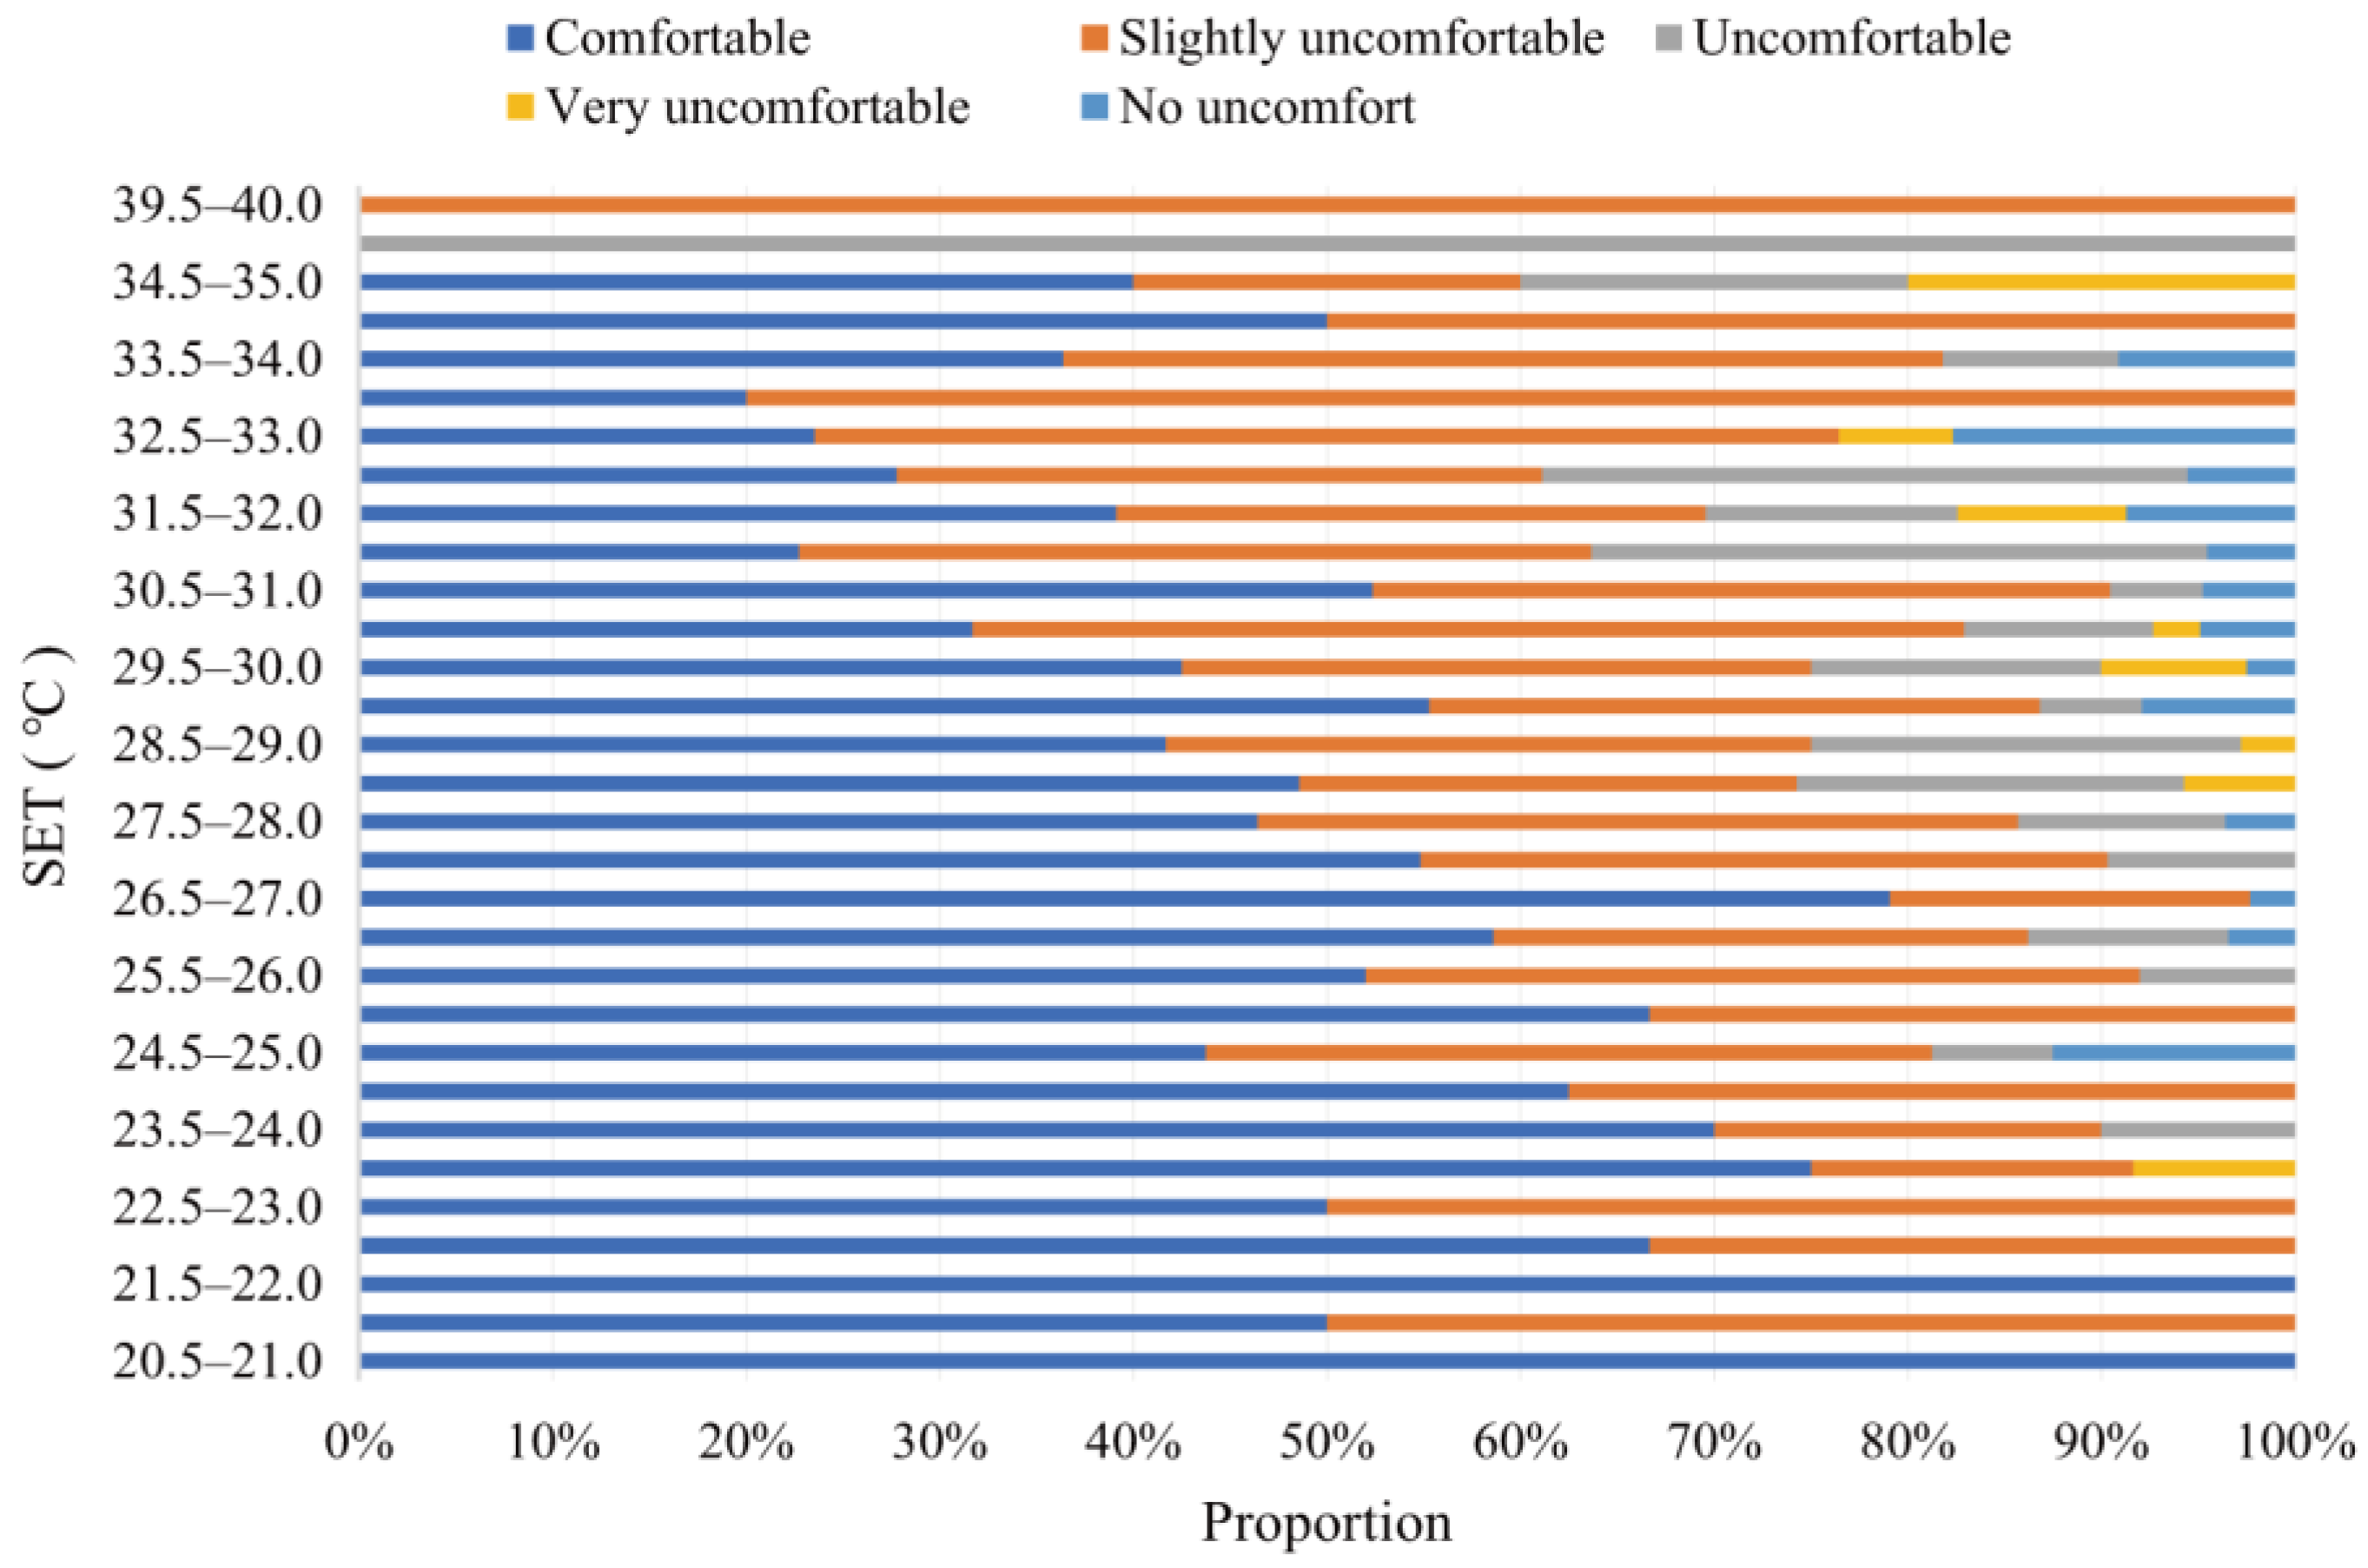
Figure 10.
Percentage dissatisfied changes with SET.

Figure 11.
Thermal preference proportion of different SETs.

Figure 12.
Airflow preference proportion of different SETs.

Figure 13.
Actual thermal sensation–percentage dissatisfied and PMV-PPD.


Table 1.
Age distribution of respondents.
| Age Group (y) | <30 | 30–39 | 40–49 | 50–59 | 60–69 | 70–79 | >80 |
|---|---|---|---|---|---|---|---|
| Number | 62 | 16 | 41 | 119 | 149 | 134 | 36 |
| Proportion (%) | 11.13 | 2.87 | 7.36 | 21.36 | 26.75 | 24.06 | 6.46 |
Table 2.
Instrument specifications.
| Type | Measurement Content | Operation Range | Accuracy |
|---|---|---|---|
| HD 32.3 | Air temperature | −10–80 °C | ±0.2 °C |
| Relative humidity | 5–98% | ±2% (15–90%) ±2.5% (other scope) | |
| Air speed | 0.05–5 m/s | ±0.05 m/s (0–0.99 m/s) ±0.15 m/s (1–5 m/s) | |
| Globe temperature | −10–100 °C | ±0.2 °C |
Table 3.
A comparison from the field study on the outdoor thermal comfort in different regions.
| Building Climate | City | Respondents | Neutral Temperature | Acceptable Temperature Range | Samples Size | Preference |
|---|---|---|---|---|---|---|
| Cool | Anyang | Social groups | / | the upper limit of 80% acceptable SET was 32.1 °C | 557 | This study |
| HSCW | Wuhan | College students | 25.6 °C | the upper limit of 100% acceptable SET was 27.9 °C | 417 | [42] |
| HSCW | Wuhan | College students | 24.8 °C | / | 386 | [43] |
| HSWW | Guangzhou | College students | 24 °C | the upper limit of 78% acceptable SET was 32 °C | / | [44] |
| HSWW | Guangzhou | College students | 23.9 °C | the upper limit of 80% acceptable SET was 31.1 °C | 1582 | [45] |
Note: HSCW, hot summer and cold winter; HSWW, hot summer and warm winter.
Disclaimer/Publisher’s Note: The statements, opinions and data contained in all publications are solely those of the individual author(s) and contributor(s) and not of MDPI and/or the editor(s). MDPI and/or the editor(s) disclaim responsibility for any injury to people or property resulting from any ideas, methods, instructions or products referred to in the content. |
© 2024 by the authors. Licensee MDPI, Basel, Switzerland. This article is an open access article distributed under the terms and conditions of the Creative Commons Attribution (CC BY) license (https://creativecommons.org/licenses/by/4.0/).
Share and Cite
MDPI and ACS Style
Zhang, Z.; Wang, Y.; Zhu, D. Overheating in the Tree Shade of Urban Parks: A Field Study of Thermal Adaption in China. Atmosphere 2024, 15, 575. https://doi.org/10.3390/atmos15050575
AMA Style
Zhang Z, Wang Y, Zhu D. Overheating in the Tree Shade of Urban Parks: A Field Study of Thermal Adaption in China. Atmosphere. 2024; 15(5):575. https://doi.org/10.3390/atmos15050575
Chicago/Turabian StyleZhang, Zhongjun, Yaqian Wang, and Dangwei Zhu. 2024. "Overheating in the Tree Shade of Urban Parks: A Field Study of Thermal Adaption in China" Atmosphere 15, no. 5: 575. https://doi.org/10.3390/atmos15050575
Note that from the first issue of 2016, this journal uses article numbers instead of page numbers. See further details here.