
Experimental Study of Laser-Induced Cavitation Bubbles near Wall: Plasma Shielding Observation
by
 , , ,
, , ,
Rui Zhou
1,
Kangwen Li
2,
Yupeng Cao
2,*,
Weidong Shi
2,*,
Yongfei Yang
2,
Linwei Tan
2,
Ranran Hu
2 and
Yongxin Jin
3 1
School of Information Science and Technology, Nantong University, Nantong 226019, China
2
School of Mechanical Engineering, Nantong University, Nantong 226019, China
3
Key Laboratory of Fluid Machinery and Engineering, Xihua University, Chengdu 610039, China
*
Authors to whom correspondence should be addressed.
Water 2024, 16(10), 1324; https://doi.org/10.3390/w16101324
Submission received: 10 April 2024
/
Revised: 30 April 2024
/
Accepted: 6 May 2024
/
Published: 7 May 2024
(This article belongs to the Special Issue Hydraulics and Hydrodynamics in Fluid Machinery)
Abstract
:To investigate the plasma shielding of laser-induced cavitation bubbles near a wall, a pulsed laser with different energies was selected to induce cavitation bubbles on the surface of 7050-T7451 aluminum alloy. A high-speed camera captured the evolution of the cavitation bubble, while a fiber-optic hydrophone system collected the acoustic signals during the evolution. Finally, a confocal microscope was used to view and analyze the surface morphology of 7050 aluminum alloy. The experimental results indicate that as the laser energy increases, the diameter, the evolution time, the pressure of the bubble, and both the pit diameter and depth all increase. Beyond an energy level of 1.4 J, the maximum diameter and the evolution time of the laser-induced cavitation bubble begin to decrease; the maximum diameter decreases by 2.04%, and the first evolution time decreases by 3.26%. Plasma shielding was observed in this experiment. Considering that the essence of a laser-induced cavitation bubble is the interaction between a high-energy laser and a liquid medium, the abnormal decrease in the maximum diameter, evolution time, and sound pressure epitomizes the manifestation of plasma shielding.
1. Introduction
Positioned at the forefront of technological advancements, cavitation bubble technology finds primary applications in sectors including ships, chemical industries, medicine, and other fields. The water jet-induced cavitation bubble, recognized for its extensive impact range, high efficiency, and eco-friendliness, is extensively utilized in ship maintenance and chemical equipment cleaning [1,2,3,4,5,6]. In medicine, ultrasound-induced cavitation bubbles are used in cancer treatment, stone crushing, and gingival surgery owing to their small impact area and large impact force [7,8,9]. In recent years, with the development of laser technology, it has been found that a cavitation bubble will emerge between the laser and liquid medium. The principle is as follows: When the laser reaches the breakdown threshold of the liquid medium, photoinduced breakdown occurs. The rapidly formed plasma expands under the action of laser energy, creating the cavitation bubble. The cavitation bubble is accompanied by an “expansion–contraction” process. After several cycles, it eventually collapses. Compared with other methods, laser-induced cavitation bubbles have the advantages of superior spherical symmetry, ease of control, and minimal mechanical deformation. Consequently, laser-induced cavitation bubbles have gradually emerged as an important experimental method to study the cavitation bubble phenomenon [10].
Laser-induced cavitation bubbles have been found to be valuable in many fields and applications. The physical effects have been used to strengthen materials in the laboratory and to perform material surface modification [11]. Laser-induced cavitation bubbles have been used for micro/nanofabrication technologies [12]. These studies have shown that micro-pressure plays an important role at the micro/nanoscale. Moreover, laser-induced cavitation bubbles have many biomedical applications [13,14,15]. In addition, their chemical effects have been used for degradation and pollution reduction [16,17]. These research papers discuss methods for degrading wastewater with laser-induced cavitation bubbles.
Due to the life cycle of the laser-induced cavitation bubble, comprehending the detailed evolution of the cavitation bubble presents a challenge [18,19]. Franco Docchi [20,21] documented the process of plasma generation, expansion, and disappearance in the laser-induced cavitation bubble using a fringe camera. Feng Yi [22] observed three patterns of laser-induced cavitation in droplets and suggested that a nanosecond laser pulse could induce cavitation in DDPF droplets. Fujisawa Nobuyuki [23] indicated that cavitating-jet erosion occurs due to the cloud collapse near the wall, where some shock waves are generated, and results in the erosion of the wall. Iskander Akhatov [24] studied the numerical relationship between the bubble size and its first evolution; Zhong Xiaoxu [25] proposed a new model and found that the maximum potential energy of bubbles is linearly related to the laser energy; Zhang Ju [26] systematically investigated the effect of the separation distance on the impact pressure of an antijet in near-wall laser-induced cavitation bubble tests; and Lee Seung Jun [27] found that the life cycle of laser-induced cavitation bubbles depends on the liquid medium environment.
When an intense laser pulse is focused on water or an aqueous solution, the breakdown of the liquid will occur once the intensity exceeds a certain value in the focal region. When the laser pulse is maintained in the focal region, the plasma formed by the breakdown will be heated by the reverse bremsstrahlung effect. The main physical characteristics of liquid breakdown are as follows: The temperature of the plasma can reach 6000–15,000 K and the pressure can reach 20–60 kbar. Plasma emerges during the formation of the laser-induced cavitation bubble. Flannigan David J [28] experimentally demonstrated the existence of plasmas during photoinduced single- and multi-bubble breakdown. Lopez-Claros [29] studied the effects of hydrostatic pressure on laser-induced plasma, cavitation bubbles, and emission spectra. Arindom Phukan [30] explored the influence of an external magnetic field on laser-induced cavitation bubbles and their resulting plasma; the radius and duration of cavitation bubbles increased significantly with the increase in the external magnetic field. Presently, research mainly focuses on the evolution of laser-induced cavitation and the effects of external factors on plasma, but there is a lack of experiments from the perspective of high laser energy to study its impact on plasma shielding and establish relevant models.
In this study, the evolution of laser-induced cavitation bubbles near a wall at different laser energies and acoustic signals was analyzed and studied using a high-speed camera and a fiber-optic hydrophone system. Shock waves could be captured using laser light and the high-speed camera. The evolution of laser-induced cavitation bubbles at different laser energies was captured, and the plasma shielding effects of laser-induced cavitation bubbles were observed. The shock waves resulting from plasma shielding during the formation of laser-induced cavitation bubbles were collected. This enriches the understanding of the mechanism of laser-induced cavitation bubbles. These findings have guiding significance for the mechanistic research and application of laser-induced cavitation bubbles.
2. Materials and Methods
2.1. Material Properties
The sample material chosen is 7050-T7451 aluminum alloy. Refer to Table 1 for detailed physical and mechanical properties.
This alloy has good exfoliation corrosion resistance, stress corrosion cracking ability, fracture toughness, and fatigue performance and is widely used in aircraft structural parts, including extrusion components, thick plates, and die forgings [31]. The material was fabricated into 20 mm × 20 mm × 5 mm samples by wire cutting. To reduce testing errors and enhance accuracy, a sequential polishing process was implemented using 60#, 5000#, 800#, 1000#, and 1200# sandpaper. Subsequently, ultrasonic cleaning and drying procedures were employed.
Figure 1 illustrates the test platform used to investigate laser-induced cavitation bubbles. The selected nanosecond laser was a Nd:YAG solid-state pulsed laser (Beamtech, Beijing, China, Nimma Extra), which was used as the source of cavitation bubbles. The laser was operated at a wavelength of 1064 nm, a pulse width of 9 ns, and a repetition rate of 5 Hz. Following double-beam expansion, the laser beam was refracted by a reflector and focused by a convex lens (focal length: 100 mm) into a 100 mm × 100 mm transparent acrylic tank with high transmittance. The tank with deionized water at a depth of 80 mm was positioned on a three-dimensional electric movable platform (Zolix, Beijing, China, CZF 20-120) featuring an adjustable range of 100 mm, an XY-axis accuracy of 0.1 mm, and a Z-axis accuracy of 0.05 mm. By adjusting the voltage of the nanosecond laser from 750 V to 815 V, the laser energy was changed from 1.1 J to 1.5 J, thereby inducing near-wall cavitation bubbles with different energies.
2.2. Signal Acquisition and Detection Equipment
Figure 2 illustrates the signal acquisition and detection equipment used for laser-induced cavitation bubbles.
The equipment used for image signal acquisition consisted of a high-speed camera (Phantom, Wayne, NJ, USA, v2012) in front of the sink and a macro-lens (LAOWA, Hefei, China, F2.8) attached to the camera, as shown in Figure 2a. The LE00D matrix light source was used to directly capture the evolution of cavitation bubbles, with a resolution of 128 × 128 pixels, a shooting frame rate of 400,000 fps, and an exposure time of 2.5 s. An optical efficiency of 50–200 lumen/watt (Oimtt, Nanjing, China, OS200) provides the cold light source for capturing the evolution. A laser with a wavelength of 640 nm and energy of 100 mJ (Cavitar, Tampere, Finland, Smart) served as the light source for capturing shock waves. Acoustic signals were collected by a fiber-optic hydrophone system (Precious Acoustics, Dorchester, UK, FOPH v2), as shown in Figure 2b, and shock wave signals generated by laser-induced cavitation bubbles were detected by an oscilloscope (Agilent, Santa Clara, CA, USA, DSO91303A), as shown in Figure 2c. The pulsed laser, high-speed camera, fiber-optic hydrophone system, and oscilloscope were connected by a synchronous controller with 50 ns accuracy (Green Union, Shenzhen, China, 50 Ω). The evolution of laser-induced cavitation bubbles and the plasma shielding phenomenon were analyzed and studied through image-acoustic signals.
2.3. Surface Morphology Measuring Equipment
The 3-D morphology and 2-D profile of 7050 aluminum alloy after the generation of laser-induced cavitation bubbles near a wall were measured and characterized by a confocal microscope (NanoFocus, Oberhausen German, μsurf). The experimental equipment is depicted in Figure 3. The equipment utilizes multi-hole confocal technology combined with CCD image acquisition, capable of obtaining 3-D topography, 2-D contour (depth, angle, curvature), and other data from the material surface within seconds without directly contacting the material surface during measurement. The main technical parameters of the equipment are as follows: (1) LED light source: = 505 nm; MTBF: 50,000 h; (2) measurement time: 5–10 s; (3) X/Y-direction; platform movement range: 50 mm × 50 mm; resolution: 0.3 m; (4) Z-direction measurement range: 250 m; resolution: 2 nm; (5) objective: 5×, 20×, 50×, 100× (optional).
3. Results
3.1. Evolution of Laser-Induced Cavitation Bubbles at Different Laser Energies
A pulsed laser was used to induce cavitation bubbles near the wall of the material in a deionized water medium. A high-speed camera captured the image of the evolution. Different laser energies were selected in the experiment. As shown in Figure 4, Figure 5, Figure 6, Figure 7 and Figure 8, the laser energies (E) were set to 1.1 J, 1.2 J, 1.3 J, 1.4 J, and 1.5 J, with a constant defocusing amount of 1 mm. During the experiments, we changed only the laser energy; the other parameters were kept the same.
Figure 4 shows shadowgraphs of the cavitation bubble evolution at E = 1.1 J, where a cavitation bubble is generated near the wall of the material. Photobreakdown occurs in the deionized water medium under the laser, and a distinct cavitation bubble outline appears at 5 s. Facilitated by the solid–liquid pressure difference, the cavitation bubble initiates expansion near the wall, reaching a maximum diameter measuring 6.02 mm at 210 . During the collapse process, the cavitation bubble gradually shrinks due to the pressure difference, with the first collapse occurring at 415 s. Following this, the cavitation bubble undergoes a second evolution near the wall. Due to the interplay between shock rebound and the bubble surface, the shape of the cavitation bubble no longer presents as regular hemispherical. The cavitation bubble reaches the maximum diameter of 2.94 mm at 525 s, and the second collapse occurs at 635 s.
Figure 5 shows the evolution of the cavitation bubble at E = 1.2 J. The distinct outline of the cavitation bubble also appears at 5 s, similar to the evolution of the cavitation bubble at E = 1.1 J. The maximum diameter, measuring 6.16 mm, occurs at 210 s. The first collapse occurs at 425 s. The bubble reaches a maximum diameter of 3.01 mm at 550 s in the second evolution, and the second collapse occurs at 640 s.
Figure 6 depicts the evolution of the cavitation bubble at E = 1.3 J. The cavitation bubble diameter reaches its maximum, measuring 6.86 mm, at 210 s. The first collapse occurs at 465 s. Then, the cavitation bubble undergoes the second evolution and reaches the maximum diameter of 3.43 mm at 590 s, and the second collapse occurs at 705 s.
Figure 7 presents the evolution of the cavitation bubble at E = 1.4 J. The diameter of the cavitation bubble reaches its maximum, which is 7.00 mm, at 215 s, and the first collapse occurs at 475 s. The bubble reaches the maximum diameter of 3.78 mm at 615 s during the second evolution, and the collapse occurs at 715 s.
Figure 8 shows the evolution of the cavitation bubble at E = 1.5 J. The diameter of the cavitation bubble reaches its maximum, which is 6.86 mm, at 215 s, and the first collapse occurs at 460 s. During the second evolution, the bubble reaches the maximum diameter of 3.36 mm at 585 s, and the collapse occurs at 700 s.
The diameter data were collected using the software of the high-speed camera, which measures at a rate of 0.07 mm per pixel. The evolution times and diameters can be seen in Table 2. The results shown in Figure 9 indicate that the bubble size under different energies typically undergoes two “expansion–compression” cycles, comprising two expansions and two contractions. Within 200–250 s, the bubble expands to its maximum and then contracts and collapses. As the laser energy increases, the duration of the first bubble pulsation cycle lengthens, and the maximum bubble diameter gradually increases. However, beyond 1.4 J, the maximum bubble diameter decreases, and the duration of the pulsation cycle shortens.
3.2. Cavitation Shock Wave Effects at Different Laser Energies
This study explored the shock wave effects of the laser-induced cavitation bubble at different laser energies. The sample and the liquid near the focal point absorb laser energy and generate plasma, which results in the formation of laser shock waves during the expansion of the liquid [32]. Subsequently, these shock waves quickly transition into sound waves after traveling a certain distance. The attenuation of shock waves transpires during propagation, with the pressure value being contingent on the propagation distance “r”. According to the literature [33], the maximum impact pressure at 68 m from the cavity wall is 1.3 ± 0.3 GPa. The shock pressure decays proportionally to as the distance from the cavity increases. In the process of laser-induced cavitation bubble evolution, the pressure of the laser shock wave is affected by the liquid’s depth, viscosity, tension, and temperature. The energy reflects the strength of the collapse shock wave and is concentrated in the first evolution, so the shock wave in the next evolution can be ignored.
A fiber-optic hydrophone system was used to detect the acoustic waves of transient explosion waves and collapse shock waves generated during the evolution of the laser-induced cavitation bubble near the wall. Positioned at a 45° angle and a distance of 10 mm from the wall, the fiber-optic hydrophone system probe boasts a sensitivity of 250 mV/MPa. Figure 10 shows the acoustic signal evolution during laser-induced cavitation bubble evolution at different laser energies. It can be seen that each acoustic signal has two peaks: peak 1 represents the transient explosion wave, and peak 2 represents the collapse shock wave. There are numerous smaller peaks in the signal, which can be considered liquid noise, and their influence is ignored. Sound pressure can be calculated from Equation (1):
where P is the sound pressure in the laser-induced cavitation bubble, is the voltage amplitude, and is the sensitivity of the fiber-optic hydrophone system.
The pressure values of the shock wave calculated according to Equation (1) can be seen in Table 3. It can be seen that as the laser energy increases, the pressure values of transient explosion waves and collapse shock waves gradually increase. At a laser energy of 1.4 J, the sound pressure values for both waves reach their zenith, registering at 15.00 MPa and 7.16 MPa. When the laser energy reaches 1.5 J, the sound pressure values of the two waves decrease to 11.72 MPa and 6.84 MPa. Moreover, the collapse shock wave is always about half of the transient explosion wave.
The theory describing the pulsation of a laser-induced cavitation bubble is related to that of cavitation bubble dynamics. Rayleigh [34] studied the law of motion of spherical cavitation bubbles under ideal fluid conditions and obtained the following cavitation-bubble equation of motion:
where R is the bubble radius, is the air pressure inside the bubble, is the hydrostatic pressure at infinity, and is the density of deionized water.
The Rayleigh equation of a spherical cavitation bubble does not consider the air content, surface tension, viscosity, or certain properties relating to bubble movement. Thus, it has a large discrepancy from actual situations. To overcome these limitations, Plesset [35] deduced the classical Rayleigh–Plesset equation [36]:
where v is the viscosity of deionized water, and is the surface tension.
The relationship between the pressure calculated according to Equations (2) and (3) and the measured pressure is shown in Table 4. The calculated pressure is close to the measured pressure. The accuracy is 95.2%. Meanwhile, all the calculated pressure values are larger than the measured pressure values. Presumably, there is some attenuation of the acoustic signal in the deionized water.
3.3. Surface Morphology Analysis
A confocal microscope was utilized to observe and analyze the surface morphology of 7050 aluminum alloy after the generation of a laser-induced cavitation bubble. Figure 11 shows the measurement results of the 3-D surface morphology of 7050 aluminum alloy after laser-induced cavitation at different energy levels.
The specific observation area was a 798 m × 798 m section at the center of the sample’s upper surface. Figure 11a illustrates that SiC particles in the sandpaper play a micro-plowing role during the polishing process, resulting in elongated microgrooves arranged in parallel due to local unevenness.
Figure 11b–f show the surface morphology of a 7050 aluminum alloy sample after laser-induced cavitation near the wall at energies of 1.1 J, 1.2 J, 1.3 J, 1.4 J, and 1.5 J, respectively. The images reveal pits on the sample surface, with plastic deformation occurring as the pits are extruded outward by the shock wave, forming annular protrusions.
To further characterize the effect of laser-induced cavitation near the wall on the surface morphology of 7050 aluminum alloy, a 2-D depth morphology analysis was conducted along the specific diameter of the pit in Figure 11.
As shown in Figure 12, the sampling length was 800 m. Due to the Gaussian distribution of the laser light in space, the laser energy is most concentrated in the central region, resulting in the deepest pit at this location. Figure 12a shows that the pit diameter is approximately 144.94 m, and the pit depth is about 7.12 m at 1.1 J energy. Figure 12b indicates that the pit diameter is approximately 164.45 m, and the pit depth is about 7.92 m at 1.2 J energy, representing increases of 13.46% and 11.24%, respectively, compared to 1.1 J. Figure 12c shows that the pit diameter is approximately 177.33 m and the pit depth is about 8.24 m at 1.3 J energy, with increases of 7.83% and 4.04%, respectively, compared to 1.2 J. Figure 12d shows that the pit diameter is approximately 185.39 m and the pit depth is about 10.02 m at 1.4 J energy. Compared to 1.3 J, the pit diameter and depth at 1.4 J increased by 21.60% and 4.55%, respectively. At 1.5 J, the maximum pit diameter on the sample surface is 175.68 m, and the depth is about 9.56 m, both lower than those at 1.4 J. Compared to 1.4 J, the pit diameter and depth decreased by 5.53% and 4.81%, respectively.
A comparative analysis shows that the pit diameter and depth increase with increasing laser energy. At 1.4 J, the pit diameter and depth reach their maximum values. Beyond 1.4 J, the pit diameter and depth begin to decrease.
4. Discussion
After the appearance of a high free electron density, the plasma, which absorbs visible radiation more strongly than transparent materials, will further absorb laser energy, resulting in plasma heating and expansion. This significantly hinders laser penetration, a phenomenon known as plasma shielding [37]. Broadly speaking, plasma shielding includes absorption, reflection, and scattering, which results in propagation. The decrease in laser energy or the deflection of the laser propagation direction leads to a great decrease in coupling efficiency between the laser and the target.
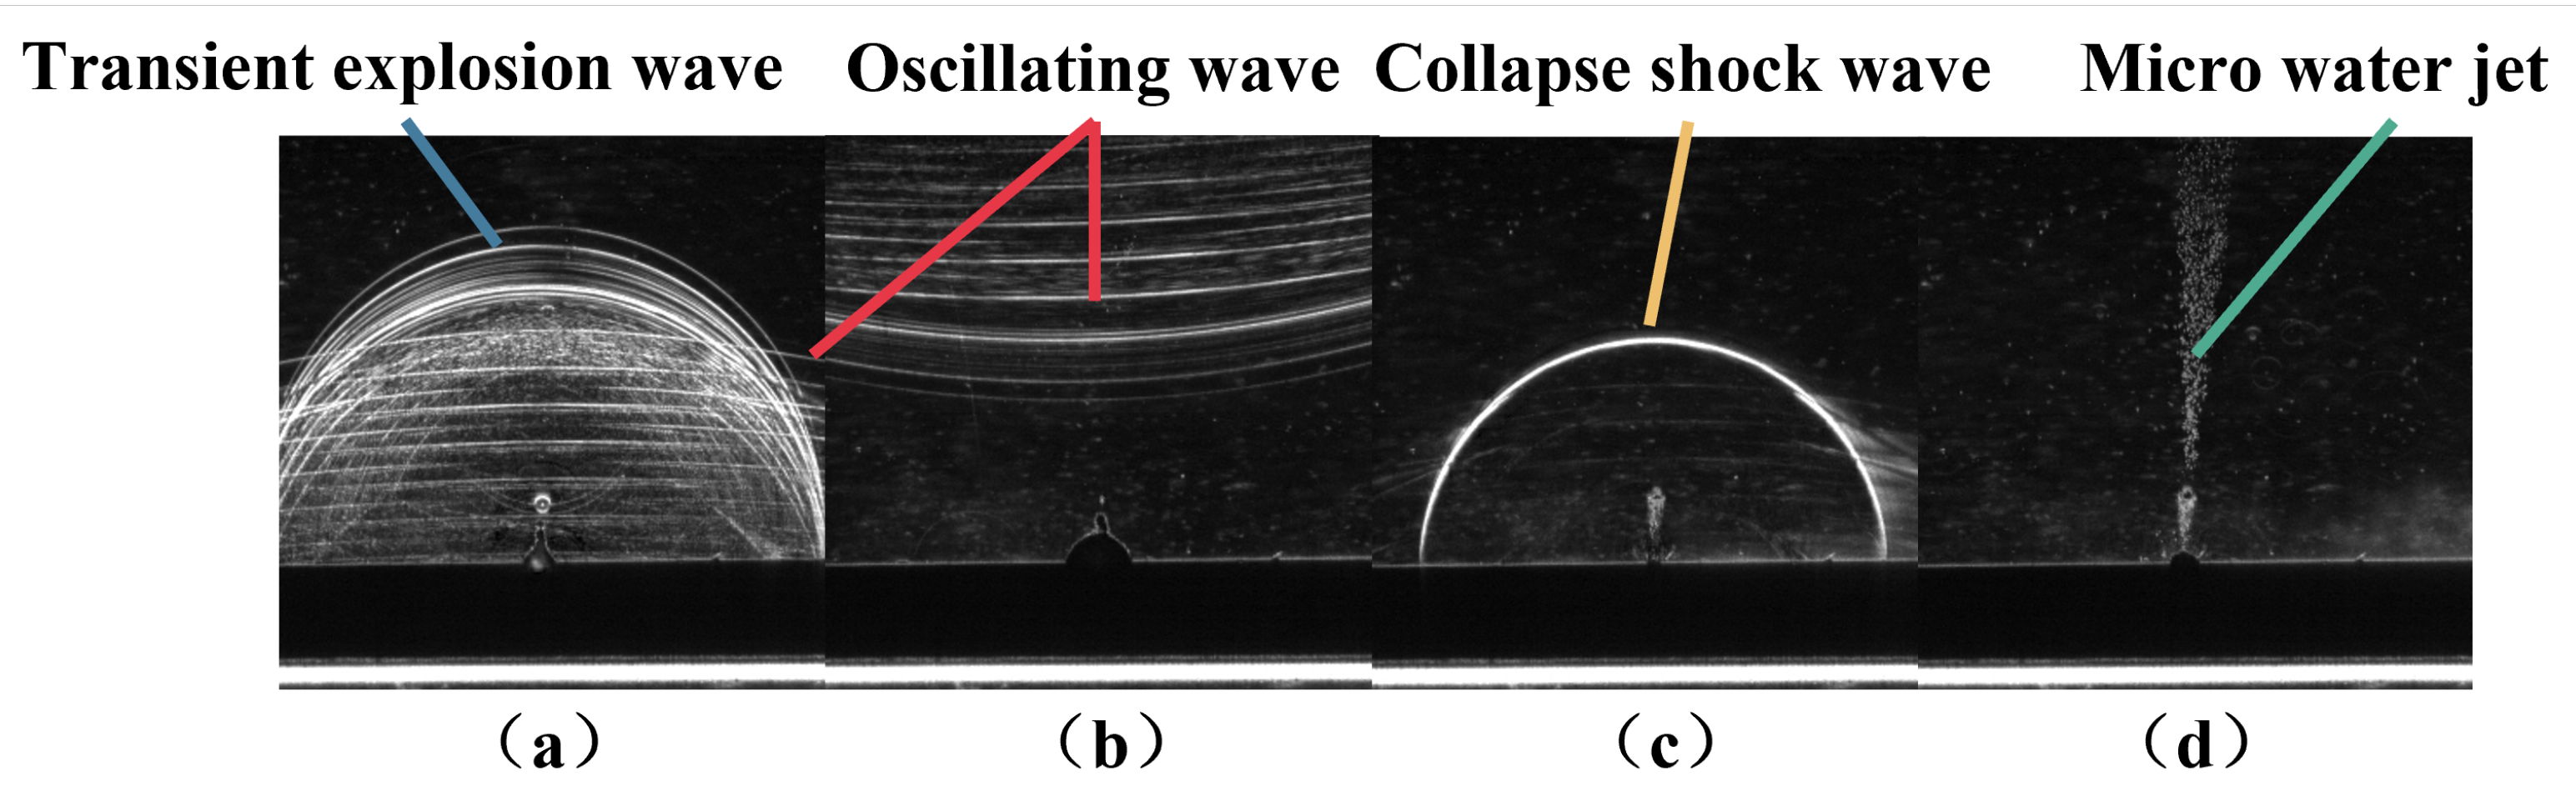
Based on the principle of the shadow method, the shielding mechanism of plasma generated by laser-induced water breakdown was studied experimentally in this work. Through the study and investigation of bubble evolution laws and characteristics, it was found that the maximum diameter, first evolution time, pressure, pit diameter, and depth all decrease at 1.5 J. The results demonstrate the hindrance of laser penetration and the appearance of plasma shielding. The shock waves from the plasma shielding phenomenon during laser-induced cavitation can be observed using a 640 nm laser as the light source. Clear shock waves are observable in Figure 13.
With the high-energy laser breakdown of deionized water, a cavitation bubble is formed. During the initial stage of cavitation bubble formation, a transient explosion wave with high sound pressure occurs, accompanied by a post-impact oscillating wave on the material wall (Figure 13a). As the cavitation bubble evolves, the shock wave contacts the solid wall and produces a rebound; a small rebound oscillation wave with low sound pressure appears (Figure 13b). When the bubble collapses, a clear wave front forms, representing a collapse shock wave with higher energy (Figure 13c). After the collapse shock wave, a micro-jet impacting the material surface due to the shear force of the deionized water medium can be observed (Figure 13d). These diagrams aid in studying the effects of plasma shielding during laser-induced cavitation.
5. Conclusions
In this study, a series of experiments were conducted to investigate laser-induced cavitation bubbles near the wall at various energy levels. The findings reveal the evolution patterns of the cavitation bubbles and provide an initial analysis of plasma shielding. The key conclusions are as follows:
(1) The diameter of the laser-induced cavitation bubble changes with the increase in laser energy. The larger the laser energy, the greater the maximum diameter and evolution time of the cavitation bubble.
(2) When the laser energy exceeds 1.4 J, the maximum diameter and evolution time begin to decrease; specifically, the maximum diameter decreased by 2.00%, and the first evolution time decreased by 3.16% in this experiment.
(3) The pressure levels of the transient explosion wave and the collapse shock wave closely match the calculated results with an accuracy of 95.2%. As the laser energy increases, the pressure levels generally rise, but they decrease at 1.5 J. In this experiment, the pressure decreased to 11.72 MPa and 6.84 MPa, respectively.
(4) The surface morphology of 7050 aluminum alloy after the evolution of laser-induced cavitation bubbles shows consistency in the pits. As the laser energy increases, the pit diameter and depth generally increase, but they decrease at 1.5 J. In this experiment, the diameter decreased by 5.24%, and the depth decreased by 4.59%.
(5) Considering that the essence of laser-induced cavitation bubbles is the interaction between the high-energy laser and the deionized water medium, the abnormal decrease in the bubble diameter, sound pressure, and pit scale embodies the plasma shielding phenomenon.
(6) The plasma shielding phenomenon was demonstrated in the experiment. However, the quantitative relationship between the phenomenon and the data can be further researched in the future. The specific reasons for the occurrence of plasma shielding, ways to control it, and its progression on the nanosecond scale are the focus of our current research.
Author Contributions
Conceptualization, R.Z.; methodology, Y.C. and R.H.; investigation, R.Z.; software, K.L. and Y.Y.; writing—original draft preparation, R.Z.; writing—review and editing, Y.C., W.S., and L.T.; resources, Y.J. All authors have read and agreed to the published version of the manuscript.
Funding
This research was funded by the Postgraduate Research & Practice Innovation Program of Jiangsu Province (KYCX22_3342, KYCX22_3337), the Foundation of National Key Laboratory for Remanufacturing (1420052022KJW01), the Project of Laser Processing and Metal Additive Manufacturing Technology and Application (SJK2023-3), the National Natural Science Foundation of China (51979138, 52109106), the Natural Science Foundation of Jiangsu Province (BK20220609), Nantong Municipal People’s Livelihood Project (MS22022040), and the Open Research Subject of Key Laboratory of Fluid Machinery and Engineering (Xihua University) (grant number LTDL-2022008, LTDL-2022001).
Institutional Review Board Statement
Not applicable.
Informed Consent Statement
Not applicable.
Data Availability Statement
Data from the analysis and reporting results during the study can be obtained by contacting the authors.
Acknowledgments
The authors thank Nantong University for providing experimental equipment and all of the people and institutions who helped the authors complete this paper.
Conflicts of Interest
The authors declare no conflicts of interest.
References
- Gu, Y.D.; Sun, H.; Wang, C.; Lu, R.; Liu, B.Q.; Ge, J. Effect of Trimmed Rear Shroud on Performance and Axial Thrust of Multi-Stage Centrifugal Pump With Emphasis on Visualizing Flow Losses. J. Fluids Eng. 2024, 146, 011204. [Google Scholar] [CrossRef]
- Wang, H.L.; Jia, X.W.; Wang, C.; Hu, B.; Cao, W.D.; Li, S.S.; Wang, H. Study on the Sand-Scouring Characteristics of Pulsed Submerged Jets Based on Experiments and Numerical Methods. J. Mar. Sci. Eng. 2024, 12, 57. [Google Scholar] [CrossRef]
- Ren, X.D.; He, H.; Tong, Y.Q.; Ren, Y.P.; Yuan, S.Q.; Liu, R.; Zuo, C.Y.; Wu, K.; Sui, S.; Wang, D.S. Experimental investigation on dynamic characteristics and strengthening mechanism of laser-induced cavitation bubbles. Ultrason. Sonochem. 2016, 32, 218–223. [Google Scholar] [CrossRef]
- Ylonen, M.; Franc, J.P.; Miettinen, J.; Saarenrinne, P.; Fivel, M. Shedding frequency in cavitation erosion evolution tracking. Int. J. Multiph. Flow 2019, 118, 141–149. [Google Scholar] [CrossRef]
- Wang, C.; Tan, L.; Chen, M.; Fan, H.; Liu, D. A review on synergy of cavitation and sediment erosion in hydraulic machinery. Front. Energy Res. 2022, 10, 1047984. [Google Scholar] [CrossRef]
- Huang, L.Y.; Chen, Z.S. Effect of technological parameters on hydrodynamic performance of ultra-high-pressure water-jet nozzle. Appl. Ocean. Res. 2022, 129, 103410. [Google Scholar] [CrossRef]
- Izadifar, Z.; Babyn, P.; Chapman, D. Ultrasound Cavitation/Microbubble Detection and Medical Applications. J. Med. Biol. Eng. 2019, 39, 259–276. [Google Scholar] [CrossRef]
- Zekonis, G.; Sadzeviciene, R.; Balnyte, I.; Noreikiene, V.; Sidlauskaite, G.M.; Sadzeviciute, E.; Zekonis, J. Clinical and Microbiological Effects of Weekly Supragingival Irrigation with Aerosolized 0.5% Hydrogen Peroxide and Formation of Cavitation Bubbles in Gingival Tissues after This Irrigation: A Six-Month Randomized Clinical Trial. Oxidative Med. Cell. Longev. 2020, 2020, 3852431. [Google Scholar] [CrossRef]
- Hu, S.A.; Zhang, X.R.; Melzer, A.; Landgraf, L. Ultrasound-induced cavitation renders prostate cancer cells susceptible to hyperthermia: Analysis of potential cellular and molecular mechanisms. Front. Genet. 2023, 14, 1122758. [Google Scholar] [CrossRef]
- Kim, C.; Choi, W.J.; Ng, Y.; Kang, W. Mechanically Induced Cavitation in Biological Systems. Life 2021, 11, 546. [Google Scholar] [CrossRef]
- Ren, X.D.; Wang, J.; Yuan, S.Q.; Adu-Gyamfi, S.; Tong, Y.Q.; Zuo, C.Y.; Zhang, H.F. Mechanical effect of laser-induced cavitation bubble of 2A02 alloy. Opt. Laser Technol. 2018, 105, 180–184. [Google Scholar] [CrossRef]
- Liu, H.; Liu, F.; Ma, Y.; Jiang, C.; Wang, X. Investigation of a novel laser shock liquid flexible microforming process applied to embossing three-dimensional large area microarrays on metallic foils. Int. J. Adv. Manuf. Technol. 2018, 99, 419–435. [Google Scholar] [CrossRef]
- Blanken, J.; Moor, R.J.G.D.; Meire, M.; Verdaasdonk, R. Laser induced explosive vapor and cavitation resulting in effective irrigation of the root canal. Part 1: A visualization study. Lasers Surg. Med. 2009, 41, 514–519. [Google Scholar] [CrossRef] [PubMed]
- Sabzeghabae, A.N.; Devia-Cruz, L.F.; Gutierrez-Herrera, E.; Camacho-Lopez, S.; Aguilar, G. Bubble dynamics of laser-induced cavitation in plasmonic gold nanorod solutions and the relative effect of surface tension and viscosity. Opt. Laser Technol. 2021, 134, 106621. [Google Scholar] [CrossRef]
- Enrico, A.; Voulgaris, D.; Östmans, R.; Sundaravadivel, N.; Moutaux, L.; Cordier, A.; Niklaus, F.; Herland, A.; Stemme, G. 3D Microvascularized Tissue Models by Laser-Based Cavitation Molding of Collagen. Adv. Mater. 2022, 34, 2109823. [Google Scholar] [CrossRef]
- Gu, J.; Luo, C.; Zhou, W.; Tong, Z.; Zhang, H.; Zhang, P.; Ren, X. Degradation of Rhodamine B in aqueous solution by laser cavitation. Ultrason. Sonochem. 2020, 68, 105181. [Google Scholar] [CrossRef] [PubMed]
- Tong, Y.; Jiang, B.; Chen, X.; Ren, X.; Lu, J.; Ding, L. Synergistic degradation of methylene blue by laser cavitation and activated carbon fiber. Opt. Laser Technol. 2022, 155, 108417. [Google Scholar] [CrossRef]
- Wen, H.G.; Yao, Z.F.; Wu, Q.; Sun, Y.R.; Yang, C.X.; Zhong, Q. Investigation of cavitation erosion caused by laser-induced single bubble collapse near alloy coating surface. J. Hydrodyn. 2023, 35, 180–184. [Google Scholar] [CrossRef]
- Song, W.D.; Xie, Q. Mechanism and characteristics of steam laser patterning. Appl. Phys. A-Mater. Sci. Process. 2008, 91, 137–140. [Google Scholar] [CrossRef]
- Docchio, F.; Regondi, P.; Capon, M.R.; Mellerio, J. Study of the temporal and spatial dynamics of plasmas induced in liquids by nanosecond Nd:YAG laser pulses. 2: Plasma luminescence and shielding. Appl. Opt. 1988, 27, 3669–3674. [Google Scholar] [CrossRef]
- Docchio, F.; Regondi, P.; Capon, M.R.; Mellerio, J. Study of the temporal and spatial dynamics of plasmas induced in liquids by nanosecond Nd:YAG laser pulses. 1: Analysis of the plasma starting times. Appl. Opt. 1988, 27, 3661–3668. [Google Scholar] [CrossRef] [PubMed]
- Feng, Y.; Qin, D.; Zhang, J.; Ma, C.; Wan, M. Acoustic signal characteristics of laser induced cavitation in DDFP droplet: Spectrum and time-frequency analysis. Bio-Med. Mater. Eng. 2015, 26, S423–S427. [Google Scholar] [CrossRef] [PubMed]
- Fujisawa, N.; Fujita, Y.; Yanagisawa, K.; Fujisawa, K.; Yamagata, T. Simultaneous observation of cavitation collapse and shock wave formation in cavitating jet. Exp. Therm. Fluid Sci. 2018, 94, 159–167. [Google Scholar] [CrossRef]
- Akhatov, I.; Lindau, O.; Topolnikov, A.; Mettin, R.; Vakhitova, N.; Lauterborn, W. Collapse and rebound of a laser-induced cavitation bubble. Phys. Fluids 2001, 13, 2805–2819. [Google Scholar] [CrossRef]
- Zhong, X.; Eshraghi, J.; Vlachos, P.; Dabiri, S.; Ardekani, A.M. A model for a laser-induced cavitation bubble. Int. J. Multiph. Flow 2020, 132, 103433. [Google Scholar] [CrossRef]
- Zhang, J. Effect of stand-off distance on “counterjet” and high impact pressure by a numerical study of laser-induced cavitation bubble near a wall. Int. J. Multiph. Flow 2021, 142, 103706. [Google Scholar] [CrossRef]
- Lee, S.J.; Theerthagiri, J.; Choi, M.Y. Time-resolved dynamics of laser-induced cavitation bubbles during production of Ni nanoparticles via pulsed laser ablation in different solvents and their electrocatalytic activity for determination of toxic nitroaromatics. Chem. Eng. J. 2022, 427, 130970. [Google Scholar] [CrossRef]
- Flannigan, D.J.; VandenBussche, E.J. Pulsed-beam transmission electron microscopy and radiation damage. Micron 2023, 172, 130970. [Google Scholar] [CrossRef]
- Lopez-Claros, M.; Dell’Aglio, M.; Gaudiuso, R.; Santagata, A.; De Giacomo, A.; Fortes, F.J.; Laserna, J.J. Double pulse laser induced breakdown spectroscopy of a solid in water: Effect of hydrostatic pressure on laser induced plasma, cavitation bubble and emission spectra. Spectrochim. Acta Part B-At. Spectrosc. 2017, 133, 63–71. [Google Scholar] [CrossRef]
- Phukan, A.; Nath, A. Influence of an external magnetic field on laser-induced plasma and cavitation bubbles in submerged targets. J. Laser Appl. 2023, 35, 012011. [Google Scholar] [CrossRef]
- Guo-cai, T.; Jian, L.; Yi-xin, H. Application of ionic liquids in hydrometallurgy of nonferrous metals. Trans. Nonferrous Met. Soc. China 2010, 20, 513–520. [Google Scholar] [CrossRef]
- Brujan, E.A.; Ikeda, T.; Matsumoto, Y. Jet formation and shock wave emission during collapse of ultrasound-induced cavitation bubbles and their role in the therapeutic applications of high-intensity focused ultrasound. Phys. Med. Biol. 2005, 50, 4797–4809. [Google Scholar] [CrossRef] [PubMed]
- Brujan, E.A.; Ikeda, T.; Matsumoto, Y. On the pressure of cavitation bubbles. Exp. Therm. Fluid Sci. 2008, 32, 1188–1191. [Google Scholar] [CrossRef]
- Rayleigh, L., VIII. On the pressure developed in a liquid during the collapse of a spherical cavity. Lond. Edinb. Dublin Philos. Mag. J. Sci. 1917, 34, 94–98. [Google Scholar] [CrossRef]
- Plesset, M.S.; Prosperetti, A. Bubble Dynamics and Cavitation. Annu. Rev. Fluid Mech. 1977, 9, 145–185. [Google Scholar] [CrossRef]
- Hamdan, A.; Noel, C.; Kosior, F.; Henrion, G.; Belmonte, T. Dynamics of bubbles created by plasma in heptane for micro-gap conditions. J. Acoust. Soc. Am. 2013, 134, 991–1000. [Google Scholar] [CrossRef]
- Liu, D.; Zhang, D.M. Vaporization and plasma shielding during high power nanosecond laser ablation of silicon and nickel. Chin. Phys. Lett. 2008, 25, 1368–1371. [Google Scholar]
Figure 1.
Laser-induced cavitation bubble testing platform.

Figure 2.
Signal collecting and testing equipment. (a) High-speed camera, (b) hydrophone, (c) oscilloscope.
Figure 2.
Signal collecting and testing equipment. (a) High-speed camera, (b) hydrophone, (c) oscilloscope.

Figure 3.
Confocal microscope.

Figure 4.
Evolution of laser-induced cavitation bubble with laser energy of 1.1 J.

Figure 5.
Evolution of laser-induced cavitation bubble with laser energy of 1.2 J.

Figure 6.
Evolution of laser-induced cavitation bubble with laser energy of 1.3 J.

Figure 7.
Evolution of laser-induced cavitation bubble with laser energy of 1.4 J.

Figure 8.
Evolution of laser-induced cavitation bubble with laser energy of 1.5 J.

Figure 9.
Variation in bubble diameter with time at different laser energies.

Figure 10.
Acoustic signals of laser-induced cavitation bubbles at different laser energies.

Figure 11.
Surface morphology of 7050 aluminum alloy sample after evolution of laser-induced cavitation bubble. (a) No laser; (b) 1.1 J; (c) 1.2 J; (d) 1.3 J; (e) 1.4 J; (f) 1.5 J.
Figure 11.
Surface morphology of 7050 aluminum alloy sample after evolution of laser-induced cavitation bubble. (a) No laser; (b) 1.1 J; (c) 1.2 J; (d) 1.3 J; (e) 1.4 J; (f) 1.5 J.

Figure 12.
Two-dimensional depth morphology analysis: (a) 1.1 J; (b) 1.2 J; (c) 1.3 J; (d) 1.4 J; (e) 1.5 J.
Figure 12.
Two-dimensional depth morphology analysis: (a) 1.1 J; (b) 1.2 J; (c) 1.3 J; (d) 1.4 J; (e) 1.5 J.
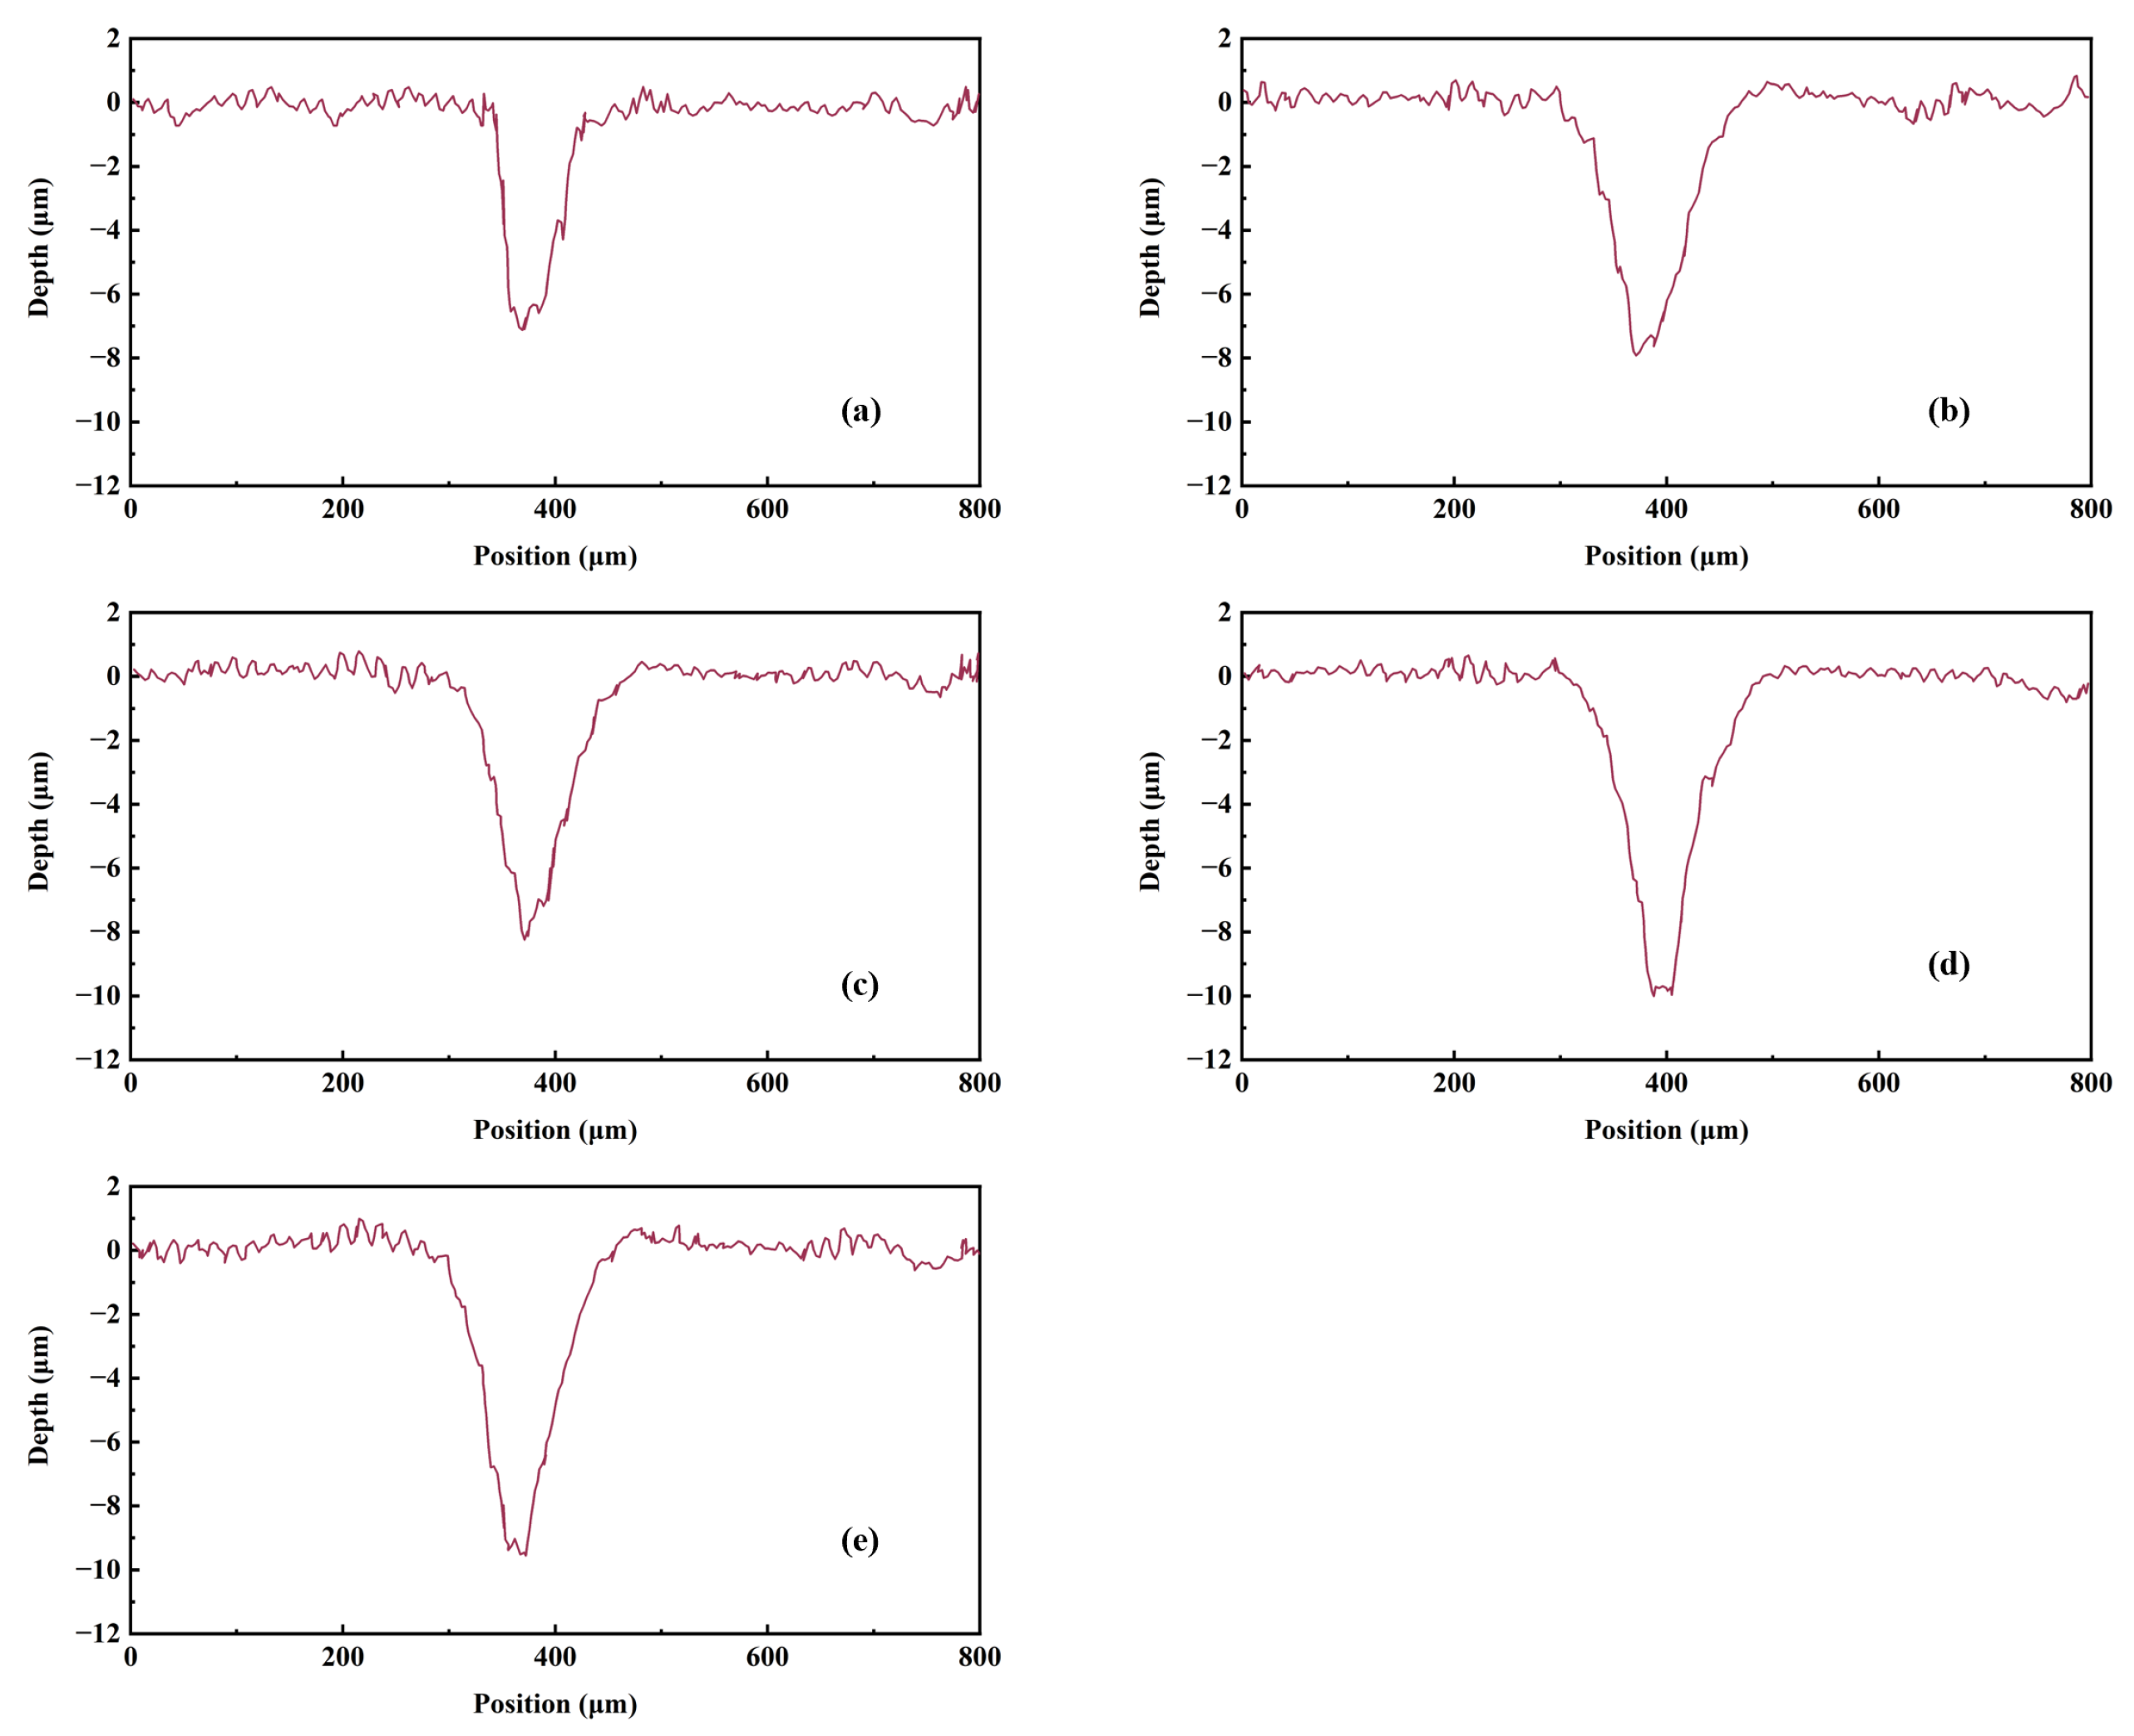
Figure 13.
Shock-wave diagram of plasma shielding during laser-induced cavitation bubble formation: (a) Transient explosion wave; (b) Oscillating wave; (c) Collapse shock wave; (d) Micro water jet.
Figure 13.
Shock-wave diagram of plasma shielding during laser-induced cavitation bubble formation: (a) Transient explosion wave; (b) Oscillating wave; (c) Collapse shock wave; (d) Micro water jet.

Table 1.
Physical and mechanical properties of 7050-T7451 aluminum alloy.
| Density | Elastic Modulus | Poisson Ratio | Yield Strength | Tensile Strength |
|---|---|---|---|---|
| 2780/ | 72 GPa | 0.33 | 435.7 MPa | 534.624 MPa |
Table 2.
Time and diameter of laser-induced cavitation bubble.
| Energy/J | 1.1 | 1.2 | 1.3 | 1.4 | 1.5 |
|---|---|---|---|---|---|
| First maximum diameter/mm | 6.02 | 6.16 | 6.86 | 7.00 | 6.86 |
| First maximum diameter time/s | 210 | 210 | 210 | 215 | 215 |
| First collapse time/s | 415 | 425 | 465 | 475 | 460 |
| Second maximum diameter/mm | 2.94 | 3.01 | 3.43 | 3.78 | 3.36 |
| Second maximum diameter time/s | 525 | 550 | 590 | 615 | 585 |
| Second collapse time/s | 635 | 640 | 705 | 715 | 700 |
Table 3.
Pressure of laser-induced cavitation bubbles.
| Energy/J | 1.1 | 1.2 | 1.3 | 1.4 | 1.5 |
|---|---|---|---|---|---|
| Peak 1/MPa | 10.8 | 11.3 | 14.2 | 15.0 | 11.7 |
| Peak 2/MPa | 4.3 | 4.8 | 6.3 | 7.2 | 6.8 |
Table 4.
Calculated pressure and measured pressure.
| Energy/J | 1.1 | 1.2 | 1.3 | 1.4 | 1.5 |
|---|---|---|---|---|---|
| Calculated pressure/MPa | 11.4 | 12.1 | 14.7 | 15.2 | 12.7 |
| Measured pressure/MPa | 10.8 | 11.3 | 14.2 | 15.0 | 11.7 |
Disclaimer/Publisher’s Note: The statements, opinions and data contained in all publications are solely those of the individual author(s) and contributor(s) and not of MDPI and/or the editor(s). MDPI and/or the editor(s) disclaim responsibility for any injury to people or property resulting from any ideas, methods, instructions or products referred to in the content. |
© 2024 by the authors. Licensee MDPI, Basel, Switzerland. This article is an open access article distributed under the terms and conditions of the Creative Commons Attribution (CC BY) license (https://creativecommons.org/licenses/by/4.0/).
Share and Cite
MDPI and ACS Style
Zhou, R.; Li, K.; Cao, Y.; Shi, W.; Yang, Y.; Tan, L.; Hu, R.; Jin, Y. Experimental Study of Laser-Induced Cavitation Bubbles near Wall: Plasma Shielding Observation. Water 2024, 16, 1324. https://doi.org/10.3390/w16101324
AMA Style
Zhou R, Li K, Cao Y, Shi W, Yang Y, Tan L, Hu R, Jin Y. Experimental Study of Laser-Induced Cavitation Bubbles near Wall: Plasma Shielding Observation. Water. 2024; 16(10):1324. https://doi.org/10.3390/w16101324
Chicago/Turabian StyleZhou, Rui, Kangwen Li, Yupeng Cao, Weidong Shi, Yongfei Yang, Linwei Tan, Ranran Hu, and Yongxin Jin. 2024. "Experimental Study of Laser-Induced Cavitation Bubbles near Wall: Plasma Shielding Observation" Water 16, no. 10: 1324. https://doi.org/10.3390/w16101324
Note that from the first issue of 2016, this journal uses article numbers instead of page numbers. See further details here.