

Analysis of the Coupling Coordinated Development of the Water-Soil-Energy-Carbon System in Northwest China
1
Policy Research Center for Environment and Economy, Ministry of Ecology and Environment, Beijing 100029, China
2
Institute of Energy Conservation and Environmental Protection, China Center for Information Industry Development, Beijing 100036, China
*
Authors to whom correspondence should be addressed.
Land 2024, 13(5), 715; https://doi.org/10.3390/land13050715
Submission received: 8 March 2024
/
Revised: 1 May 2024
/
Accepted: 3 May 2024
/
Published: 20 May 2024
(This article belongs to the Special Issue Balancing Ecosystems and Renewable Energy in Landscapes)
Abstract
:The intricate interplay between water resources, land resources, energy systems, and carbon emissions has emerged as a prominent discourse in academic research. Nonetheless, there remains a dearth of comprehensive research dedicated to fostering environmentally friendly and low-carbon development through systematic integration and coordination efforts. This study aimed to fill this gap by integrating the coupling mechanism of the Water-Land-Energy-Carbon (WLEC) system, thereby constructing an evaluation index framework that assesses coordinated developments in Northwest China’s WLEC system. It scrutinizes the security levels within the Water-Land-Energy (WLE) subsystem while conducting quantitative analyses on the degrees of coupling coordination within the WLEC systems, alongside their associated hindering factors. The preliminary findings were as follows: Firstly, the safety development within the WLE system demonstrates a positive trend across Northwest China, with notable advancements primarily observed in the Qinghai and Gansu provinces. In 2021, all five Northwestern provinces exhibited moderate levels of safe development, except for the Qinghai province, which transitioned from moderate to robust. Secondly, the coupling coordination degree of the WLEC system across the five provinces has consistently illustrated an upward trajectory over the years. However, as of 2021, the system remains in a state characterized by marginal disorder. Notably, the Qinghai and Gansu provinces have shown particularly encouraging upward trends, with the Shaanxi province also making notable progress. Conversely, Xinjiang has declined since 2017 due to negative interactions between the subsystems of water, soil, energy, and carbon emissions. Thirdly, spatial variations exist in the distribution patterns between the provinces regarding the influence of obstructing factors on indicators related to coupled coordinated development, such as per capita arable land area, per capita energy consumption, per capita carbon emissions, per capita construction land area, and the proportion of groundwater water in the total amount of water supply, which demonstrated an increasing trend. These findings carry significant practical implications for actively and steadily promoting carbon peaking and carbon neutrality in Northwest China.
1. Introduction
Water, land, and energy constitute the fundamental components that are intricately interconnected with human activities within the Earth’s surface system [1]. These elements demonstrate the interdependencies and reciprocal influences through complex supply–demand dynamics between human socio-economic activities and natural ecosystems, resulting in substantial carbon emissions [2]. In the light of the escalating demand for water, land, and energy in both the economy and society, coupled with the imperative to actively address climate change, research on the interconnectedness of “Water-Land-Energy-Carbon” (WLEC) has emerged as a prominent subject in academic research [3,4].
The initial focus of the related research was on the “Water-Energy-Food” (WEF) nexus [5,6,7], highlighting the unpredictable consequences of policymaking based solely on a single resource due to the intricate and interconnected relationships between water, energy, and food [8]. Subsequently, some scholars have also linked the WEF nexus system with ecosystems [9] and socioeconomic development [10,11]. With the heightened global attention on climate change, new perspectives have emerged, connecting water, land, and energy to this complex issue. In recent years, an increasing number of studies have examined the relationship between carbon emissions and water and land resources [12,13,14]. On one hand, researchers have unveiled that carbon emissions from the water system encompass various aspects, such as water extraction, supply, utilization, drainage, and sewage treatment [15]. For instance, Wang et al. discovered that China’s social water recycling system has become more energy-intensive; specifically, the carbon emission intensity in water supply and drainage increased by 23.3% and 78.6%, respectively, from 2009 to 2021 [16]. Additionally, research has honed in on specific areas ‘and watersheds’ water-energy-carbon systems revealing an improvement in the coupling coordination over time but also an increase in the spatial heterogeneity [12,17]. On the other hand, the relationship between land use and carbon emissions has emerged as a primary concern.
Several researchers have delved into the impacts of land use on carbon emissions or balance on various regional scales, including on national [18,19], provincial [20,21], and urban levels [12,21,22]. They have found that carbon processes are significantly influenced by land use through human energy consumption and land management practices. For instance, Friedlingstein et al. [23] disclosed that the changes in land use accounted for 19% of global carbon emissions from 1959 to 2019. Moreover, specific types of land use, such as agriculture [24], industry, residential areas, transportation infrastructure, and others, have been identified as significant sources of carbon emissions; meanwhile, woodlands and grasslands serve as crucial carbon sinks [19,21,25].
As the research has advanced, scholars have gained a deeper understanding of the WLEC system, recognizing its significance in elucidating the intricate interplay between human activities and nature. This investigation also offers novel insights for evaluating the environmental impacts of human activities. Figure 1 depicts a schematic diagram, illustrating the coupling mechanism between the four subsystems of WLEC: water, land, energy, and carbon emissions [5,14,26]. Simultaneously, practical studies are emerging in this domain [14,26,27,28], encompassing research focused on agriculture and industry [29,30] highlighting excessive land resource input as a pivotal factor influencing agricultural carbon emission efficiency and excessive water resource input as a key determinant of industrial carbon emissions. Furthermore, relevant studies at the regional and watershed levels have been conducted.
While prior research has established a consensus on the interrelationships between water resources, land, energy, and carbon emissions [14], there remains a gap in studies examining the degree of integrated and coordinated development within these four subsystems and identifying potential obstacles. Currently employed methodologies include whole life-cycle assessment [31], energy analysis [32], the environmental input–output model [17,18,28,33,34], system dynamics, the LMDI model [30], flux observation and simulation [35], systems analysis [26]. However, limited attention has been given to constructing a comprehensive WLEC (Water-Land-Energy-Carbon) system safety development evaluation index, encompassing all aspects and processes to examine the coupling and coordinated development level of the water, soil, energy, and carbon subsystems, as well as their inhibiting factors. Therefore, enhancing collaborative research on water resource exploitation about land use practices and energy consumption patterns leading to carbon emissions is crucial. This not only facilitates understanding of their intricate coupling mechanisms but also holds significant implications for comprehending the efficiency and capacity of resource exploitation, while promoting comprehensive investigations into the impact of regional multi-resource exploitation on carbon emission effects [29]. Particularly for the Northwest region under study here, no relevant research has been conducted yet. Hence, this study aims to address this existing gap.
The coupling relationship between water resources, land use, energy consumption, and carbon emissions in Northwest China is crucial for promoting regional sustainable development, given its significance as a key energy base in the country. However, there exists a substantial lack of coordination in the allocation of water resources, land resources, and energy within this region, which poses a constraint on achieving high-quality development of the economy and society [36]. Although some progress has been made in promoting the coupling relationship of the WLEC system in Northwest China, particularly regarding water resource utilization, land use change, renewable energy development, optimization of energy consumption structure, and research on ecosystem carbon sink function; there is a need for a multi-element coupling perspective to explore the pathway towards green and low-carbon development. Therefore, addressing the challenge of promoting efficient resource utilization and synergistic reduction of carbon emissions from a multi-factor coupling perspective becomes imperative to facilitate the comprehensive green transformation of socio-economic development in Northwest China.
This study integrated the coupling mechanism of the WLEC system and established an evaluation index system for promoting coordinated development in Northwest China. Utilizing this evaluation index system, a quantitative analysis was conducted to assess the level of sustainable development within the “Water-Land-Energy” (WLE) system and examine the interrelationships between the water, land, and energy subsystems, and the carbon emission subsystems. Additionally, a diagnostic analysis was performed to identify the degree of coupling coordination development and the obstacles hindering coordinated development within the WLEC system coupling. The research findings presented herein offer practical guidance for actively and steadily achieving the targets related to carbon emission peak and carbon neutrality, while comprehensively ensuring water resource security, food security, and energy security in Northwest China.
2. Method and Data Sources
2.1. Method
2.1.1. Construction of Evaluation Index System for Assessing the Coordinated Development of WLEC System
The evaluation index system for assessing the coordinated development of the WLEC system in Northwestern China comprised four primary indicators, thirteen secondary indicators, and twenty-four specific metrics (refer to Table 1). The primary indicators encompassed four subsystems: water, land, energy, and carbon emissions. The water subsystem encompassed five secondary indicators: water supply, water utilization, water conservation and efficiency, sewage treatment, and water use efficiency. The land subsystem included four secondary indicators: land supply, land output, expansion of greening and carbon sinks, and protection and restoration. The energy subsystem consisted of three secondary indicators: energy supply, energy consumption, and energy use efficiency. Meanwhile, the carbon emission subsystem solely focused on carbon emission intensity. When selecting specific indicators, the reasonability and typicality were taken into account along with the data availability and forward-looking nature.
The weights of these metrics reflected their respective contributions towards achieving a coordinated development level, which determined the effectiveness and practicality of the evaluation indicator system. Considering the disparities in resource endowment between the five provinces, we employed the entropy weight method [37] to calculate the province-specific weights for each indicator. The resulting weights are presented in Table 1. Amongst the five provinces, Qinghai and Gansu exhibited higher weights for the land and water subsystems, while Shaanxi, Ningxia, and Xinjiang demonstrated a greater emphasis on the land and energy subsystems. Additionally, the carbon emission subsystems accounted for a relatively smaller proportion across all five provinces.
Before assessing the coordinated development of the WLEC systems for the proposed five provinces, each indicator was normalized using a maximum and minimum value normalization method. The indicator properties are listed in Table 1 and the corresponding formulas for positive, negative, and moderate indicators are shown in Equation (1).
where, represents the normalized value of the indicator i, denotes the original value of the indicator i, and and represent the minimum and maximum values of this indicator, respectively. Additionally, signifies the appropriate value of the respective indicator. In this study, the value of the per capita arable land area was 2.6, which was the global average arable land area in a unit of one thousand hectares per one million people in 2020. For the per capita construction land area, took the value of 100, because China had a requirement of controlling the per capita urban land target strictly within 100 square meters [38].
2.1.2. Evaluation of Safety Development Level within the WLE System
The safety development index of the WLE system (WLESDI) comprised three subsystem sub-indices: the water subsystem sub-index (WSDI), the land subsystem sub-index (LSDI), and the energy subsystem sub-index (ESDI). The scores for each sub-index, as well as the overall safety development index, were calculated using Equation (2):
where, , , and represent the safety development indices of water, land, and energy, respectively. , , and are the specific indicator values of water, land, and energy after being normalized according to Table 1 and Equation (1). , , and represent the indicator weights of the water, land, and energy systems, respectively, which are a certain ratio of weights in Table 1 to ensure that the sum of the weights for the water, land, or energy systems is 1. The values of the WLESDI ranged from 0 to 100. Furthermore, WLESDI was categorized into six levels: weak, weak–moderate transition, moderate, moderate–strong transition, strong, and very strong (as illustrated in Table 2).
2.1.3. Correlation Analysis
After the calculation of the safe development index of the water, land, and energy subsystems, namely WSDI, LSDI, and ESDI, the interrelationships between water, land, and energy, as well as the WLE system and the carbon emission subsystem were analyzed using Pearson’s correlation. The carbon emission values were calculated as the weighted sum of the specific indicators, which were recalculated to ensure that their sum was 1, using a similar method to the water, land, and energy subsystems.
where, represents the carbon emission subsystem sub-index; signifies the normalized value of these indicators according to Table 1 and Equation (1). denotes the weight of the indicators layer with a sum of 1.
2.1.4. Coupling Coordination Model
The coupling degree of coordination [39] reflected the level of coupling and coordinated development between the four subsystems. The formula is presented as follows:
where denotes the coupling degree of coordination ranging from 0 to 1; a value closer to 0 indicates a weaker coordinated interaction influence between the subsystems, while a higher value suggests a stronger coordination. represents the coupling degree with values between 0 and 1; a larger value signifies a higher level of coupling. stands for the integrated score of each subsystem. , , , are the normalized indicator values obtained by multiplying the indicators with their respective weights (the sum of the weights for each subsystem equals to 1) for the water, land, energy, and carbon emission subsystems, respectively. The coupled and coordinated development types within the water, soil, energy, and carbon systems were classified into ten levels [40] (Table 3).
2.1.5. Obstacle Degree Model
The obstacle degree model [41] was employed to diagnose the primary factors constraining the coordinated development of these four subsystems in Northwest China and provided a reference for enhancing their coupling and coordination relationship. The calculation formula is as follows:
where represents the obstacle degree that reflects the influence level of each indicator on the coupled and coordinated development level of these four subsystems; denotes the contribution degree of factor i; signifies the deviation degree of indicator i; while represents the normalized value of indicator i.
2.2. Data Sources
The data utilized in this study primarily originated from various sources, including the China Statistical Yearbook, the China Urban Statistical Yearbook, the China Urban Construction Statistical Yearbook, the China Environmental Statistical Yearbook, the China Energy Statistical Yearbook, and the China Rural Statistical Yearbook. Additionally, energy-related data were mainly collected from the provincial statistical yearbooks of five provinces in Northwest China. The proportions of renewable energy generation and terminal energy in total energy consumption were calculated based on the Energy Balance Sheet of these five provinces. It is worth noting that the carbon emissions calculation followed the methodology proposed by Wang et al. [42]. Detailed data and sources can be found in Table 4. The study period spanned from 2010 to 2021.
3. Results
3.1. Dynamic Changes in the Safety Development Level of the WLE System
From 2010 to 2021, the safety development indices (WLESDI) for the WLE system of the five provinces in Northwest China exhibited an increasing trend, as shown in Figure 2. Notably, Qinghai and Gansu experienced a higher rate of increase than the other provinces, with their WLESDI scores rising from 25 and 20 in 2010 to 70 and 66 in 2021, respectively. Ningxia, Xinjiang, and Shaanxi had relatively high original safety development indices within the WLE system; however, their values have fallen behind those of the other provinces since 2017.
Further analysis of Northwest China based on the sub-indices for each subsystem (Figure 3) revealed consistent increases across all three subsystems during the study period. Specifically, the land subsystem sub-index rose from a score of 9 in 2010 to a value of 25 in 2021. The values of the water subsystems and energy subsystems reached almost twice of their original values (with the value of the water subsystem increasing from 9 in 2010 to 20 in 2021 and the value of the land subsystem increasing from 10 to 22). However, the improvement observed within the water subsystem has been relatively limited since 2017.
The average value of the WLESDI in Northwest China reached 67 in 2021. The provinces ranked according to WLESDI values in descending order were Qinghai (70.46), Xinjiang (66.71), Shaanxi (66.68), Gansu (65.67), and Ningxia (64.06). According to the criteria in Table 3, the WLE system in Qinghai achieved a relatively high level of moderate–strong transition, while the other four provinces remained at a moderate level.
3.2. Correlation between the WLE System and the Carbon Emission Subsystem
We investigated the correlation between the water, land, and energy subsystems and the carbon emission subsystem (Figure 4). Throughout the study period, a positive correlation was observed between the water, land, and energy subsystems and the carbon emission subsystem in the Qinghai and Gansu provinces, indicating that promoting safety development of these subsystems led to enhanced carbon emission efficiency. The water, land, and energy subsystems, and the carbon emission subsystem of Shaanxi and Ningxia were not synchronized. Specifically, the water and carbon emission subsystems in Shaanxi exhibited a negative correlation, while the water, land, and carbon emission subsystems in Ningxia also showed a negative correlation. In addition, all the water, land, and energy subsystems, and the carbon emission subsystem in Ningxia displayed a negative correlation indicating a significant improvement in green and low-carbon economic development. Similarly, Xinjiang’s water, land, and energy subsystems, and carbon emission subsystem were negatively correlated. The WLE system exhibited a positive correlation with the carbon emission subsystem in Shaanxi, Gansu, and Qinghai, whereas Ningxia and Xinjiang demonstrated a negative correlation.
3.3. Coupling Coordination Degree of the WLEC System
The coupling coordination degree of Qinghai, Gansu, and Shaanxi demonstrated a consistent increase from 2010 to 2021 (Figure 5), ultimately reaching a relatively high level of low coordination by 2021. Among them, the Qinghai province was close to a moderate coordination level. The coupling coordination degree of Ningxia and Xinjiang was expected to experience a significant increase by 2021, ultimately achieving an unoptimistic level of low coordination. However, it should be noted that the current trend suggested a slight increase for both provinces.
- (Note: Equations (3)–(5) only consider U1, U2, and U3, and the corresponding weights a, b, and c are treated as equal weights)
The improvement in the coupled and coordinated development levels between the four subsystems (water, land, energy, and carbon emissions) varied between the provinces (Figure 6). Notably, Qinghai demonstrated a significant increase from 0.24 in 2010 to 0.46 in 2021, indicating a relatively low pressure on resource demand for economic and social progress. Gansu, Shaanxi, and Ningxia followed with fluctuating changes over certain years. Xinjiang outperformed the other four provinces in 2012–2016; however, it has experienced a decline since 2017. By 2021, all five provinces were expected to demonstrate moderate dislocation–evolution characteristics. Throughout the study period, a noticeable upward trend in the level of coordinated development between the water, land, and energy systems was observed in Northwest China.
3.4. The Obstacles to the Coupling Coordinated Development of the WLEC System
The main obstacles affecting the coupled and coordinated development of the five provinces in 2021 (obstacle degree ≥ 0.10) are illustrated in Figure 7. Among them, the per capita energy consumption emerged as the primary obstacle factor for all five provinces. Per capita carbon emissions pose a significant challenge for Gansu, Shaanxi, Ningxia, and Xinjiang. The scarcity of per capita arable land area hindered progress in Qinghai, Gansu, Shaanxi, and Xinjiang. Additionally, the per capita construction land area acted as a major impediment for Qinghai, Gansu, and Shaanxi. Furthermore, carbon emissions per unit of construction land area, water reuse rate, per capita water resources, agricultural chemical fertilizer, and pesticide use per unit of arable land area also contributed to hindrances in multiple provinces. The mean values of the obstacle degrees for each indicator in the five provinces (Figure 8) showed a consistent upward trend for indicators such as per capita arable land area, per capita energy consumption, per capita carbon emissions, per capita construction land area, and the proportion of groundwater in the total amount of water supply from 2010 to 2021.
4. Discussion
4.1. About the Safety Development Level of the WLE System
The WLESDI for the five provinces in Northwest China has been on an upward trajectory, a trend that aligns with the escalating index of the energy subsystem as reported by Xu et al. [43]. In their comprehensive evaluation of the safety development indices of the Water-Land-Energy Nexus across China’s 31 provinces, Xu et al. observed that within the Northwest region, it was specifically the water subsystem safety development index in Xinjiang that exhibited a rise. This increase was attributed to the focus of the safety development indicators on water consumption, whereas this study also encompassed indicators related to water reuse and sewage treatment. Furthermore, the provinces of Qinghai and Gansu have demonstrated a more pronounced growth in their safety development indices compared with the other provinces, a phenomenon largely attributed to advancements in their land and water subsystems. Prior research has documented an enhancement in the efficiency of cultivated land use in Qinghai from the year 2005 to 2017, and a sustainable utilization of water resources in Gansu from 2006 to 2015 [44,45].
Ningxia, Xinjiang, and Shaanxi initially exhibited relatively high original safety development indices within the WLE system but have been outpaced by Qinghai and Gansu since 2017. In the cases of Ningxia and Xinjiang, a decline in the per capita water resources and sewage treatment rates has contributed to a downturn in the water subsystem safety development indices. Conversely, in Shaanxi, the safety development indices of the land subsystem have been negatively impacted by a decreasing trend in the per capita arable land area.
4.2. About the Coupling Coordination Degree of the WLEC System
The findings on the coupling and coordinated development of the WLEC system in this study were congruent with other research in various regions within China, reflecting a progressive evolution towards a higher level of coupling over time [12,46]. Notably, the upward trajectory of the coupling coordination degree was especially pronounced in Qinghai and Gansu. This trend was supported by the positive interplay observed between the water, land, and energy subsystems, and the carbon emission subsystem in these provinces. It suggested that both Qinghai and Gansu were actively fostering sustainable development across these areas while also enhancing the efficiency of carbon emissions. By integrating the insights from Ye et al. [47] and Ren et al. [48], it became clear that the harmonization between these four subsystems in Qinghai and Gansu was on an upward trajectory. The expectation is for these provinces to transition from a state of marginal disorder and marginal coordination to one marked by low coordination, moderate coordination, or even good coordination.
Despite the positive correlation between the WLE system and the carbon emission subsystem, the water resources subsystem was found to have a negative correlation with the carbon emission subsystem. This dynamic somewhat impeded the integrated and coordinated development of the WLEC system, primarily due to the scarcity of natural water resources. The research by Jiang Chuan et al. [49] also indicated that the water resources have become a critical bottleneck in the urbanization development of the Shaanxi province. In contrast, since 2017, Xinjiang has been observed to lag, which can be linked to the negative correlation between its water, soil, and energy subsystems and the carbon emission subsystem. This suggests that during a period of rapid development, there was a lack of emphasis on improving carbon emission efficiency in tandem with water resource management and the development of land and energy resources. Moreover, it underscores the need for enhanced coupling and coordination between the water resources, land use, and energy systems in Xinjiang. The research by Wang et al. [50] also revealed weak correlations between Xinjiang’s industrial water systems, energy systems, and carbon systems, indicating a lack of synergistic effects and the absence of control-dependence relationships. In essence, the management of water resources, land resources, energy consumption, and carbon emissions in Xinjiang has historically been fragmented, leading to potential imbalances within the WLEC system.
Interestingly, while the coupling coordination degree of the WLE system in Ningxia was less than that in Xinjiang, the WLEC system’s degree surpassed Xinjiang’s. This discrepancy can be attributed to the positive correlation between Ningxia’s energy subsystem and carbon emission subsystem. Specifically, the robust development of Ningxia’s energy subsystem has led to improvements in carbon emission efficiency, thanks to increased clean energy utilization and enhanced energy efficiency, while maintaining a stable energy supply. It is important to note that the entire region is still categorized as being of a marginal disorder type, indicating a significantly lower level of integrated and coordinated development compared with the WLE subsystems. This situation underscores the increased pressure on Northwest China to reduce carbon emissions while striving for peak carbon neutrality. Consequently, there is an imperative to explore and establish a systematic approach towards a green, low-carbon, and high-quality development path for the region.
4.3. About the Obstacles to the Coupling Coordinated Development of the WLEC System
The current challenges impeding the integrated and coordinated development of the WLEC system in Northwest China are multifaceted, encompassing issues related to energy consumption, the efficacy of carbon reduction measures, the availability of land, the supply of water resources, conservation strategies, and the efficient use of these resources. These insights are corroborated by the weighted results derived from the entropy weight method applied to the indicators across the five provinces in this study.
Over the course of the research period, there was a notable increase in the degree of hindrance posed by key indicators, such as per capita arable land area, per capita energy consumption, per capita carbon emissions, per capita construction land area, and the proportion of groundwater in the total water supply. This upward trend suggested that these specific indicators were increasingly becoming more constraining factors for the coupled and coordinated development of the WLEC system in Northwest China. The expansion of the economic output and population have led to an escalating demand for water, soil, and energy, thereby intensifying the pressure to reduce carbon emissions [51]. Conversely, indicators like the wastewater treatment rate, the water output rate, per capita energy production, and the energy output rate have demonstrated a decreasing trend in their degree of obstruction. This reduction in their restrictive impact indicates a positive shift towards the coupling and coordinated development of the WLEC system, which can be credited to the national focus on ecological and environmental protection initiatives. There is a particular emphasis on improving the efficiency of water and energy use. Furthermore, the accelerated development of renewable energy sources, coupled with a reduction in the intensity of energy consumption, has not only enhanced carbon emission efficiency but also facilitated a higher degree of integration and coordination within the WLEC system.
4.4. Limitations and Future Research
The present study, while insightful, has certain limitations that warrant recognition. Firstly, the reliance on data from provincial-level statistical yearbooks imposed constraints on the level of detail and the temporal scope of the analysis conducted. This limitation suggests that more granular and possibly more current data could provide a richer understanding of the subject matter. Secondly, the research methodology employed in this paper, although indicative of the safe and coordinated development within the WLEC system, may not exhaustively encapsulate the nuanced interplay occurring within the subsystems. The complexity of the WLEC interactions can vary significantly across different sectors, which points to a need for future research to concentrate on particular domains, such as industry and agriculture. By doing so, more targeted models can be developed to simulate the WLEC interactions within various human activities and gain a deeper understanding of the processes at play within distinct fields. Subsequent studies could also aim to model the complex WLEC interaction processes within the context of specific policies. This approach could facilitate the simulation and forecasting of future trends in resource utilization intensity, energy utilization efficiency, and carbon emission efficiency. The development of such refined models could prove instrumental in guiding researchers towards the formulation of more precise and actionable strategies for green and low-carbon development. In turn, this would not only enhance our ability to address the challenges at hand but also deepen our grasp of the principles underlying sustainability. By acknowledging these limitations and building upon them, future work can continue to push the boundaries of knowledge in this critical area of study.
5. Conclusions
(1) The security development level of the WLE system in five provinces in Northwest China demonstrated a noticeable upward trend from 2010 to 2021, with Qinghai and Gansu experiencing the most significant improvements. However, Ningxia, Xinjiang, and Shaanxi have lagged behind since 2017, with different subsystems posing limitations on their safety development. In Xinjiang and Ningxia, the water subsystem was the primary constraint, while in Shaanxi, it was the land subsystem. The WLE system in Qinghai has achieved a relatively high level of moderate–strong transition, while the other four provinces remained at a moderate level.
(2) The coupling coordination degree of the WLEC system in these five provinces fluctuated but generally increased. Qinghai and Gansu showed the most noticeable improvements, with a positive correlation between the water, land, and energy subsystems, and the carbon emission subsystems. Shaanxi followed, albeit with restrictions due to negative correlations between the water subsystem and the carbon emission subsystem. Xinjiang’s backward trend since 2017 was attributed to negative correlations between the water, land, and energy subsystems, and the carbon emission subsystem. Ningxia’s coupling coordination degree is better than Xinjiang’s, mainly due to a positive correlation between the energy subsystem and the carbon emission subsystem. It is important to note that the entire region is still categorized as being of a marginal disorder type.
(3) During the study period, the obstacle factors affecting the coupling and coordinated development of the WLEC system in Northwest China exhibited dynamic changes. The indicators such as per capita cultivated land area, per capita energy consumption, per capita carbon emission, per capita construction land area, and the groundwater supply ratio demonstrated an increasing trend in their obstacle degrees. Spatial variations exist the provinces regarding the main obstacle factors and their respective degrees of obstruction. These differences were significantly influenced by obstacles such as per capita energy consumption, per capita carbon emission, per capita cultivated land area, and per capita construction land area.
The WLEC system in Northwest China is currently characterized as being of a marginal disorder type. In the pursuit of carbon peak and carbon neutrality, it is imperative for Northwest China to explore and establish a systematic regional pathway towards green, low-carbon, and high-quality development. This entails the optimal management of multifactor resources from a multifactor coupling perspective, enhancing the overall planning and system integration of water resources, land resources, and energy. Furthermore, it is crucial to effectively coordinate and promote the efficient utilization of regional resources, as well as carbon emission reduction efforts, in order to achieve positive synergies while minimizing negative impacts.
Author Contributions
Conceptualization, M.W., X.F. and L.L; Methodology, M.W., Y.A., R.Y. and X.F.; Investigation, M.W. and X.S.; Writing—Original Draft, M.W.; Writing—Review & Editing, Y.A., R.Y., X.F. and L.L.; Funding Acquisition and Supervision, L.L. All authors have read and agreed to the published version of the manuscript.
Funding
This work was supported by the National Natural Science Foundation of China under Grant Number 42107502.
Institutional Review Board Statement
Not applicable.
Informed Consent Statement
Not applicable.
Data Availability Statement
Data derived from public domain resources.
Conflicts of Interest
The authors declare no conflicts of interest.
References
- Zhao, R.Q.; Li, Z.P.; Han, Y.P.; Milind, K.; Zhang, Z.P.; Ding, M.L. The coupling interaction mechanism of regional water-land-energy-carbon system. Acta Geogr. Sin. 2016, 71, 1613–1628. (In Chinese) [Google Scholar]
- Wu, Y.Z.; Deppermann, A.; Havlík, P.; Frank, S.; Ren, M.; Zhao, H.; Ma, L.; Fang, C.; Chen, Q.; Dai, H.C. Global land-use and sustainability implications of enhanced bioenergy import of China. Appl. Energy 2023, 336, 120769. [Google Scholar] [CrossRef]
- Engstrom, R.E.; Destouni, G.; Howells, M.; Ramaswamy, V.; Rogner, H.; Bazilian, M. Cross-scale water and land impacts of local climate and energy policy a local Swedish analysis of selected SDG interactions. Sustainability 2019, 11, 1847. [Google Scholar] [CrossRef]
- Holmatov, B.; Hoekstra, A.Y.; Krol, M.S. Land, water and carbon footprints of circular bioenergy production systems. Renew. Sustain. Energy Rev. 2019, 111, 224–235. [Google Scholar] [CrossRef]
- Sun, C.Z.; Wei, Y.Q.; Zhao, L.S. Co-evolution of water-energy-food nexus in arid areas: Take Northwest China as an example. J. Nat. Resour. 2022, 37, 320–333. (In Chinese) [Google Scholar] [CrossRef]
- Daher, B.; Mohtar, R.H. Water-energy-food (WEF) Nexus Tool 2.0: Guiding integrative resource planning and decision-making. Water Int. 2015, 40, 748–771. [Google Scholar] [CrossRef]
- Li, Y.T.; Wang, Y.H.; Liu, Z.M. Research on the Coupling Coordination Degree of Chinese Cities’ Water-Energy-Food Nexus System and Influencing Factors. J. Ind. Technol. Econ. 2023, 42, 97–105. (In Chinese) [Google Scholar]
- Hoff, H. Understanding the Nexus. In Background Paper for the Bonn 2011 Conference: The Water, Energy and Food Security Nexus; Stockholm Environment Institute: Stockholm, Sweden, 2011. [Google Scholar]
- Wu, Y.T.; Guo, L.D.; Jing, P.R.; Huang, F.; Wang, H.X. Coupling relationship and spatiotemporal differentiation of the water-energy-foodecology nexus in five Central Asian countries. Arid. Zone Res. 2023, 40, 573–582. (In Chinese) [Google Scholar]
- Anez, S. Data-driven quantification of the global water-energy-food system. Resour. Conserv. Recycl. 2018, 133, 179–190. [Google Scholar]
- Hao, L.G.; Yu, J.J.; Wang, P.; Han, C.H. Analysis of the water-energy-food nexus system for sustainable development and its research framework. Prog. Geogr. 2023, 42, 173–184. (In Chinese) [Google Scholar] [CrossRef]
- Liu, J.; Pu, L.; Huang, L.; Shi, T. Research on the Coupling Evaluation and Driving Factors of Water–Energy–Carbon in the Yellow River Basin. Water 2023, 15, 2377. [Google Scholar] [CrossRef]
- Zhao, R.Q.; Yu, Q.; Xiao, L.G.; Sun, J.; Luo, H.L.; Yang, W.J.; Chuai, X.W.; Jiao, S.X. Carbon emissions of urban water system based on water-energy-carbon nexus. Acta Geogr. Sin. 2021, 76, 3119–3134. (In Chinese) [Google Scholar]
- Jiang, W.Y.; Zeng, Z.X.; Zhang, Z.Y. China’s Industrial and Agricultural Carbon Emission Efficiency and Reduction Potential Considering the Water-Land-Energy-Carbon Nexus. Chin. J. Environ. Manag. 2020, 12, 120–129. (In Chinese) [Google Scholar]
- Ahmad, S.; Jia, H.F.; Chen, Z.X.; Li, Q.; Xu, C.Q. Water-energy nexus and energy efficiency: A systematic analysis of urban water systems. Renew. Sustain. Energy Rev. 2020, 134, 110381. [Google Scholar] [CrossRef]
- Wang, J.H.; Zhu, Y.N.; Li, L.H.; Li, J.X.; Jiang, S.; He, G.H. Water–Energy–Carbon Nexus of Social Water Cycle System and Low-Carbon Regulation Strategy. Strateg. Study CAE 2023, 25, 191–201. (In Chinese) [Google Scholar] [CrossRef]
- Wang, B.Q.; Xiao, J.H. Water-energy-carbon nexus in Yangtze River Economic Belt’s inter-provincial trade. J. Econ. Water Resour. 2023, 41, 47–54, 61. (In Chinese) [Google Scholar]
- Tian, P.P.; Lu, H.W.; Reinout, H.; Li, D.; Zhang, K.L.; Yang, Y.Y. Water-energy-carbon nexus in China’s intra and inter-regional trade. Sci. Total Environ. 2022, 806, 150666. [Google Scholar] [CrossRef] [PubMed]
- Lai, L.; Huang, X.J.; Yang, H.; Chuai, X.W.; Zhang, M.; Zhong, T.Y.; Chen, Z.G.; Chen, Y.; Wang, X.; Thompson, J.R. Carbon emissions from land-use change and management in China between 1990 and 2010. Sci Adv. 2016, 2, e1601063. [Google Scholar] [CrossRef]
- Zhang, C.; Tian, H.; Chen, G.; Chappelka, A.; Xu, X.; Ren, W.; Hui, D.; Liu, M.; Lu, C.; Pan, S.; et al. Impacts of urbanization on carbon balance in terrestrial ecosystems of the Southern United States. Environ. Pollut. 2012, 164, 89–101. [Google Scholar] [CrossRef]
- Ali, G.; Nitivattananon, V. Exercising multidisciplinary approach to assess interrelationship between energy use, carbon emission and land use change in a metropolitan city of Pakistan. Renew. Sustain. Energy Rev. 2012, 16, 775–786. [Google Scholar] [CrossRef]
- Zhao, R.; Huang, X.; Liu, Y.; Zhong, T.; Ding, M.; Chuai, X. Carbon emission of regional land use and its decomposition analysis: Case study of Nanjing City, China. Chin. Geogr. Sci. 2015, 25, 198–212. [Google Scholar] [CrossRef]
- Friedlingstein, P.; O’Sullivan, M.; Jones, M.W.; Andrew, R.M.; Hauck, J.; Olsen, A.; Peters, G.P.; Peters, W.; Pongratz, J.; Sitch, S.; et al. Global carbon budget 2020. Earth Syst. Sci. Data 2020, 12, 3269–3340. [Google Scholar] [CrossRef]
- Yang, Q.L.; Zhao, R.Q.; Zhao, T.; Hu, Y.M.; Zhang, Y.P.; Zhu, R.M. Elationship between agricultural carbon emission efficiency and food security at county scale. Chin. J. Agric. Resour. Reg. Plan. 2023, 44, 156–169. (In Chinese) [Google Scholar]
- Enriquez-de-Salamanca, A.; Martin-Aranda, R.M.; Diaz-Sierra, R. Potential of land use activities to offset road traffic greenhouse gas emissions in Central Spain. Sci. Total Environ. 2017, 590, 215–225. [Google Scholar] [CrossRef]
- Skaggs, R.; Hibbard, K.A.; Frumhoff, P.; Lowry, T.; Middleton, R.; Pate, R.; Tidwell, V.C.; Arnold, J.G.; Averyt, K.; Janetos, A.C.; et al. Climate and Energy-Water-Land System Interactions Technical Report to the U.S. Department of Energy in Support of the National Climate Assessment; U.S. Department of Energy Office of Scientific and Technical Information: Richland, WA, USA, 2012. [Google Scholar] [CrossRef]
- Feng, M.Y.; Zhao, R.Q.; Huang, H.P.; Xiao, L.G.; Xie, Z.X.; Zhang, L.J.; Sun, J.; Chuai, X.W. Water–energy–carbon nexus of different land use types: The case of Zhengzhou. China Ecol. Indic. 2022, 141, 10. [Google Scholar] [CrossRef]
- Wang, F.; Cao, Y.Q.; Chen, M.; Yang, Y.F. Network characteristics of water-land-energy-carbon correlation system in the yellow river basin. Adv. Sci. Technol. Water Resour. 2023, 9073, 1–13. (In Chinese) [Google Scholar]
- Zhao, R.Q.; Liu, Y.; Tian, M.M.; Ding, M.L.; Cao, L.H.; Zhang, Z.P.; Chuai, X.W.; Xiao, L.G.; Yao, L.G. Impacts of water and land resources exploitation on agricultural carbon emissions: The water-land-energy-carbon nexus. Land Use Policy 2018, 72, 480–492. [Google Scholar] [CrossRef]
- Jiang, W.Y.; Zhang, Z.Y.; Wen, J.; Yin, L.F.; Song, B.K. Spatio-temporal variation and influencing factors of industrial carbon emission effect in China based on water-land-energy-carbon nexus. Ecol. Indic. 2023, 152, 110307. [Google Scholar] [CrossRef]
- Venkatesh, D.; Chan, A.; Brattebo, H. Understanding the water-energy-carbon nexus in urban water utilities: Comparison of four city case studies and the relevant influencing factors. Energy 2014, 75, 153–166. [Google Scholar] [CrossRef]
- Watanabe, M.D.B.; Ortega, E. Dynamic emergy accounting of water and carbon ecosystem services: A model to simulate the impacts of land-use change. Ecol. Model. 2014, 271, 113–131. [Google Scholar] [CrossRef]
- Cheng, L.; Tian, J.; Xu, H.; Chen, L. Unveiling the Nexus Profile of Embodied Water–Energy–Carbon–Value Flows of the Yellow River Basin in China. Environ. Sci. Technol. 2023, 57, 8568–8577. (In Chinese) [Google Scholar] [CrossRef] [PubMed]
- Sun, J.; Liu, Y.; Zhao, R.Q.; Yang, W.J.; Wu, H.X.; Peng, C.Y.; Guo, M.; Liu, K. The flow analysis of inter-provincial agricultural water, land and carbon footprints in China based on input-output model. Acta Ecol. Sin. 2022, 42, 9615–9626. (In Chinese) [Google Scholar]
- Ren, X.L.; He, H.L.; Liu, M.; Zhang, L.; Zhou, L.; Yu, G.R.; Wang, H.M. Modeling of carbon and water fluxes of Qianyanzhou subtropical coniferous plantation using model-data fusion approach. Acta Ecol. Sin. 2012, 32, 7313–7326. (In Chinese) [Google Scholar]
- Li, G.J.; Huang, D.; Li, Y.L. Water-energy-food correlation: A new perspective of regional sustainable development research. J. Cent. Univ. Financ. Econ. 2016, 12, 76–90. (In Chinese) [Google Scholar]
- Li, M.Q.; Zhang, J.J.; Song, R.; Fu, B.N. Spatial-temporal Evolution of Sustainable Development Level and Industrial Development Scale in Urban China. Stat. Decis. 2021, 37, 93–97. (In Chinese) [Google Scholar]
- CPC Central Committee and State Council. National New Urbanization Plan (2014–2020); CPC Central Committee and State Council: Beijing, China, 2023. [Google Scholar]
- Chen, X.L.; Di, Q.B. Spatial connection and radiation effect of regional high-quality development: A case study of the Liaoning coastal economic belt. Prog. Geogr. 2014, 42, 2126–2142. [Google Scholar] [CrossRef]
- Liu, H.; Zhang, Y.; Zheng, W.S. Evaluation of spatio-temporal coupling and coordinated development of urban land intensive use and regional urbanization: A case study of cities in bohai rim region. Geogr. Res. 2011, 30, 1805–1817. [Google Scholar]
- Lin, S.G.; Lu, R.C.; Liu, S.K.; Ye, Z.D.; Wei, Q.T.; Luo, J.L. Land use pattern and multifunctional evolution in the border areas in the Guangxi Zhuang Autonomous Region based on “production-living-ecosystem” space. Trans. Chin. Soc. Agric. Eng. 2021, 1817, 265–274. [Google Scholar]
- Wang, M.; Wang, P.; Liang, W.U.; Yang, R.P.; Feng, X.Z.; Zhao, M.X.; Du, X.L.; Wang, Y.Y. Criteria for assessing carbon emissions peaks at provincial level in China. Adv. Clim. Change Res. 2022, 13, 131–137. [Google Scholar] [CrossRef]
- Xu, S.; He, W.; Shen, J.; Degefu, D.M.; Yuan, L.; Kong, Y. Coupling and coordination degrees of the core water–energy–food nexus in China. Int. J. Environ. Res. Public Health 2019, 16, 1648. [Google Scholar] [CrossRef]
- Zhou, X.; Wu, D.; Li, J.; Liang, J.; Zhang, D.; Chen, W. Cultivated land use efficiency and its driving factors in the Yellow River Basin, China. Ecol. Indic. 2022, 144, 109411. [Google Scholar] [CrossRef]
- Zhang, D.D.; Chang, L.; Wu, S.C.; Cui, Y.Q.; Wang, Y.S.; Zeng, J.J. Study on sustainable development of water resources in Gansu Province. In Proceedings of the 5th International Conference on Water Resource and Environment (WRE 2019), Macao, China, 16–19 July 2019; Volume 344, p. 012164. [Google Scholar]
- Wang, H.; Fang, L. Spatial-temporal coupling coordination relationship between the security level of water-energy-food nexus system and total factor productivity in China. Water Resour. Prot. 2023, 39, 150–157. (In Chinese) [Google Scholar]
- Ren, Q.R.; Yu, E.Y. Coupling analysis on coordinated development of ecological environment and social economic system in Gansu Province. Acta Ecol. Sin. 2021, 41, 2944–2953. (In Chinese) [Google Scholar]
- Ye, S.; Ge, Y.; Xu, S.; Ma, X. Measurement and Prediction of Coupling Coordination Level of Economic Development, Social Stability and Ecological Environment in Qinghai—Thoughts on Sustainable Societal Safety. Sustainability 2022, 14, 10515. [Google Scholar] [CrossRef]
- Jiang, C.; Sun, Q.; Tian, T. Coupling coordination and obstacle analysis of urbanization and water resources in Shaanxi Province. Water Resour. Dev. Manag. 2021, 10, 15–20. [Google Scholar]
- Wang, Z.Q.; Jiang, W.H.; Lu, S.Y. Characteristics of “water-energy-carbon” coupling system in Xinjiang based on the ecological network analysis. Arid Land Geogr. 2023, 46, 2005–2016. (In Chinese) [Google Scholar]
- Teng, W.T.F.; Feng, T.Z.; Guo, D.Y. Drivers and decoupling effects of carbon emissions in Northwest China. J. Beijing Norm. Univ. (Nat. Sci.) 2023, 59, 260–268. (In Chinese) [Google Scholar]
Figure 1.
Schematic diagram of the coupling mechanism of the WLEC system.
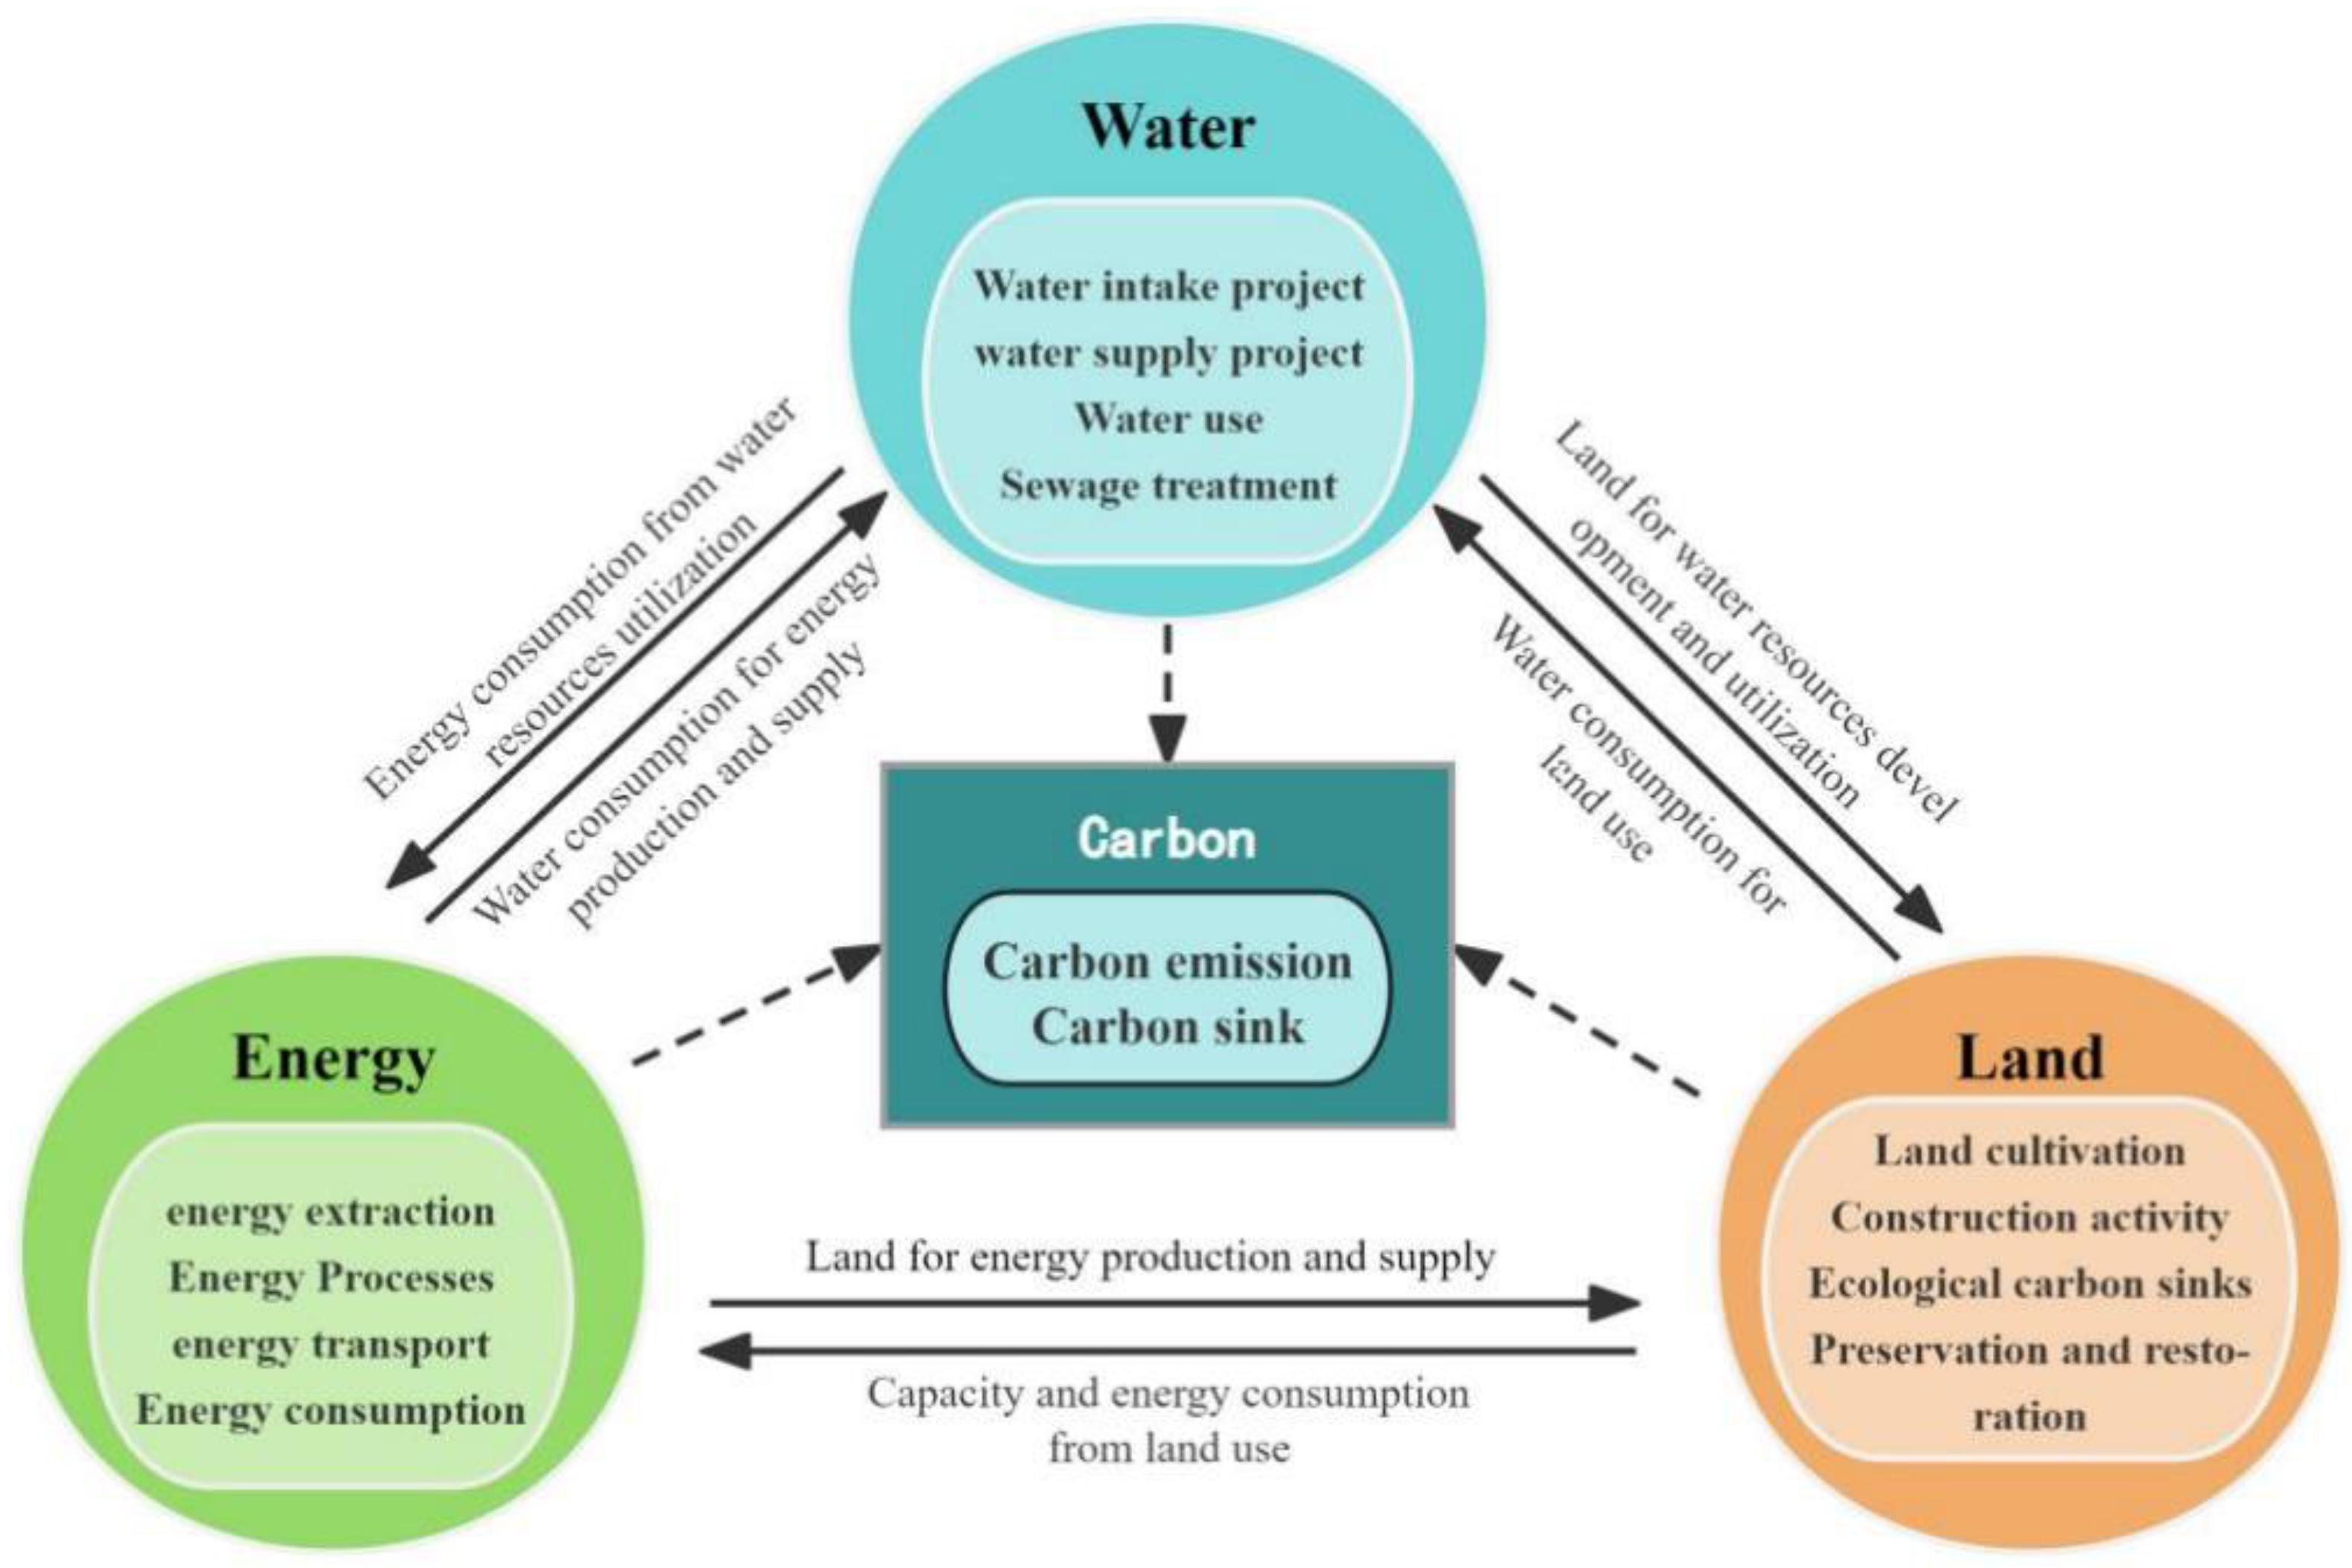
Figure 2.
The safety development index for the WLE system in five provinces of Northwest China (2010–2021).
Figure 2.
The safety development index for the WLE system in five provinces of Northwest China (2010–2021).
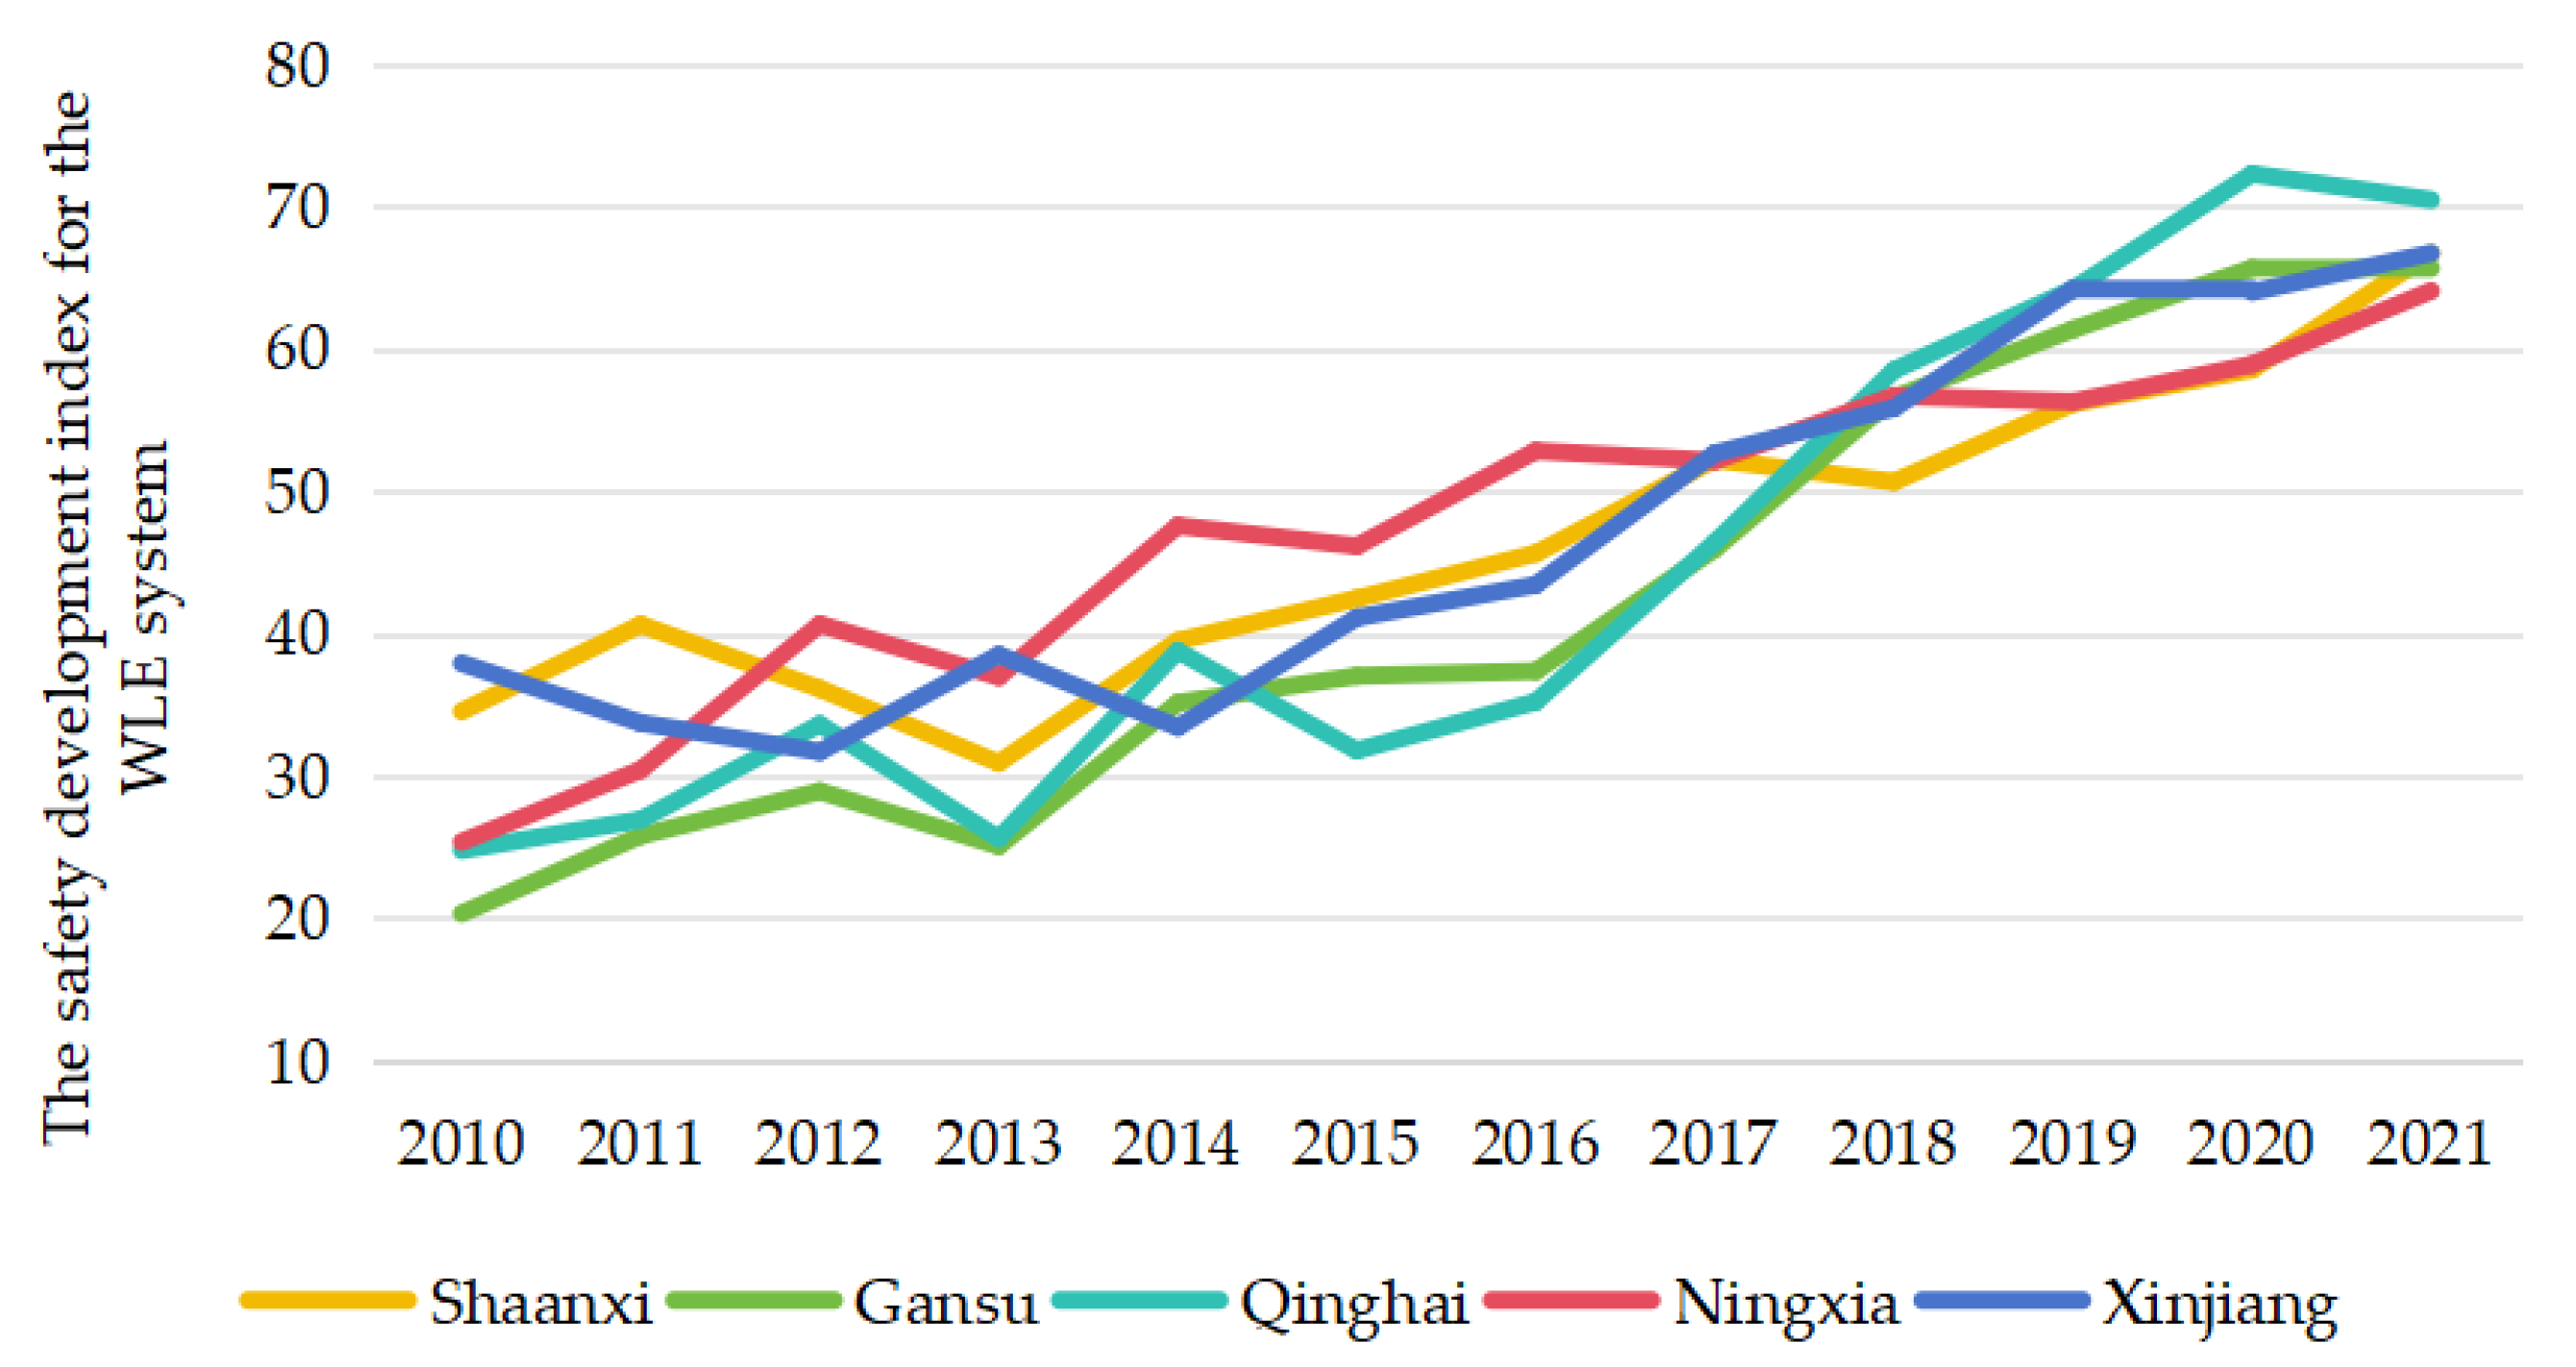
Figure 3.
The subindex of safety development of the WLE system in Northwest China.

Figure 4.
Correlation coefficients of the water and carbon subsystem, the land and carbon subsystem, the energy and carbon subsystem, and the WLE system and carbon subsystem in five provinces of Northwest China.
Figure 4.
Correlation coefficients of the water and carbon subsystem, the land and carbon subsystem, the energy and carbon subsystem, and the WLE system and carbon subsystem in five provinces of Northwest China.

Figure 5.
Coupling coordination degree of the WLE system in five provinces of Northwest China (2010–2021).
Figure 5.
Coupling coordination degree of the WLE system in five provinces of Northwest China (2010–2021).

Figure 6.
Coupling coordination degree of the WLEC system in five provinces of Northwest China (2010–2021).
Figure 6.
Coupling coordination degree of the WLEC system in five provinces of Northwest China (2010–2021).

Figure 7.
Primary obstacles to the coupling coordinated development of the WLEC system in five provinces of Northwest China (2010–2021).
Figure 7.
Primary obstacles to the coupling coordinated development of the WLEC system in five provinces of Northwest China (2010–2021).

Figure 8.
Partial obstacle factors and their obstacle degree changes in the coupling coordinated development of the WLEC system in Northwest China (2010–2021).
Figure 8.
Partial obstacle factors and their obstacle degree changes in the coupling coordinated development of the WLEC system in Northwest China (2010–2021).


Table 1.
Evaluation index system for assessing the coordinated development of the WLEC system in Northwest China.
Table 1.
Evaluation index system for assessing the coordinated development of the WLEC system in Northwest China.
| Primary Indicators | Secondary Indicators | Specific Indicators | Indicator Properties | Weights | ||||
|---|---|---|---|---|---|---|---|---|
| Shaanxi | Gansu | Qinghai | Ningxia | Xinjiang | ||||
| Water | Water supply | Per capita water resources (Cubic meters/person) | Positive | 0.05 | 0.05 | 0.03 | 0.05 | 0.06 |
| Proportion of groundwater in total amount of water supply (%) | Negative | 0.03 | 0.03 | 0.07 | 0.03 | 0.02 | ||
| Water use | Per capita water use (Cubic meters/person) | Negative | 0.06 | 0.06 | 0.03 | 0.05 | 0.03 | |
| Agriculture water use per unit of arable land (Cubic meters/ha) | Negative | 0.03 | 0.04 | 0.04 | 0.04 | 0.03 | ||
| Economical use | Water reuse rate (%) | Positive | 0.06 | 0.02 | 0.10 | 0.04 | 0.04 | |
| Sewage treatment | Wastewater treatment rate (%) | Positive | 0.02 | 0.03 | 0.03 | 0.03 | 0.03 | |
| Water efficiency | Water output rate (Cubic meters/ten thousand Yuan) | Positive | 0.03 | 0.03 | 0.03 | 0.04 | 0.04 | |
| Land | Land supply | Per capita arable land (ha/person) | Moderate | 0.04 | 0.12 | 0.06 | 0.04 | 0.04 |
| Per capita construction land (Square kilometers/person) | Moderate | 0.05 | 0.04 | 0.04 | 0.03 | 0.02 | ||
| Land production | Per capita output of grain crops (Tons/person) | Positive | 0.09 | 0.06 | 0.06 | 0.07 | 0.03 | |
| Output rate of construction land (ha/ten thousand Yuan) | Positive | 0.02 | 0.02 | 0.02 | 0.03 | 0.04 | ||
| Protecting and Enhancing Natural Carbon Sinks | Forest coverage rate (%) | Positive | 0.06 | 0.06 | 0.06 | 0.07 | 0.06 | |
| Control and remediation | Agricultural chemical fertilizer and pesticide use per unit of arable land (Tons/ha) | Negative | 0.04 | 0.04 | 0.07 | 0.03 | 0.07 | |
| Proportion of area of soil erosion under control in total land area administrative region (%) | Positive | 0.04 | 0.06 | 0.07 | 0.04 | 0.04 | ||
| Energy | Energy supply | Per capita energy production (Tons of standard coal/person) | Positive | 0.02 | 0.03 | 0.03 | 0.03 | 0.04 |
| Proportion of non-fossil energy in total primary energy production (%) | Positive | 0.06 | 0.04 | 0.04 | 0.06 | 0.05 | ||
| Proportion renewable energy generation (%) | Positive | 0.06 | 0.03 | 0.03 | 0.04 | 0.03 | ||
| Energy consumption | Per capita energy consumption (Tons of standard coal/person) | Negative | 0.03 | 0.03 | 0.03 | 0.05 | 0.09 | |
| Proportion of Non-fossil Energy in Total Primary Energy Consumption (%) | Positive | 0.06 | 0.05 | 0.02 | 0.04 | 0.05 | ||
| Proportion of Terminal Energy in Total Energy Consumption (%) | Positive | 0.03 | 0.01 | 0.03 | 0.04 | 0.03 | ||
| Energy efficiency | Energy output rate (Tons of standard coal/ten thousand Yuan) | Positive | 0.03 | 0.03 | 0.03 | 0.03 | 0.05 | |
| Carbon emissions | Emissions intensity | Per capita carbon emissions (Tons/person) | Negative | 0.03 | 0.04 | 0.05 | 0.05 | 0.05 |
| Carbon emissions per unit of GDP (Tons/ten thousand Yuan) | Negative | 0.02 | 0.03 | 0.02 | 0.02 | 0.03 | ||
| Carbon emissions per unit of construction land (Tons/square kilometers) | Negative | 0.04 | 0.04 | 0.02 | 0.05 | 0.04 | ||
Table 2.
Grading evaluation standard of WLESDI.
| Score | Classification |
|---|---|
| WLESDI < 40 | Weak |
| 40 ≤ WLESDI < 60 | Weak–moderate transition |
| 60 ≤ WLESDI < 70 | Moderate |
| 70 ≤ WLESDI < 80 | Moderate–strong transition |
| 80 ≤ WLESDI < 90 | Strong |
| 90 ≤ WLESDI ≤ 100 | Very strong |
Table 3.
Classification criteria for the coordinated development type of the WLEC system in Northwest China.
Table 3.
Classification criteria for the coordinated development type of the WLEC system in Northwest China.
| Score | Level Classification |
|---|---|
| 0 ≤ C < 0.1 | Extreme disorder |
| 0.1 ≤ C < 0.2 | Serious disorder |
| 0.2 ≤ C < 0.3 | Moderate disorder |
| 0.3 ≤ C < 0.4 | Low disorder |
| 0.4 ≤ C < 0.5 | Marginal disorder |
| 0.5 ≤ C < 0.6 | Marginal coordination |
| 0.6 ≤ C < 0.7 | Low coordination |
| 0.7 ≤ C < 0.8 | Moderate coordination |
| 0.8 ≤ C < 0.9 | Good coordination |
| 0.9 ≤ C ≤ 1.0 | High coordination |
Table 4.
Data and sources.
| Data | Sources |
|---|---|
| Total Amount of Water Resources; Amount of Groundwater Resources; Total Amount of Water Supply; Total Use of Agriculture Water; Arable Land; Forest Coverage Rate | China Statistical Yearbook |
| Water Reuse Rate; Wastewater Treatment Rate; Area of Construction Land; Total Land Area Administrative Region | China Urban Construction Statistical Yearbook |
| Output of Grain Crops; Use of Agricultural Chemical Fertilizer and Pesticide | China Rural Statistical Yearbook |
| Area of Soil Erosion under Control | China Environmental Statistical Yearbook |
| Total Energy Production; Proportion of Non-fossil Energy in Total Primary Energy Production; Total Energy Consumption; Proportion of Non-fossil Energy in Total Primary Energy Consumption | China Energy Statistical Yearbook; Shaanxi Statistical Yearbook; Xinjiang Statistical Yearbook; Qinghai Statistical Yearbook; Ningxia Statistical Yearbook; Gansu development yearbook |
| Permanent Population; Arable Land; Gross Domestic Product (GDP) | China Statistical Yearbook |
Disclaimer/Publisher’s Note: The statements, opinions and data contained in all publications are solely those of the individual author(s) and contributor(s) and not of MDPI and/or the editor(s). MDPI and/or the editor(s) disclaim responsibility for any injury to people or property resulting from any ideas, methods, instructions or products referred to in the content. |
© 2024 by the authors. Licensee MDPI, Basel, Switzerland. This article is an open access article distributed under the terms and conditions of the Creative Commons Attribution (CC BY) license (https://creativecommons.org/licenses/by/4.0/).
Share and Cite
MDPI and ACS Style
Wang, M.; An, Y.; Yang, R.; Shan, X.; Li, L.; Feng, X. Analysis of the Coupling Coordinated Development of the Water-Soil-Energy-Carbon System in Northwest China. Land 2024, 13, 715. https://doi.org/10.3390/land13050715
AMA Style
Wang M, An Y, Yang R, Shan X, Li L, Feng X. Analysis of the Coupling Coordinated Development of the Water-Soil-Energy-Carbon System in Northwest China. Land. 2024; 13(5):715. https://doi.org/10.3390/land13050715
Chicago/Turabian StyleWang, Min, Yiming An, Rupu Yang, Xiaoyu Shan, Liping Li, and Xiangzhao Feng. 2024. "Analysis of the Coupling Coordinated Development of the Water-Soil-Energy-Carbon System in Northwest China" Land 13, no. 5: 715. https://doi.org/10.3390/land13050715
Note that from the first issue of 2016, this journal uses article numbers instead of page numbers. See further details here.