
Phenotyping Wheat Kernel Symmetry as a Consequence of Different Agronomic Practices
 , , , , , ,
Abstract
:1. Introduction
2. Materials and Methods
2.1. Agrotechnical Conditions
2.2. Preparation of Ears and Kernels for Analysis
2.3. Sampling and Preparation of Kernel Cuts for Analysis
2.4. Hyperspectrum Imaging
2.5. Statistical Analysis
3. Results
3.1. Effects of Tillage Practices on the Main Parameters of the Wheat Ear as a Result of the First Date of Sowing
3.2. Influence of Factors on the Main Ear Parameters under Two Dates of Wheat Sowing
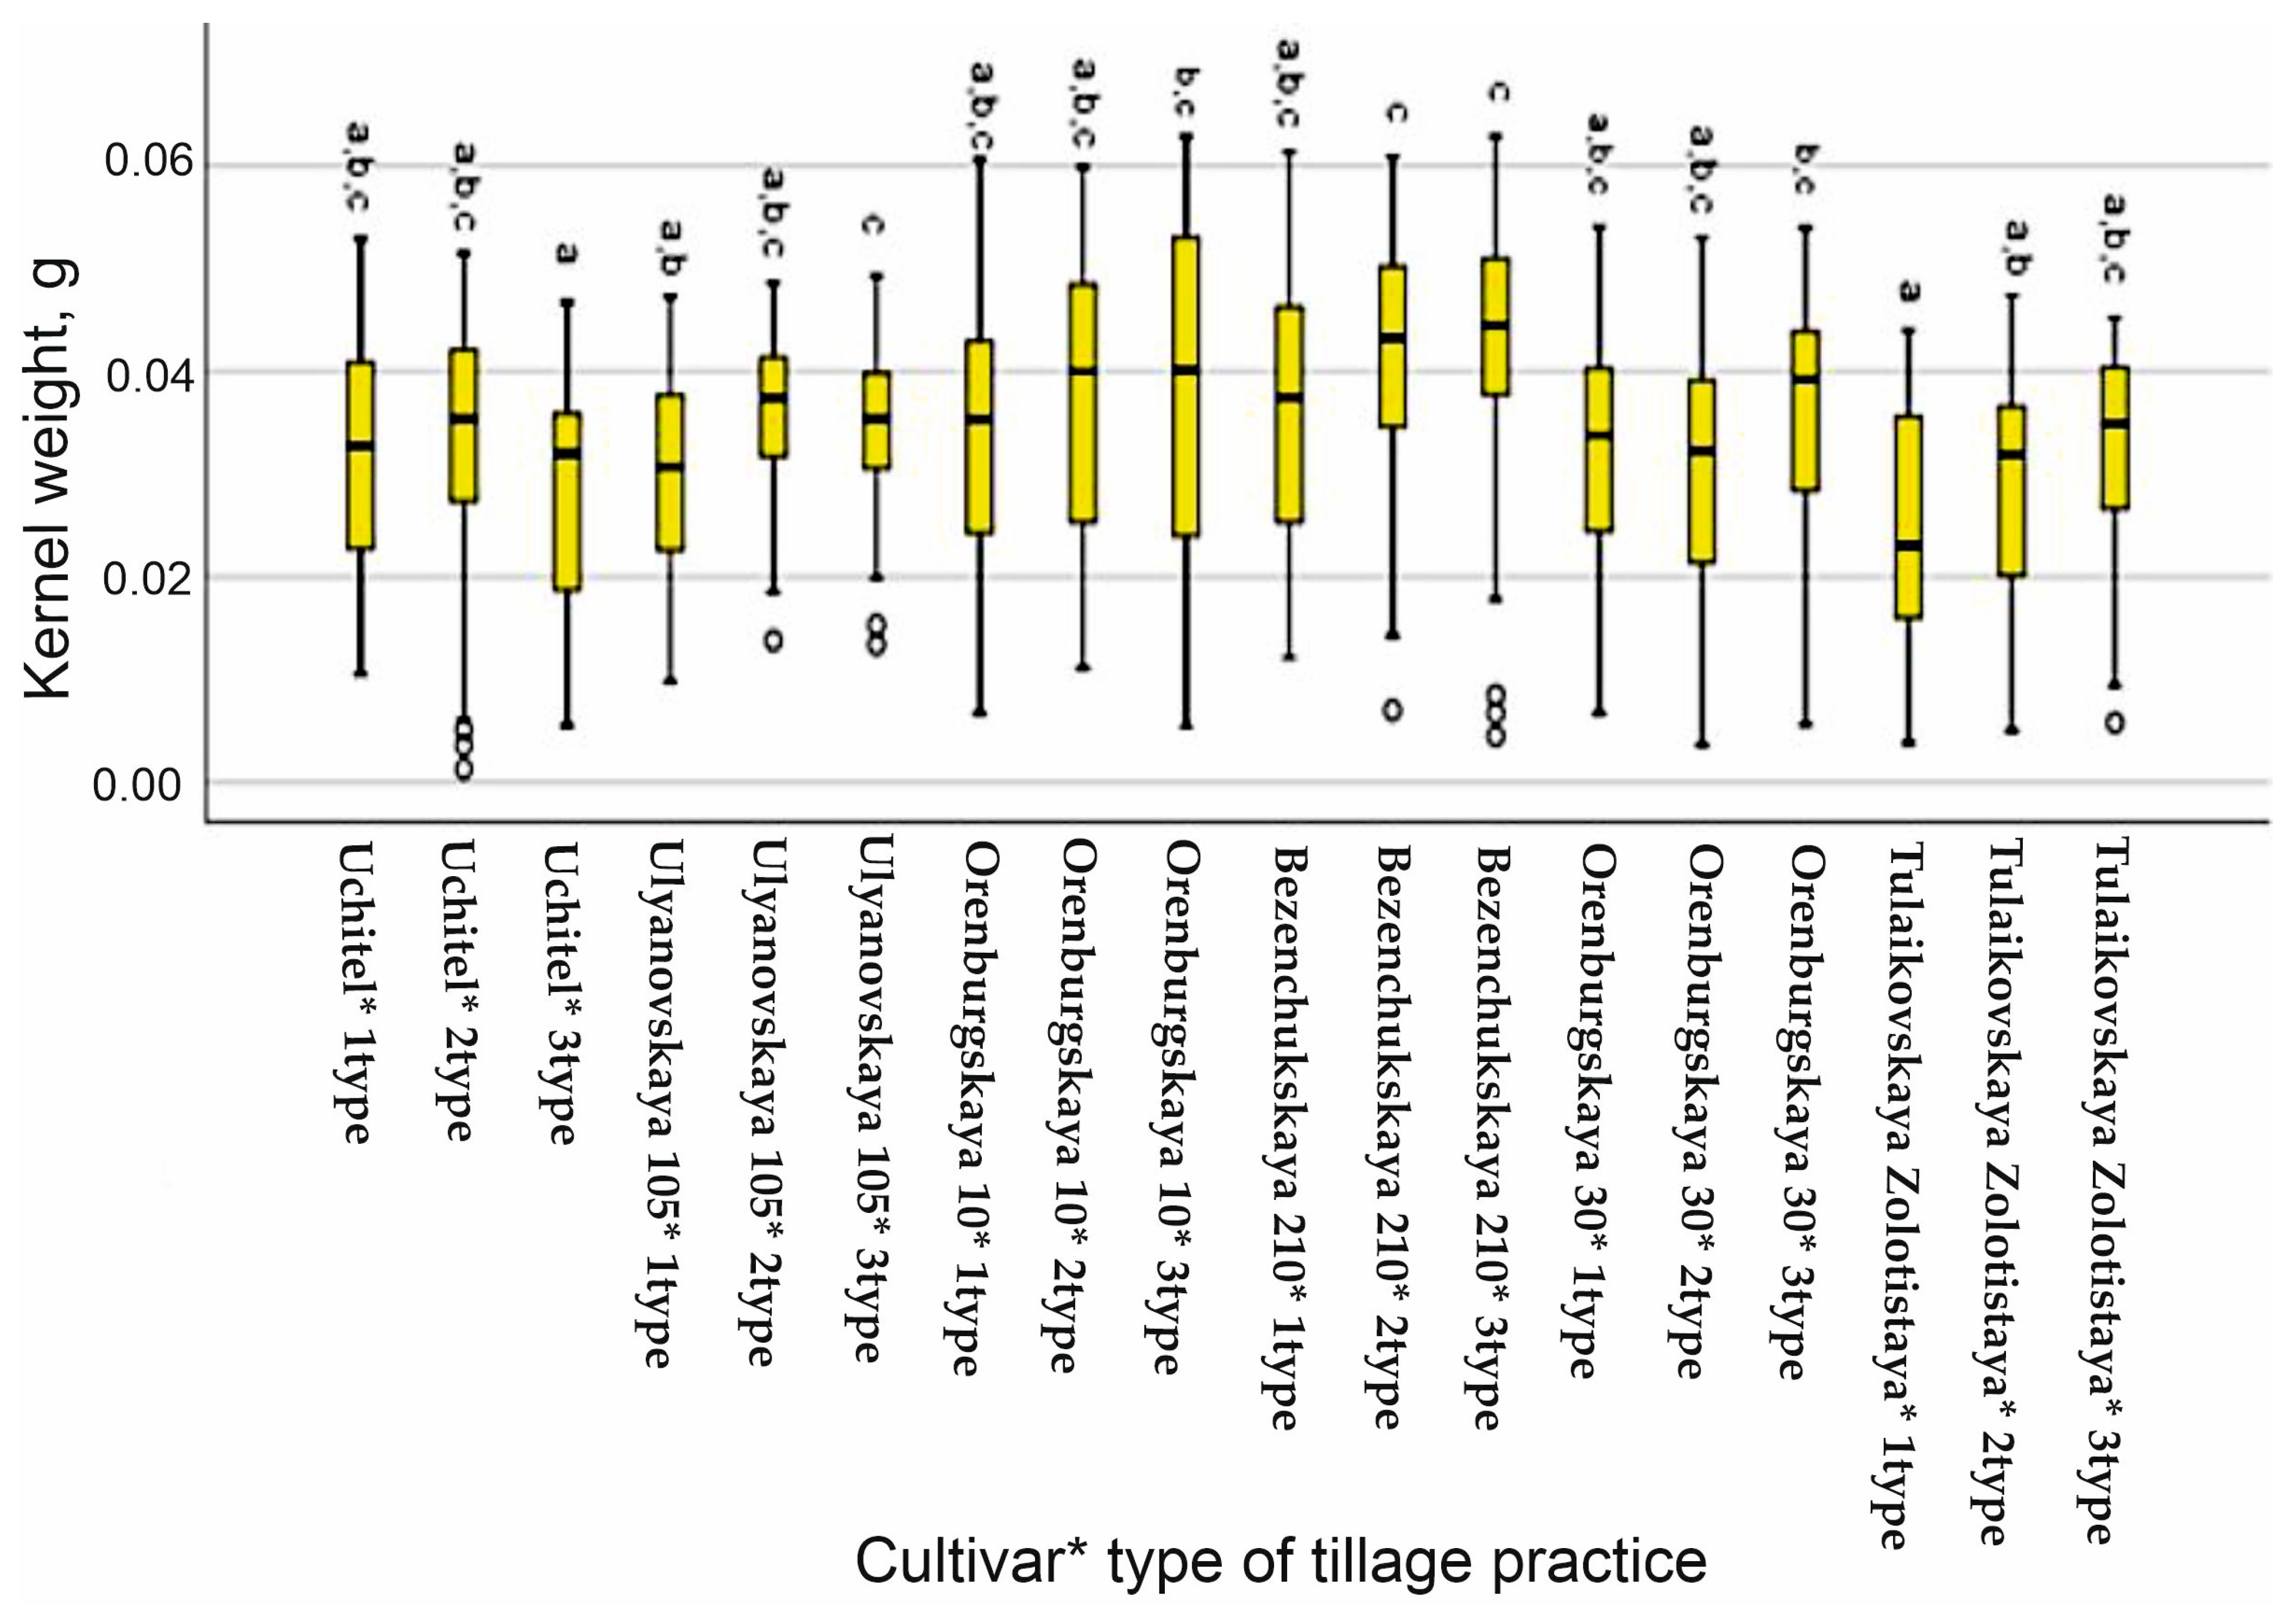
3.3. Descriptive Statistics of Kernel Weight
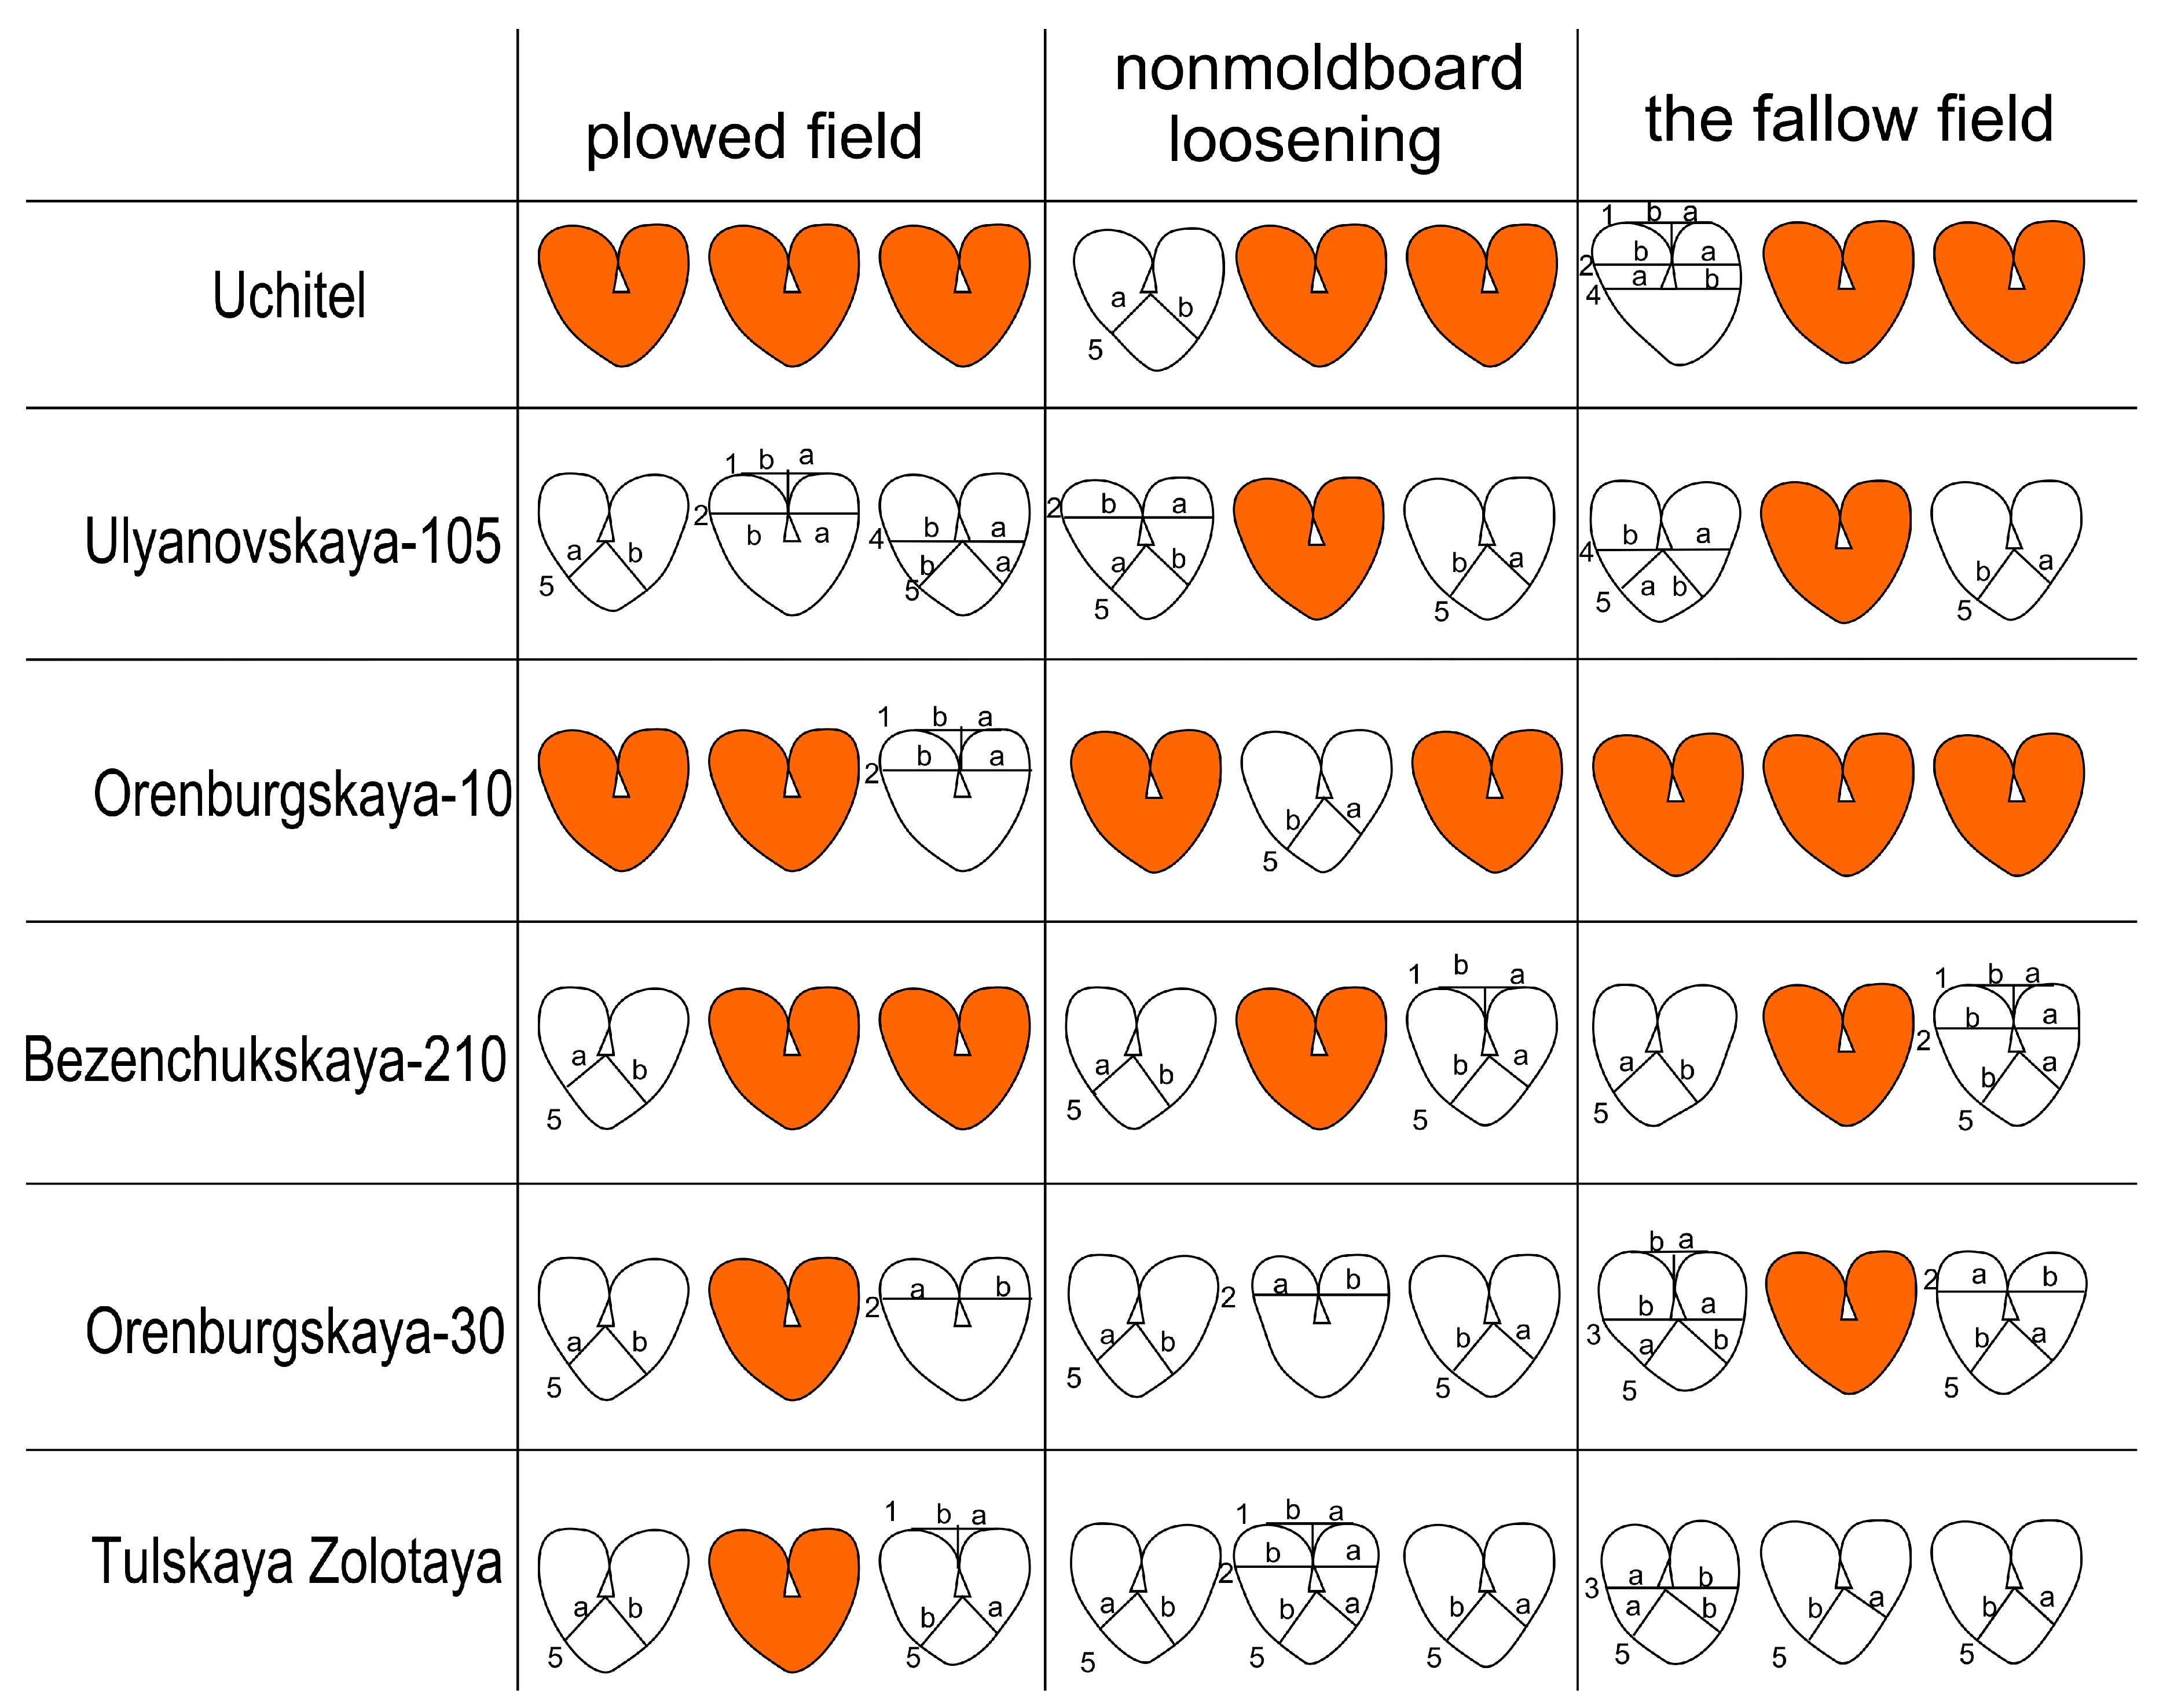
3.4. Analysis of the Parameters of Kernels and Their Cross Sections
3.5. Kernel Fullness Analysis
3.6. Comparative Hyperspectral Analysis of Kernels
4. Discussion
5. Conclusions
Supplementary Materials
Author Contributions
Funding
Data Availability Statement
Acknowledgments
Conflicts of Interest
References
- van Dijk, M.; Morley, T.; Rau, M.L.; Saghai, Y. A meta-analysis of projected global food demand and population at risk of hunger for the period 2010–2050. Nat. Food 2021, 2, 494–501. [Google Scholar] [CrossRef] [PubMed]
- Erenstein, O.; Jaleta, M.; Sonder, K.; Mottaleb, K.; Prasanna, B.M. Global maize production, consumption and trade: Trends and R&D implications. Food Secur. 2022, 14, 1295–1319. [Google Scholar]
- Shewry, P.R. Wheat. J. Exp. Bot. 2009, 60, 1537–1553. [Google Scholar] [CrossRef] [PubMed]
- Yang, F.; Zhang, J.; Liu, Q.; Liu, H.; Zhou, Y.; Yang, W.; Ma, W. Improvement and re-evolution of tetraploid wheat for global environmental challenge and diversity consumption demand. Int. J. Mol. Sci. 2022, 23, 2206. [Google Scholar] [CrossRef] [PubMed]
- Nuttall, J.G.; O’Leary, G.J.; Panozzo, J.F.; Walker, C.K.; Barlow, K.M.; Fitzgerald, G.J. Models of grain quality in wheat—A review. Field Crop. Res. 2017, 202, 136–145. [Google Scholar] [CrossRef]
- Enghiad, A.; Ufer, D.; Countryman, A.M.; Thilmany, D.D. An overview of global wheat market fundamentals in an era of climate concerns. Int. J. Agron. 2017, 2017, 3931897. [Google Scholar] [CrossRef]
- Kenzhebayeva, S.; Abekova, A.; Atabayeva, S.; Yernazarova, G.; Omirbekova, N.; Zhang, G.; Turasheva, S.; Asrandina, S.; Sarsu, F.; Wang, Y. Mutant lines of spring wheat with increased iron, zinc, and micronutrients in grains and enhanced bioavailability for human health. BioMed Res. Int. 2019, 2019, 9692053. [Google Scholar] [CrossRef] [PubMed]
- Durham, T.C.; Mizik, T. Comparative economics of conventional, organic, and alternative agricultural production systems. Economies 2021, 9, 64. [Google Scholar] [CrossRef]
- Mitura, K.; Cacak-Pietrzak, G.; Feledyn-Szewczyk, B.; Szablewski, T.; Studnicki, M. Yield and grain quality of common wheat (Triticum aestivum L.) depending on the different farming systems (Organic vs. Integrated vs. Conventional). Plants 2023, 12, 1022. [Google Scholar] [CrossRef] [PubMed]
- Bilsborrow, P.; Cooper, J.; Tétard-Jones, C.; Średnicka-Tober, D.; Barański, M.; Eyre, M.; Schmidt, C.; Shotton, P.; Volakakis, N.; Cakmak, I.; et al. The effect of organic and conventional management on the yield and quality of wheat grown in a long-term field trial. Eur. J. Agron. 2013, 51, 71–80. [Google Scholar] [CrossRef]
- Głodowska, M.; Gałązka, A. Unsustainable agriculture and its environmental consequences. Zesz. Probl. Post. Nauk Roln. 2018, 592, 3–13. [Google Scholar]
- Khalid, A.; Hameed, A.; Tahir, M.F. Wheat quality: A review on chemical composition, nutritional attributes, grain anatomy, types, classification, and function of seed storage proteins in bread making quality. Front. Nutr. 2023, 10, 1053196. [Google Scholar] [CrossRef] [PubMed]
- Guzmán, C.; Ibba, M.I.; Álvarez, J.B.; Sissons, M.; Morris, C. Wheat Quality. In Wheat Improvement; Reynolds, M.P., Braun, H.-J., Eds.; Springer International Publishing: Cham, Switzerland, 2022; pp. 3–15. [Google Scholar]
- Asseng, S.; Bar-Tal, A.; Bowden, J.W.; Keating, B.A.; Van Herwaarden, A.; Palta, J.A.; Huth, N.I.; Probert, M.E. Simulation of grain protein content with APSIM-Nwheat. Eur. J. Agron. 2002, 16, 25–42. [Google Scholar] [CrossRef]
- Brisson, N.; Gary, C.; Justes, E.; Roche, R.; Mary, B.; Ripoche, D.; Zimmer, D.; Sierra, J.; Bertuzzi, P.; Burger, P.; et al. An overview of the crop model STICS. Eur. J. Agron. 2003, 18, 309–332. [Google Scholar] [CrossRef]
- Martre, P.; Jamieson, P.D.; Semenov, M.A.; Zyskowski, R.F.; Porter, J.R.; Triboi, E. Modelling protein content and composition in relation to crop nitrogen dynamics for wheat. Eur. J. Agron. 2006, 25, 138–154. [Google Scholar] [CrossRef]
- Tanabata, T.; Shibaya, T.; Hori, K.; Ebana, K.; Yano, M. SmartGrain: High-throughput phenotyping software for measuring seed shape through image analysis. Plant Physiol. 2012, 160, 1871–1880. [Google Scholar] [CrossRef] [PubMed]
- Whan, A.P.; Smith, A.B.; Cavanagh, C.R.; Ral, J.-P.F.; Shaw, L.M.; Howitt, C.A.; Bischof, L. GrainScan: A low cost, fast method for grain size and colour measurements. Plant Methods 2014, 10, 23. [Google Scholar] [CrossRef] [PubMed]
- Bekkering, C.S.; Huang, J.; Tian, L. Image-based, organ-level plant phenotyping for wheat improvement. Agronomy 2020, 10, 1287. [Google Scholar] [CrossRef]
- Komyshev, E.; Genaev, M.; Afonnikov, D. Evaluation of the SeedCounter, a mobile application for grain phenotyping. Front. Plant Sci. 2017, 7, 1990. [Google Scholar] [CrossRef] [PubMed]
- Rogers, S.O.; Quatrano, R.S. Morphological staging of wheat caryopsis development. Amer. J. Bot. 1983, 70, 308–311. [Google Scholar] [CrossRef]
- Aniskina, T.S.; Baranova, E.N.; Lebedev, S.V.; Reger, N.S.; Besaliev, I.N.; Panfilov, A.A.; Kryuchkova, V.A.; Gulevich, A.A. Unexpected effects of sulfate and sodium chloride application on yield qualitative characteristics and symmetry indicators of hard and soft wheat kernels. Plants 2023, 12, 980. [Google Scholar] [CrossRef]
- Ma, B.; Zhang, L.; He, Z. Understanding the regulation of cereal grain filling: The way forward. J. Integr. Plant Biol. 2023, 65, 526–547. [Google Scholar] [CrossRef]
- Teng, Z.; Chen, Y.; Meng, S.; Duan, M.; Zhang, J.; Ye, N. Environmental stimuli: A major challenge during grain filling in cereals. Int. J. Mol. Sci. 2023, 24, 2255. [Google Scholar] [CrossRef] [PubMed]
- Baranova, E.N.; Aniskina, T.S.; Kryuchkova, V.A.; Shchuklina, O.A.; Khaliluev, M.R.; Gulevich, A.A. Evaluation of the heterogeneity of wheat kernels as a traditional model object in connection with the asymmetry of development. Symmetry 2022, 14, 1124. [Google Scholar] [CrossRef]
- Aniskina, T.S.; Sudarikov, K.A.; Levinskikh, M.A.; Gulevich, A.A.; Baranova, E.N. Bread wheat in space flight: Is there a difference in kernel quality? Plants 2023, 13, 73. [Google Scholar] [CrossRef]
- Arif, M.A.R.; Komyshev, E.G.; Genaev, M.A.; Koval, V.S.; Shmakov, N.A.; Börner, A.; Afonnikov, D.A. QTL analysis for bread wheat seed size, shape and color characteristics estimated by digital image processing. Plants 2022, 11, 2105. [Google Scholar] [CrossRef] [PubMed]
- Suchowilska, E.; Wiwart, M.; Wachowska, U.; Radawiec, W.; Combrzyński, M.; Gontarz, D. A comparison of phenotypic variation in Triticum durum Desf. genotypes deposited in gene banks based on the shape and color descriptors of kernels in a digital image analysis. PLoS ONE 2022, 17, e0259413. [Google Scholar] [CrossRef] [PubMed]
- Martín-Gómez, J.J.; Rewicz, A.; Goriewa-Duba, K.; Wiwart, M.; Tocino, Á.; Cervantes, E. Morphological description and classification of wheat kernels based on geometric models. Agronomy 2019, 9, 399. [Google Scholar] [CrossRef]
- Broeke, J.; Perez, J.M.; Pascau, J. Image Processing with ImageJ: Extract and Analyze Data from Complex Images with ImageJ, the World’s Leading Image Processing Tool, 2nd ed.; Community Experience Distilled; Packt Publishing Open Source: Birmingham, UK; Mumbai, India, 2015. [Google Scholar]
- Shitsukawa, N.; Kinjo, H.; Takumi, S.; Murai, K. Heterochronic development of the floret meristem determines grain number per spikelet in diploid, tetraploid and hexaploid wheats. Ann. Bot. 2009, 104, 243–251. [Google Scholar] [CrossRef]
- Chaban, I.A.; Gulevich, A.A.; Smirnova, E.A.; Baranova, E.N. Morphological and ultrastructural features of formation of the skin of wheat (Triticum aestivum L.) kernel. Plants 2021, 10, 2538. [Google Scholar] [CrossRef] [PubMed]
- Watson, A.; Ghosh, S.; Williams, M.J.; Cuddy, W.S.; Simmonds, J.; Rey, M.D.; Asyraf Md Hatta, M.; Hinchliffe, A.; Steed, A.; Reynolds, D.; et al. Speed breeding is a powerful tool to accelerate crop research and breeding. Nat. Plants 2018, 4, 23–29. [Google Scholar] [CrossRef]
- Besaliev, I.N.; Panfilov, A.L. Duration and conditions of interphase periods of vegetation as productivity factors of spring wheat varieties in Orenburg Cis-Urals. Anim. Husb. Fodd. Prod. 2023, 106, 202–212. [Google Scholar] [CrossRef]
- Woźniak, A.; Gos, M. Yield and quality of spring wheat and soil properties as affected by tillage system. Plant Soil Environ. 2014, 60, 141–145. [Google Scholar] [CrossRef]
- Woźniak, A.; Rachoń, L. Effect of tillage systems on the yield and quality of winter wheat grain and soil properties. Agriculture 2020, 10, 405. [Google Scholar] [CrossRef]
- De Flaviis, R.; Santarelli, V.; Sacchetti, G. Tracking wheat variety and origin by the shape analysis of the volatiles fingerprint of wheat kernels and wheat beers. Appl. Sci. 2022, 12, 7854. [Google Scholar] [CrossRef]
- Kramer, T.H. Environmental and genetic variation for protein content in winter wheat (Triticum aestivum L). Euphytica 1979, 28, 209–218. [Google Scholar] [CrossRef]
- Skylas, D.J.; Cordwell, S.J.; Hains, P.G.; Larsen, M.R.; Basseal, D.J.; Walsh, B.J.; Blumenthal, C.; Rathmell, W.; Copeland, L.; Wrigley, C.W. Heat shock of wheat during grain filling: Proteins associated with heat-tolerance. J. Cereal Sci. 2002, 35, 175–188. [Google Scholar] [CrossRef]
- Zhang, T.; Wang, Z.; Yin, Y.; Cai, R.; Yan, S.; Li, W. Starch content and granule size distribution in grains of wheat in relation to post-anthesis water deficits. J. Agron. Crop Sci. 2010, 196, 1–8. [Google Scholar] [CrossRef]
- Balla, K.; Rakszegi, M.; Li, Z.; Bekes, F.; Bencze, S.; Veisz, O. Quality of winter wheat in relation to heat and drought shock after anthesis. Czech J. Food Sci. 2011, 29, 117–128. [Google Scholar] [CrossRef]
- Paunescu, R.A.; Bonciu, E.; Rosculete, E.; Paunescu, G.; Rosculete, C.A. The effect of different cropping systems on yield, quality, productivity elements, and morphological characters in wheat (Triticum aestivum L.). Plants 2023, 12, 2802. [Google Scholar] [CrossRef] [PubMed]
- Altenbach, S.B.; DuPont, F.M.; Kothari, K.M.; Chan, R.; Johnson, E.L.; Lieu, D. Temperature, water and fertilizer influence the timing of key events during grain development in a US spring wheat. J. Cereal Sci. 2003, 37, 9–20. [Google Scholar] [CrossRef]
- Spiertz, J.H.J.; Ellen, J. Effects of nitrogen on crop development and grain growth of winter wheat in relation to assimilation and utilization of assimilates and nutrients. Neth. J. Agric. Sci. 1978, 26, 210–231. [Google Scholar] [CrossRef]
- Blacklow, W.M.; Darbyshire, B.; Phloung, P. Fructans polymerized and depolymerised in the internodes of winter wheat as grain-filling progressed. Plant Sci. Lett. 1984, 36, 213–218. [Google Scholar] [CrossRef]
- Bell, C.J.; Incoll, L.D. The redistribution of assimilate in field-grown winter wheat. J. Exp. Bot. 1990, 41, 949–960. [Google Scholar] [CrossRef]
- Jenner, C.F.; Ugalde, T.D.; Aspinall, D. The physiology of starch and protein deposition in the endosperm of wheat. Aust. J. Plant Physiol. 1991, 18, 211–226. [Google Scholar] [CrossRef]
- Lingle, S.; Chevalier, P. Development of the vascular tissue of the wheat and barley caryopsis as related to the rate and duration of grain filling. Crop Sci. 1985, 25, 123–128. [Google Scholar] [CrossRef]
- Hands, P.; Kourmpetli, S.; Sharples, D.; Harris, R.; Drea, S. Analysis of grain characters in temperate grasses reveals distinctive patterns of endosperm organization associated with grain shape. J. Exp. Bot. 2012, 63, 6253–6266. [Google Scholar] [CrossRef]
- Yu, X.; Chen, X.; Zhou, L.; Zhang, J.; Yu, H.; Shao, S.; Xiong, F.; Wang, Z. Structural development of wheat nutrient transfer tissues and their relationships with filial tissues development. Protoplasma 2015, 252, 605–617. [Google Scholar]
- Zheng, Y.; Wang, Z. Contrast observation and investigation of wheat endosperm transfer cells and nucellar projection transfer cells. Plant Cell Rep. 2011, 30, 1281–1288. [Google Scholar] [CrossRef]
- Thiel, J. Development of endosperm transfer cells in barley. Front. Plant Sci. 2014, 5, 108. [Google Scholar] [CrossRef]
- Chateigner-Boutin, A.L.; Alvarado, C.; Devaux, M.F.; Durand, S.; Foucat, L.; Geairon, A.; Grelard, F.; Jamme, F.; Rogniaux, H.; Saulnier, L.; et al. The endosperm cavity of wheat grains contains a highly hydrated gel of arabinoxylan. Plant Sci. 2021, 306, 110845. [Google Scholar] [CrossRef] [PubMed]
- Pan, J.; Zhu, Y.; Cao, W. Modeling plant carbon flow and grain starch accumulation in wheat. Field Crop. Res. 2007, 101, 276–284. [Google Scholar] [CrossRef]
- Bechtel, D.B.; Zayas, I.N.N.A.; Kaleikau, L.O.R.I.; Pomeranz, Y. Size-distribution of wheat starch granules during endosperm development. Cereal Chem. 1990, 67, 59–63. [Google Scholar]
- Lloyd, J.R. The A to B of starch granule formation in wheat endosperm. J. Exp. Bot. 2020, 71, 1–3. [Google Scholar] [CrossRef] [PubMed]
- Dai, Z.M.; Yin, Y.P.; Zhang, M.; Li, W.Y.; Yan, S.H.; Cai, R.G.; Wang, Z.L. Starch granule size distribution in wheat grains under irrigated and rainfed conditions. Acta Agron. Sin. 2008, 34, 795–802. (In Chinese) [Google Scholar] [CrossRef]
- Himi, E.; Noda, K. Red grain colour gene (R) of wheat is a Myb-type transcription factor. Euphytica 2005, 143, 239–242. [Google Scholar] [CrossRef]
- Khlestkina, E.K.; Shoeva, O.Y.; Gordeeva, E.I. Flavonoid biosynthesis genes in wheat. Russ. J. Genet. Appl. Res. 2015, 5, 268–278. [Google Scholar] [CrossRef]
- Li, X.; Qian, X.; Lu, X.; Wang, X.; Ji, N.; Zhang, M.; Ren, M. Upregulated structural and regulatory genes involved in anthocyanin biosynthesis for coloration of purple grains during the middle and late grain-filling stages. Plant Physiol. Biochem. 2018, 130, 235–247. [Google Scholar] [CrossRef] [PubMed]
- Li, L.; Zhang, H.; Liu, J.; Huang, T.; Zhang, X.; Xie, H.; Guo, Y.; Wang, Q.; Zhang, P.; Qin, P. Grain color formation and analysis of correlated genes by metabolome and transcriptome in different wheat lines at maturity. Front. Nutr. 2023, 10, 1112497. [Google Scholar] [CrossRef] [PubMed]
- Dhakal, K.; Sivaramakrishnan, U.; Zhang, X.; Belay, K.; Oakes, J.; Wei, X.; Li, S. Machine learning analysis of hyperspectral images of damaged wheat kernels. Sensors 2023, 23, 3523. [Google Scholar] [CrossRef] [PubMed]
- Tillett, B.J.; Hale, C.O.; Martin, J.M.; Giroux, M.J. Genes impacting grain weight and number in wheat (Triticum aestivum L. ssp. aestivum). Plants 2022, 11, 1772. [Google Scholar] [CrossRef] [PubMed]
- Marzario, S.; Sica, R.; Taranto, F.; Esposito, S.; De Vita, P.; Gioia, T.; Logozzo, G. Phenotypic evolution in durum wheat (Triticum durum Desf.) based on SNPs, morphological traits, UPOV descriptors and kernel-related traits. Front. Plant Sci. 2023, 14, 1206560. [Google Scholar] [CrossRef] [PubMed]
- Subedi, M.; Ghimire, B.; Bagwell, J.W.; Buck, J.W.; Mergoum, M. Wheat end-use quality: State of art, genetics, genomics-assisted improvement, future challenges, and opportunities. Front. Genet. 2023, 13, 1032601. [Google Scholar] [CrossRef] [PubMed]


| Dependent Variable (Attribute Characteristic) | Independent Variables (Influence of Factors) | ||
|---|---|---|---|
| Cultivar | Tillage Practice | Factors Combination (Cultivar and Tillage Practice) | |
| Ear length without awns, mm | <<0.005 * | <<0.005 * | <<0.005 * |
| Spikelet number, pcs | 0.001 * | <<0.005 * | 0.003 * |
| Fertile spikelet number, pcs. | <<0.005 * | 0.943 | <<0.005 * |
| Kernel number, pcs. | <<0.005 * | 0.274 | <<0.005 * |
| Immature kernel number, pcs. | <<0.005 * | 0.005 * | 0.087 |
| Affected kernel number, pcs. | 0.002 * | 0.178 | 0.029 * |
| Middle kernel number, pcs | <<0.005 * | 0.114 | 0.016 * |
| Cultivar | Tillage Practice | Ear Length without Awns, mm | Spikelet Number, pcs | Fertile Spikelet Number, pcs | Kernel Number, pcs | Immature Kernel Number, pcs | Affected Kernel Number, pcs | Middle Kernel Number, pcs |
|---|---|---|---|---|---|---|---|---|
| Uchitel | Plowing | 86.5 ± 13.2 f | 14.5 ± 2.5 b,c | 11.2 ± 3.2 d | 19.7 ± 8.8 c | 2.6 ± 1.8 a | 2.9 ± 1.4 c | 3.4 ± 3.0 a,b |
| Non-moldboard loosening | 68.9 ± 5.3 c,d | 12.9 ± 0.7 a,b,c | 11.1 ± 1.7 d | 18.4 ± 4.3 c | 2.5 ± 3.0 a | 1.9 ± 1.6 a,b | 0.8 ± 1.4 a | |
| Fallow | 63.8 ± 12,7 b,c | 12.0 ± 2.7 a | 7.2 ± 2.9 a,b | 10.8 ± 4.4 a,b,c | 2.3 ± 1.6 a | 0.4 ± 0.7 a,b | 0.2 ± 0.6 a | |
| Ulyanovskaya 105 | Plowing | 74.9 ± 5.4 d,e,f | 14.8 ± 1.4 c | 11.8 ± 2.5 d | 19.5 ± 7.9 c | 3.1 ± 1.9 a | 1.1 ± 1.3 a,b | 2.3 ± 1.9 a,b |
| Non-moldboard loosening | 71.5 ± 11.5 d,e | 14.0 ± 2.2 b,c | 11.8 ± 2.3 d | 21.0 ± 8.3 d | 1.0 ± 1.2 a | 0.9 ± 0.7 a,b | 2.8 ± 3.0 a,b | |
| Fallow | 74.5 ± 5.6 c,d,e | 13.8 ± 1.2 b,c | 12.2 ± 1.2 d | 22.4 ± 3.0 d | 1.2 ± 1.9 a | 0.3 ± 0.7 a,b | 1.8 ± 1.9 a,b | |
| Orenburgskaya 10 | Plowing | 60.2 ± 9.1 b,c | 13.9 ± 2.0 b,c | 5.1 ± 2.8 a | 7.5 ± 5.4 a | 0.9 ± 1.0 a | 0.1 ± 0.3 a | 0.8 ± 0.8 a,b |
| Non-moldboard loosening | 46.1 ± 5.6 a | 10.3 ± 1.2 a | 6.3 ± 1.3 a | 10.6 ± 2.5 a,b | 0.5 ± 0.7 a | 0.4 ± 0.5 a,b | 1.0 ± 0.9 a,b | |
| Fallow | 59.5 ± 7.9 b | 13.6 ± 1.8 b,c | 9.8 ± 1.9 b,c | 17.5 ± 6.5 c | 1.8 ± 1.4 a | 1.2 ± 1.3 a,b | 1.5 ± 1.9 a,b | |
| Bezenchukskaya 210 | Plowing | 60.1 ± 4.9 b,c | 14.6 ± 1.6 b,c | 10.8 ± 2.7 d | 16.3 ± 5.3 c | 1.2 ± 1.1 a | 1.1 ± 1.4 a,b | 1.0 ± 1.4 a,b |
| Non-moldboard loosening | 52.4 ± 6.1 a,b | 12.5 ± 1.6 a,b | 9.9 ± 1.9 c,d | 21.8 ± 7.9 d | 1.2 ± 0.9 a | 1.1 ± 0.9 a,b | 4.1 ± 5.0 b | |
| Fallow | 51.4 ± 5.7 a | 14.6 ± 1.3 b,c | 11.0 ± 2.0 d | 21.8 ± 5.7 d | 1.6 ± 1.8 a | 1.3 ± 1.8 a,b | 2.7 ± 2.2 a,b | |
| Orenburgskaya 30 | Plowing | 80.4 ± 7.5 e,f | 14.2 ± 1.3 b,c | 11.4 ± 2.2 d | 21.6 ± 4.9 d | 4.5 ± 3.6 b | 1.0 ± 1.2 a,b | 3.0 ± 2.2 a,b |
| Non-moldboard loosening | 66.7 ± 5.9 c,d | 12.7 ± 1.2 a,b,c | 10.5 ± 1.4 c | 19.2 ± 2.9 a,b | 2.5 ± 1.2 a | 2.6 ± 2.8 b,c | 3.0 ± 1.1 a,b | |
| Fallow | 65.7 ± 4.5 c,d | 12.9 ± 1.0 b,c | 9.9 ± 0.9 c,d | 17.6 ± 2.3 c | 1.9 ± 1.4 a | 1.4 ± 1.8 a,b | 1.1 ± 1.3 a,b | |
| Tulaikovskaya Zolotistaya | Plowing | 72.8 ± 8.3 c,d,e | 13.3 ± 1.2 b,c | 10.2 ± 2.5 c,d | 18.6 ± 6.6 c | 4.3 ± 1.6 b | 0.3 ± 0.7 a,b | 3.5 ± 2.5 a,b |
| Non-moldboard loosening | 66.2 ± 5.9 c,d | 12.5 ± 1.2 a,b,c | 10.9 ± 1.9 d | 21.8 ± 6.1 d | 2.7 ± 2.2 a | 0.9 ± 1.4 a,b | 4.3 ± 3.2 b | |
| Fallow | 67.1 ± 12.5 c,d | 13.0 ± 1.6 b,c | 11.1 ± 1.9 d | 21.2 ± 6.2 d | 2.2 ± 2.6 a | 0.0 ± 0.0 a | 3.5 ± 2.5 a,b |
| Dependent Variable (Trait) | Independent Variables (Influence of Factors) | ||
|---|---|---|---|
| Cultivar | Sowing Date | Combination of Factors (Cultivar and Sowing Date) | |
| Ear length without awns, mm | <<0.005 * | 0.543 | 0.196 |
| Spikelet number, pcs | 0.087 | 0.129 | 0.918 |
| Fertile spikelet number, pcs. | <<0.005 * | <<0.005 * | <<0.005 * |
| Kernel number, pcs. | <<0.005 * | <<0.005 * | <<0.005 * |
| Immature kernel number, pcs. | 0.004 * | <<0.005 * | 0.004 * |
| Affected kernel number, pcs. | 0.003 * | 0.149 | 0.229 |
| Middle kernel number, pcs | 0.800 | <<0.005 * | 0.210 |
| Cultivar | Sowing Date | Spike Length without Awns, mm | Spikelet Number, pcs | Fertile Spikelet Number, pcs. | Kernel Number, pcs. | Immature Kernel Number, pcs. | Affected Kernel Number, pcs. | Middle Kernel Number, pcs |
|---|---|---|---|---|---|---|---|---|
| Ulyanovskaya 105 | First | 74.9 ± 5.4 b | 14.8 ± 1.4 a | 11.8 ± 2.5 b | 19.5 ± 7.8 b | 3.1 ± 1.8 b | 1.1 ± 1.2 b | 2.3 ± 1.9 a |
| Second | 76.4 ± 7.3 b | 14.0 ± 1.4 a | 13.6 ± 1.2 b | 30.2 ± 4.9 c | 0.3 ± 0.7 a | 0.5 ± 0.7 a,b | 6.3 ± 3.3 b | |
| Orenburgskaya 10 | First | 60.2 ± 9.1 a | 13.9 ± 2.0 a | 5.1 ± 2.8 a | 7.5 ± 5.4 a | 0.9 ± 0.9 a | 0.1 ± 0.3 a | 0.8 ± 0.8 a |
| Second | 56.1 ± 3.8 a | 13.2 ± 1.6 a | 12.8 ± 1.4 b | 30.2 ± 7.1 c | 0.3 ± 0.5 a | 0 a | 7.3 ± 4.8 b |
| Dependent Variable (Attribute Characteristic) | Independent Variables (Influence of Factors) | ||
|---|---|---|---|
| Cultivar | Sowing Date | Combination of Factors (Cultivar and Sowing Date) | |
| Ear length without awns, mm | 0.468 | 0.619 | 0.959 |
| Spikelet number, pcs | 0.140 | <<0.005 * | <<0.005 * |
| Fertile spikelet number, pcs. | 0.381 | 0.059 | 0.294 |
| Kernel number, pcs. | 0.040 * | 0.977 | 0.114 |
| Immature kernel number, pcs. | 0.620 | 0.002 * | 0.620 |
| Affected kernel number, pcs. | 0.186 | 0.186 | 0.980 |
| Middle kernel number, pcs | 0.036 * | 0.010 * | 0.004 * |
| Cultivar | Sowing Date | Ear Length without Awns, mm | Spikelet Number, pcs | Fertile Spikelet Number, pcs. | Immature Kernel Number, pcs. | Immature Kernel Number, pcs. | Affected Immature Kernel Number, pcs. | Middle Immature Kernel Number, pcs. |
|---|---|---|---|---|---|---|---|---|
| Luch 25 | First | 48.8 ± 7.4 a | 12.9 ± 1.4 a | 10.8 ± 1.5 a | 20.6 ± 5.5 a | 1.7 ± 2.0 b | 0.7 ± 0.8 a | 2.5 ± 2.3 a |
| Second | 49.8 ± 5.2 a | 12.9 ± 1.5 a | 10.3 ± 2.0 a | 17.7 ± 5.1 a | 0.2 ± 0.4 a | 0.4 ± 0.8 a | 2.2 ± 1.4 a | |
| Bezenchukskaya Zolotistaya | First | 50.4 ± 9.9 a | 15.2 ± 1.2 b | 11.9 ± 2.3 a | 21.5 ± 6.2 a | 1.3 ± 1.4 b | 0.4 ± 0.7 a | 1.8 ± 1.8 a |
| Second | 51.9 ± 3.6 a | 11.8 ± 0.8 a | 10.2 ± 0.8 a | 24.3 ± 5.4 a | 0.2 ± 0.4 a | 0.1 ± 0.3 a | 6.2 ± 3.4 b |
| Cultivar | Tillage Practice | Area of cross Section of Kernel | Perimeter of Kernel | Length of Kernel | Width of Kernel | Length of the Symmetry Axis of the Cut (Thickness of the Kernel) | Length of the Segment from the Bottom of the Cut Hole to the Bottom of the Cut | Total Asymmetry of Kernels |
|---|---|---|---|---|---|---|---|---|
| Uchitel | Plowing | a | b | a,b | a | a,b | a | a |
| Non-moldboard loosening | a | b | a | a | b | a | a | |
| Fallow | a | a | b | a | a | a | a | |
| Ulyanovskaya 105 | Plowing | a | a | a | a | a | a | b |
| Non-moldboard loosening | a | a | a | a | b | a,b | a | |
| Fallow | b | a | a | b | b | b | a,b | |
| Orenburgskaya 10 | Plowing | a | a | a | a | b | a | a |
| Non-moldboard loosening | b | b | b | b | b | b | a | |
| Fallow | b | b | b | b | a | b | a | |
| Bezenchukskaya 210 | Plowing | a | a | a | a | a | a | b |
| Non-moldboard loosening | a | a | a | a | a | a | a | |
| Fallow | a | a | a | a | a | b | a | |
| Orenburgskaya 30 | Plowing | a | a | a | a | a | a | a |
| Non-moldboard loosening | b | a | b | c | b | b | a | |
| Fallow | b | a | a,b | b | a,b | b | a | |
| Tulaikovskaya Zolotistaya | Plowing | a | a | a | a | a | a | a |
| Non-moldboard loosening | a,b | a | a,b | a,b | a,b | a | a | |
| Fallow | b | a | b | b | b | a | a |
| Cultivar | Tillage Practice | 1a | 1b | 2a | 2b | 3a | 3b | 4a | 4b | 5a | 5b |
|---|---|---|---|---|---|---|---|---|---|---|---|
| Uchitel | Plowing | a,b | b | b | b | b | a,b | b | a,b | b | b |
| Non-moldboard loosening | b | b | b | b | b | b | b | b | a | b | |
| Fallow | a | a | a | a | a | a | a | a | a | a | |
| Ulyanovskaya 105 | Plowing | a | a | a | a | a | a | a | a | a | a |
| Non-moldboard loosening | a | a | a | a | b | a | a | a | a | a | |
| Fallow | a | a | a | a | a,b | a | a | a | a | a | |
| Orenburgskaya 10 | Plowing | b | a,b | a | a | a | a,b | a | a | a | a |
| Non-moldboard loosening | b | b | a | b | a,b | a | a | a | b | b | |
| Fallow | a | a | a | b | b | b | a | a | b | b | |
| Bezenchukskaya 210 | Plowing | a | a | a | a | a | a | a | a | a | a |
| Non-moldboard loosening | a | a | a | a | a,b | a,b | a,b | a,b | a,b | a | |
| Fallow | a | a | a | a | b | b | b | b | b | a | |
| Orenburgskaya 30 | Plowing | b | b | a | a | a | a | a | a | a | a |
| Non-moldboard loosening | a | a | a | a | a | a | a | a | a,b | a | |
| Fallow | a,b | a | a | b | a | a | a | a | b | a | |
| Tulaikovskaya Zolotistaya | Plowing | a | a | a | a | a | a | a | a | a | a |
| Non-moldboard loosening | a | a | a | a,b | a | a,b | a | a,b | a | a | |
| Fallow | a | a | a | b | a | b | a | b | a | a |
Cultivar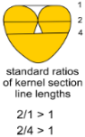 | Tillage Practice |  | 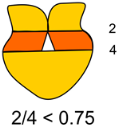 |  |  |
|---|---|---|---|---|---|
| Uchitel | Plowing Non-moldboard loosening Fallow | 0-0-0 0-0-3% 0-0-0 | 0-0-0 0-0-3% 9%-0-7% | 0-0-0 0-0-3% 0-0-2% | 5%-10%-7% 3%-3%-12% 23%-0-20% |
| Ulyanovskaya 105 | Plowing Non-moldboard loosening Fallow | 0-0-0 0-0-0 0-0-0 | 0-0-0 0-0-0 0-0-0 | 0-0-0 0-0-0 0-0-0 | 0-2%-0 0-0-0 2%-0-0 |
| Orenburgskaya 10 | Plowing Non-moldboard loosening Fallow | 0-0-2% 0-0-0 0-0-0 | 3%-14%-11% 0-3%-0 14%-5%-2% | 0-0-2% 0-0-0 0-0-0 | 11%-17%-25% 3%-5%-24% 24%-12%-21% |
| Bezenchukskaya 210 | Plowing Non-moldboard loosening Fallow | 0-0-0 0-0-0 0-0-0 | 0-0-2% 0-0-0 0-0-0 | 0-0-0 0-0-0 0-0-0 | 0-3%-3% 0-0-0 0-2%-0 |
| Orenburgskaya 30 | Plowing Non-moldboard loosening Fallow | 0-0-0 0-0-0 0-0-0 | 2%-2%-0 0-2%-0 0-0-0 | 0-0-0 0-0-0 0-0-0 | 8%-6%-2% 0-2%-0 0-7%-0 |
| Tulaikovskaya Zolotistaya | Plowing Non-moldboard loosening Fallow | 0-0-0 0-0-0 0-0-0 | 0-0-0 0-2%-0 0-0-0 | 0-0-0 0-0-0 0-0-0 | 0-5%-0 0-2%-0 0-2%-2% |
| Cultivar | Tillage Time | | | | |
|---|---|---|---|---|---|
| Ulyanovskaya 105 | First Second | 0-0-0 0-0-0 | 0-0-0 0-0-0 | 0-0-0 0-0-0 | 0-6%-0 0-0-0 |
| Orenburgskaya 10 | First Second | 0-0-2% 0-0-0 | 3%-14%-11% 0-0-0 | 0-0-2% 0-0-0 | 11%-17%-25% 0-0-0 |
| Cultivar | Sowing Date | | | | |
|---|---|---|---|---|---|
| Bezenchukskaya Zolotistaya | First Second | 0-0-0 0-0-0 | 0-0-0 0-0-0 | 0-0-0 0-0-0 | 0-0-0 0-2%-2% |
| Luch 25 | First Second | 0-0-0 0-0-0 | 0-0-0 0-0-0 | 0-0-0 0-0-0 | 0-2%-0 2%-2%-0 |
Disclaimer/Publisher’s Note: The statements, opinions and data contained in all publications are solely those of the individual author(s) and contributor(s) and not of MDPI and/or the editor(s). MDPI and/or the editor(s) disclaim responsibility for any injury to people or property resulting from any ideas, methods, instructions or products referred to in the content. |
© 2024 by the authors. Licensee MDPI, Basel, Switzerland. This article is an open access article distributed under the terms and conditions of the Creative Commons Attribution (CC BY) license (https://creativecommons.org/licenses/by/4.0/).
Share and Cite
Aniskina, T.S.; Sudarikov, K.A.; Prisazhnoy, N.A.; Besaliev, I.N.; Panfilov, A.A.; Reger, N.S.; Kormilitsyna, T.; Novikova, A.A.; Gulevich, A.A.; Lebedev, S.V.; et al. Phenotyping Wheat Kernel Symmetry as a Consequence of Different Agronomic Practices. Symmetry 2024, 16, 548. https://doi.org/10.3390/sym16050548
Aniskina TS, Sudarikov KA, Prisazhnoy NA, Besaliev IN, Panfilov AA, Reger NS, Kormilitsyna T, Novikova AA, Gulevich AA, Lebedev SV, et al. Phenotyping Wheat Kernel Symmetry as a Consequence of Different Agronomic Practices. Symmetry. 2024; 16(5):548. https://doi.org/10.3390/sym16050548
Chicago/Turabian StyleAniskina, Tatiana S., Kirill A. Sudarikov, Nikita A. Prisazhnoy, Ishen N. Besaliev, Alexander A. Panfilov, Nelli S. Reger, Tatyana Kormilitsyna, Antonina A. Novikova, Alexander A. Gulevich, Svyatoslav V. Lebedev, and et al. 2024. "Phenotyping Wheat Kernel Symmetry as a Consequence of Different Agronomic Practices" Symmetry 16, no. 5: 548. https://doi.org/10.3390/sym16050548