
Comparison of STP and TP Modes of Wire and Arc Additive Manufacturing of Aluminum–Magnesium Alloys: Forming, Microstructures and Mechanical Properties
1
College of Robotics, Guangdong Open University, Guangzhou 510091, China
2
School of Electrical and Mechanical, Guangdong Polytechnic Normal University, Guangzhou 510635, China
3
School of Mechanical Engineering, Yangtze University, Jingzhou 434023, China
*
Author to whom correspondence should be addressed.
Metals 2024, 14(5), 549; https://doi.org/10.3390/met14050549
Submission received: 11 April 2024
/
Revised: 1 May 2024
/
Accepted: 4 May 2024
/
Published: 7 May 2024
(This article belongs to the Special Issue Additive Manufacturing of Light Metal Alloys)
Abstract
:Aluminum–magnesium (Al–Mg) alloys, known for their lightweight properties, are extensively utilized and crucial in the advancement of wire and arc additive manufacturing (WAAM) for direct high-quality printing—a focal point in additive manufacturing research. This study employed 1.2 mm ER5356 welding wire as the raw material to fabricate two sets of 30-layer thin-walled structures. These sets were manufactured using two distinct welding modes, speed-twin pulse (STP) and twin pulse (TP). Comparative evaluations of the surface quality, microstructures, and mechanical properties of the two sets of samples indicated that both the STP and TP modes were suitable for the WAAM of Al–Mg alloys. Analyses of grain growth in the melt pools of both sample sets revealed a non-preferential grain orientation, with a mixed arrangement of equiaxed and columnar grains. The STP mode notably achieved a refined surface finish, a reduced grain size, and a slight increase in tensile strength compared to the TP mode. From the comparison of the tensile data at the bottom, middle, and top of the two groups of samples, the additive manufacturing process in the STP mode was more stable.
1. Introduction
Al–Mg alloys, with promising development prospects, are highly regarded for their lightweight nature, high-strength properties, and ease of processing, making them increasingly favored across diverse industries, such as the automotive, aerospace, electronics, and machine industries [1,2,3,4]. WAAM utilizes an electric arc as a heat source to fuse metal wires, allowing the synchronous construction of components along a programmed path. This method presents advantages in terms of cost-effectiveness, high material efficiency, and rapid fabrication, making it particularly suitable for the manufacturing of parts of varying sizes [5,6,7]. Research on the WAAM of aluminum alloys has yielded valuable insights [8,9].
Liu et al. [10] delved into the influence of the feed-to-build rate ratio on the thickness of additively manufactured walls using Al wire. Their findings suggested that a higher ratio results in an increased wall thickness, layer height, and surface undulation, although it also heightens the likelihood of porosity. Reference [11] has acknowledged the potential of WAAM regarding the rapid, efficient, and cost-effective production of metal components of various sizes. This cutting-edge technology has been recognized as a promising method for the manufacturing of a wide range of products from diverse engineering materials, including Al alloys. Derekar [12] has argued that, despite its advancement, WAAM should not be considered a fully matured manufacturing process due to the significant residual stresses, inconsistent mechanical properties, and the ongoing need for further research to mitigate the products’ porosity, enhance their tensile strength, and refine their microstructures. In a comparative analysis of two additive manufacturing processes, pulsed metal inert gas (MIG) and cold metal transfer (CMT), it was found that the pulsed MIG process results in higher hydrogen absorption in the produced samples [13]. Research focusing on bimetallic aluminum–copper components produced via CMT WAAM demonstrated that increased heat input during deposition enhanced both the tensile strength and ductility, with the ultimate tensile strength being the highest along the deposition direction rather than along the in-plane direction [14]. Zhang et al. [15] have successfully fabricated high-strength 2024 alloy samples with reduced porosity and surface roughness by optimizing the pulsed CMT parameters. Reference [16] has also discussed the influence of the transfer mode of the melt droplet on the compositional uniformity of additively manufactured parts, highlighting the critical role of this transfer mode in determining the performance of the final product. A theoretical model proposing the optimization of the interlayer temperature and heat input of each deposition layer for the stable additive manufacturing of 5A06 alloy has been presented [17]. Ryan et al.’s [18] research into various welding modes for Al alloy additive manufacturing has revealed that the surface finish quality of the metal wire affects hydrogen’s presence on the wire surface and the arc stability, thereby influencing the porosity. Furthermore, in addition to process optimization, the control of the melt droplet transition, and auxiliary heating, the integration of machine learning has been explored as a means to enhance the quality of WAAM products from Al–Mg alloys [19]. Yu [20] analyzed arc phenomena in various DE-GMAW modes and correlated them with distinct arc systems having varying voltages. These voltages served as automatically derived labels to train the deep learning network. In order to obtain a stable arc length and droplet transfer, a mathematical power-arc model of P-GMAW was established through an experimental statistical method, which showed good feasibility in Al–Mg alloy welding [21]. A phased array ultrasonic method was developed by Liu [22] to characterize the inhomogeneity and anisotropy of wire and arc additively manufactured components by performing both beam focusing and steering. The ultrasonic measurements, performed on wire and arc additively manufactured 2319 aluminum alloy, showed that the sample was inhomogeneous and weakly anisotropic. Ma [23] proposed a novel programmable heat input WAAM (PHI-WAAM) to efficiently manufacture Al–Mg alloys with low heat input. The experimental result showed that the productivity was improved by 162.1%, the average grain size was decreased from 69 μm to 38 μm, and the ultimate tensile strength and yield strength were increased by 7.8% and 11.1%, respectively. In literature [24], various research works associated with the application of WAAM of aluminum alloys for the aerospace and automotive industries, their metallurgical characteristics, and their mechanical properties have been reviewed and discussed in detail to identify the research gaps and future research directions. ER5356 wire was employed to build Al–Mg components with different heat inputs by adjusting the wire feed speed and travel speed [25]. The mechanical properties of the Al–Mg samples were relatively stable under different conditions; all parts had better performance than the 5356 conventional casting alloys. The effects of nitrogen and argon as protective gases in the arc additive manufacturing process of 5356 aluminum alloy were compared, and the mechanical properties of the samples protected by argon gas were superior [26]. Through comparative experiments, reference [27] has demonstrated that the pulsed-AC mode is a very attractive mode for aluminum alloy arc additive manufacturing. Reference [28] indicates that the average microhardness of 5356 aluminum alloy walls manufactured by arc additive manufacturing is 70.15 HV, increasing from 57 HV at the top to 81 HV at the bottom.
The conclusion is that wire arc additive manufacturing (WAAM) is suitable for the printing of medium-to-large complex parts with structural integrity while reducing material wastage and the lead time, improving the quality and customized design of functional components. However, the inherent challenges associated with welding Al–Mg alloys often lead to defects such as excessive porosity, an unsatisfactory appearance, and inadequate mechanical properties [29,30,31].
Through experiments, it was found that the current pulse mode in aluminum magnesium alloy welding had a significant impact on the formation and mechanical properties of the weld seam. The present study focused on the 5356 alloy and utilized WAAM for the direct shaping of the material. The study investigated the process using two distinct welding modes, twin pulse (TP) and speed-twin pulse (STP), to evaluate the stability of the additive manufacturing process for the Al–Mg alloy. The investigation also involved assessing the surface quality, microstructure, and mechanical properties of the fabricated samples.
2. Materials and Methods
2.1. TP and STP Pulse Modes
Most aluminum alloy materials are welded by the double pulse welding method with alternating strong and weak pulses, and the weld will show a beautiful fish-scale pattern. In pulse welding, there are three forms of droplet transfer, namely one droplet in multiple pulses, one droplet in one pulse, and multiple droplets in one pulse. Among them, the welding process of one droplet in multiple pulses has large spatter, an unstable molten pool, and poor weld forming quality, and it is generally not used for the welding of aluminum alloy materials [32]. The TP and STP modes are aluminum alloy welding processes developed by the LORCH Corporation (LORCH, Auenwald, Germany) for one drop per pulse and multiple drops per pulse, respectively. The TP mode utilizes a traditional dual-pulse welding approach, characterized by a single melt droplet per pulse transfer. In contrast, the STP mode introduces an advanced pulse droplet technique, where the primary pulse droplet is supplemented by a secondary material transition, similar to a spray arc process.
The schematic diagram of the droplet transfer in TP mode is shown in Figure 1a. In the process of the pulsed MIG welding of aluminum alloy, the welding wire begins to melt at the peak time of the current pulse. When the current pulse decreases from the peak time to the base time, one metal droplet with a diameter similar to that of the welding wire falls off from the front end of the welding wire and transfers to the molten pool to complete the droplet transfer [21]. The next current pulse will repeat the droplet transfer process of the previous one. The arc length of the whole welding process is stable and regular with less spatter. The schematic diagram of the droplet transfer in STP mode is shown in Figure 1b. The welding wire starts to melt at the peak time of the current pulse. When the current pulse declines from the peak time to the base time, the first droplet with a diameter similar to the diameter of the welding wire falls off from the front end of the welding wire and transfers to the molten pool, and then several droplets with a diameter much smaller than the diameter of the welding wire transfer into the molten pool with the first droplet in the same current pulse cycle, completing the transfer of one pulse; then, the next current pulse is repeated continuously. This transfer mode has a great impact on the molten pool, with deep penetration, which is conducive to hydrogen overflow from the molten pool [33,34]. These two modes are widely used in aluminum alloy welding.
2.2. Material Fabrication
The experiment utilized an ER5356 welding wire that was 1.2 mm in diameter. As a substrate material, a 6061-T6 plate with a thickness of 10 mm was used. For better heat dissipation, a 200 mm × 200 mm × 20 mm copper plate was added under the substrate. Prior to welding, the surface of the substrate material was mechanically cleaned to remove oxides and contaminants. The selected welding method was oscillating overlay welding, conducted in a reciprocating manner. Table 1 presents the chemical compositions of both the welding wire (5356 alloy) and the substrate material (6061-T6 alloy).
The experimental setup incorporated a gas metal arc welding (GMAW) robotic arc additive manufacturing system, comprising a LORCH S5-RoboMIG welding power source (LORCH, Auenwald, Germany), an RF-06 wire feeder(LORCH, Auenwald, Germany), and a FANUC M-10iA robotic arm (FANUC, Yamanashi Prefecture, Japan). This welding power source was configured to support two distinct Al alloy welding modes: TP and STP. The study involved constructing 30-layer thin-wall structures using the two mentioned welding modes. Standardized welding parameters were utilized, including a constant welding current of 120 A, a welding speed of 400 mm/min, a pulse frequency of 3 Hz, and a duty cycle fixed at 50%. The wire feeding rate and welding voltage were automatically adjusted based on the welding current intensity. A 60 s waiting time was maintained between layers and after completing each new layer. Argon gas, with purity of 99.99%, was employed for shielding at a flow rate of 15 L/min, while maintaining the torch-to-work distance at 15 mm. Due to the heat accumulation of the wall during the deposition process, the wall temperature rises continuously, and the fixed cooling time of each layer will lead to different cooling temperatures in each deposition layer; moreover, the height of each layer will be different. The experiment found that the layer height gradually decreased with the increase in the number of stacked layers, so the welding torch was programmed to increase by 2 mm for each layer within the first 10 layers; by 1.8 mm for each layer from the 10th to the 20th layer; and by 1.5 mm for each layer from the 20th to the 30th layer, to ensure stable arc starting.
2.3. Microstructural Characterization
After the deposition process, the superficial oxide layer on the wall was removed using a grinding tool. Tensile test specimens were then extracted at symmetrical horizontal positions on both sides of the wall using wire electrical discharge machining. For metallography and hardness testing, the central portions of the wall were preserved, as depicted in Figure 2. The sample preparation involved electropolishing in an alcohol solution containing 10% perchloric acid. The voltage was set at 25 V, while the current was regulated between 0.2 and 0.5 A for a duration of 100 s. The identification of the crystalline phases contained in the samples was carried out using a D/MAX-RB X-ray diffractometer (XRD). The XRD analysis was performed within a scanning range of 20–90° 2θ at a scanning rate of 6°/min. Electron backscatter diffraction (EBSD) analysis was employed to reveal the crystallographic orientations and morphologies of the Al grains within the samples. EBSD was performed using a field-emission scanning electron microscope (FE-SEM, XL-30s FEG, FEI Co., Hillsboro, OR, USA). During the measurements, the FE-SEM was operated at 20 kV. The analysis was conducted with a 5 s exposure time, in a high beam current mode at 50× magnification, using a step size of 4 μm and a 120 aperture.
2.4. Mechanical Property Tests
Upon extraction, the tensile specimens were subjected to water-cooled grinding to achieve a uniform thickness of 3 mm. Figure 3 illustrates the precise dimensions of these specimens. Due to the limited size of the deposited wall, the dimensions of the tensile test specimens were proportionally reduced in comparison to standard international sizes. The Vickers hardness data of the samples were obtained using a Shimadzu HMV-2T hardness tester (Shimadzu (China) Co., Ltd., Suzhou, China). Hardness measurements were conducted in the direction perpendicular to the deposition direction, starting from the bottom of each sample, with a step size of 1 mm. During testing, a uniform load of 200 g for a dwell time of 10 s was applied at each measurement point.
3. Results
3.1. Macromorphology of Deposited Samples
Figure 4a presents the surface macromorphology of the first four layers fabricated by the STP mode during the additive manufacturing process. The figure reveals the bright surface of the weld seam, with minimal spatter, along with a distinct and regular fish-scale pattern, indicative of a stable deposition process. The sound of the arc during the deposition process was soft with regular buzzing, and no arc break occurred. Figure 4b shows the macromorphology of a 30-layer thin-walled structure produced using both the STP and TP modes. This image clearly demonstrates the successful formation of the wall structure by both modes.
After thorough polishing aimed at removing surface contaminants such as dust and oxides, it was evident that both sets of walls achieved a nearly uniform height of 5 cm. The upper surfaces of the walls were circular arcs, and the sidewalls of the deposition samples had obvious interlaminar stripe characteristics. The surface circular arc shape was mainly attributed to the surface tension of the liquid metal. The outer surface between layers was slightly circular, which was a residual trace of interlayer deposition, and the interlaminar lines were approximately parallel. Due to the reciprocating surfacing, both ends of the wall exhibited arc striking and arc stopping, so the bulge and collapse at both ends were not significant, but there was a pit at the end of the last layer.
From the appearance, the walls constructed using the STP mode demonstrated smoother lateral surfaces and well-arranged layers compared to those fabricated with the TP mode, which exhibited protrusions due to stacked weld seams. Keeping all welding parameters constant, the molten pool’s stability in the STP mode surpassed that of the TP mode, leading to enhanced consistency across the layers during additive manufacturing. However, the walls created with the TP mode displayed a noticeable discrepancy in their end heights, particularly on the lower right side. This discrepancy was ascribed to the instability of the molten pool during deposition, where the molten pool tended to overflow near the rear section of the process. As described in reference [7,21], the arc behavior has an impact on the appearance of parts, indicating that the stability of the TP mode arc during additive manufacturing is not as good as that of the STP mode arc. Consequently, this caused a protrusion and resulted in a height difference within the same weld seam. This issue became more pronounced with each additional layer, eventually leading to a significant decrease in height on the right side of the structure.
3.2. Microstructural Analysis of Deposited Samples
In order further to identify the chemical compounds, the XRD spectrum was studied. Figure 5 shows the XRD patterns taken from two sets of samples extracted from the top, middle, and bottom regions of the thin-walled structures. The analysis demonstrated that, regardless of the sample location, both sets of samples comprised an α-Al matrix and a β (Al3Mg2) phase, which is consistent with the literature [25].
EBSD analysis was employed to investigate the grain distribution and microstructural properties of two sets of samples, as presented in Figure 6. The inverse pole figure maps, depicted in Figure 6a,b, revealed that, within the melt pools created by both fabrication modes, the grain growth was not predominantly unidirectional. Instead, there was a diverse mixture of equiaxed and columnar grains, with the majority tending to grow perpendicularly to the direction of additive deposition. Figure 6c,d show the distribution of grain sizes for the two sets of samples. For the samples produced using the STP mode, the average grain diameter was calculated to be 58.2 µm, with the range of its values extending from a minimum of 14.3 to a maximum of 269.1 µm. In contrast, the samples fabricated using the TP mode exhibited a larger mean grain diameter of 80.6 µm, with its values ranging from 14.3 to 361.9 µm. These results suggested a coarser grain structure produced by the TP mode compared to that obtained by the STP mode. Reference [33] indicated that the natural frequency of the droplet increases with a decrease in droplet size. In STP mode, more small droplets are transferred to the melt pool, thereby changing the oscillation frequency of the melt pool. The finer grain size observed in the STP mode samples was postulated to result from the unique oscillatory motion imparted on the melt pool, despite maintaining a constant welding current and voltage for both modes. An analysis of the pole figures indicated that the STP samples exhibited lower texture strength, with a maximum value of 2.73, whereas the TP samples displayed more significant texture intensity, peaking at 3.70. These data suggested that the utilization of the STP mode during the additive manufacturing of 5356 alloy served to reduce the textural strength, which could reduce the anisotropy in the mechanical properties of the material.
3.3. Mechanical Properties of Deposited Samples
In order to fully study the mechanical properties of the walls manufactured by the STP mode and TP mode, microhardness testing was conducted on two distinct sets of thin-wall structures, where the hardness was measured with a step size of 1 mm from the bottom to the top of the additively manufactured components, resulting in a dataset of 50 hardness values per set. The resulting hardness profiles, illustrated in Figure 7, exhibited a sinusoidal fluctuation in hardness along the height of the thin-wall structures for both sets of samples. The STP samples demonstrated average microhardness of 73 HV. Notably, there was an observable trend of increasing hardness near the bottom compared to the top, alongside a non-uniform distribution of the hardness values ranging from a minimum of 68 HV to a maximum of 79 HV. The TP samples exhibited average hardness of 71 HV, with individual hardness values ranging from a minimum of 66 HV to a maximum of 76 HV. This pattern of hardness variation mirrored that of the STP samples, characterized by a wave-like profile consistent with the trend in reference [25]. The sinusoidal nature of the hardness profile in both sample sets was attributed to the layered arrangement of the microstructures within the thin-wall structures. The alternating presence of fine equiaxed grains and coarse columnar grains throughout the vertical cross-section was assumed to cause periodic changes in the hardness properties. From the hardness curve, the Vickers hardness data of the two groups of samples had little difference. Compared with the TP mode, the hardness value in the STP mode was slightly higher, which may have been caused by the more uniform and regular oscillation and stirring of the molten pool in the STP mode. The hardness of the last few layers in the TP mode decreased rapidly, and the minimum hardness value of 66 HV was measured. This is because the manufacturing process of the last few layers in TP mode is not stable, the heat accumulation is too large, the molten pool at the rear of the wall overflows, and the cooling crystallization rate of the liquid metal is slower than that of the previous layers.
Figure 8 displays the tensile curves obtained from the two sets of tensile test specimens extracted from the top, middle, and bottom regions of the thin-walled structure. The tensile properties derived from these curves are presented in Table 2. It can be calculated from the data in the table that the average tensile strength of the STP sample is 250.2 mpa, the average yield strength is 121.9 mpa, and the average elongation at break is 27.9%. The average tensile strength of the TP sample is 247.3 mpa, the average yield strength is 117.7 mpa, and the average elongation at break is 24.8%. Compared with the 5356 aluminum alloy wall manufactured by CMT in reference [8], the tensile strengths of the two samples are slightly lower, while the yield strength and elongation at break are slightly higher. The STP samples consistently demonstrated superior tensile strength, yield strength, and ductility compared to the TP samples. The mechanical properties exhibited a marginal enhancement from the top to the bottom of the samples. This trend was attributed to the cooler conditions at the substrate and copper heat sink in the early stages of additive manufacturing, which favor more effective heat dissipation. Consequently, the melt pool in the lower layers underwent increased undercooling, resulting in the quick solidification of the metal and the creation of predominantly fine equiaxed grains. In contrast, the upper layers experienced elevated temperatures due to accumulated heat, leading to less efficient heat dissipation. These conditions allowed for longer grain growth periods, which presumably led to the formation of larger dendritic grains. The tensile data and hardness test data confirm each other and support the analysis.
Table 2 shows that the difference in the three groups of tensile data in TP mode is greater than that in STP mode. The difference in tensile strength between the bottom and top in TP mode is 3.4%, and the difference in elongation at break is 23.9%. The maximum difference in tensile strength in STP mode is 0.96%, and the maximum difference in elongation at break is 8.6%. The analysis shows that the additive manufacturing of the 30-layer wall in STP mode is relatively stable, and the process of weld deposition in each layer is repeatable, so the tensile properties of the whole wall are relatively consistent. The deposition process of TP mode in the last few layers of the wall is unstable, which not only leads to metal overflow in the molten pool at the end of the wall, but also leads to a decline in the tensile properties in the top area.
Figure 9 illustrates the morphology of the fractured surfaces of the 5356 alloy tensile test specimens in the middle area observed after tensile testing. The microfractographs reveal fractured surfaces covered with numerous ductile dimples of varying sizes, indicating that the samples from both sets underwent ductile fracture.
4. Conclusions
The present study involved fabricating two sets of 30-layer thin-walled structures using the STP and TP welding modes. Both types of walls were produced with stable processes and less spatter. The analysis of the surface finish quality, microstructure, and mechanical properties led to the following conclusions.
- (1)
- Both the STP and TP modes effectively produced Al alloy walls via WAAM, resulting in structures primarily composed of an α-Al matrix and β (Al3Mg2) phase. The mechanical properties aligned with the standards for the casting of 5356 Al–Mg alloys.
- (2)
- The grain formation in the melt pools of both sample sets lacked a significant directional preference, displaying a mixture of equiaxed and columnar grains. The EBSD analysis revealed that the average grain size was slightly smaller in STP samples compared to TP samples.
- (3)
- The measurements across both sample sets indicated periodic fluctuations in hardness from the bottom to the top, with minimal differences in the average hardness. The STP samples exhibited marginally superior tensile strength, yield strength, and elongation at break. From the comparison of the tensile data of the bottom, middle, and top regions of the two groups of samples, the manufacturing process of the STP mode is more stable. During testing, tensile test specimens taken from both sample sets failed by ductile fracture.
In summary, in the deposition process of aluminum–magnesium alloy thin-walled structures via melt inert gas welding, the form of droplet transfer has an important impact on the mechanical properties of the sample. Compared with TP mode, with one droplet and one pulse, STP mode, with one pulse and multiple droplets in the metal transfer mode, leads to a neater appearance, finer grains, higher hardness, and stronger average tensile properties, and the mechanical properties at the bottom, middle, and top of the wall show smaller differences.
Author Contributions
Conceptualization, Q.Z. and P.Y.; methodology, Q.Z.; validation, P.Y., Q.Z. and H.L.; formal analysis, Q.Z.; data curation, Q.Z. and H.L; writing—original draft preparation, Q.Z.; writing—review and editing, Q.Z. and P.Y.; project administration, P.Y.; funding acquisition, P.Y. All authors have read and agreed to the published version of the manuscript.
Funding
This research was funded by the National Natural Science Foundation of China, grant number 51805099; the Scientific Research Projects of Colleges and Universities in Guangdong Province, grant number 2022ZDZX3046; and the Science and Technology Projects in Guangzhou, grant number 202201011747.
Data Availability Statement
The raw data supporting the conclusions of this article will be made available by the authors on request.
Conflicts of Interest
The authors declare no conflicts of interest.
References
- Klein, T.R.L.; Schnall, M. Wire-arc additive manufacturing of Al-Zn5.5-Mg-Cu (ML7075): Shifting paradigms of additive manufacture-ability. Mater. Lett. 2022, 313, 131841. [Google Scholar] [CrossRef]
- Hauser, T.; Reisch, R.T.; Breese, P.P.; Nalam, Y.; Joshi, K.S.; Bela, K.; Kamps, T.; Volpp, J.; Kaplan, A.F.H. Oxidation in wire arc additive manufacturing of aluminium alloys. Addit. Manuf. 2021, 41, 101958. [Google Scholar] [CrossRef]
- Huang, Y.; Zhang, F.; Yuan, J.; Jia, C.P.; Ren, X.K.; Yang, L.J. Investigation on surface morphology and microstructure of double-wire plus arc additive manufactured aluminum alloys based on spectral analysis. J. Manuf. Process. 2022, 84, 639–651. [Google Scholar] [CrossRef]
- Hou, X.; Ye, X.; Qian, X.; Zhang, X.; Zhang, P.L.; Lu, Q.H.; Yu, Z.S.; Shen, C.; Wang, L.; Hua, X.M. Heat Accumulation, Microstructure Evolution, and Stress Distribution of Ti-Al Alloy Manufactured by Twin-Wire Plasma Arc Additive. Adv. Eng. Mater. 2022, 24, 2101151. [Google Scholar] [CrossRef]
- Liu, G.; Xiong, J. External filler wire based GMA-AM process of 2219 aluminum alloy. Mater. Manuf. Process. 2020, 35, 1268–1277. [Google Scholar] [CrossRef]
- Li, C.D.; Gu, H.M.; Wang, W.; Wang, S.; Ren, L.L.; Zhai, Y.C.; Wang, Z.B.; Ming, Z. Microstructure and properties of Al-7Si-0.6Mg alloys with different Ti contents deposited by wire arc additive manufacturing. Rare Metals. 2021, 40, 2530–2537. [Google Scholar] [CrossRef]
- Huang, Y.; Hou, S.; Yang, L.; Tian, G.; Yong, Z.; Liu, S.Y. Effect of arc dynamic behavior on deposition quality of additive manufactured aluminum alloys. J. Mater. Process. Tech. 2021, 295, 117172. [Google Scholar] [CrossRef]
- Koehler, M.; Hensel, J.; Dilger, K. Effects of Thermal Cycling on Wire and Arc Additive Manufacturing of Al-5356 Components. Metals 2020, 10, 952. [Google Scholar] [CrossRef]
- Hauser, T.; Da Silva, A.; Reisch, R.T.; Volpp, J.; Kamps, T.; Kaplan, A.F.H. Fluctuation effects in Wire Arc Additive Manufacturing of aluminium analysed by high-speed imaging. J. Manuf. Process. 2020, 56, 1088–1098. [Google Scholar] [CrossRef]
- Liu, Z.Q.; Zhang, P.L.; Li, S.W.; Wu, D.; Yu, Z.S. Wire and arc additive manufacturing of 4043 Al alloy using a cold metal transfer method. Int. J. Min. Met. Mater. 2020, 27, 783–791. [Google Scholar] [CrossRef]
- Pramod, R.; Kumar, S.M.; Girinath, B.; Kannan, A.R.; Kumar, N.P.; Shanmugam, N.S. Fabrication, characterisation, and finite element analysis of cold metal transfer-based wire and arc additive-manufactured aluminium alloy 4043 cylinder. Weld World 2020, 64, 1905–1919. [Google Scholar] [CrossRef]
- Derekar, K.S. A review of wire arc additive manufacturing and advances in wire arc additive manufacturing of aluminium. Mater. Sci. Tech-Lond. 2018, 34, 895–916. [Google Scholar] [CrossRef]
- Derekar, K.S.; Addison, A.; Joshi, S.S.; Zhang, X.; Lawrence, J.; Xu, L.; Melton, G.; Griffiths, D. Effect of pulsed metal inert gas (pulsed-MIG) and cold metal transfer (CMT) techniques on hydrogen dissolution in wire arc additive manufacturing (WAAM) of aluminium. Int. J. Adv. Manuf. Tech. 2020, 107, 311–331. [Google Scholar] [CrossRef]
- Chen, D.; Wang, L.; He, S.; Lyu, F.Y.; Zhan, X.H. Three-dimensional forming characteristics and mechanical property of additive manufacturing aluminium-copper alloys. Mater. Sci. Tech-Lond. 2022, 38, 1519–1531. [Google Scholar] [CrossRef]
- Zhang, Z.; Yan, J.; Lu, X.; Zhang, T.G.; Wang, H. Optimization of porosity and surface roughness of CMT-P wire arc additive manufacturing of AA2024 using response surface methodology and NSGA-II. J. Mater. Res. Technol. 2023, 24, 6923–6941. [Google Scholar] [CrossRef]
- Xin, J.; Wu, D.; Chen, H.; Wang, L.; Zhou, W.L.; Wu, K.L.; Zhang, Y.L.; Shen, C.; Hua, X.M.; Li, F. Effect of droplet transfer mode on composition homogeneity of twin-wire plasma arc additively manufactured titanium aluminide. Int. J. Adv. Manuf. Tech. 2023, 124, 1723–1734. [Google Scholar] [CrossRef]
- Geng, H.; Li, J.; Xiong, J.; Lin, X. Optimisation of interpass temperature and heat input for wire and arc additive manufacturing 5A06 aluminium alloy. Sci. Technol. Weld. Joi. 2017, 22, 472–483. [Google Scholar] [CrossRef]
- Ryan, E.; Sabin, T.; Watts, J.; Whiting, M. The influence of build parameters and wire batch on porosity of wire and arc additive manufactured aluminium alloy 2319. J. Mater. Process. Tech. 2018, 262, 577–584. [Google Scholar] [CrossRef]
- Langelandsvik, G.; Akselsen, O.M.; Furu, T.; Roven, H.J. Review of Aluminum Alloy Development for Wire Arc Additive Manufacturing. Materials 2021, 14, 5370. [Google Scholar] [CrossRef]
- Yu, R.; Cao, Y.; Martin, J.; Chiang, O.; Zhang, Y.M. Deep-learning based supervisory monitoring of robotized DE-GMAW process through learning from human welders. Weld. World 2023, 68, 781–791. [Google Scholar] [CrossRef]
- Wang, Q.; Qi, B.; Xu, Y.L.; Wu, A.P.; Zhao, Y.; Zhang, H.J. Power-arc model based adaptive arc length control of P-GMAW for Al-Mg alloy. Int. J. Adv. Manuf. Tech. 2023, 128, 639–651. [Google Scholar] [CrossRef]
- Liu, Y.; Wang, X.Y.; Oliveira, J.P.; He, J.J.; Guan, X.F. Spatial and directional characterization of wire and arc additive manufactured aluminum alloy using phased array ultrasonic backscattering method. Ultrasonics 2023, 132, 107024. [Google Scholar] [CrossRef] [PubMed]
- Ma, C.; Yan, Y.H.; Yan, Z.Z.; Liu, Y.H.; Wu, X.L.; Li, D.; Zhang, M.Y.; Liu, P.; Jin, H. Efficient manufacturing of Al-Mg alloys using controlled low heat input wire and arc additive manufacturing. J. Mater. Process. Tech. 2023, 314, 117899. [Google Scholar] [CrossRef]
- Omiyale, B.O.; Olugbade, T.O.; Abioye, T.E.; Farayibi, P.K. Wire arc additive manufacturing of aluminium alloys for aerospace and automotive applications: A review. Mater. Sci. Tech-Lond 2022, 38, 391–408. [Google Scholar] [CrossRef]
- Su, C.; Chen, X.; Gao, C.; Wang, Y. Effect of heat input on microstructure and mechanical properties of Al-Mg alloys fabricated by Waam. Appl. Surf. Sci. 2019, 486, 431–440. [Google Scholar] [CrossRef]
- Li, S.; Zhang, L.J.; Ning, J.; Wang, X.; Zhang, G.F.; Zhang, J.X.; Na, S.; Fatemeh, B. Comparative study on the microstructures and properties of wire plus arc additively manufactured 5356 aluminium alloy with argon and nitrogen as the shielding gas. Addit. Manuf. 2020, 34, 101206. [Google Scholar]
- Aldalur, E.; Suarez, A.; Veiga, F. Metal transfer modes for Wire Arc Additive Manufacturing Al-Mg alloys: Influence of heat input in microstructure and porosity. J. Mater. Process. Technol. 2021, 297, 117271. [Google Scholar] [CrossRef]
- Sharma, S.K.; Chandra, M.; Kazmi, K.H.; Shukla, A.K.; Rajak, S. Surface Characteristics, Microstructural, and Tribological Behavior of Wire Arc Additive Manufactured Aluminum-5356 Alloy. J. Mater. Eng. Perform. 2024. [Google Scholar] [CrossRef]
- Hauser, T.; Reisch, R.T.; Breese, P.P.; Lutz, B.S.; Pantano, M.; Nalam, Y.; Bela, K.; Kamps, T.; Volpp, J.; Kaplan, A.F.H. Porosity in wire arc additive manufacturing of aluminium alloys. Addit. Manuf. 2021, 41, 101993. [Google Scholar] [CrossRef]
- Fang, X.; Chen, G.; Yang, J.; Xie, Y.; Huang, K.; Lu, B.H. Wire and Arc Additive Manufacturing of High-Strength Al-Zn-Mg Aluminum Alloy. Front. Mater. 2021, 8, 656429. [Google Scholar] [CrossRef]
- Eimer, E.; Williams, S.; Ding, J.; Ganguly, S.; Chehab, B. Effect of Substrate Alloy Type on the Microstructure of the Substrate and Deposited Material Interface in Aluminium Wire plus Arc Additive Manufacturing. Metals 2021, 11, 916. [Google Scholar] [CrossRef]
- Subramaniam, S.; White, D.R.; Jones, J.E.; Lyons, D.W. Droplet transfer in pulsed gas metal arc welding of aluminum. Weld. J. 1998, 77, 458–464. [Google Scholar]
- Zhang, X.C.; Li, Z.W.; Gao, H.M. Online measurement of droplet size by actively exciting droplet oscillation in GMAW and GMAW-AM. J. Manuf. Process. 2023, 85, 1144–1153. [Google Scholar] [CrossRef]
- Huang, J.; Chen, T.; Huang, D.Q.; Xu, T.Z. Study on the Effect of Pulse Waveform Parameters on Droplet Transition, Dynamic Behavior of Weld Pool, and Weld Microstructure in P-GMAW. Metals 2023, 13, 199. [Google Scholar] [CrossRef]
Figure 1.
Schematic diagram of droplet transfer in TP and STP modes: (a) TP mode; (b) STP mode.

Figure 2.
Sampling scheme showing the locations from which the samples were extracted for the microstructural examination, microhardness measurements, and tensile testing.
Figure 2.
Sampling scheme showing the locations from which the samples were extracted for the microstructural examination, microhardness measurements, and tensile testing.

Figure 3.
Scheme showing the appearance and dimensions of the proportional tensile test specimens used in the present study.
Figure 3.
Scheme showing the appearance and dimensions of the proportional tensile test specimens used in the present study.

Figure 4.
Macromorphology of the sample surfaces showing (a) the weld seam appearance of the first four layers obtained using the STP mode and (b) the appearance of a 30-layer thin-walled structure using the STP (upper) and TP (lower) modes.
Figure 4.
Macromorphology of the sample surfaces showing (a) the weld seam appearance of the first four layers obtained using the STP mode and (b) the appearance of a 30-layer thin-walled structure using the STP (upper) and TP (lower) modes.

Figure 5.
XRD patterns taken from samples extracted in different regions of the thin-walled structures produced by the (a) STP mode and (b) TP mode.
Figure 5.
XRD patterns taken from samples extracted in different regions of the thin-walled structures produced by the (a) STP mode and (b) TP mode.

Figure 6.
The results of the EBSD analysis: (a) inverse pole figure map derived from STP samples; (b) inverse pole figure map derived from TP samples; (c) grain size distribution in STP samples; (d) grain size distribution in TP samples; (e) PF of STP; (f) PF of TP.
Figure 6.
The results of the EBSD analysis: (a) inverse pole figure map derived from STP samples; (b) inverse pole figure map derived from TP samples; (c) grain size distribution in STP samples; (d) grain size distribution in TP samples; (e) PF of STP; (f) PF of TP.


Figure 7.
Hardness distribution of the STP and TP samples.

Figure 8.
Stress–strain curves of the STP and TP samples.
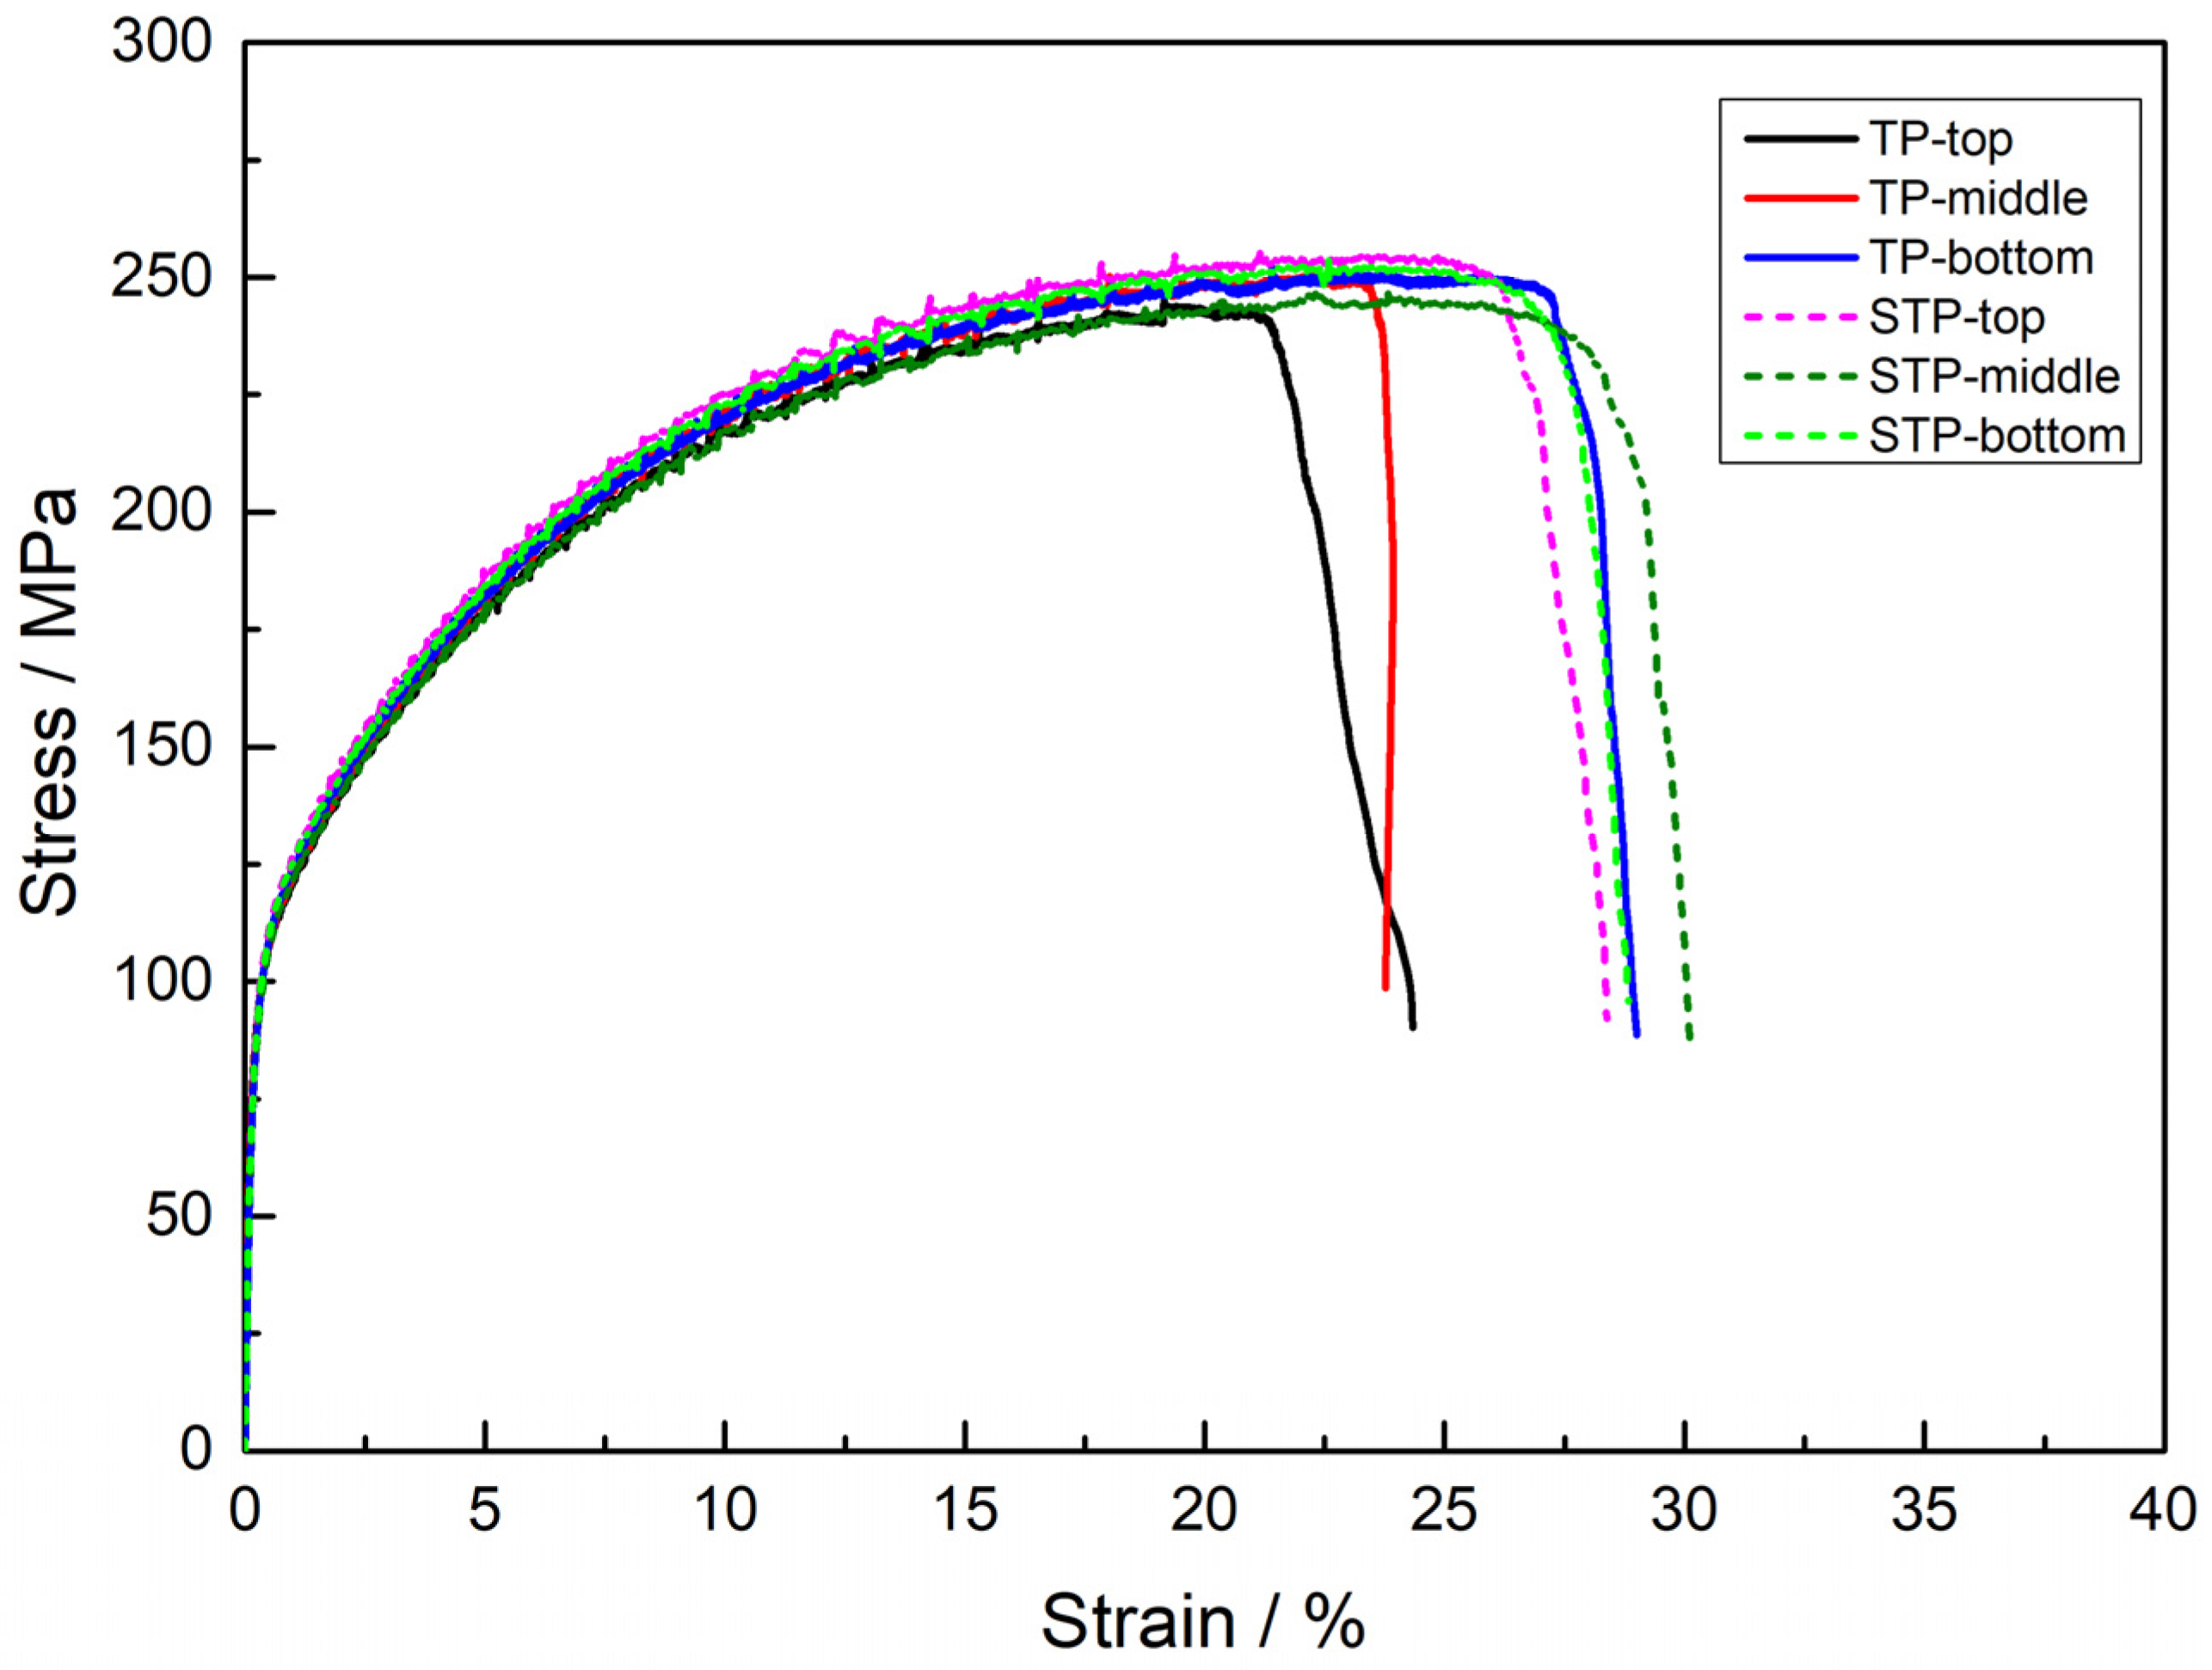
Figure 9.
Typical morphologies of the fractured surfaces of the tensile test specimens produced using the (a) STP mode and (b) TP mode.
Figure 9.
Typical morphologies of the fractured surfaces of the tensile test specimens produced using the (a) STP mode and (b) TP mode.


Table 1.
Chemical composition of 6061-T6 aluminum alloy and 5356 wire (wt%).
| Elements | Si | Mg | Fe | Cu | Mn | Cr | Ti | Zn | Al |
|---|---|---|---|---|---|---|---|---|---|
| 6061-T6 | 0.4–0.8 | 0.8–1.2 | 0.7 | 0.04–0.35 | 0.05–0.20 | 0.04–0.35 | 0.15 | 0.25 | Bal |
| 5356 | 0.066 | 3.63 | 0.13 | 0.02 | 0.081 | 0.061 | 0.12 | 0.02 | Bal |
Table 2.
Tensile properties derived from tensile curves depicted in Figure 8.
Table 2.
Tensile properties derived from tensile curves depicted in Figure 8.
| Sample | Position | Tensile Strength/MPa | Yield Strength/MPa | Elongation/% |
|---|---|---|---|---|
| STP | Top | 248.8 | 122.5 | 26.9 |
| Middle | 250.6 | 124.5 | 29.2 | |
| Bottom | 251.2 | 118.7 | 27.6 | |
| TP | Top | 243.1 | 116.4 | 22.2 |
| Middle | 247.5 | 118.9 | 24.7 | |
| Bottom | 251.4 | 117.8 | 27.5 |
Disclaimer/Publisher’s Note: The statements, opinions and data contained in all publications are solely those of the individual author(s) and contributor(s) and not of MDPI and/or the editor(s). MDPI and/or the editor(s) disclaim responsibility for any injury to people or property resulting from any ideas, methods, instructions or products referred to in the content. |
© 2024 by the authors. Licensee MDPI, Basel, Switzerland. This article is an open access article distributed under the terms and conditions of the Creative Commons Attribution (CC BY) license (https://creativecommons.org/licenses/by/4.0/).
Share and Cite
MDPI and ACS Style
Zhu, Q.; Yao, P.; Li, H. Comparison of STP and TP Modes of Wire and Arc Additive Manufacturing of Aluminum–Magnesium Alloys: Forming, Microstructures and Mechanical Properties. Metals 2024, 14, 549. https://doi.org/10.3390/met14050549
AMA Style
Zhu Q, Yao P, Li H. Comparison of STP and TP Modes of Wire and Arc Additive Manufacturing of Aluminum–Magnesium Alloys: Forming, Microstructures and Mechanical Properties. Metals. 2024; 14(5):549. https://doi.org/10.3390/met14050549
Chicago/Turabian StyleZhu, Qiang, Ping Yao, and Huan Li. 2024. "Comparison of STP and TP Modes of Wire and Arc Additive Manufacturing of Aluminum–Magnesium Alloys: Forming, Microstructures and Mechanical Properties" Metals 14, no. 5: 549. https://doi.org/10.3390/met14050549
Note that from the first issue of 2016, this journal uses article numbers instead of page numbers. See further details here.